Investigating the Impacts of Landuse-landcover (LULC) Change in the Pearl River Delta Region on Water Quality in the Pearl River Estuary and Hong Kong’s Coast


Abstract
:1. Introduction
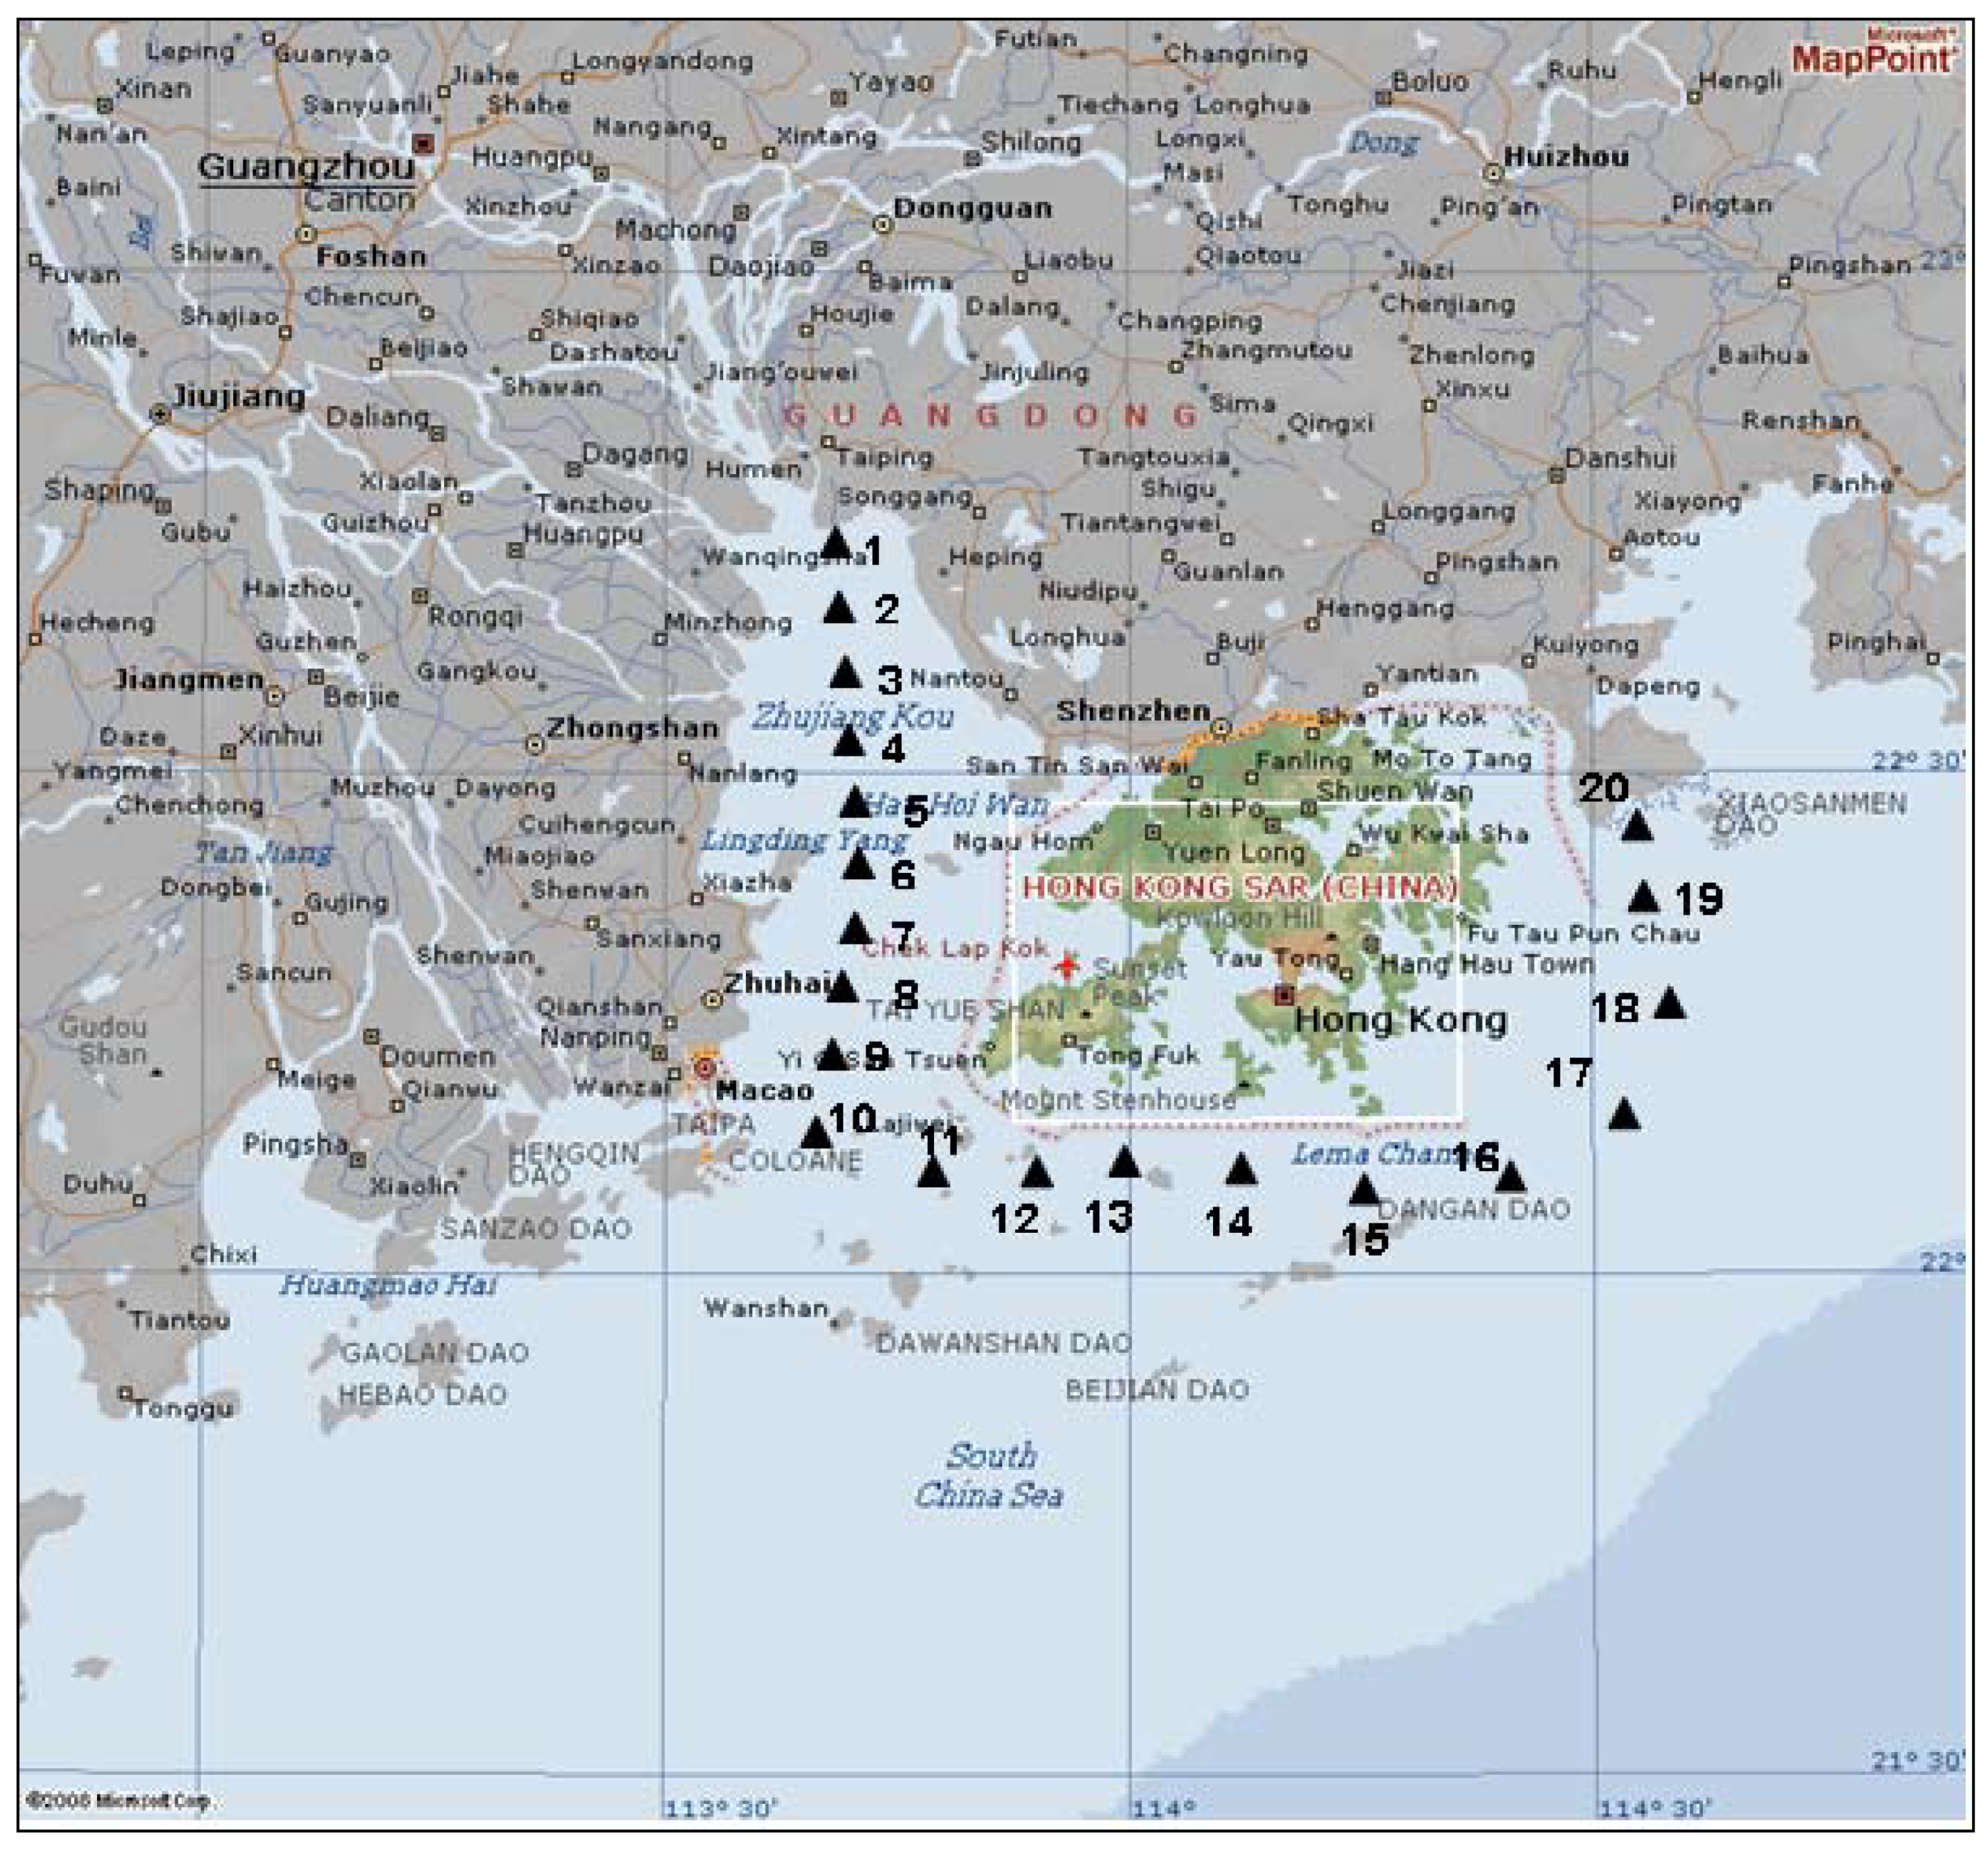
2. Study Area


3. Data Collection and In Situ Measurements
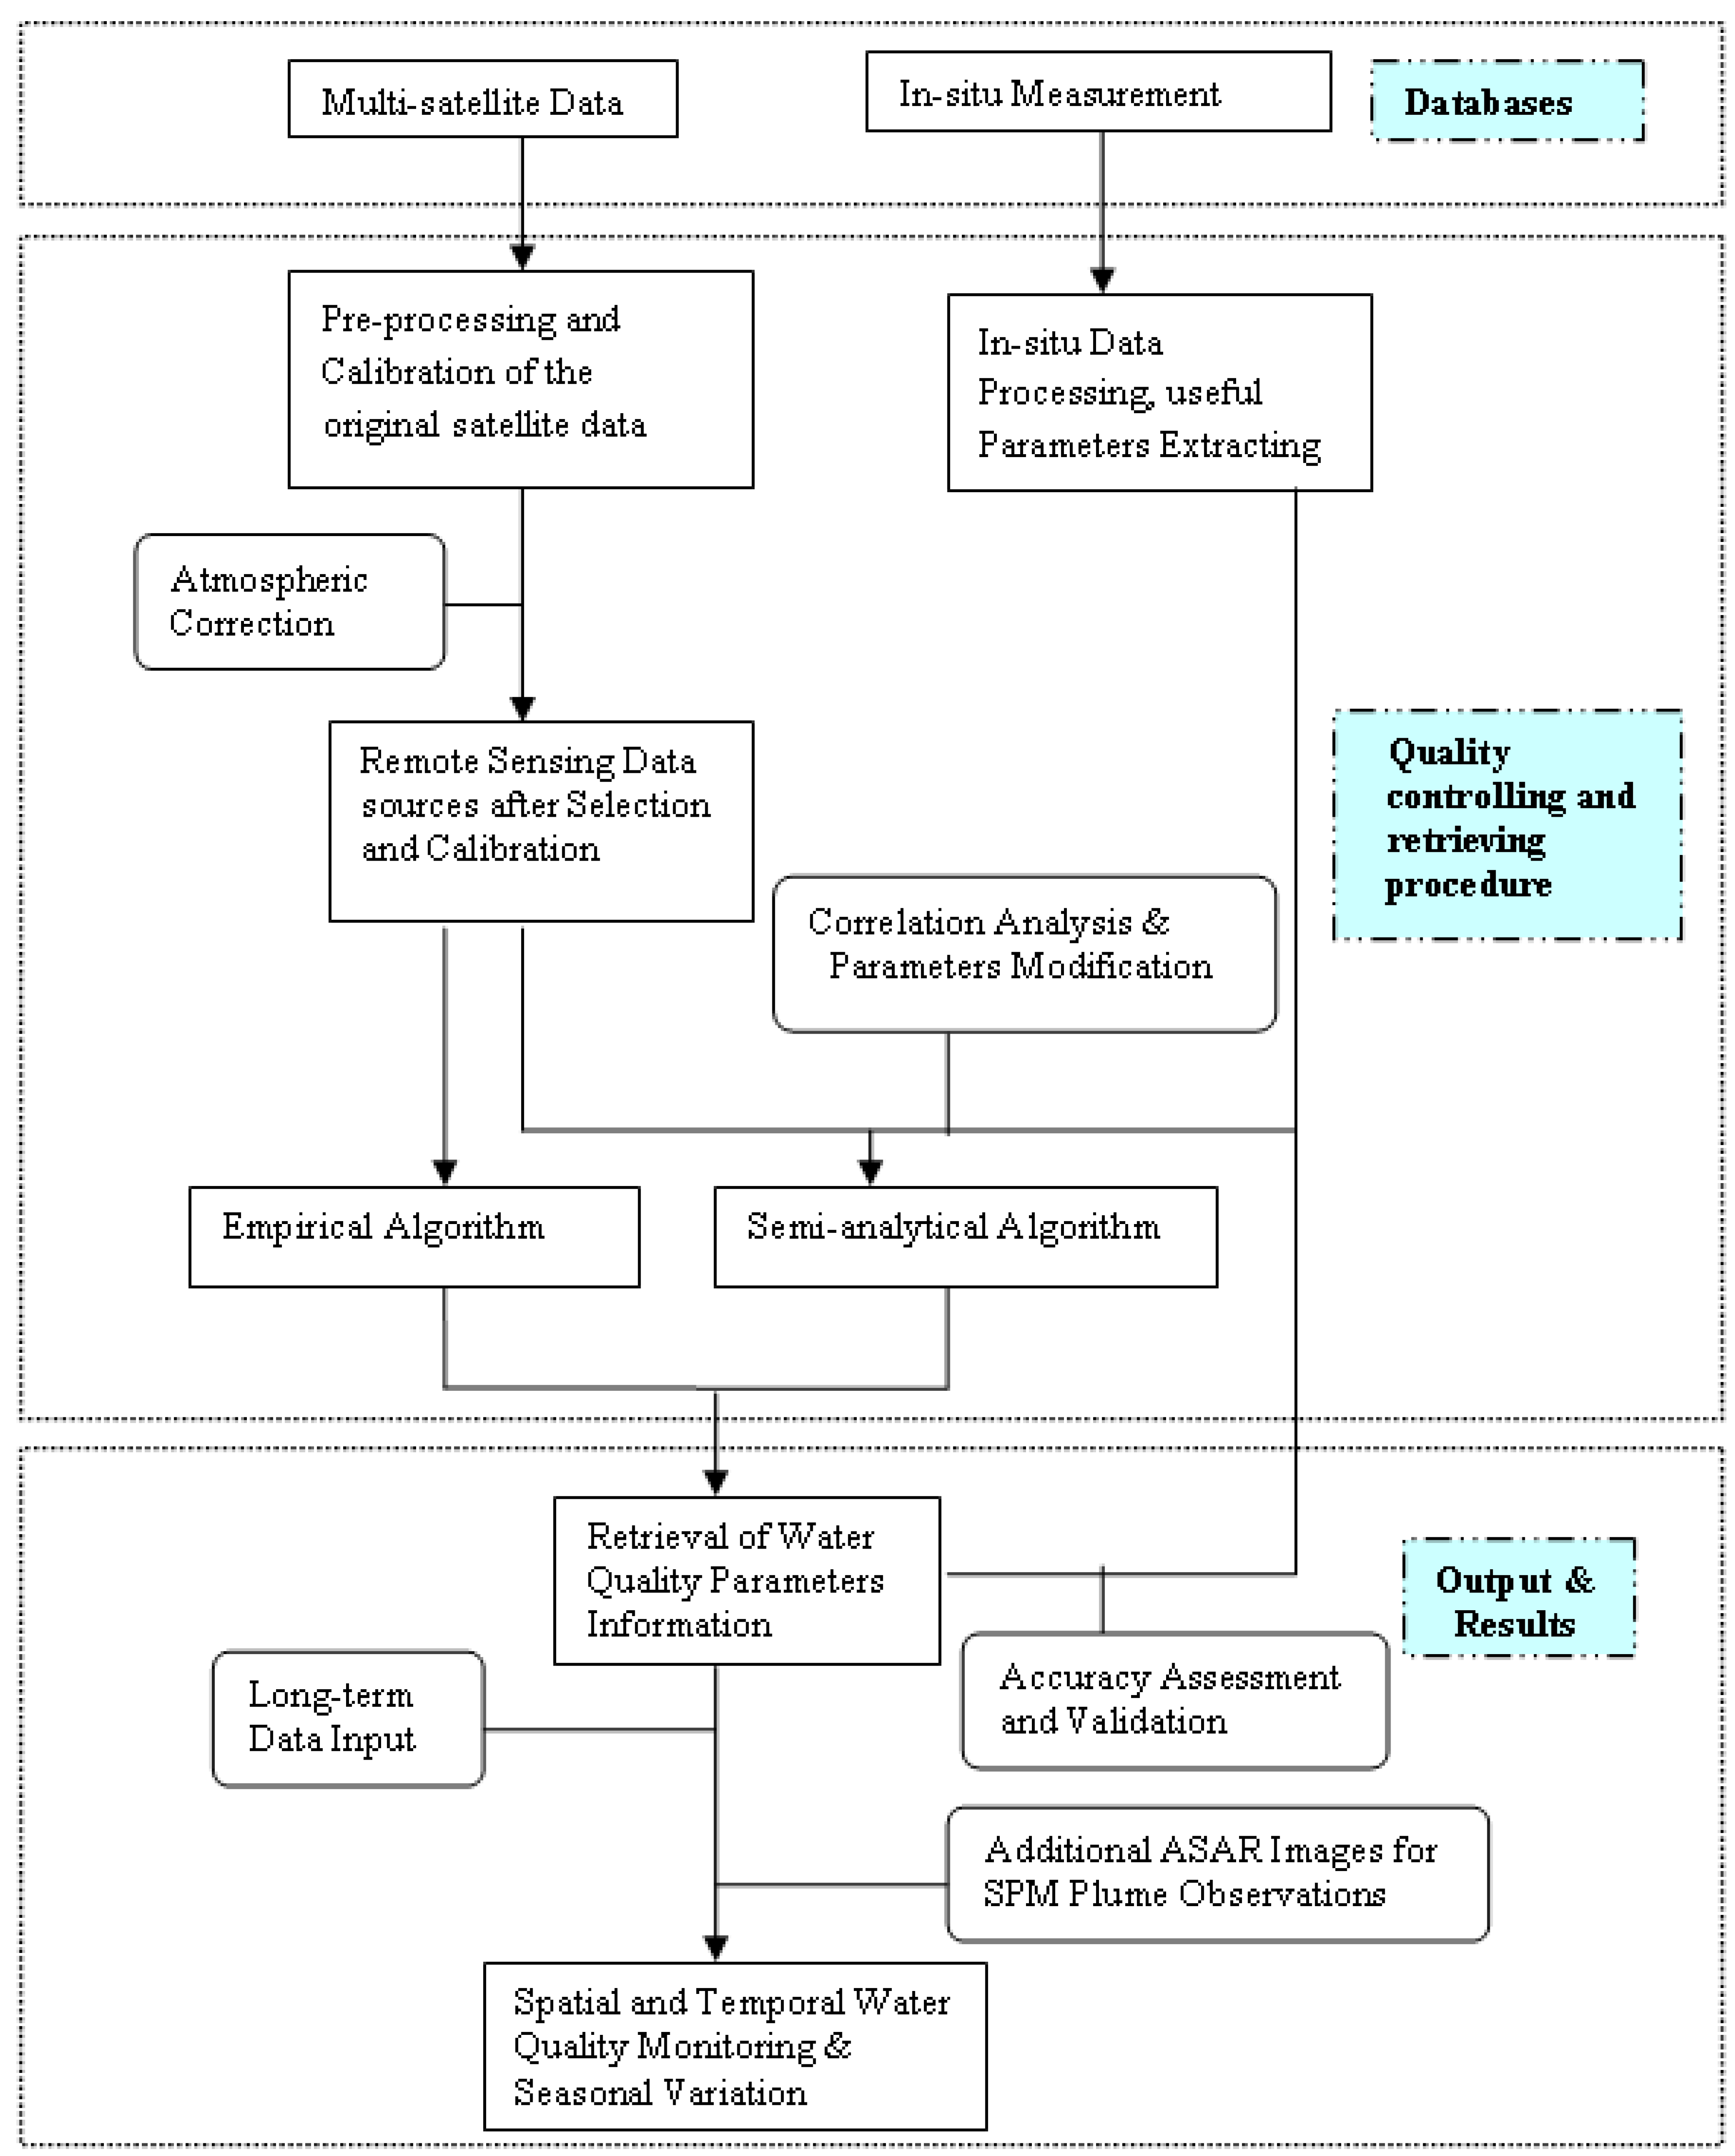
4. Methods
4.1. Retrieval of Suspended Particulate Matter (SPM) Concentrations
4.2. Retrieval of Chlorophyll-a (Chl-a) Concentrations
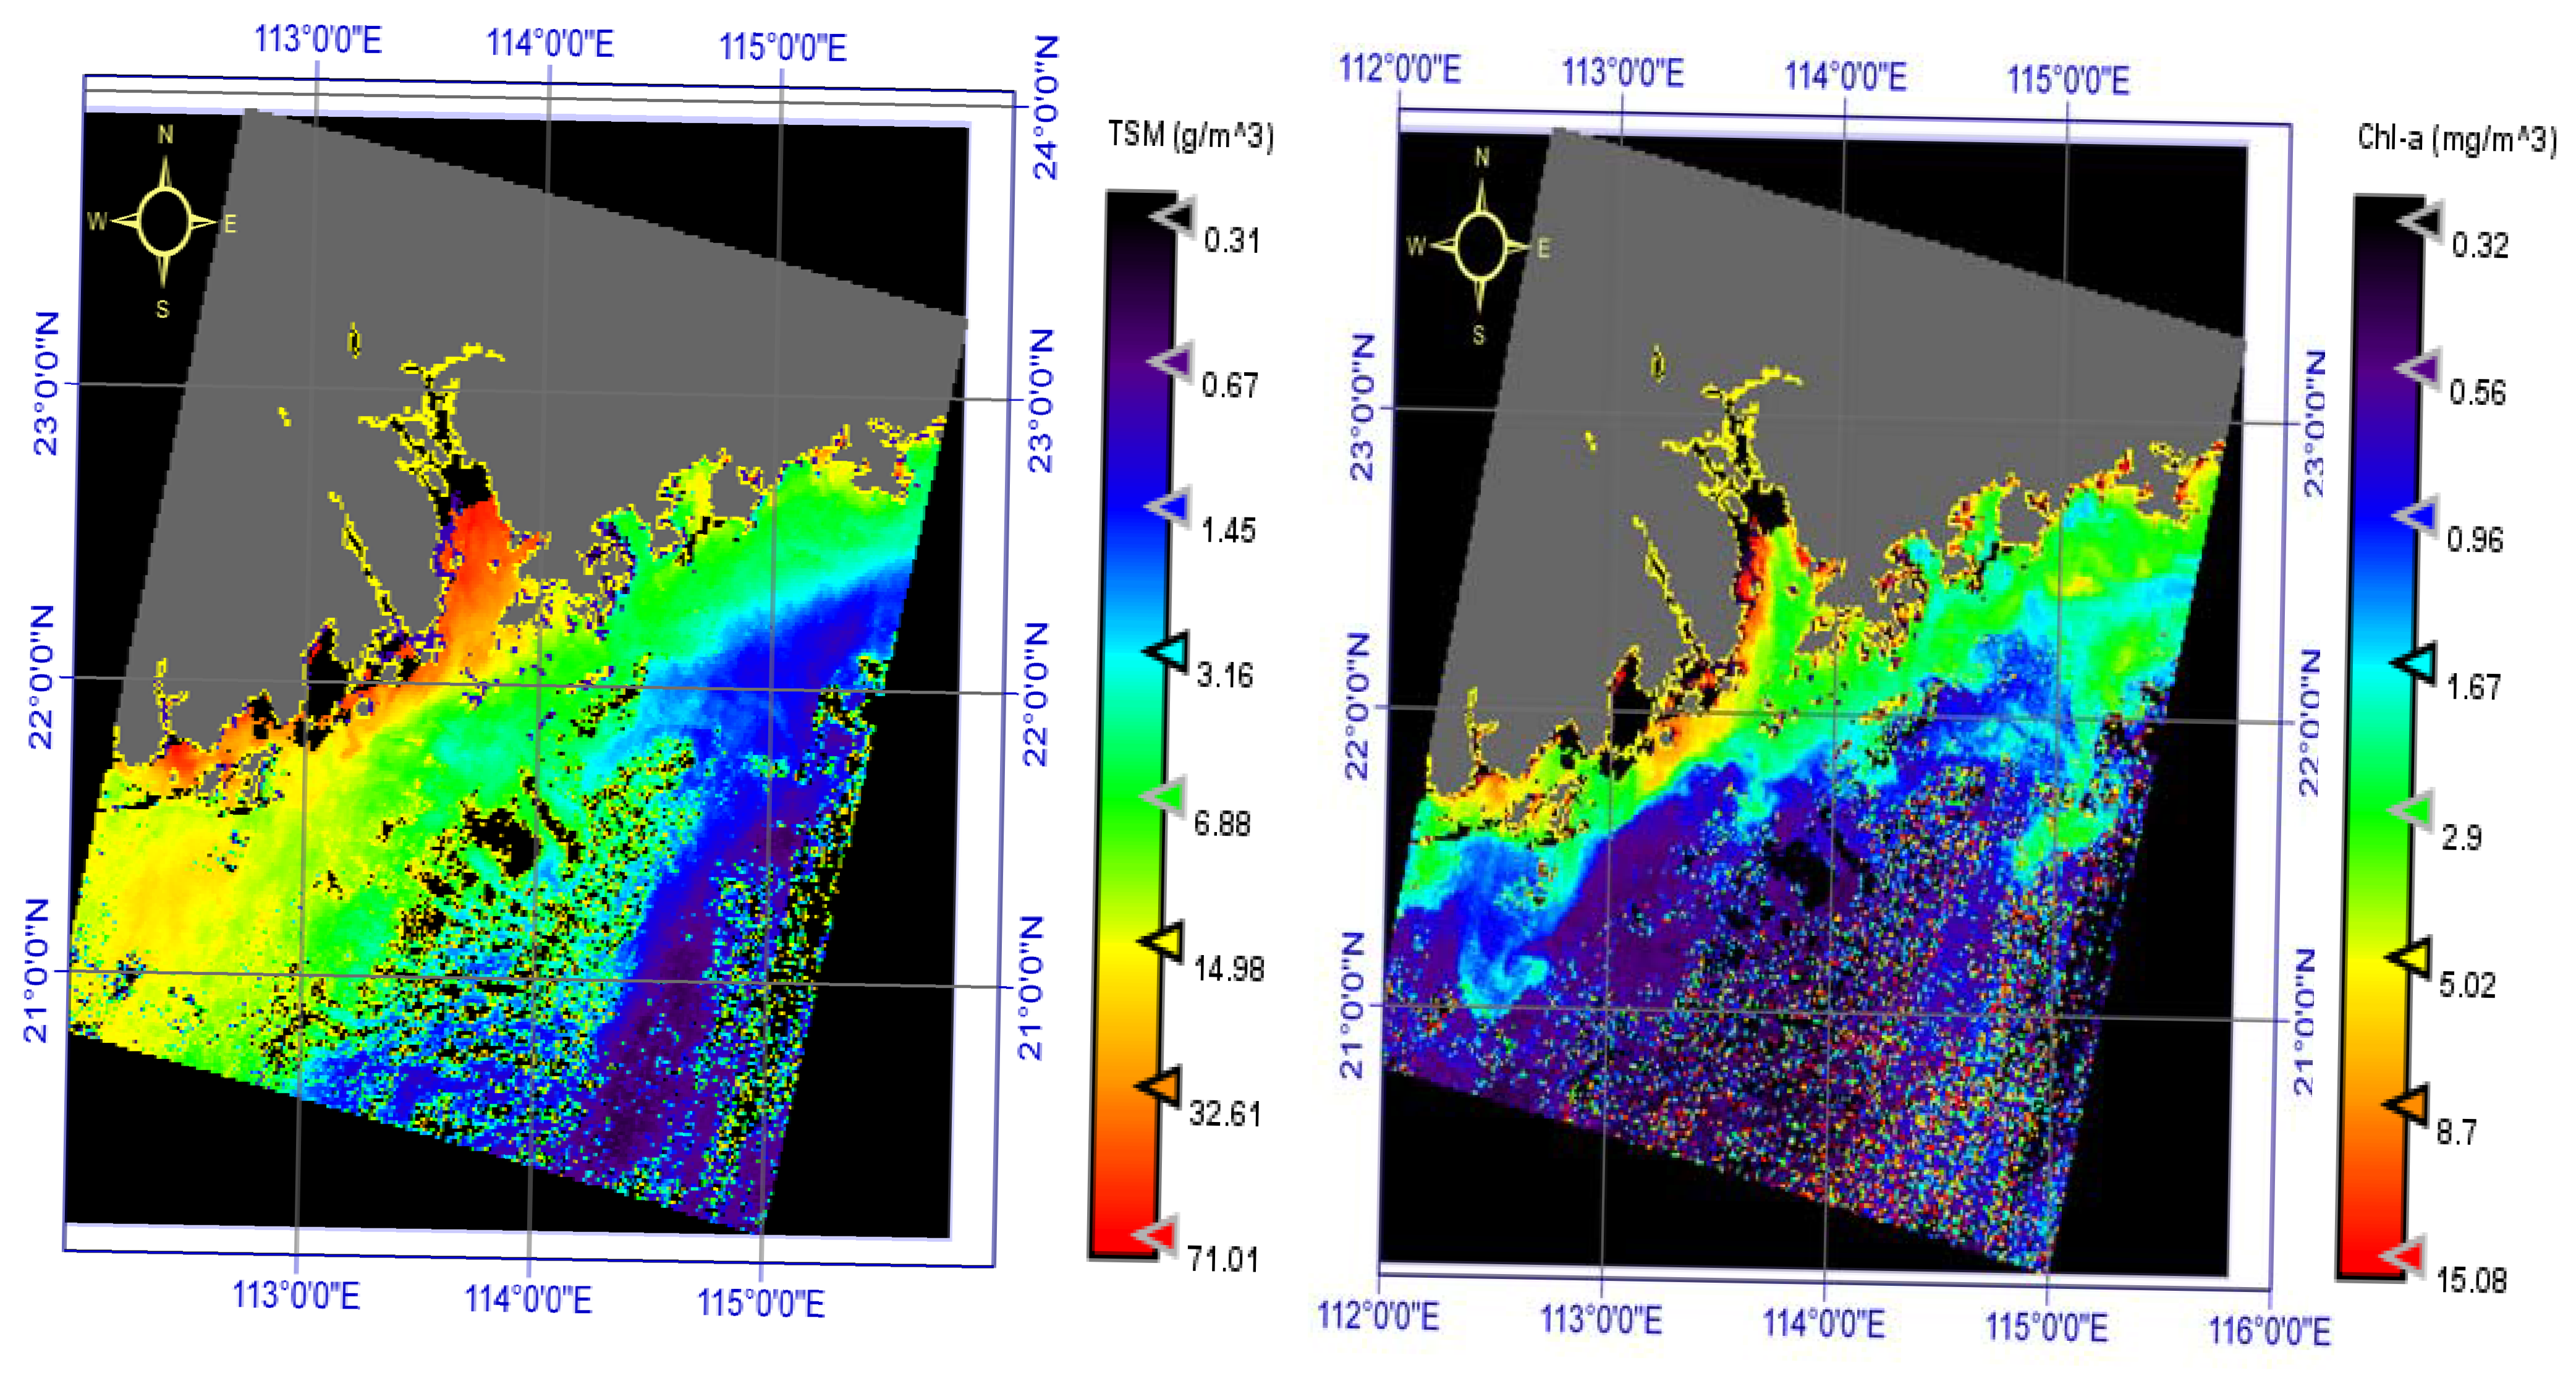
5. Preliminary Results
6. Future Tasks
6.1. Additional Use of Radar Images
6.2. Accuracy Assessment and Error Analysis
6.3. LULC Trends Analysis
6.4. Impacts of LULC Trends on PRE Sediments
Acknowledgements
References
- Klemas, V.; Bartlett, D.; Philpot, W.; Roger, R. Coastal and estuarine studies with ERTS-1 and Skylab. Remote Sens. Environ. 1974, 3, 153–177. [Google Scholar] [CrossRef]
- Strong, A.E. Remote sensing of algal blooms by aircraft and satellite in Lake Erie and Utah Lake. Remote Sens. Environ. 1974, 3, 99–107. [Google Scholar] [CrossRef]
- Lindell, T.; Pierson, D.; Premazzi, G.; Zilioli, E. Manual for Monitoring European Lakes Using Remote Sensing Techniques; EUR 18665 EN; Official Publications of the European Communities: Luxembourg, Luxembourg, 1999. [Google Scholar]
- Zhang, Y.; Pulliainen, J.; Koponen, S.; Hallikainen, M. Application of an empirical neural network to surface water quality estimation in the Gulf of Finland using combined optical data and microwave data. Remote Sens. Environ. 2002, 81, 327–336. [Google Scholar] [CrossRef]
- Wang, M.H.; Tang, J.; Shi, W. MODIS-derived ocean color products along the China east coastal region. Geophys. Res. Lett. 2007, 34, 1–5. [Google Scholar] [CrossRef]
- IOCCG (2000). Remote Sensing of Ocean Colour in Coastal, and Other Optically-Complex, Waters; Sathyendranath, S., Ed.; Reports of the International Ocean-Colour Coordinating Group, No.3; IOCCG: Dartmouth, Canada, 2000. [Google Scholar]
- Brando, V.E.; Dekker, A.G. Satellite hyperspectral remote sensing for estimating estuarine and coastal water quality. IEEE Trans. Geosci. Remote Sens. 2003, 41, 1378–1387. [Google Scholar] [CrossRef]
- Lohrenz, S.E.; Cai, W.J.; Chen, X.G.; Tuel, M. Satellite assessment of bio-optical properties of northern Gulf of Mexico coastal waters following hurricanes Katrina and Rita. Sensors 2008, 8, 4135–4150. [Google Scholar] [CrossRef]
- D’Sa, E.J.; Miller, R.; Del Castillo, C. Bio-optical properties and ocean color algorithms for coastal waters influenced by the Mississippi River during a cold front. Appl. Opt. 2006, 45, 7410–7428. [Google Scholar] [CrossRef] [PubMed]
- D’Sa, E.J.; Miller, R.; McKee, B. Suspended particulate matter dynamics in coastal waters from ocean color: Application to the northern Gulf of Mexico. Geophys. Res. Lett. 2007, 34, 1–6. [Google Scholar] [CrossRef]
- Walker, N.D.; Hammack, A.B. Impacts of winter storms on circulation and sediment transport: Atchafalaya-Vermillion Bay Region, Lousiana, USA. J. Coastal Res. 2000, 16, 996–1010. [Google Scholar]
- Ruiz, A.; Franco, J.; Orive, E. Suspended particulate matter dynamics in the shallow mesotidal Urdaibai Estuary (Bay of Biscay, Spain). Netherlands J. Aquatic Geol. 1994, 28, 309–316. [Google Scholar] [CrossRef]
- Gitelson, A.; Schalles, J.; Hladik, C. Remote chlorophyll-a retrieval in turbid, productive estuaries: Chesapeake Bay case study. Remote Sens. Environ. 2007, 109, 464–472. [Google Scholar] [CrossRef]
- Yang, J.; Chen, C. An optimal algorithm for retrieval of chlorophyll, suspended sediments and gelbstoff of case 2 waters in Zhujiang River estuary. J. Trop. Oceanogr. 2007, 26, 15–20. [Google Scholar]
- Chen, X.; Chen, Y.; Lai, G. Modelinig of the transport of suspended solids in the Estuary of Zhujiang River. Acta Oceanol. Sini. 2003, 25, 120–127. [Google Scholar]
- Zhu, X.; He, Z.; Meng, D. Remote sensing monitoring of ocean colour in Pearl River estuary. Int. J. Remote Sens. 2002, 23, 4487–4497. [Google Scholar] [CrossRef]
- Chen, X.; Yuan, Z.; Li, Y.; Wei, Y. Spatial and temporal dynamics of suspended sediment concentration in the Pearl River Estuary based on remote sensing. Geomatics Info. Sci. Wuhan Univ. 2005, 30, 677–681. [Google Scholar]
- Chen, C.Q.; Tang, S.; Pan, Z.; Zhan, H.; Larson, M.; Jonsson, L. Remotely sensed assessment of water quality levels in the Pearl River Estuary, China. Mar. Pollut. Bull. 2007, 54, 1267–1272. [Google Scholar] [CrossRef] [PubMed]
- Yin, K.; Qian, P.; Chen, J.; Hsieh, D.; Harrison, P. Dynamics of nutrients and phytoplankton biomass in the Pearl River estuary and adjacent waters of Hong Kong during summer: preliminary evidence for phosphorus and silicon limitation. Mari. Ecol. Progr. Series 2000, 194, 295–305. [Google Scholar] [CrossRef]
- Yin, K.; Lin, Z.; Ke, Z. Temporal and spatial distribution of dissolved oxygen in the pearl river estuary and adjacent coastal waters. Cont. Shelf Res. 2004, 24, 1935–1948. [Google Scholar] [CrossRef]
- Dong, L.; Su, J.; Wong, L.; Cao, Z.; Chen, J. Seasonal variation and dynamics of the Pearl River plumes. Conti. Shelf Res. 2004, 24, 1761–1777. [Google Scholar] [CrossRef]
- Yin, K.; Harrison, P. Influence of the Pearl River estuary and vertical mixing in Victoria Harbor on water quality in relation to eutrophication impacts in Hong Kong waters. Mar. Pollut. Bull. 2007, 54, 646–656. [Google Scholar] [CrossRef] [PubMed]
- Gordon, H.R.; Brown, O.B.; Evans, R.H.; Brown, J.; Smith, R.; Baker, K.; Clark, D. A semianalytic radiance model of ocean color. J. Geophys. Res. 1988, 93, 10909–10924. [Google Scholar] [CrossRef]
- Gitelson, A.; Dall’Olmo, G.; Moses, W.; Rundquist, D.; Barrow, T.; Fisher, T.; Gurlin, D.; Holz, J. A simple semi-analytical model for remote estimation of chloropholl-a in turbid waters: Validation. Remote Sens. Environ. 2008, 112, 3582–3593. [Google Scholar] [CrossRef]
- Huang, B.; Zhang, L.; Wu, B. Spatio-temporal analysis of rural-urban land conversion. Int. J. Geo. Info. Sci. 2008, in press. [Google Scholar]
© 2009 by the authors; licensee Molecular Diversity Preservation International, Basel, Switzerland. This article is an open-access article distributed under the terms and conditions of the Creative Commons Attribution license (http://creativecommons.org/licenses/by/3.0/).
Share and Cite
Zhang, Y.; Wang, Y.; Wang, Y.; Xi, H. Investigating the Impacts of Landuse-landcover (LULC) Change in the Pearl River Delta Region on Water Quality in the Pearl River Estuary and Hong Kong’s Coast. Remote Sens. 2009, 1, 1055-1064. https://doi.org/10.3390/rs1041055
Zhang Y, Wang Y, Wang Y, Xi H. Investigating the Impacts of Landuse-landcover (LULC) Change in the Pearl River Delta Region on Water Quality in the Pearl River Estuary and Hong Kong’s Coast. Remote Sensing. 2009; 1(4):1055-1064. https://doi.org/10.3390/rs1041055
Chicago/Turabian StyleZhang, Yuanzhi, Yufei Wang, Yunpeng Wang, and Hongyan Xi. 2009. "Investigating the Impacts of Landuse-landcover (LULC) Change in the Pearl River Delta Region on Water Quality in the Pearl River Estuary and Hong Kong’s Coast" Remote Sensing 1, no. 4: 1055-1064. https://doi.org/10.3390/rs1041055