Article

Automatic Ship Detection in Remote Sensing Images from Google Earth of Complex Scenes Based on Multiscale Rotation Dense Feature Pyramid Networks

1
Key Laboratory of Technology in Geo-spatial Information Processing and Application System, Institute of Electronics, Chinese Academy of Sciences, Beijing 100190, China
2
School of Electronic, Electrical and Communication Engineering, University of Chinese Academy of Sciences, Beijing 100049, China
*
Author to whom correspondence should be addressed.
Remote Sens. 2018, 10(1), 132; https://doi.org/10.3390/rs10010132
Submission received: 1 December 2017 / Revised: 13 January 2018 / Accepted: 16 January 2018 / Published: 18 January 2018
(This article belongs to the Special Issue Deep Learning for Remote Sensing)

Abstract

:
Ship detection has been playing a significant role in the field of remote sensing for a long time, but it is still full of challenges. The main limitations of traditional ship detection methods usually lie in the complexity of application scenarios, the difficulty of intensive object detection, and the redundancy of the detection region. In order to solve these problems above, we propose a framework called Rotation Dense Feature Pyramid Networks (R-DFPN) which can effectively detect ships in different scenes including ocean and port. Specifically, we put forward the Dense Feature Pyramid Network (DFPN), which is aimed at solving problems resulting from the narrow width of the ship. Compared with previous multiscale detectors such as Feature Pyramid Network (FPN), DFPN builds high-level semantic feature-maps for all scales by means of dense connections, through which feature propagation is enhanced and feature reuse is encouraged. Additionally, in the case of ship rotation and dense arrangement, we design a rotation anchor strategy to predict the minimum circumscribed rectangle of the object so as to reduce the redundant detection region and improve the recall. Furthermore, we also propose multiscale region of interest (ROI) Align for the purpose of maintaining the completeness of the semantic and spatial information. Experiments based on remote sensing images from Google Earth for ship detection show that our detection method based on R-DFPN representation has state-of-the-art performance.

Graphical Abstract

1. Introduction

With the development of remote sensing technology, more and more attention has been paid to the research of remote sensing images. Ship detection has been playing an important role in the field of remote sensing for a long time and can promote national defense construction, port management, cargo transportation, and maritime rescue. Although many ship detection methods have been proposed before, this task still poses a great challenge due to the existence of uncertainties such as light, disruptors, density of the ship, and so on.
In the past few years, some traditional methods have been proposed for ship detection [1,2,3,4,5]. Some methods adopt the following ideas: Firstly, sea–land segmentation is carried out through the features of texture and shape, and the sea region is extracted as the region of interest (ROI). Then, an algorithm such as the contrast box algorithm [6] or semisupervised hierarchical classification [7] is used to get the candidate object region. Finally, the false box is filtered in postprocessing to get the final detection results. Bi F et al. [8] used a bottom-up visual attention mechanism to select prominent candidate regions throughout the detection scene. Although these methods have shown promising performance, they have poor practicability in complex scenarios.
With the application of deep convolutional neural networks (CNNs) [9,10,11,12,13,14] in object detection, more and more efficient detection algorithms have been proposed, such as region proposals with convolution neural networks (RCNN) [15], Spatial Pyramid Pooling Network (SSP-Net) [16], and Fast-RCNN [17]. Faster-RCNN [18] proposes a Region Proposal Network (RPN) structure and improves the detection efficiency while achieving end-to-end training. Instead of relying on regional proposals, You Only Look Once (YOLO) [19] and Single Shot MultiBox Detector (SSD) [20] directly estimate the object region and truly enable real-time detection. Feature Pyramid Network (FPN) [21] adopts the multiscale feature pyramid form and makes full use of the feature map to achieve better detection results. Region-based Fully Convolutional Networks (R-FCN) [22] builds a fully convolutional network, which greatly reduces the number of parameters, improves the detection speed, and has a good detection effect.
The visual detection algorithms above are also widely used in remote sensing ship detection. Zhang R et al. [23] proposed a new method of ship detection based on a convolution neural network (SCNN), combined with an improved saliency detection method. Kang M et al. [24] took the object proposals generated by Faster R-CNN for the guard windows of the CFAR algorithm, then picked up the small-sized targets, thus reevaluating the bounding boxes which have relatively low classification scores in the detection network. Liu Y et al. [25] presented a framework for a Sea–Land Segmentation-based Convolutional Neural Network (SLS-CNN) for ship detection that attempts to combine the SLS-CNN detector, saliency computation, and corner features. The methods above are known as horizontal region detection. However, in real life, for a ship with a large aspect ratio, once the angle is inclined, the redundancy region will be relatively large, and it is unfavorable to the operation of non-maximum suppression, often resulting in missed detection as shown in Figure 1. In order to solve the same problem, Jiang Y et al. [26] proposed the Rotational Region CNN (R2CNN) and achieved outstanding results on scene text detection. However, since R2CNN still uses horizontal anchors at the first stage, the negative effects of non-maximum suppression still exist. RRPN [27] uses rotation anchors which effectively improve the quality of the proposal. However, it has a serious problem of information loss when processing the ROI, resulting in a much lower detection indicator than the R2CNN.
This paper presents an end-to-end detection framework called Rotation Dense Feature Pyramid Networks (R-DFPN) to solve the problems above. The framework is based on a multiscale detection network [28,29,30], using a dense feature pyramid network, rotation anchors, multiscale ROI Align, and other structures. Compared with other rotation region detection methods such as RRPN [27] and R2CNN [26], our framework is more suitable for ship detection tasks, and has achieved state-of-the-art performance. The main contributions of this paper are as follows:
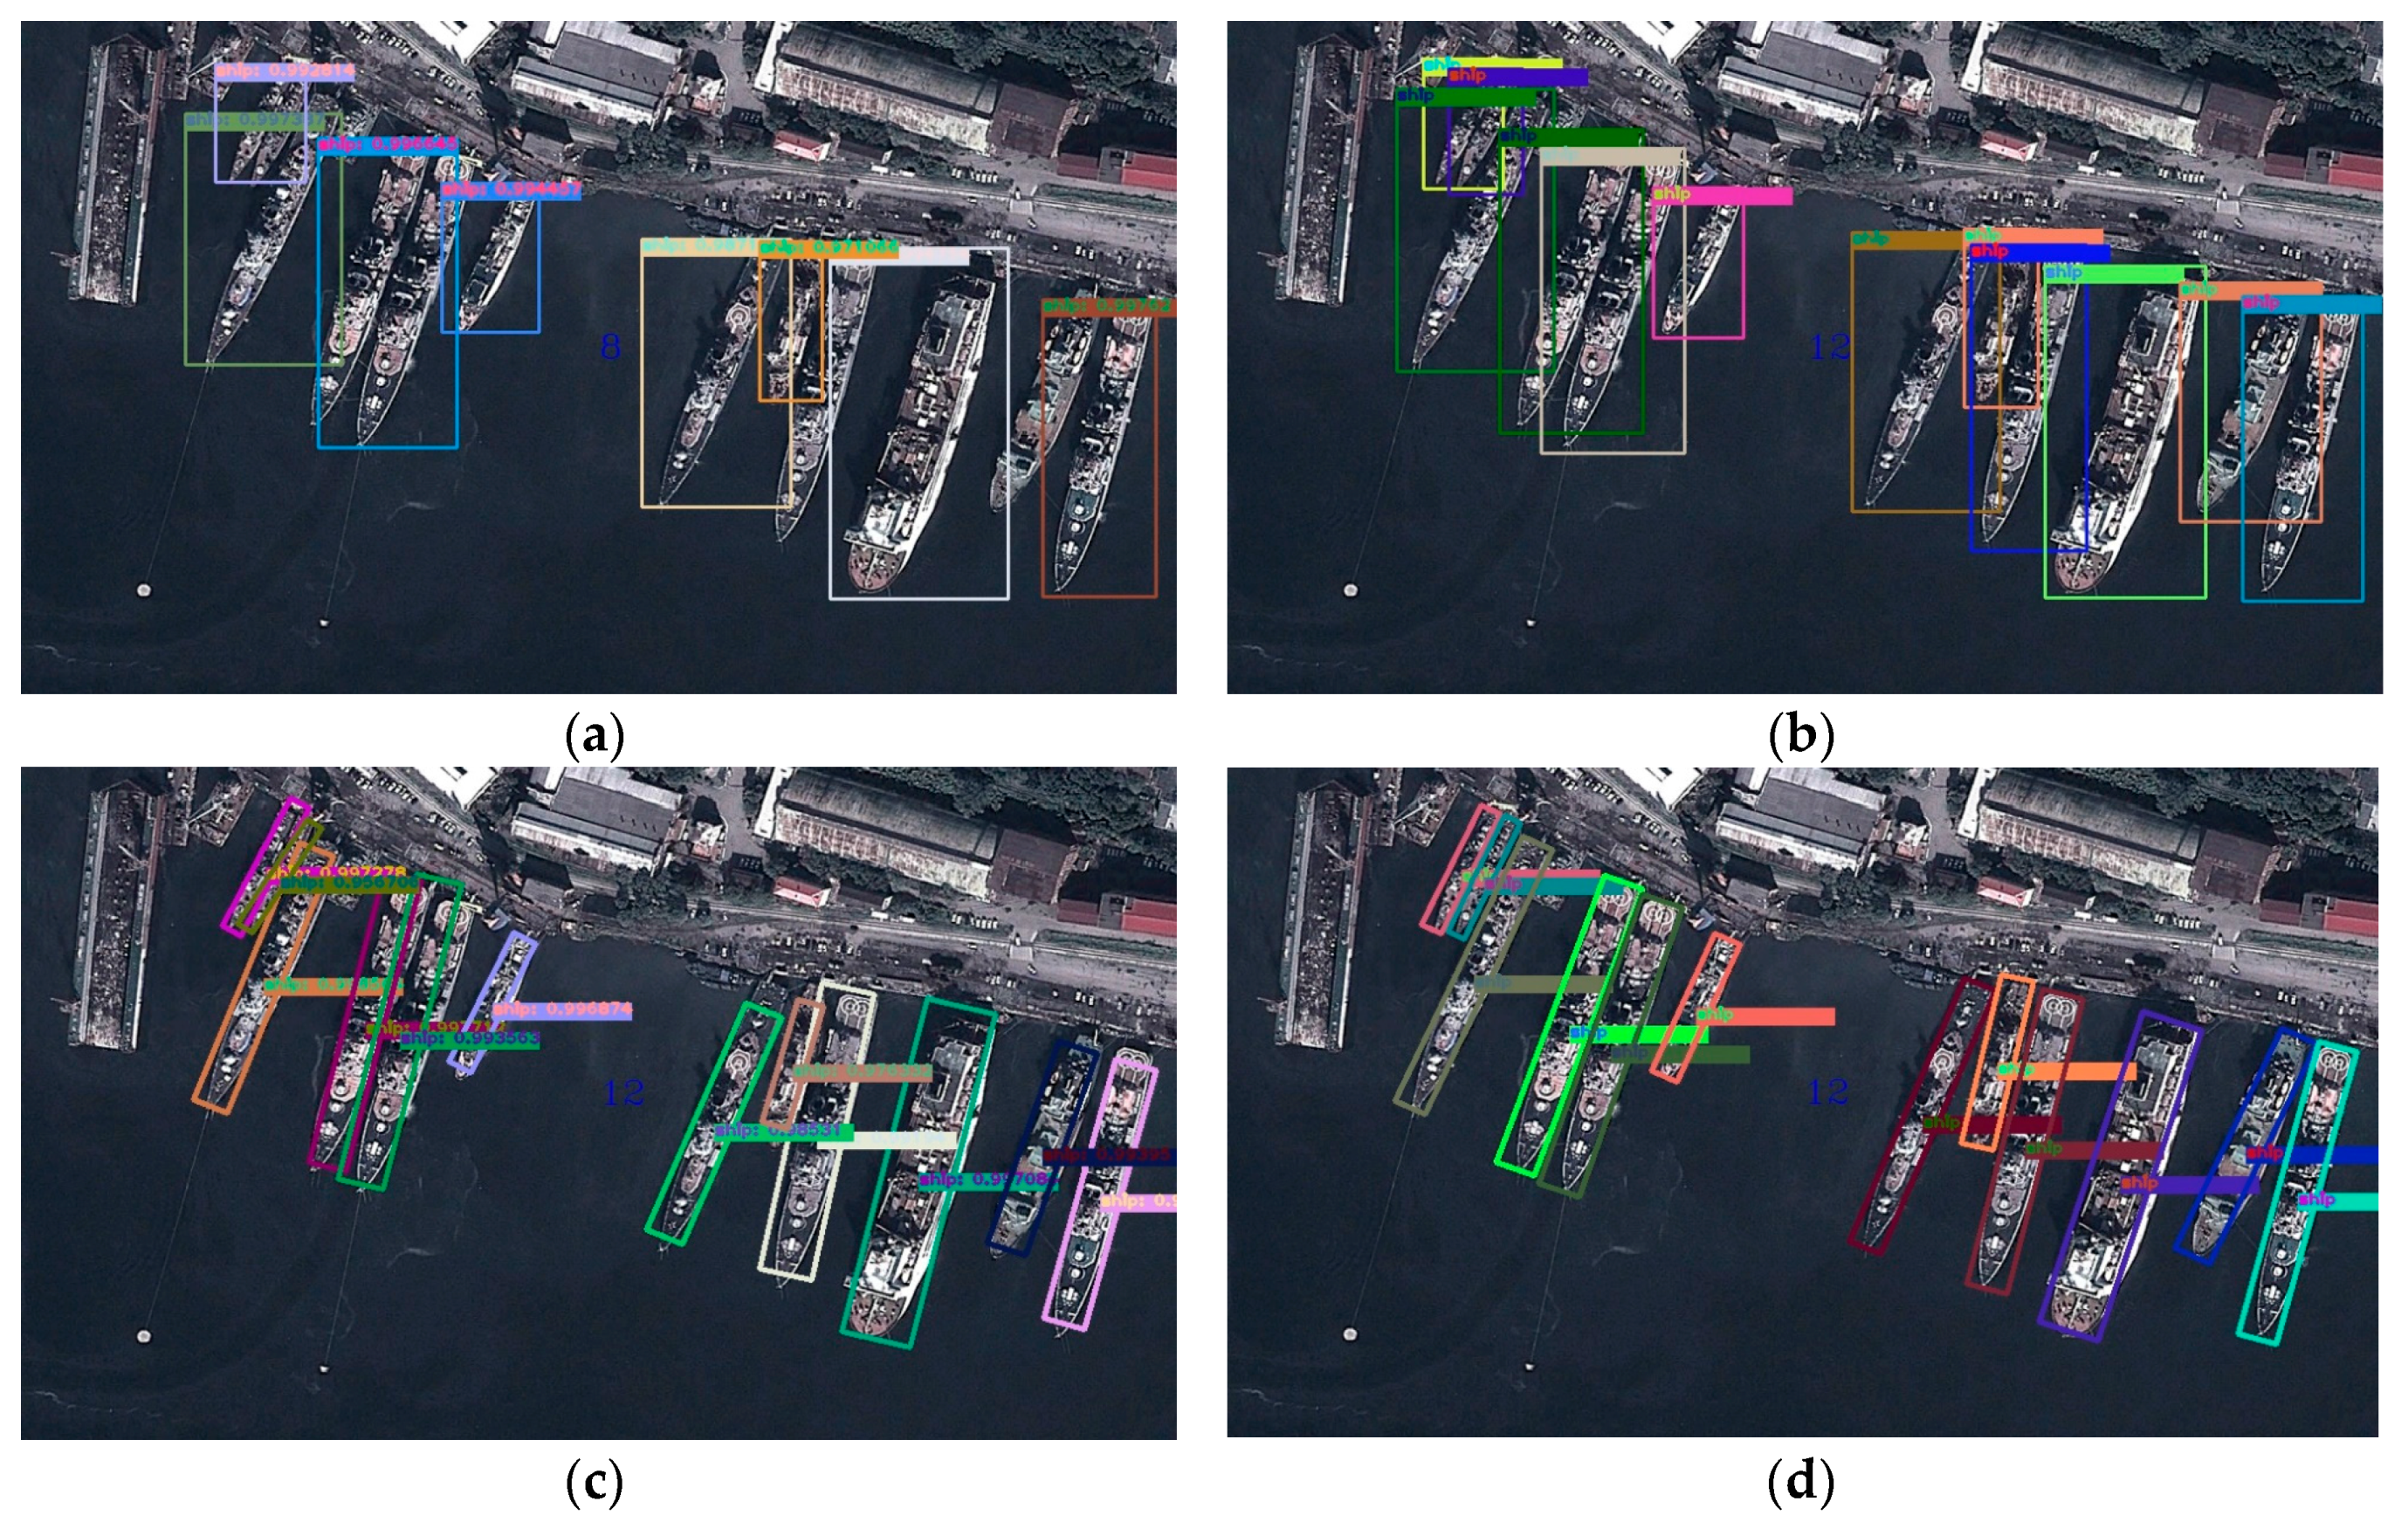
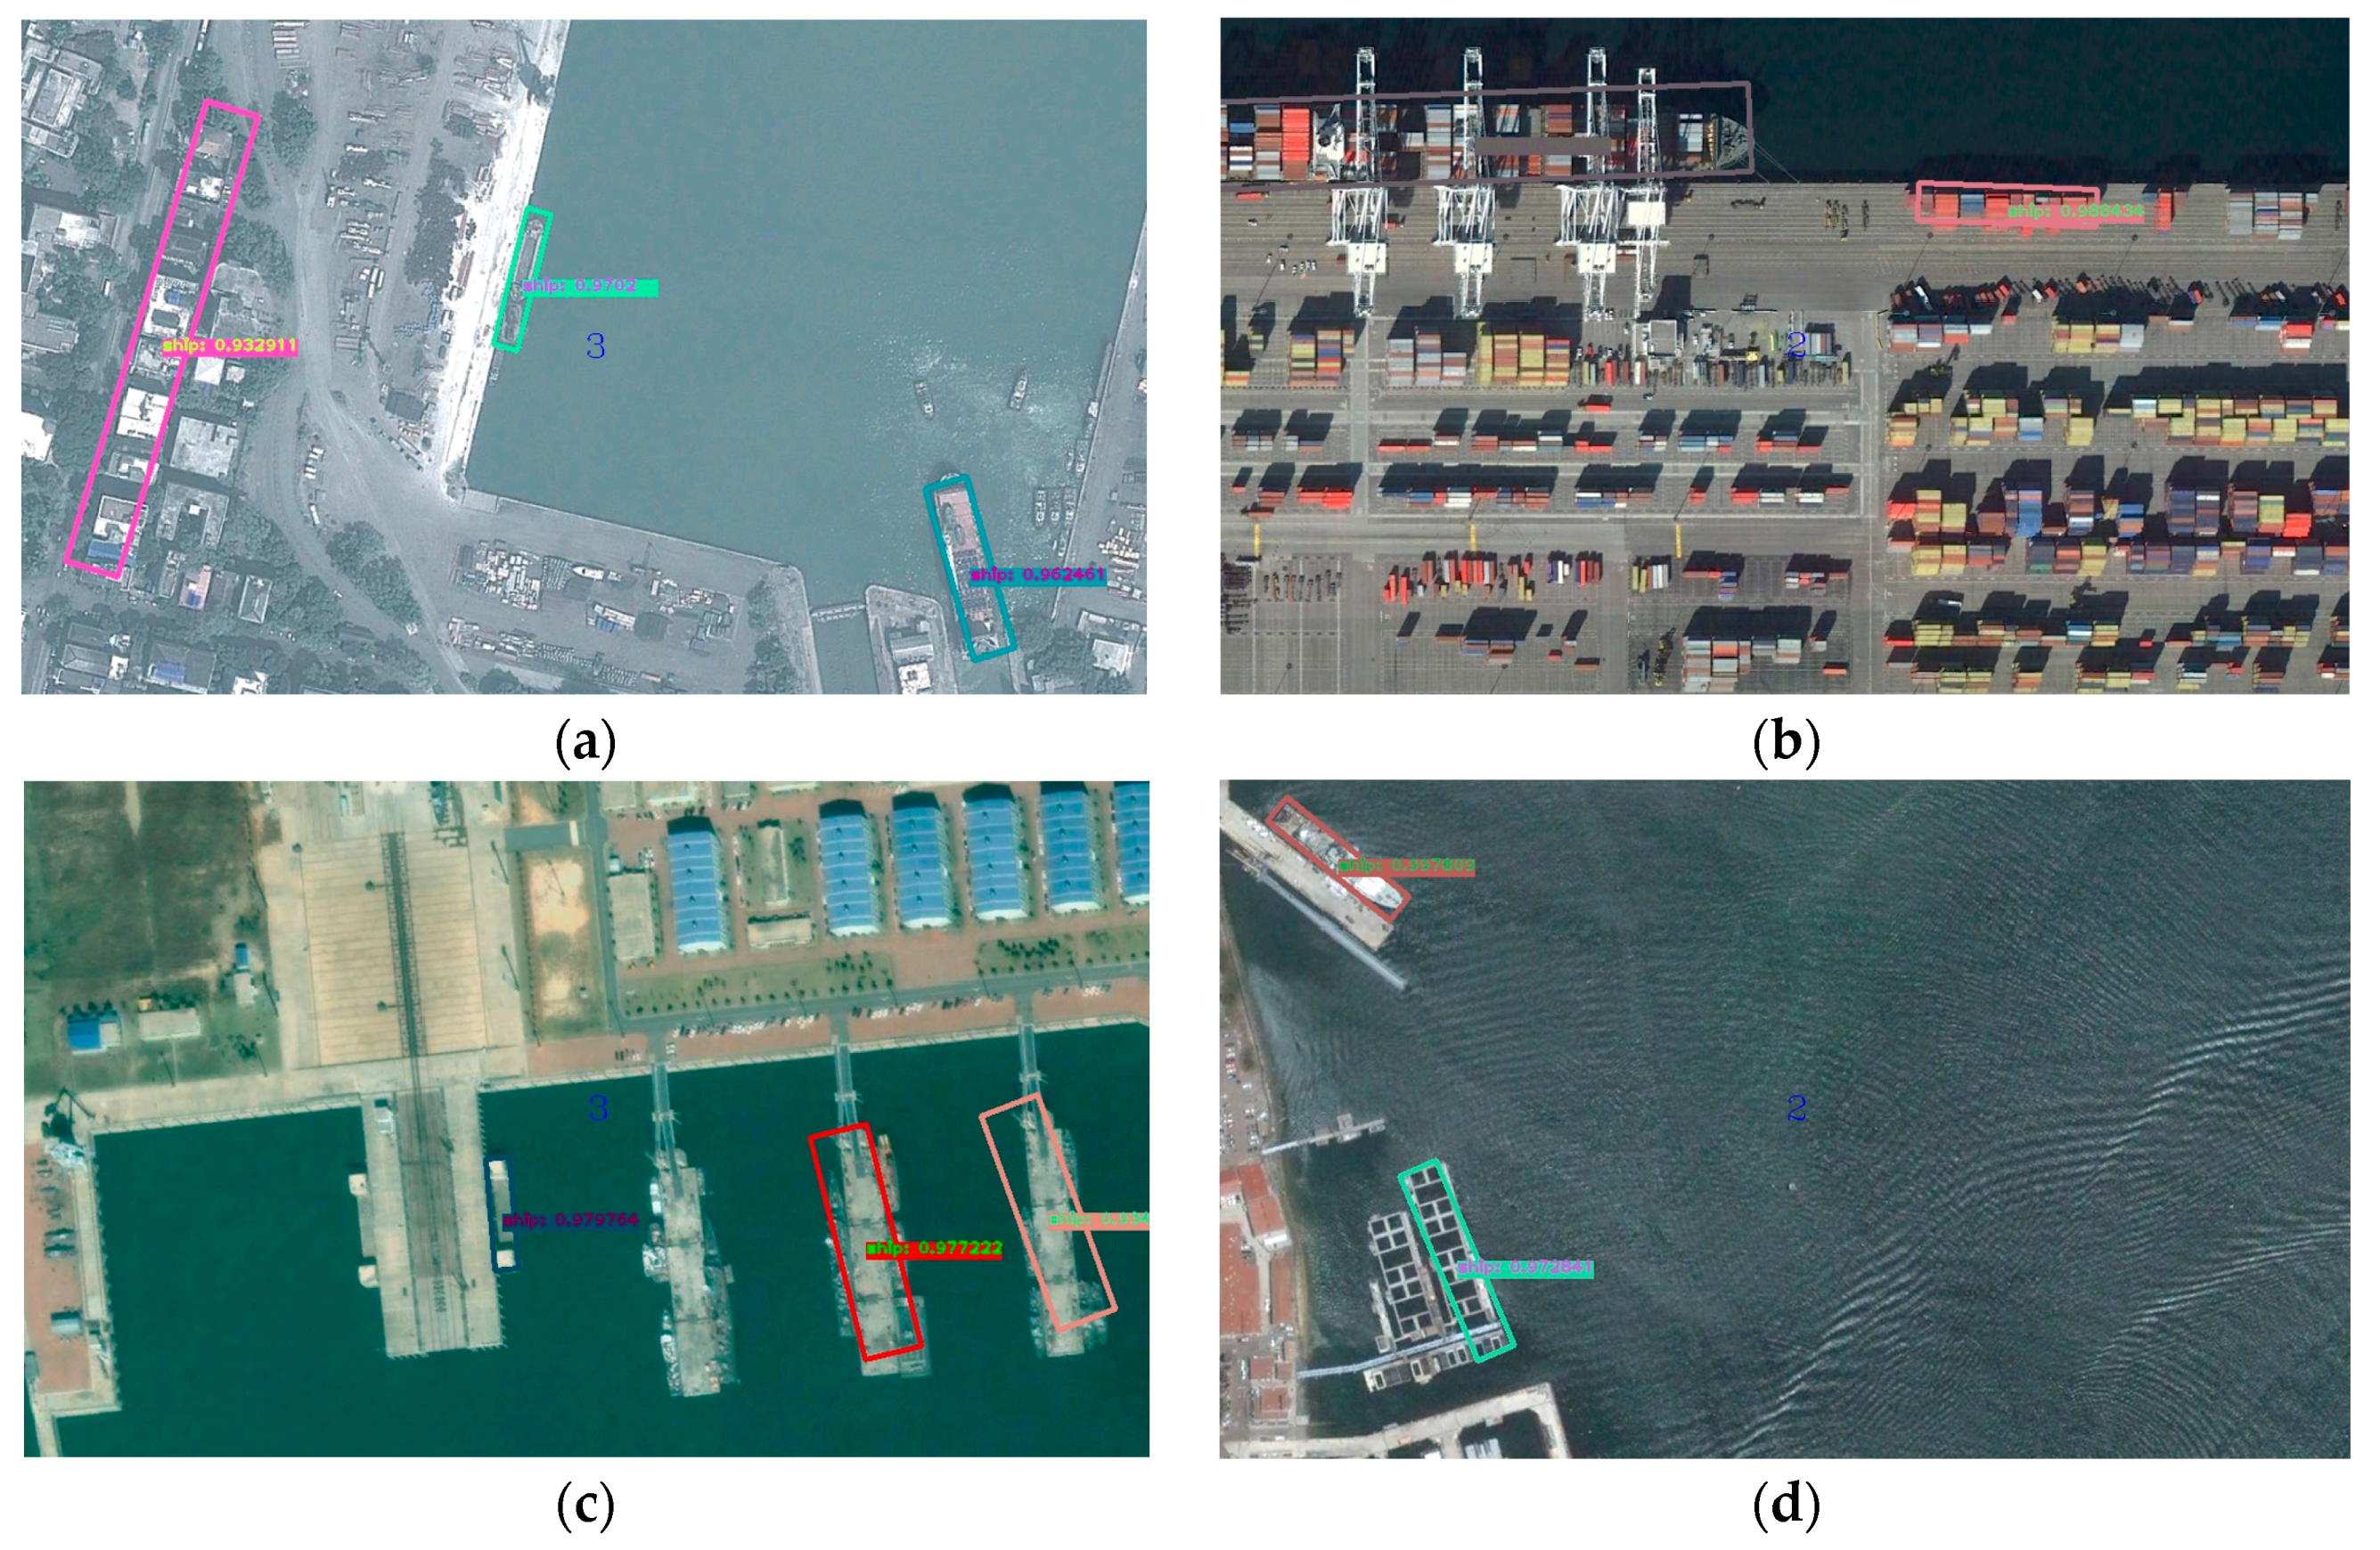
  • Different from previous detection models, we build a new ship detection framework based on rotation regions which can handle different complex scenes, detect intensive objects, and reduce redundant detection regions.
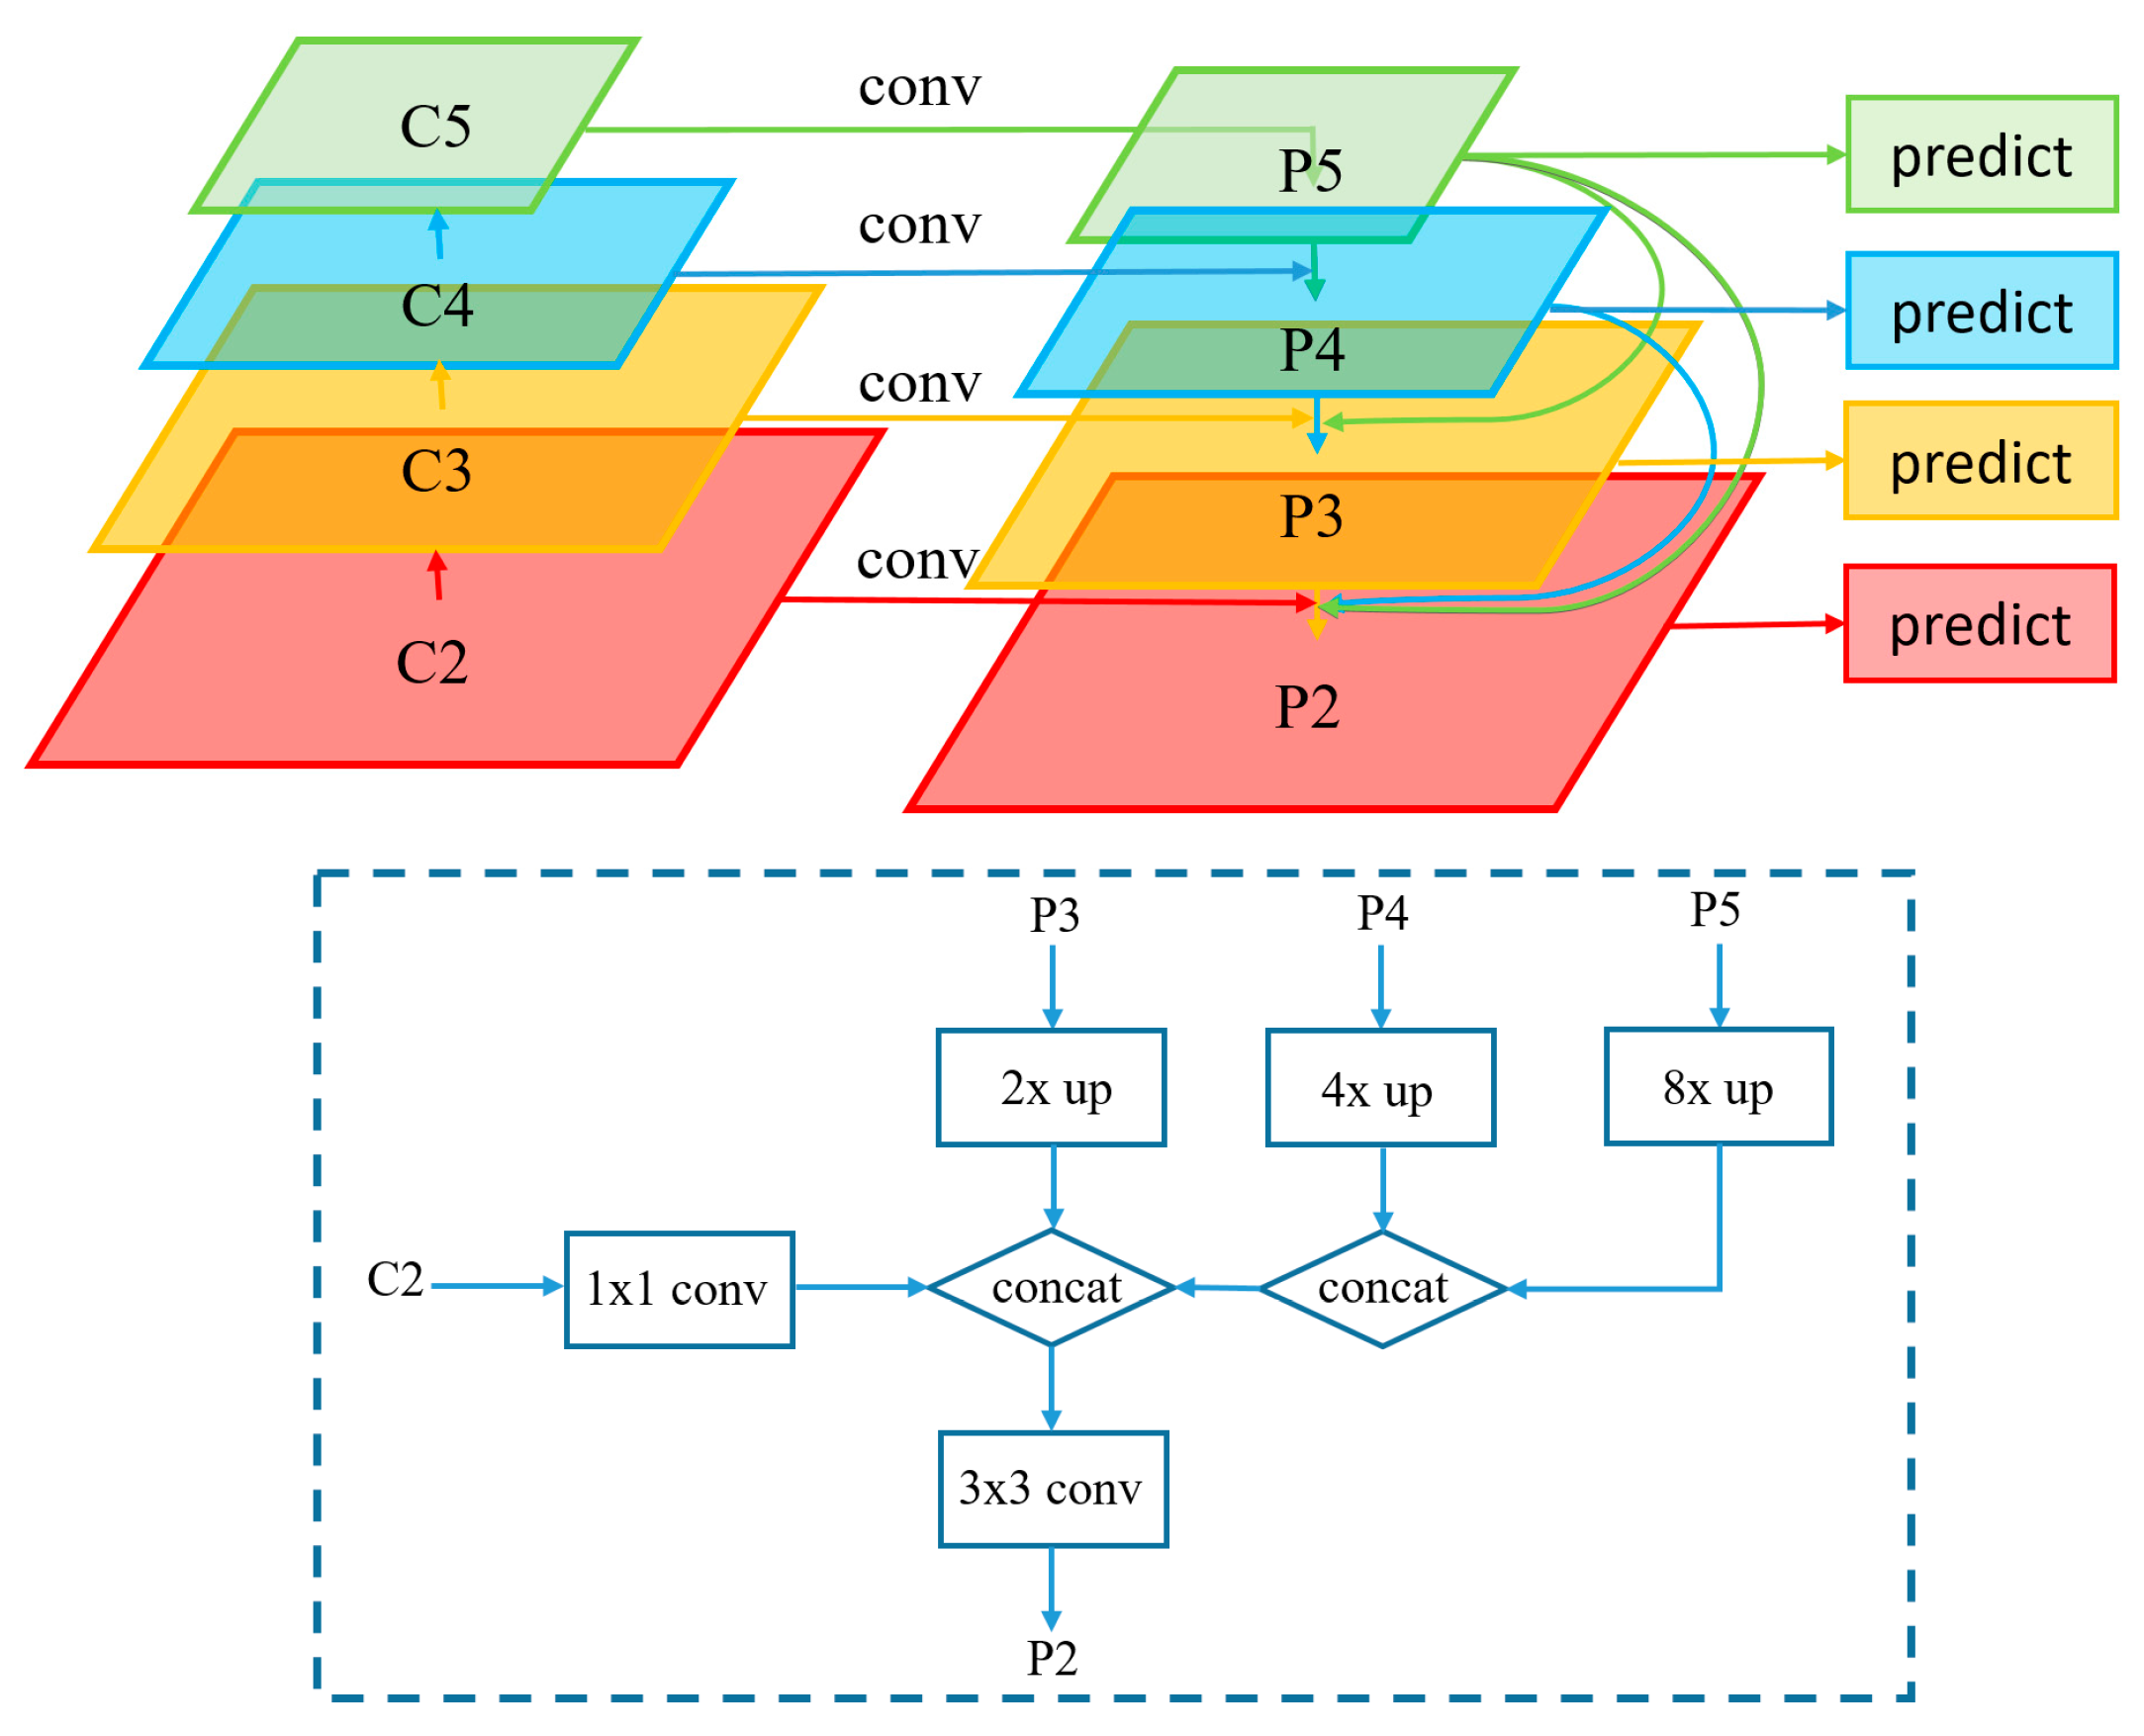
  • We propose the feature pyramid of dense connections based on a multiscale detection framework, which enhances feature propagation, encourages feature reuse, and ensures the effectiveness of detecting multiscale objects.
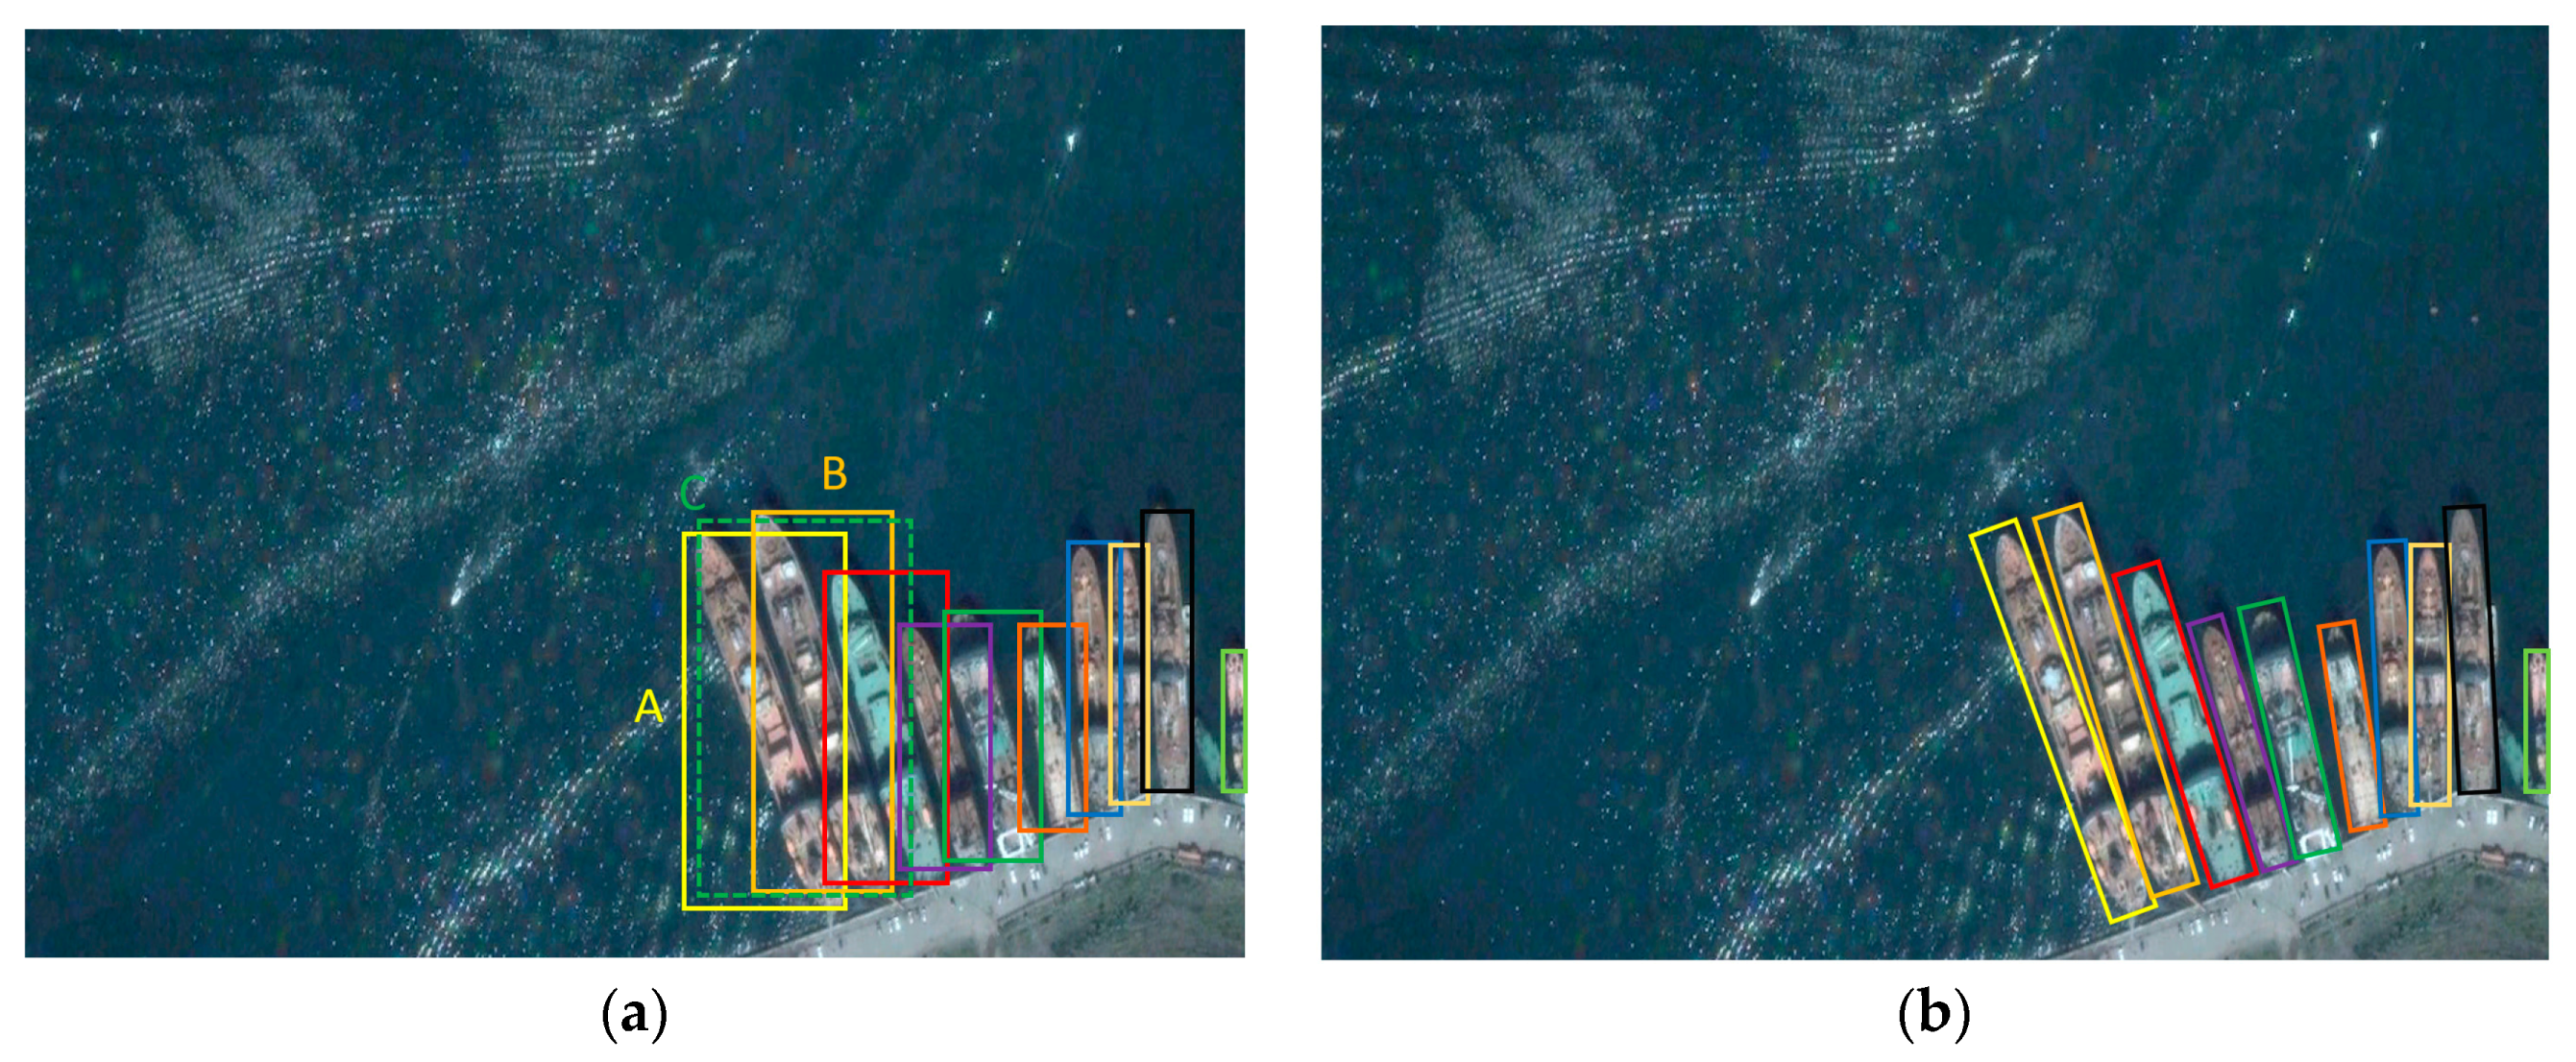
  • We adopt rotation anchors to avoid the side effects of non-maximum suppression and overcome the difficulty of detecting densely arranged targets, and eventually get a higher recall.
  • We use multiscale ROI Align to solve the problem of feature misalignment instead of ROI pooling, and to get the fixed-length feature and regression bounding box to fully keep the completeness of semantic and spatial information through the horizontal circumscribed rectangle of proposal.
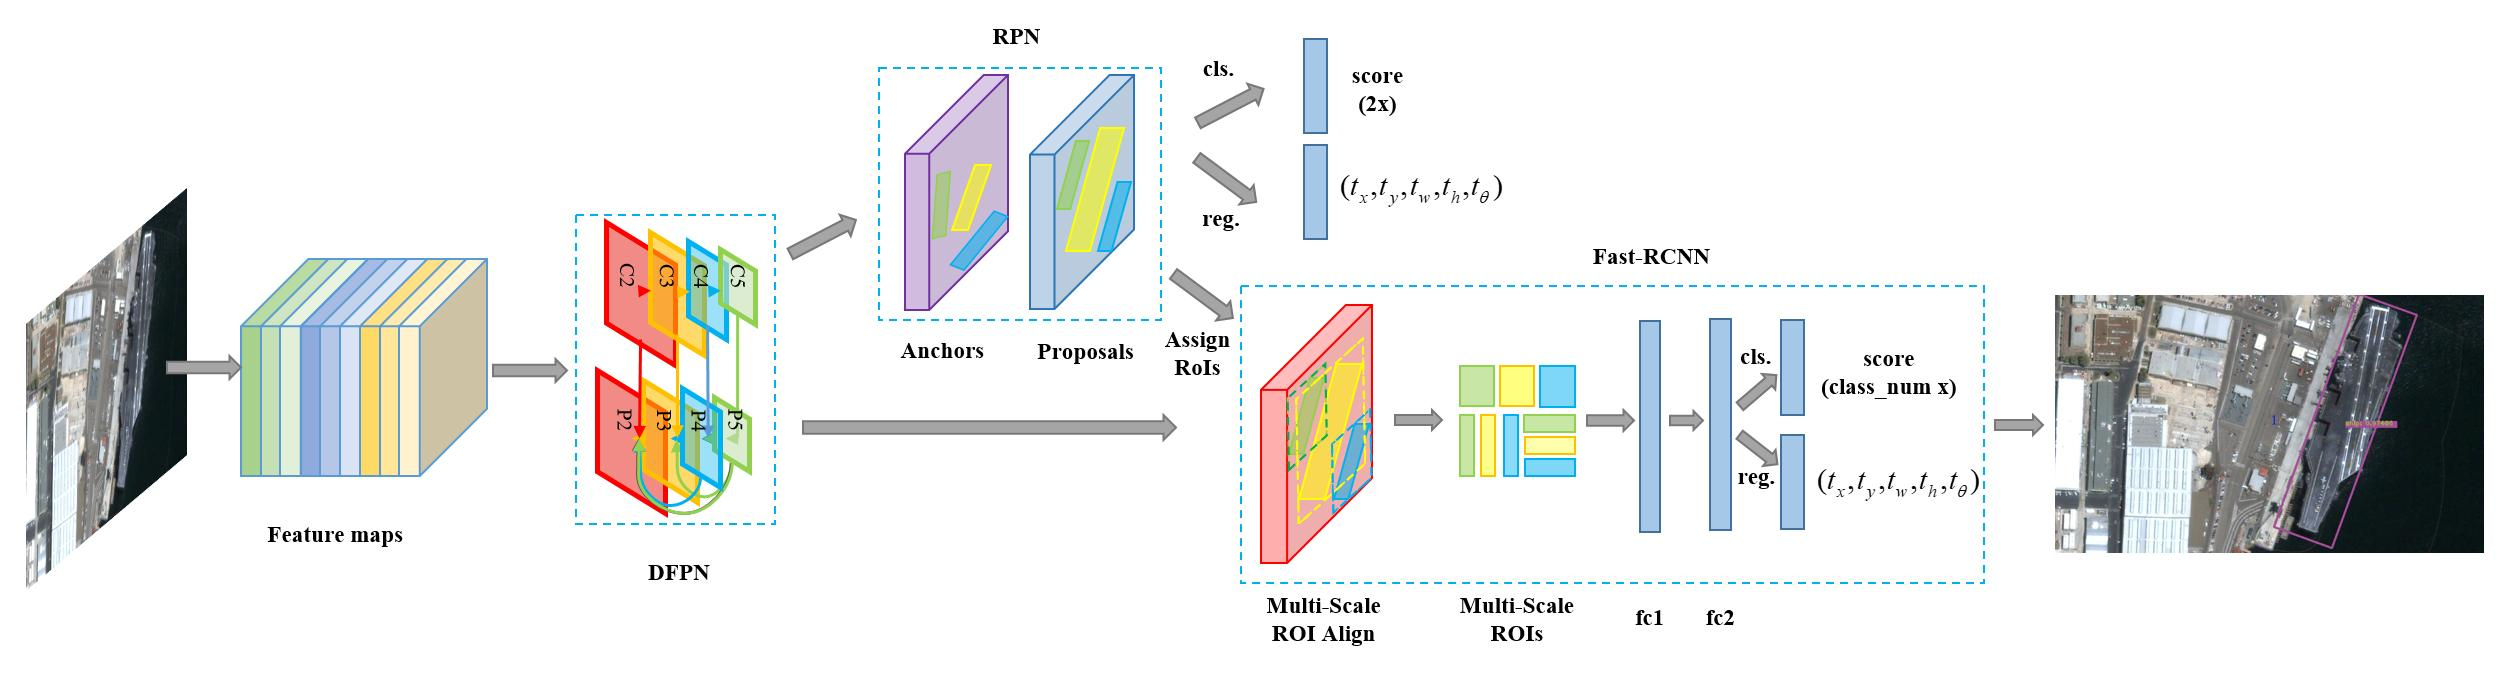
Experiments based on remote sensing images from Google Earth for ship detection show that our detection method based on R-DFPN representation has state-of-the-art performance. The rest of this paper is organized as follows. Section 2 introduces the details of the proposed method. Section 3 presents experiments conducted on a remote sensing dataset to validate the effectiveness of the proposed framework. Section 4 discusses the results of the proposed method. Finally, Section 5 concludes this paper.

2. Proposed Method

In this section we will detail the various parts of the R-DFPN framework. Figure 2 shows the overall framework of R-DFPN. The framework mainly consists of two parts: a Dense Feature Pyramid Network (DFPN) for feature fusion and a Rotation Region Detection Network (RDN) for prediction. Specifically, DFPN can generate feature maps that are fused by multiscale features for each input image. Then, we get rotational proposals from the RPN to provide high-quality region proposals for the next stage. Finally, the location regression and class prediction of proposals are processed in the Fast-RCNN stage.

2.1. DFPN

As we all know, low-level feature semantic information is relatively scarce, but the object location is accurate. On the contrary, high-level feature semantic information is rich, but the object location is relatively rough. The feature pyramid is an effective multiscale method to fuse multilevel information. Feature Pyramid Networks (FPN) achieved very good results in small object detection tasks. It uses the feature pyramid, which is connected via a top-down pathway and lateral connection.
Ship detection can be considered a task to detect small objects because of the characteristic of the large aspect ratio of ships. Meanwhile, considering the complexity of the background in remote sensing images, there are a lot of shiplike interferences in the port such as roofs, container piles, and so on. Therefore, the feature information obtained through the FPN may be not sufficient to distinguish these objects. In order to solve the problems above, we design a Dense Feature Pyramid Network (DFPN), which uses a dense connection, enhances feature propagation, and encourages feature reuse [31].
Figure 3 shows the architecture of DFPN based on ResNets [32]. In the bottom-up feedforward network, we still choose multilevel feature maps { C 2 , C 3 , C 4 , C 5 } , corresponding to the last layer of each residual block, which have strong semantic features. We note that they have strides of { 4 , 8 , 16 , 32 } pixels. In the top-down network, we get higher resolution features by lateral connections and dense connections { P 2 , P 3 , P 4 , P 5 } . For example, in order to get P 2 , we first reduce the number of C 2 channels by using a 1 × 1 convolutional layer; then, we use nearest neighbor up-sampling for all the preceding feature maps. We merge them by concatenating rather than simply adding. Finally, we eliminate the aliasing effects of up-sampling through a 3 × 3 convolutional layer, while reducing the number of channels. After the iteration above, we get the final feature maps { P 2 , P 3 , P 4 , P 5 } .
It should be noted that we do not use shared classification and regression for the feature pyramid. We believe that this can make each feature map perform better and generate more information. In order to reduce the number of parameters, we set the number of channels for all feature maps to 256 at the same time.
Through a large number of experimental comparisons, we find that the use of DFPN can significantly improve the detection performance due to the smooth feature propagation and feature reuse.

2.2. RDN

Similar to the traditional detection framework, Rotation Region Detection Network also contains two stages: RPN and Fast-RCNN. In order to achieve the detection of rotated objects, the two stages above have to make changes, as shown in Figure 2. In the RPN stage, we have to redefine the representation of the rectangle to get the “Rotation Bounding Box” at first. After that, we generate rotation proposals by regressing the rotation anchors to reduce the impact of non-maximum suppression and improve the recall. Then, each proposal obtains a fixed-length feature vector through the Multiscale ROI Align layer to preserve the complete feature information. In order to match the operation of ROI Align, we regress the horizontal circumscribed rectangle of the proposal instead of itself in the second stage. In addition, through two fully connected layers, we conduct a position prediction and classification. Finally, the final result is obtained by non-maximum suppression.

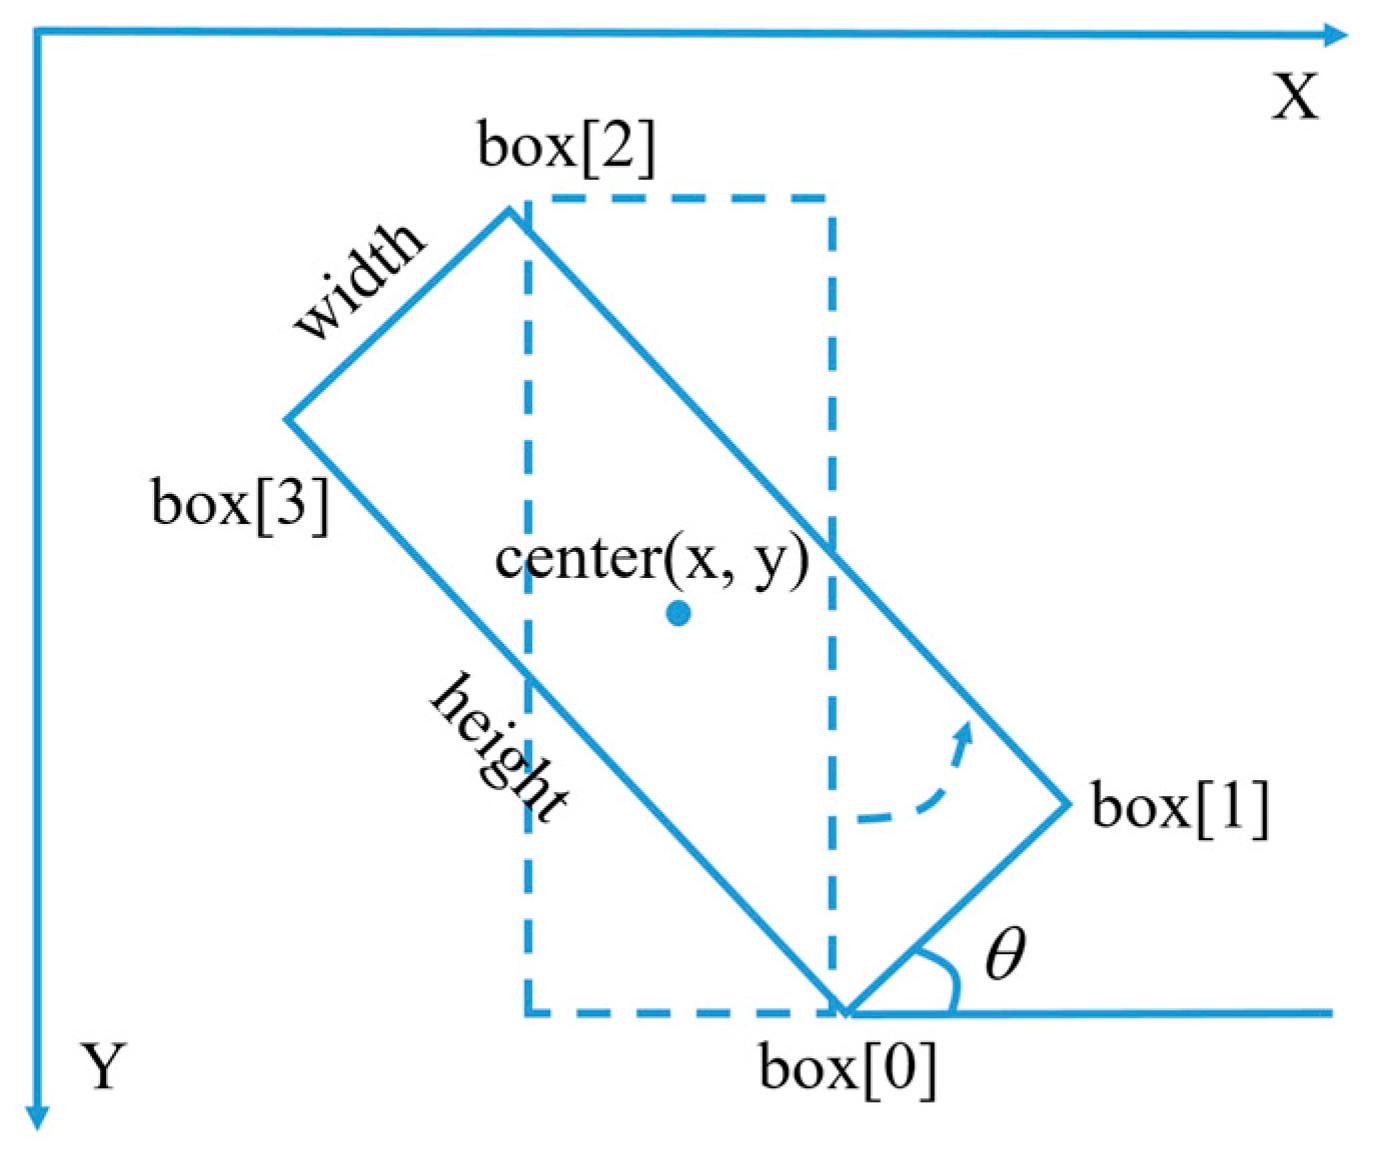
2.2.1. Rotation Bounding Box

The traditional bounding box is a horizontal rectangle, so its representation is relatively simple, using ( x min , y min , x max , y max ) representation. These coordinates represent the lower left and upper right corners of the bounding box, respectively. However, this is obviously no longer suitable for representing a rotated bounding box. In order to represent the bounding box more generally, we use the five variables ( x , y , w , h , θ ) to uniquely determine the arbitrary bounding box. As shown in Figure 4, x and y represent the coordinates of the center point. Rotation angle ( θ ) is the angle at which the horizontal axis (x-axis) rotates counterclockwise to the first edge of the encountered rectangle. At the same time, we define this side as the width w; the other is the height h. We note that the range of angles is [ 90 , 0 ) .

2.2.2. Rotation Anchor/Proposal

In contrast to R2CNN, which still uses horizontal anchors in detecting scene text, we use rotational anchors at the RPN stage. For a ship with a large aspect ratio, it is likely that a horizontal proposal contains more than one ship after non-maximum suppression, resulting in missed detection. In this paper, we use the three parameters of scale, ratio, and angle to generate anchors. Taking into account the characteristics of ships, the ratios of { 1 : 3 , 3 : 1 , 1 : 5 , 5 : 1 , 1 : 7 , 7 : 1 , 1 : 9 , 9 : 1 } were adopted. Then, we assign a single scale to each feature map; the size of the scale is { 50 , 150 , 250 , 350 , 500 } pixels on { P 2 , P 3 , P 4 , P 5 , P 6 } , respectively. Then, we add six angles { 15 30 45 60 75 90 } to control the orientation so as to cover the object more effectively. Each feature point for each feature map will generate 48 anchors ( 1 × 8 × 6 ) , 240 outputs ( 5 × 48 ) for each regression layer, and 96 outputs ( 2 × 48 ) for each classification layer. Figure 5 shows the excellent results using a multiscale framework.

2.2.3. Non-Maximum Suppression

Intersection-over-Union (IoU) computation is a core part of non-maximal suppression. However, the rotation proposals can be generated in any orientation, so IoU computation on axis-aligned proposals may lead to an inaccurate IoU of skew interactive proposals and further ruin the proposal learning. An implementation for Skew IoU computation [27] with thought to triangulation is proposed to deal with this problem. We need to use non-maximum suppression twice during the entire training process; the first is to get the appropriate proposals, and the second is during the postprocessing of the predictions. In traditional horizontal region detection tasks, the non-maximum suppression of both stages encounters such difficulty that once the objects are densely arranged, some proposals or predictions will be discarded because of the large overlap, resulting in missed detection, as shown in Figure 6a,b. Too many redundant regions in the horizontal rectangle lead to these undesirable results, while the rotation region detection avoids this problem, as shown in Figure 6c,d.

2.2.4. Multiscale ROI Align

RRPN uses Rotation Region-of-Interest (RROI) pooling to obtain a fixed-length feature vector from the proposal, which is not suitable for ship detection. Taking into account the narrow side of large aspect ratio objects and the problem of feature misalignment in ROI pooling, the final cropped ROI may not contain any useful information. Therefore, we adopted ROI Align to process the horizontal circumscribed rectangle of the proposal to solve the problem of feature misalignment and added two pool sizes of 3:16 and 16:3 to minimize the influence of the distortion caused by the interpolation method (no matter what the angle of the boat is, at least one of the pooling results is not seriously deformed, shown in Figure 2). In order to match the operation of the ROI Align, it is crucial that we regress the horizontal circumscribed rectangle of the proposal at the second stage. Figure 7 visualizes the feature cropping effect of the Multiscale ROI Align method.

2.2.5. Loss Function

During training of the RPN, each anchor is assigned a binary class label and five parametric coordinates. To train the RPN [18], we need to find positive and negative samples from all anchors, which we call a mini-batch. The positive sample anchors need to satisfy either of the following conditions: (i) the IoU [15] overlap between an anchor and the ground-truth is greater than 0.5, and an angular difference of less than 15 degrees; or (ii) an anchor has the highest IoU overlap with a ground-truth. Negative samples are defined as (i) IoU overlap less than 0.2; or (ii) IoU overlap greater than 0.5 but an angular difference of greater than 15 degrees. Anchors that are neither positive nor negative are discarded. We use multitask loss to minimize the objective function, which is defined as follows:
L ( p i , l i , t i , t i ) = 1 N c l s i L c l s ( p i , l i ) + λ 1 N r e g i p i L r e g ( t i , t i )
where l i represents the label of the object, p i is the probability distribution of various classes calculated by the softmax function, t i represents the predicted five parameterized coordinate vectors, and t i represents the offset of the ground-truth and positive anchors. The hyper-parameter λ in Equation (1) controls the balance between the two task losses; all experiments use λ   =   1 in this paper. In addition, the functions L c l s and L r e g [17] are defined as
L c l s ( p , l ) = log p l ,
L r e g ( t i , t i ) = s m o o t h L 1 ( t i t i ) ,
s m o o t h L 1 ( x ) = { 0.5 x 2 , i f | x | < 1 | x | 0.5 , o t h e r w i s e } .
The parameterized coordinate regression mode is as follows:
t x = ( x x a ) / w a , t y = ( y y a ) / h a , t w = log ( w / w a ) , t h = log ( h / h a ) , t θ = θ θ a + k π / 2
where x , y , w , and h denote the box’s center coordinates and its width and height. Variables x , x a , and x are for the predicted box, anchor box, and ground-truth box, respectively (likewise for y , w , h ). The parameter k Z keeps θ in the range [ 90 , 0 ) . In order to keep the bounding box in the same position, w and h need to be swapped when k is an odd number.

3. Experiments and Results

3.1. Implementation Details

3.1.1. Remote Sensing Dataset

Our dataset was collected publicly from Google Earth with 1000 large scene images sized 16 , 393 × 16 , 393 pixels, covering 400 square meters. These satellite remote sensing images have the red, green, and blue tri-band information after geometric correction. Their format is geotif with latitude and longitude information. The images contain scenes of civilian ports, military bases, offshore areas, and far seas. We divided the images into 600 × 1000 subimages with an overlap of 0.1, then filtered out images that do not contain ships, resulting in 8000 final images. The ratio of training set to test set is 1:4. In the training process, we flip the image randomly, while subtracting the mean value [ 103.939 ,   116.779 ,   123.68 ] .

3.1.2. Training

All experiments were done on the deep learning framework, Tensorlow. We used the pretraining model ResNet-101 to initialize the network. We tried two training strategies: (i) alternating training; and (ii) end-to-end training. Both of the strategies had the same effect. Considering the fact that it is more convenient to train with the second strategy, we adopted the second strategy in this paper. We trained a total of 80 k iterations, with a learning rate of 0.001 for the first 30 k iterations, 0.0001 for the next 30 k iterations, and 0.00001 for the remaining 20 k iterations. Weight decay and momentum were 0.0001 and 0.9, respectively. The optimizer chosen is MomentumOptimizer.
At the RPN stage, we sampled a total of 512 anchors as a mini-batch for training (256 proposals for the second stage), where the ratio of positive to negative samples was 1:1. Given that a change in the angle of the ship will cause a drastic change in the IoU, we set the IoU threshold of the positive sample to 0.5 to ensure that the training had a sufficient positive sample. The feature maps were input to the RPN network through a 5 × 5 convolutional layer, followed by two sibling 1 × 1 convolution layers for regression and classification.

3.2. Accelerating Experiment

We use millions of anchors throughout the network, but most of the anchors are worthless for a particular image and will increase the amount of computation. The operation of non-maximum suppression at the first stage spends the most calculation time because it needs to select high-quality proposals from all the anchors. The experiment found that the higher the quality of proposal, the higher its confidence score. Therefore, we can select the anchors with the highest scores at the RPN stage to perform non-maximum suppression and get the proposals we need. Figure 8 shows the impact of different combinations of anchors and proposals on the experimental results.
We find that as the number of anchor/proposal pairs increases, the assessment indicators tend to be stable, but the calculation time changes drastically. We can also see from Figure 8 that when the number of anchor/proposal pairs rises to a certain amount, the result of the model shows a slight decrease. Combined with the findings above, we selected the 12,000 anchors with the highest confidence scores, and generated 1200 proposals through the non-maximum suppression operation.

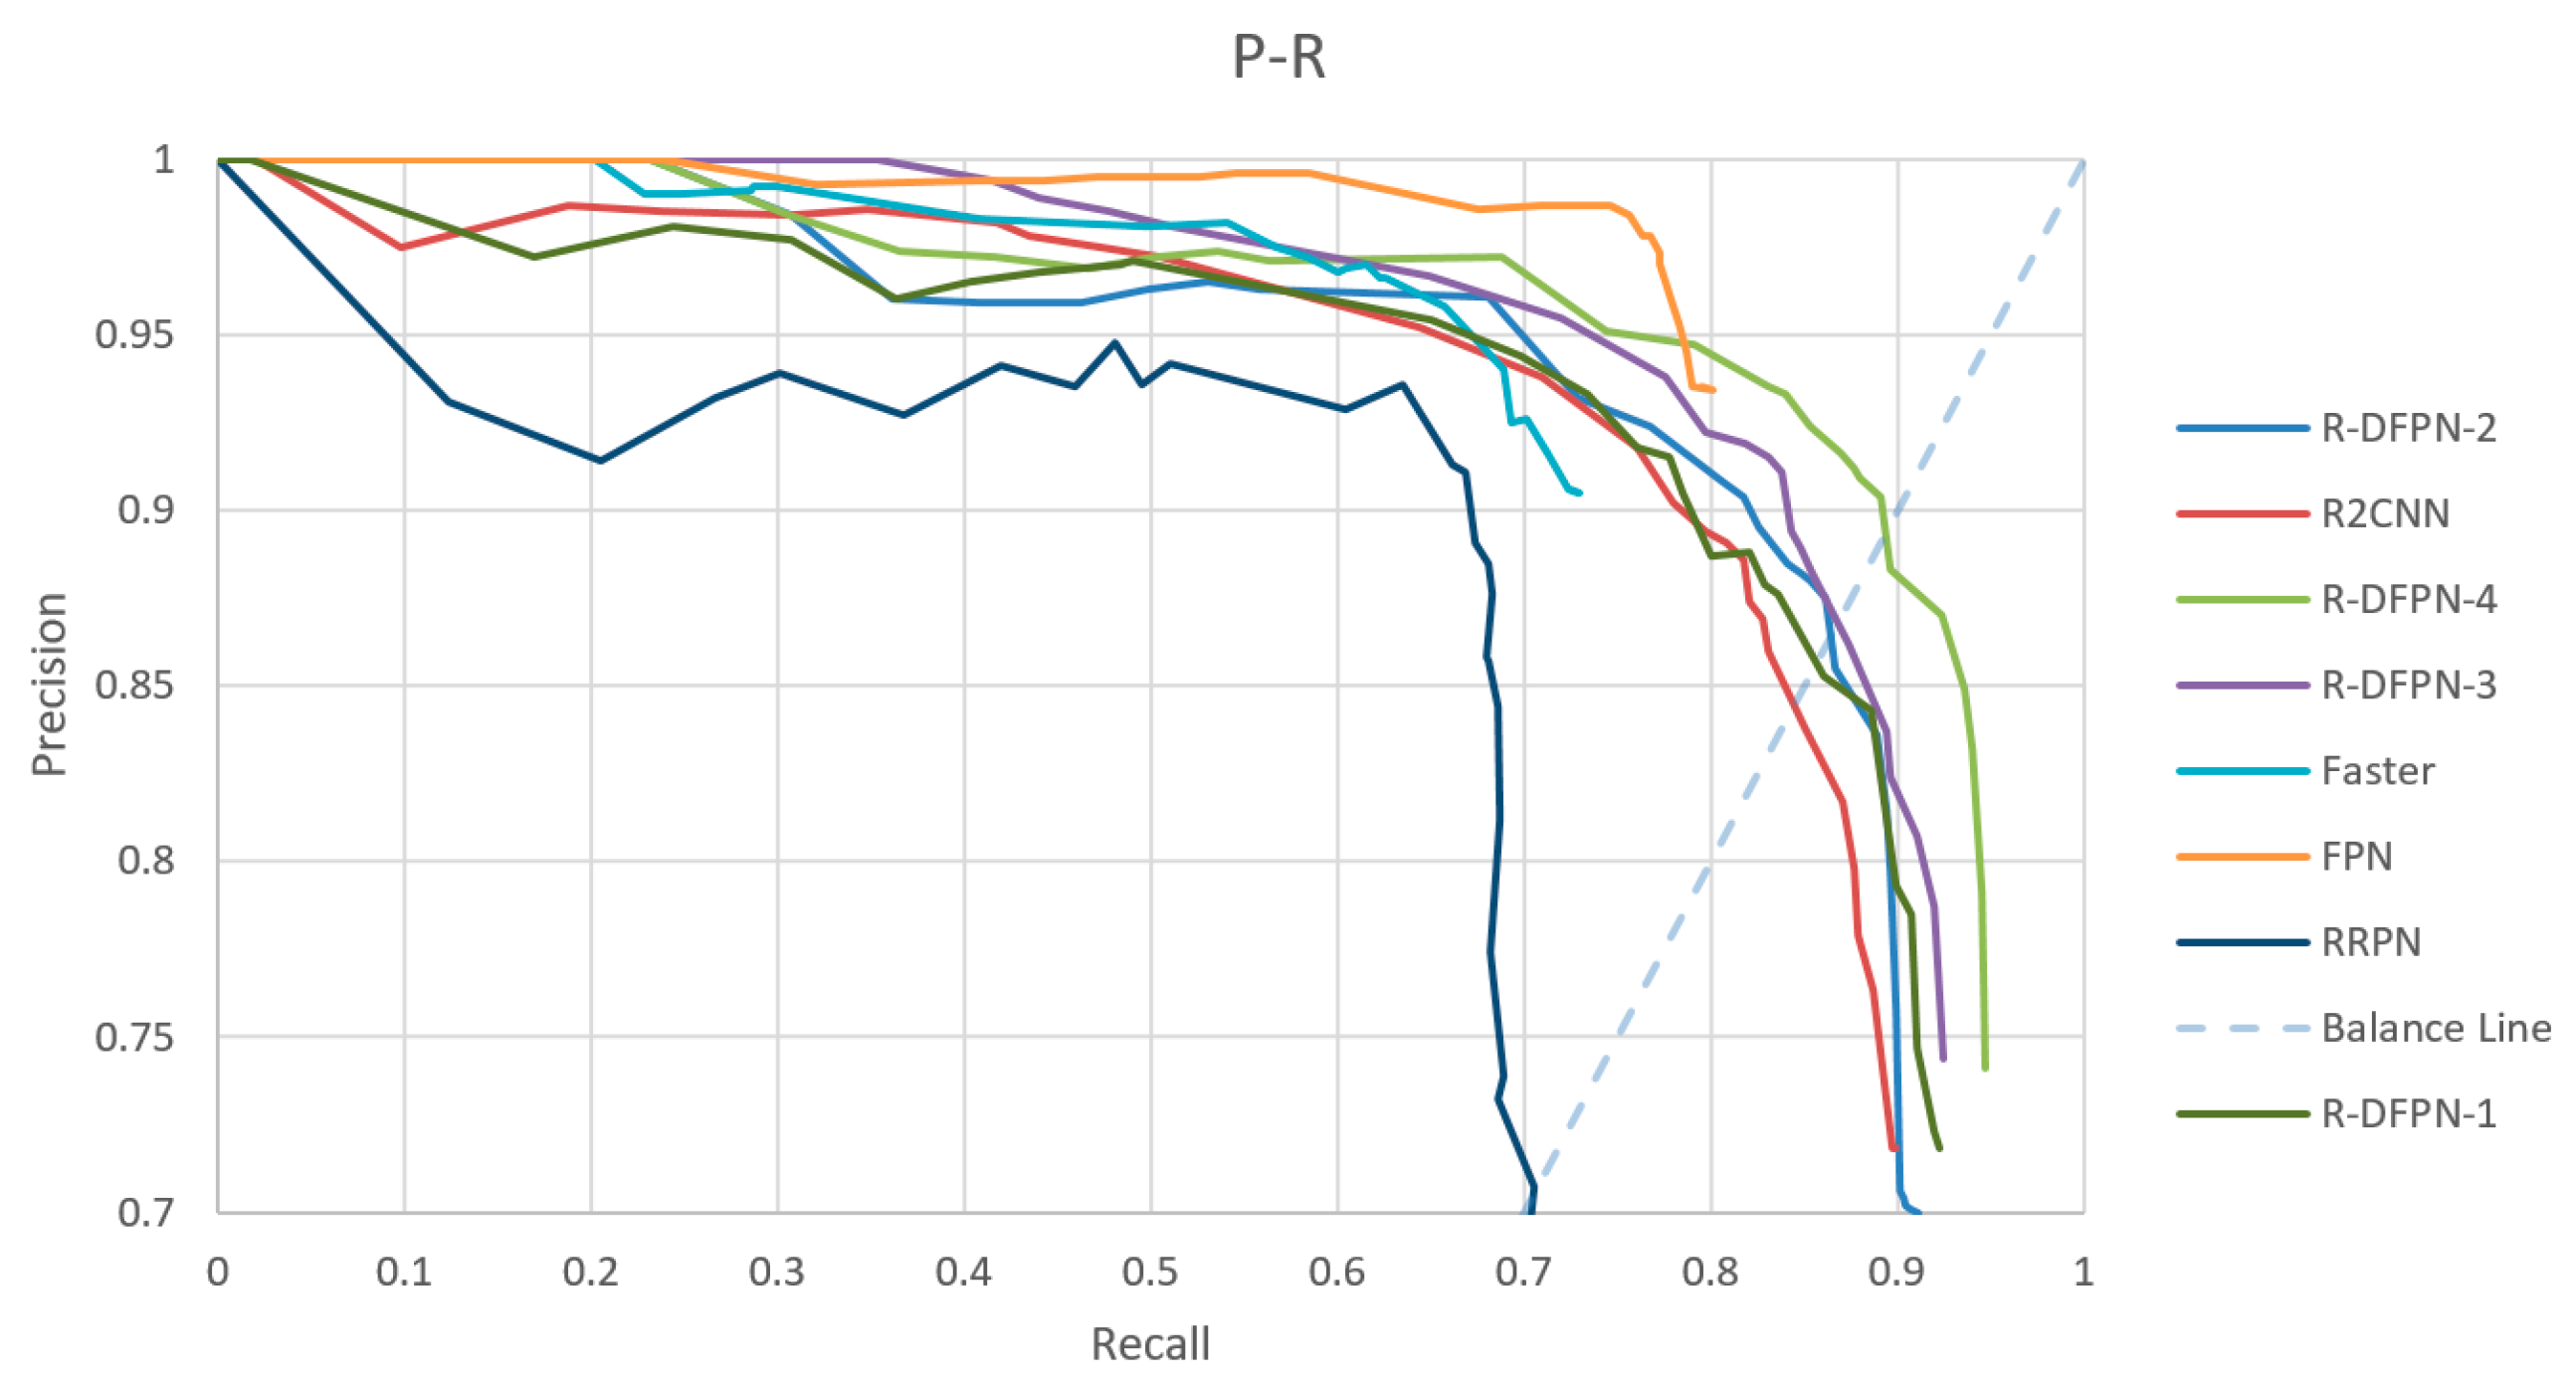
3.3. Comparative Experiment

We performed a series of experiments on remote sensing datasets, and our method achieved state-of-the-art performance: 88.2% for Recall, 91.0% for Precision, and 89.6% for F-measure. Table 1 summarizes the experimental results of various methods. We will now compare the differences between different methods and analyze the primary role of each structure in our framework.
Faster-RCNN and FPN have poor Recall due to non-maximum suppression. When the ships are arranged densely, the horizontal region detection method seems powerless. RRPN uses the RROI Pooling method, which has the problem of feature misalignment. The loss of semantic and spatial information has a huge impact on narrow ship detection. R2CNN generates horizontal proposals at the first stage, so the feature information loss is not serious, but the quality of the proposals is not high due to the non-maximum suppression, while the missed detection rate is still high.
R-DFPN-1 and R-DFPN-2 are designed to evaluate the effect of DFPN. Compared with FPN, DFPN has better feature liquidity and reusability, which is helpful to detection. R-DFPN-2 uses DFPN, and this leads to a 2.2% performance improvement over R-DFPN-1 (Recall improved by 2.1%, Precision by 2.2%).
The advantage of using the rotation anchor strategy is that side effects caused by non-maximum suppression can be avoided, and it can provide higher quality proposals. The main difference between the R2CNN and R-DFPN-1 methods is the rotation anchor and pool size. Although R2CNN uses a multiscale pool size, the R2CNN Recall is still 1.8% lower than R-DFPN-1. This shows that using rotation anchors has a great effect on the Recall.
ROI Align is used to solve the problem of feature misalignment. Misaligned features have a huge impact on narrow ships. In order to better preserve the semantic and spatial information of the ship, we crop the horizontal circumscribed rectangle of the proposal; meanwhile, we need to regress its horizontal circumscribed rectangle at the second stage to match the feature information exactly. Compared with R-DFPN-3, R-DFPN-4 shows a great improvement in Recall and Precision, and achieved the highest F-measure of 89.6%.
We used a different pool size in order to reduce the distortion caused by interpolation. R-DFPN-2 and R-DFPN-3 show that using multiple pool sizes has a certain promotion effect.
All detection methods were tested on a GeForce GTX 1080 (8 GB Memory), which is made by the United States NVIDA. The time required for training and testing is shown in Table 2. It can be seen that the method we proposed ensures a performance improvement while keeping the training and testing at a relatively fast level.
Different Recall and Precision can be obtained by changing the confidence score threshold of detection. Figure 9 plots the performance curves of different methods. The intersection of the dotted line with the other curves is the equilibrium point for each method. The location of the equilibrium point can be used to compare the performance of the method. R-DFPN-4 (green curve) clearly has the best equilibrium point.

4. Discussion

By comparing and analyzing the many groups of experiments, the validity of the proposed structure is verified. R-DFPN offers superior performance in both multiscale and high-density objects. However, we can see from Table 1 that the Precision of R-DFPN is not the highest, being behind that of the traditional method. Through observation of the test results, we attribute this to two points: false alarm and misjudgment.

4.1. False Alarm

The aspect ratio is a major feature of a ship, and the testing framework learns this. However, ships tend to dock in a complex scene, such as a port or naval base. These scenes often contain objects with similar aspect ratios, such as roofs, container piles, and dock. These disturbances will cause false alarms on the detector, as shown in Figure 10.
Although DFPN fully reuses feature information, it is still not enough to eliminate the false alarm effect. Sea–land segmentation can be a better solution to this problem, but is limited by its segmentation accuracy. The introduction of generative adversarial nets may be another idea for training a discriminator to enhance the detector’s ability to recognize.

4.2. Misjudgment

Misjudgment is another important reason for the low Precision. The sensitive relationship between IoU overlap and ship angle often leads to mistakes. For example, for a ship with an aspect ratio of 1:7, the IoU is only 0.38 when the angles differ by 15 degrees. When the confidence score threshold is 0.55, both targets in Figure 11 will be misjudged and not detected. In order to make the comparison more reasonable, we can calculate the IoU using the circumscribed rectangle of the rotating rectangle, as shown in Figure 11b.
Through this new evaluation criteria, we can recalculate the indicators, as shown in Table 3. We can see that Recall and Precision in the rotation region method all show an obvious improvement.

5. Conclusions

In this paper, we proposed a multiscale rotation region detection method which can handle different complex scenes, detect intensive objects, and reduce the redundant detection region. Many novel structures were designed for this model. For example, DFPN was designed to enhance the propagation and reuse of features. Then, we used rotation anchors to improve the quality of the proposals. In addition, a multiscale ROI Align approach was adopted to fully preserve the semantic and spatial information of features. It should be noted that the regression box at the second stage and ROI are both the horizontal circumscribed rectangle of the proposals. Experiments show that R-DFPN has state-of-the-art performance in ship detection in complex scenes, especially in the task of detecting densely arranged ships.
Despite the best performance, there are still some problems. More false alarms resulted in a much lower Precision for R-DFPN than for Faster-RCNN and FPN. We need to explore how to effectively reduce false alarms in the future.

Acknowledgments

The work is supported by the National Natural Science Foundation of China under Grants 41501485. The authors would like to thank all the colleagues in the lab, who generously provided their image dataset with the ground truth. The authors would also like to thank the anonymous reviewers for their very competent comments and helpful suggestions.

Author Contributions

Xue Yang and Jirui Yang conceived and designed the experiments; Xue Yang performed the experiments; Xue Yang and Jirui Yang analyzed the data; Kun Fu, Xian Sun and Menglong Yan contributed materials; Xue Yang wrote the paper. Hao Sun and Zhi Guo supervised the study and reviewed this paper.

Conflicts of Interest

The authors declare no conflict of interest.

References

  1. Crisp, D.J. A ship detection system for RADARSAT-2 dual-pol multi-look imagery implemented in the ADSS. In Proceedings of the 2013 IEEE International Conference on Radar, Adelaide, Australia, 9–12 September 2013; pp. 318–323. [Google Scholar]
  2. Crisp, D.J. The state-of-the-art in ship detection in Synthetic Aperture Radar imagery. Org. Lett. 2004, 35, 2165–2168. [Google Scholar]
  3. Wang, C.; Bi, F.; Zhang, W.; Chen, L. An Intensity-Space Domain CFAR Method for Ship Detection in HR SAR Images. IEEE Geosci. Remote Sens. Lett. 2017, 14, 529–533. [Google Scholar] [CrossRef]
  4. Fingas, M.F.; Brown, C.E. Review of Ship Detection from Airborne Platforms. Can. J. Remote Sens. 2001, 27, 379–385. [Google Scholar] [CrossRef]
  5. Leng, X.; Ji, K.; Zhou, S.; Zou, H. An adaptive ship detection scheme for spaceborne SAR imagery. Sensors 2016, 16, 1345. [Google Scholar] [CrossRef] [PubMed]
  6. Yu, Y.D.; Yang, X.B.; Xiao, S.J.; Lin, J.L. Automated Ship Detection from Optical Remote Sensing Images. Key Eng. Mater. 2012, 9, 749–753. [Google Scholar] [CrossRef]
  7. Zhu, C.; Zhou, H.; Wang, R.; Guo, J. A Novel Hierarchical Method of Ship Detection from Spaceborne Optical Image Based on Shape and Texture Features. IEEE Trans. Geosci. Remote Sens. 2010, 48, 3446–3456. [Google Scholar] [CrossRef]
  8. Bi, F.; Zhu, B.; Gao, L.; Bian, M. A Visual Search Inspired Computational Model for Ship Detection in Optical Satellite Images. IEEE Geosci. Remote Sens. Lett. 2012, 9, 749–754. [Google Scholar]
  9. Szegedy, C.; Vanhoucke, V.; Ioffe, S.; Shlens, J.; Wojna, Z. Rethinking the inception architecture for computer vision. In Proceedings of the 2016 IEEE Conference on Computer Vision and Pattern Recognition (CVPR 2016), Seattle, WA, USA, 27–30 June 2016; pp. 2818–2826. [Google Scholar]
  10. Szegedy, C.; Liu, W.; Jia, Y.; Sermanet, P.; Reed, S.; Anguelov, D.; Erhan, D.; Vanhoucke, V.; Rabinovich, A. Going deeper with convolutions. In Proceedings of the 2015 IEEE Conference on Computer Vision and Pattern Recognition (CVPR 2015), Boston, MA, USA, 7–12 June 2015; pp. 1–9. [Google Scholar]
  11. Simonyan, K.; Zisserman, A. Very deep convolutional networks for large-scale image recognition. arXiv, 2014; arXiv:1409.1556. [Google Scholar]
  12. Krizhevsky, A.; Sutskever, I.; Hinton, G.E. Imagenet classification with deep convolutional neural networks. In Proceedings of the Advances in Neural Information Processing Systems, Lake Tahoe, NV, USA, 3–6 December 2012; pp. 1097–1105. [Google Scholar]
  13. Ioffe, S.; Szegedy, C. Batch normalization: Accelerating deep network training by reducing internal covariate shift. In Proceedings of the International Conference on Machine Learning, Lille, France, 6–11 July 2015; pp. 448–456. [Google Scholar]
  14. He, K.; Sun, J. Convolutional neural networks at constrained time cost. In Proceedings of the 2014 IEEE Conference on Computer Vision and Pattern Recognition (CVPR 2014), Columbus, OH, USA, 23–28 June 2014; pp. 5353–5360. [Google Scholar]
  15. Girshick, R.; Donahue, J.; Darrell, T.; Malik, J. Rich Feature Hierarchies for Accurate Object Detection and Semantic Segmentation. In Proceedings of the 2014 IEEE Conference on Computer Vision and Pattern Recognition (CVPR 2014), Columbus, OH, USA, 23–28 June 2014; pp. 580–587. [Google Scholar]
  16. He, K.; Zhang, X.; Ren, S.; Sun, J. Spatial Pyramid Pooling in Deep Convolutional Networks for Visual Recognition. IEEE Trans. Pattern Anal. Mach. Intell. 2015, 37, 1904–1916. [Google Scholar] [CrossRef] [PubMed]
  17. Girshick, R. Fast R-CNN. In Proceedings of the 2015 IEEE Conference on Computer Vision and Pattern Recognition (CVPR 2015), Boston, MA, USA, 7–12 June 2015; pp. 1440–1448. [Google Scholar]
  18. Ren, S.; He, K.; Girshick, R.; Sun, J. Faster R-CNN: Towards Real-Time Object Detection with Region Proposal Networks. IEEE Trans. Pattern Anal. Mach. Intell. 2017, 39, 1137–1149. [Google Scholar] [CrossRef] [PubMed]
  19. Redmon, J.; Divvala, S.; Girshick, R.; Farhadi, A. You Only Look Once: Unified, Real-Time Object Detection. In Proceedings of the 2015 IEEE Conference on Computer Vision and Pattern Recognition (CVPR 2015), Boston, MA, USA, 7–12 June 2015; pp. 779–788. [Google Scholar]
  20. Liu, W.; Anguelov, D.; Erhan, D.; Szegedy, C.; Fu, C.; Berg, A.C. SSD: Single Shot Multibox Detector. In Proceedings of the European Conference on Computer Vision, Amsterdam, The Netherlands, 8–16 October 2016; pp. 21–37. [Google Scholar]
  21. Lin, T.Y.; Dollár, P.; Girshick, R.; He, K.; Hariharan, B.; Belongie, S. Feature pyramid networks for object detection. arXiv, 2016; arXiv:1612.03144. [Google Scholar]
  22. Dai, J.; Li, Y.; He, K.; Sun, J. R-fcn: Object detection via region-based fully convolutional networks. arXiv, 2016; arXiv:1605.06409. [Google Scholar]
  23. Zhang, R.; Yao, J.; Zhang, K.; Feng, C.; Zhang, J. S-Cnn ship detection from high-resolution remote sensing images. ISPRS Int. Arch. Photogramm. Remote Sens. Spat. Inf. Sci. 2016, XLI-B7, 423–430. [Google Scholar] [CrossRef]
  24. Kang, M.; Leng, X.; Lin, Z.; Ji, K. A modified faster R-CNN based on CFAR algorithm for SAR ship detection. In Proceedings of the IEEE International Workshop on Remote Sensing with Intelligent, Shanghai, China, 18–21 May 2017; pp. 1–4. [Google Scholar]
  25. Liu, Y.; Zhang, M.H.; Xu, P.; Guo, Z.W. SAR ship detection using sea-land segmentation-based convolutional neural network. In Proceedings of the IEEE International Workshop on Remote Sensing with Intelligent, Shanghai, China, 18–21 May 2017; pp. 1–4. [Google Scholar]
  26. Jiang, Y.; Zhu, X.; Wang, X.; Yang, S.; Li, W.; Wang, H.; Fu, P.; Luo, Z. R2CNN: Rotational Region CNN for Orientation Robust Scene Text Detection. arXiv, 2017; arXiv:1706.09579. [Google Scholar]
  27. Ma, J.; Shao, W.; Ye, H.; Wang, L.; Wang, H.; Zheng, Y.; Xue, X. Arbitrary-Oriented Scene Text Detection via Rotation Proposals. arXiv, 2017; arXiv:1703.01086. [Google Scholar]
  28. Huang, G.; Liu, Z.; Weinberger, K.Q.; Laurens, V.D.M. Densely connected convolutional networks. arXiv, 2016; arXiv:1608.06993. [Google Scholar]
  29. Cai, Z.; Fan, Q.; Feris, R.S.; Vasconcelos, N. A unified multi-scale deep convolutional neural network for fast object detection. In Proceedings of the 14th European Conference on Computer Vision, Amsterdam, The Netherlands, 8–16 October 2016; pp. 354–370. [Google Scholar]
  30. Zhu, C.; Zheng, Y.; Luu, K.; Savvides, M. CMS-RCNN: Contextual Multi-Scale Region-based CNN for Unconstrained Face Detection. In Proceedings of the IEEE Conference on Computer Vision and Pattern Recognition (CVPR 2016), Seattle, WA, USA, 27–30 June 2016. [Google Scholar]
  31. Kang, M.; Ji, K.; Leng, X.; Lin, Z. Contextual Region-Based Convolutional Neural Network with Multilayer Fusion for SAR Ship Detection. Remote Sens. 2017, 9, 860. [Google Scholar] [CrossRef]
  32. He, K.; Zhang, X.; Ren, S.; Sun, J. Deep Residual Learning for Image Recognition. In Proceedings of the European Conference on Computer Vision, Amsterdam, The Netherlands, 8–16 October 2016; pp. 770–778. [Google Scholar]
Figure 1. (a) Horizontal region detection with large redundancy region; bounding boxes A and B merge into C in the final prediction. (b) Rotation region detection with fitting detection region.
Remotesensing 10 00132 g001
Figure 2. Overall framework of Rotation Dense Feature Pyramid Networks (R-DFPN).
Remotesensing 10 00132 g002
Figure 3. A multiscale feature pyramid connection. Each feature map is densely connected, and merged by concatenation.
Remotesensing 10 00132 g003
Figure 4. General representation of bounding box.
Remotesensing 10 00132 g004
Figure 5. Multiscale detection results. First row: ground-truth (some small objects are not labeled, such as first column); Second row: detection results of R-DFPN.
Remotesensing 10 00132 g005
Figure 6. (a) Detection result of horizontal region detection (missed detections appear, due to the non-maximum suppression); (b) Horizontal ground-truth; (c) Detection result of rotation region detection; (d) Rotation ground-truth.
Remotesensing 10 00132 g006
Figure 7. Visualization of the Multiscale Region of Interest (ROI) Align. Semantic and spatial information is completely preserved. Odd columns are the feature maps of the objects, and even columns are the objects.
Remotesensing 10 00132 g007
Figure 8. The impact of different combinations of anchors and proposals on the experimental results.
Remotesensing 10 00132 g008
Figure 9. The P-R curves of different methods.
Remotesensing 10 00132 g009
Figure 10. False alarms caused by different disturbances. (a) Roofs; (b) Container pile; (c) Dock; (d) Floating objects.
Remotesensing 10 00132 g010
Figure 11. The sensitive relationship between IoU overlap and ship angle. The red box is the ground-truth, and the green box is the test result. (a) Misjudged due to low IoU; (b) New evaluation criteria.
Remotesensing 10 00132 g011
Table 1. Comparison of the performance of each detection method under the confidence score threshold of 0.5 (based on FPN frameworks, except Faster-RCNN). R, P, F represent Recall, Precision, and F-measure, respectively. Bold numbers are the highest indicator values of all methods.
Detection MethodDense Feature PyramidRotation AnchorROI AlignPool SizeR (%)P (%)F (%)
Faster×××7 × 762.796.676.0
FPN×××7 × 775.597.785.2
RRPN××7 × 768.871.169.9
R2CNN×××7 × 7, 16 × 3, 3 × 1680.888.784.6
R-DFPN-1××7 × 782.686.684.5
R-DFPN-2×7 × 784.788.886.7
R-DFPN-3×7 × 7, 16 × 3, 3 × 1685.788.186.9
R-DFPN-47 × 7, 16 × 3, 3 × 1688.291.089.6
Table 2. Training and testing time for each method.
MethodFasterFPNRRPNR2CNNR-DFPN-1R-DFPN-2R-DFPN-3R-DFPN-4
Train0.34 s0.5 s0.85 s0.5 s0.78 s0.78 s1.15 s1.15 s
Test0.1 s0.17 s0.35 s0.17 s0.3 s0.3 s0.38 s0.38 s
Table 3. Results under the new evaluation criteria. Bold numbers are the highest indicator values of all methods.
Detection MethodR (%)P (%)F (%)
Faster62.796.676.0
FPN75.597.785.2
RRPN73.475.174.2
R2CNN84.290.887.4
R-DFPN90.594.192.3

