Article

The Role of Climate and Land Use in the Changes in Surface Albedo Prior to Snow Melt and the Timing of Melt Season of Seasonal Snow in Northern Land Areas of 40°N–80°N during 1982–2015

Finnish Meteorological Institute, Meteorological Research Unit, FI-00101 Helsinki, Finland
*
Author to whom correspondence should be addressed.
Remote Sens. 2018, 10(10), 1619; https://doi.org/10.3390/rs10101619
Submission received: 14 August 2018 / Revised: 5 October 2018 / Accepted: 9 October 2018 / Published: 11 October 2018
(This article belongs to the Special Issue Remotely Sensed Albedo)

Abstract

:
The rapid warming of the Northern Hemisphere high latitudes and the observed changes in boreal forest areas affect the global surface albedo and climate. This study looks at the trends in the timing of the snow melt season as well as the albedo levels before and after the melt season in Northern Hemisphere land areas between 40°N and 80°N over the years 1982 to 2015. The analysis is based on optical satellite data from the Advanced Very High Resolution Radiometer (AVHRR). The results show that the changes in surface albedo already begin before the start of the melt season. These albedo changes are significant (the mean of absolute change is 4.4 albedo percentage units per 34 years). The largest absolute changes in pre-melt-season albedo are concentrated in areas of the boreal forest, while the pre-melt albedo of tundra remains unchanged. Trends in melt season timing are consistent over large areas. The mean of absolute change of start date of melt season is 11.2 days per 34 years, 10.6 days for end date of melt season and 14.8 days for length of melt season. The changes result in longer and shorter melt seasons, as well as changed timing of the melt, depending on the area. The albedo levels preceding the onset of melt and start of the melt season correlate with climatic parameters (air temperature, precipitation, wind speed). The changes in albedo are more closely linked to changes in vegetation, whereas the changes in melt season timing are linked to changes in climate.
Keywords:
snow; albedo; climate

Graphical Abstract

1. Introduction

Climate change over the Northern Hemisphere high latitudes and boreal forest zone has affected the snow and vegetation cover and, thus, the surface albedo [1,2,3,4,5,6,7,8,9,10,11,12]. Previous studies have shown that the duration and timing of the snow melt season has changed differently in different areas [13,14,15,16,17]. The snow cover extent has decreased especially significantly in the spring [3,5,7], and the surface albedo during the melt season months has also decreased, largely due to a decline in the area covered by snow [10]. These changes affect the local and global energy budgets [6]. The changing climate also changes the vegetation. The increased size of vegetation decreases wintertime albedo by covering the land surface and casting larger shadows on snow-covered surfaces. This is particularly relevant in the late winter. Changes in vegetation affect the local climate and the scattering properties of the forest (with larger shadows and increased multiple scattering due to increased forest height or density) [11]. The changes in the vegetation are also linked to changes in the spatial coverage of permafrost.
Changes in the timing and duration of the melt season, as well as in the surface albedo, are important parameters for climate models [18,19]. They can be used as comparison data for model parameters during the run. More accurate information on these parameters is needed to improve the models. In particular, the albedo of vegetated surfaces overlain by snow, such as boreal forests, introduce uncertainty to the model outputs [20,21,22].
Changes in the albedo of snow-covered surfaces can be caused by changes in a number of variables, such as climate, impurities in snow, vegetation, permafrost and changes in the properties of the snow surface [23,24,25,26,27]. Some of these factors also interact with each other. For example, changes in air temperature, precipitation, and wind speed affect both the snow cover extent and snow surface properties, which in turn change the snow surface albedo [10,24,27]. The optical scattering properties of a snow surface are most heavily determined by grain size and shape [28], with grain size being the main physical factor responsible for snow-albedo variations [24]. These, together with climatic factors such as wind, air temperature, and the existence of vegetation affect snow surface roughness, which also affects the brightness of the surface [29,30].
The vast area covered by seasonal snow provides a reason to study it at global scale. This can be characterized using satellite remote sensing. Snow cover and surface albedo have been analyzed from satellite data for decades [31,32,33]. The first studies covered small areas and short periods of time, and the available data was limited in coverage and resolution. These studies form the basis for the new satellite-derived data records, which offer better spatial and temporal coverage and, thus, enable climatic studies of various key parameters. The timing of the melt season has typically been estimated using passive microwave satellite data [14,15], which are sensitive to the presence and amount of liquid water. Therefore, microwave data are good at detecting changes in the snow moisture content, but do not react to thin snow covers, which affect the surface albedo significantly, but have very low liquid water content. Moreover, microwave data cannot easily differentiate between wet snow and wet ground. Surface albedo data have also been used to determine the timing of melt season [34], but the spatial and temporal coverage of these studies has been limited. There are many different definitions for the start and end of melt [35]. One way to define these dates is to use the time when the open areas are less than half covered with snow [35]. The choice of definition depends on the intended application of the data.
Previous studies on snow cover have shown a decrease in the area covered by snow, as in the melt season albedo [2,3,5,10], but whether or not climate change has caused the albedo of the snow surface to change prior to the onset of melt has so far been unclear. Studies of changes in snow season surface albedo have typically been based on either specific calendar months assumed to represent the melt season [10], or on the maximum albedo of the snow season [36]. This paper presents a study of the changes in the surface albedo of the land areas of the Northern Hemisphere between latitudes 40°N and 80°N prior to the melt season. This has an effect on the global energy budget, as well as the length of the melt season and the surface albedo during the melt season. The study also investigates the changes in the timing of the melt season. The analysis utilizes 5-day mean surface albedo data, derived from optical satellite data for the years 1982 to 2015, to determine the start and end dates of the melt season and the corresponding surface albedo levels. The trends of these parameters over the 34-year period and their relationships to land use and trends in climatic parameters are also investigated.

2. Data

This study is based on the 5-day mean surface albedo data of the Satellite Application Facility for Climate Monitoring (CM SAF, funded by EUMETSAT) CLouds, Albedo and RAdiation second release Surface ALbedo (CLARA-A2 SAL) data record [37,38], which is constructed using Advanced Very High Resolution Radiometer (AVHRR) data. The albedo is defined as the broadband shortwave directional-hemispherical reflectance, i.e., the black-sky albedo. The retrieved albedo corresponds to the wavelength range 0.25–2.5 µm and the observations are averaged to a 0.25° × 0.25° grid, which is also the resolution of the final product. The albedo values are given in the range 0–100%. At the time of the analysis this was the longest available homogeneous data record of surface albedo.
The basis of the derivation of the 5-day mean albedo product used here is similar to CLARA-A1 SAL [39]. The albedo values for a five day period are first determined by observation and then averaged. After cloud masking the satellite data, the effect of topography and inclined slope and related shading on location and reflectance of the satellite data is corrected. The land pixels are then corrected for atmospheric effects on the radiation. The atmospheric correction utilizes a dynamic aerosol optical depth (AOD) time series [40] as input. The AOD time series was constructed using the total ozone mapping spectrometer (TOMS) and ozone monitoring instrument (OMI) aerosol index data [40]. The scattering properties of the surface are described by bidirectional reflectance distribution functions (BRDF) for different land-use types. The land-use classes are derived from four different land-use classifications, using always the classification which has been constructed from data that is temporally closest to the observation in question. Finally, the 0.6 and 0.8 micrometer (AVHRR channels 1 and 2) albedos are converted into broadband albedo. The reflectance characteristics of snow surfaces vary between different snow types [41]. Therefore the albedo of snow- and ice-covered areas is derived by averaging the broadband bidirectional reflectance values of the AVHRR overpasses into pentad and monthly means. The albedo of open water, such as oceans, is constructed using solar zenith angle and wind speed. The existence of sea ice is verified using the Ocean and Sea Ice Satellite Application Facility (OSI SAF) sea ice extent data [42].
The data record has been validated against in situ data and compared with the Moderate Resolution Imaging Spectroradiometer (MODIS) MCD43C3 edition 5 data set [43,44]. The mean relative retrieval error of CLARA-A2 SAL is −0.6%, the mean root mean square error (RMSE) is 0.075 and the decadal relative stability (over Greenland Summit) is 8.5%. Larger differences between the in situ measurements and the satellite-based albedo value are mostly related to the heterogeneity of the land surface within CLARA-A2 SAL pixels [45]. A comparison between CLARA-A2 SAL and MODIS MCD43C3 showed that the two products are in good agreement. The relative difference between the two products is typically between −10% and 10%, with the global mean CLARA-A2 SAL surface albedo being 2–3% higher than the MCD43C3 global mean surface albedo for some periods. One has to take into account that the SAL product includes a topographic correction in mountainous areas, whereas the MODIS product does not [43], and that mountains typically cause underestimation of albedo due to shadowing [37]. The water areas are excluded from the comparison as the MODIS product is not defined over water areas or sea ice.
Our study utilizes the global version of the CLARA-A2 SAL products and covers the land areas between latitudes 40°N and 80°N, and the years from 1982 to 2015. Using a 5-day mean albedo limits the role of possible individual low-quality albedo values with large retrieval errors (due to observation geometry, cloud contamination or geolocation error). Furthermore, using sigmoid fitting (described in Section 3) for the analysis limits the effect of possible erroneous individual mean albedo values.
The influence of climatic parameters on melt season and albedo was studied using ERA-Interim reanalysis data [46] for 14 day period before the previously defined date for the onset of melt. The parameters extracted from the data were air temperature (2 m), wind speed (10 m above ground), accumulated precipitation, amount of snow fall (giving also the accumulated rain) and the number of days on which the maximum temperature during that period was above 0 °C, −4 °C and −10 °C. These parameters were chosen due to their possible effect on snow reflectance, metamorphism and albedo. The air temperature affects the amount of liquid water and heat flux within the snow pack. Wind can affect the surface albedo by affecting the mechanical breaking of the surface crystals, by producing wind related surface structures such as ripples and ablation and accumulation areas. It can also affect the amount of vegetation visible above the snow surface and fraction of bare ground by removing snow partly or altogether from some areas. It also typically affects the amount of snow on trees. In the case of evergreen trees, this can have a significant effect on surface albedo. Precipitation can affect the surface albedo through adding fresh snow crystals on the surface and on vegetation and by affecting the snow depth. In the case of rain-on-snow, this can bring heat into the snow pack thus affecting the melt processes. The three temperature thresholds were chosen based on the relationship between air temperature, snow metamorphism and albedo. The 0 °C was chosen since it is the melting point for snow in normal conditions. The −4 °C was used to take into account the fact that snow metamorphism starts already at sub-zero temperatures. In the wide variety of snow albedo models, the simplest parameterizations presume a steady albedo for colder temperatures, and then a linear decline in snow surface albedo for air temperatures from −5 °C to 0 °C. At −4 °C the heating of the sun can already affect the snow surface crystals; −10 °C was chosen to represent a temperature at which the air temperature does not considerably affect the snow surface crystals, so if the maximum temperature of the day stays colder than this it can be presumed there is no change in the snow surface due to the temperature. The data was originally in 6-hourly temporal resolution (for snow fall 12 hourly) from which it was further processed to daily values. The resolution of the ERA-Interim data was 0.25°.
The role of land use in the trends in melt season albedo and timing is assessed using data from GlobCover2009 [47]. The data was coarsened to the same resolution as the melt season data (0.25°) by choosing the most common land-use class within the melt season grid cell. Figure 1 shows the GlobCover data at CLARA-A2 SAL resolution. The GlobCover land-use classes present in the study area are listed in Table 1.

3. Methods

The melt season parameters were determined by fitting sigmoids to CLARA-A2 SAL pentad (5 day) mean albedo values using non-linear regression [48]. For each grid cell and year the 5-day mean albedo values from the end of January until the end of August were used for the sigmoid fitting. Figure 2 shows two examples of sigmoid fitting. To include all changes in albedo during the melt season, the dates of snow melt at the onset was taken to be the date at which the sigmoid reached 99% of its variation range (i.e., a change of 1% (relative) from the pre-melt albedo level). Likewise the end of the snow melt season was defined to be the date at which the sigmoid reached 1% of its variation range. These thresholds were chosen in order to include the whole dynamic change in surface albedo during melt season. The length of the melt season was then the difference between the start and end date of melt. The albedo values corresponding to the dates of the onset and end of melt were used as the representative albedo values preceding and following the melt season.
In some cases the snow melt onset could not be determined, because the melt had already started before the first cloud-free albedo pentad of the year was available for the grid cell in question. The final analyses included only the grid cells for which (1) both the snow melt onset and end days were retrieved successfully; (2) the albedo difference between the start and end date of melt was larger than 5% absolute albedo units; and (3) data meeting these two criteria were available for at least 10 years. The mean values of R2 and RMSE of the final sigmoid regressions were 0.989 and 5.55 (albedo percentage), respectively. The corresponding median values were 0.993 and 4.75. In the analyses only the grid cells for which R2 > 0.95 and RMSE < 20 (for the sigmoid fitting) were included. This lead to discarding about 2% of the data. The final dataset consisted of 2.46 million grid cell level melt seasons. Figure 3 shows the number of years with successful melt season retrievals per resolution unit.
The effect of random error in the albedo data on the derivation of the melt season timing was estimated by using 6 different sigmoids with different levels of albedo prior to melt. After constructing artificial data around these sigmoids, the data was modified by introducing relative random error of +12.5% to −12.5% to it. This error is larger than the level of typical variation of albedo values. These data with random error were then used to produce sigmoids and to extract the melt season parameters. The analysis was repeated for 100 different cases for each of the six chosen pre-melt levels with random error. The effect of relative random error in the albedo data on the start date of melt was 1.3 days (standard deviation) and 1.1 days for the end dates of melt.
The trends for the melt season parameters (start and end times of melt, the length of the melt season and albedo levels before and after the melt season) for each grid cell over the 34 years were detected using linear regression. The trends were determined using rolling 5-year means. Only 5-year means with data from at least 3 years were included in the trend fitting, and the fitting was carried out only for grid cells that had at least 20 mean values during the 34 years. This gave 72092 grid cell level estimates of trends in pre melt season albedo. From these 30% had R2 larger than 0.5.
The climatic dependencies of the melt season parameters were studied using ERA-Interim re-analysis data [46] for air temperature at 2 m, precipitation and wind speed prior to melt. The time interval used in the analysis was 14 days prior to melt. Correlation analysis between ERA-Interim climate data and surface albedo or day of onset of melt were carried out only for the grid cells for which data were available for at least 20 years. The analysis was performed by looking at the linear correlation coefficient between the melt season parameter in question and the climatic parameters.
The GlobCover2009 land-use data set (Figure 1) was coarsened to the same resolution as the melt season data (CLARA-A2 resolution of 0.25°). The area of the boreal forest was determined by looking at GlobCover classes 70, 90 and 100. The tundra areas were determined as the grid cells with land-use class 140, 150 and 200 that are north of 55°N in North America and 65°N in Europe.

4. Results

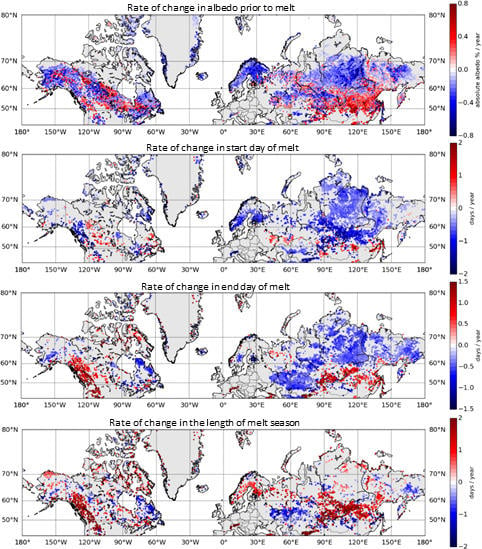
4.1. Albedo Before and After the Melt Season

The change in albedo of Northern Hemisphere land areas between 40°N and 80°N before the melt season shows large spatial variations (Figure 4). The changes are concentrated in large areas with homogeneous change characteristics. These areas are listed in Table 2. The areas are shown on a map together with place names in Figure 5. For the observations with clear trends (R2 > 0.5, 30% of all observations) the pre-melt albedo decreased by 2.4 absolute albedo percentage units on average over the whole study area over the 34 years of record. The statistically reliable trends in pre-melt season albedo are concentrated in the region of the boreal forest zone. This can be seen in Figure 4b, which shows the land-use classes for the resolution units with albedo trends with R2 > 0.5. The trends in the boreal forest zone show decreasing pre-melt albedo in the southern half of the Central Siberian Plain and Scandinavia, and increasing pre-melt albedo in the north of Mongolia and China. In North America the direction of changes varies over short distances, whereas in Eurasia there are larger areas with similar direction of change in albedo.
Most of the tundra areas show no significant change in albedo prior to melt. This can be seen in Figure 4c, which shows the R2 values for all albedo trend retrievals. For all the areas with an R2 value, the retrieval of melt season parameters was successful, but the data show no reliable trends (having R2 values lower than 0.5). The slope values of these excluded trends are typically close to 0. In many areas the annual variability of the pre-melt albedo values is so large that even 34 years is not long enough to determine a small trend in the albedo value. In southern Eurasian tundra the pre-melt albedo shows weak negative trends, but no trends in the higher latitudes. The Kola Peninsula and northern Finnish Lapland show strong negative trends (−0.29 albedo percentage units per year).
The role of vegetation in the observed pre-melt albedo changes can be estimated by looking at the albedo levels right after the snow has melted, before the vegetation has started greening. Figure 6 shows the trends for albedo after melt as well as the corresponding R2 values for the trend fitting. The trends in the level of albedo after melt are much weaker than those in the pre-melt season albedo before melt season, which can be expected since the differences in the albedo between different biomes are much smaller than the changes in the snow cover. The post-melt albedo of the northern Eurasian tundra decreased over the study period. In more southerly areas of tundra, however, there are no clear trends. In the boreal forest zone the trends are towards lower albedo values in most of the area, except for the area west of the River Ob in Russia. One potential reason for the darkening of the boreal forest zone after the melt season could be the increased size of trees and denser forests, causing more shadowing of the surface and increased multiple scattering. The darkening of the southern tundra prior to melt could be explained by the reported shrubification of tundra [49].
The role of climate change in altering the pre-melt season albedo was studied using the linear fitting between the melt season data and the ERA-Interim reanalysis data [45] on air temperature, precipitation, wind speed and the number of days with maximum temperature above 0 °C, −4 °C and −10 °C for 14 days prior to onset of melt. Figure 7 shows the 34-year trends in air temperature, accumulated precipitation and wind speed. Changes in all these climatic parameters contributed to the changes in the pre-melt albedo (mean R2 for the whole area being 0.64 and the 80th percentile being 0.79) (Figure 4d). In the area around the borders of China, Mongolia and Russia (Figure 5) the climatic parameters explained almost all of the albedo change. The mean air temperature was the dominant influence (mean R2 = 0.51 for the whole area). It was the largest explanatory factor in particular in Yablonovyy and Verhoyansk Mountain Ranges, Northern West Siberian Plain, Kola Peninsula, Baffin Island and Central Siberian Plain.

4.2. Melt Season Timing

In addition to the changes in albedo, the timing of the melt season has also changed (Figure 8, Figure 9 and Figure 10 and Table 2). The changes are, as with albedo, significant and spatially consistent but they also vary within the study area. The observations with high values for coefficient of determination (R2 > 0.5) are concentrated in large distinct areas. The changes were in general towards longer melt seasons and earlier onset of melt. The mean start date of melt season in the pixels for which melt season data are available for the whole 34 years, became 6.1 days earlier over the 34 years. Similarly, the melt ended on average 5.2 days earlier and the melt season, therefore, became 1 day longer on average. The majority of the observations showed no clear reliable trends (Figure 11), but in many areas the changes were significant (Figure 8, Figure 9 and Figure 10). In many areas the inter-annual variation in the start and/or end dates of the melt season were so large that it was not possible to detect a statistically significant trend. In Eurasia all the parameters showed changes over large homogenous areas, but in North America the trends are typically more localized and variable.
The distribution of all the computed trends for start and end day of melt can be seen in Figure 11. The majority of the trends had R2 values lower than 0.5. and the rate of change of these were typically close to zero but slightly towards earlier onset and end of melt.
The trends in melt season timing showed no significant dependency on the land use. In the Central Siberian Plain the melt started and ended earlier (Table 2), resulting in earlier melt seasons across the whole region regardless of the vegetation type (both boreal and tundra). The decreasing trends for mean air temperature before the melt onset in the Central Siberian Plain (Figure 7a, Table 2) show similar spatial patterns as the melt season timing parameters. This can be explained by the fact that the air temperatures prior to melt are not derived from the same time of year, but change together with the start date of melt. With earlier onset of melt, the air temperatures are also derived from an earlier period. In the mid-winter the air temperature is more heavily influenced by the lack of heating from the Sun, whereas later in the spring other climatic factors start to affect the air temperature more significantly. Earlier onset of melt can be associated with colder air temperatures prior to melt onset and more rapid change in the air temperature from cold mid-winter values to melting conditions.
In the area around the borders of Russia, Mongolia and China the melt starts earlier and ends later (Table 2), resulting in longer melt seasons. This is also the case for the Canadian Rocky Mountains. In North America, the northern parts of Labrador Peninsula, which are tundra, also show trends towards a shorter melt season and earlier end of melt.
Using the climatic data from ERA-Interim, three parameters (mean air temperature, mean wind speed and accumulated precipitation) are required to explain the changes in the start date of melt, giving a mean R2 value of 0.65 for the whole study area (Figure 8). In some regions, the mean wind speed and accumulated precipitation (for 14 days prior to melt) are strongly correlated with the starting time of the melt, while the mean air temperature is not (Figure 12), thus supporting the multivariate explanation. For example, wind speed affects the start of melt more than air temperature in the Southern West Siberian Plain and the Southern Byrranga Mountains. Changes in wind conditions affect snow surface scattering by affecting sublimation, mechanical metamorphism of the surface crystals, and distribution of the snow, thus affecting the albedo and depth of snow, and the length of the melt season. The distribution of impurities, such as litter from vegetation on the snow cover, can change due to wind conditions. Impurities increase both the absorption of solar energy into the snow pack and the melt rate. Precipitation (together with air temperature) correlates with the start of melt particularly in the Yablonovyy Range and south of Taymur Peninsula. The trends in the 5-year rolling mean of climatic parameters in individual grid cells show similar spatial patterns as the melt season parameters. The trends in these areas are summarized in Table 2.

5. Discussion

The magnitude of changes in albedo prior to melt season seem to be linked strongly to vegetation characteristics, whereas the changes in melt season timing seem to be more strongly linked to climatic factors. The influence of vegetation on surface albedo prior to melt can be understood by considering the difference between the albedo of vegetation and the albedo of snow. Even a small increase in the vegetation cover can alter the surface albedo by several absolute albedo percentage units [49,50], whereas changes in climatic factors prior to melt affect the snow depth and/or the surface crystal structure, and have smaller (but still significant) impact on the surface albedo. Changes in the number of days with snow on the trees are an obvious exception to this, putting emphasis on the influence of climatic parameters on surface albedo. Increased precipitation in vegetated areas would mean increased albedo while, in open areas, such as tundra, more precipitation would more strongly affect the depth and surface crystal structure of the snow pack, with a weaker effect on the surface albedo.
The start date of melt is linked to the air temperature. Increasing temperatures would result in earlier melt onset. However, in this study the focus was on the temperature prior to melt. That means that the time period in question changes from year to year. An increase in air temperatures prior to melt onset would mean that at the start of melt the snow pack is already warmer and the surface crystals may have been affected by melt and sublimation. Conversely, lower air temperatures, such as in the area around the borders of Russia, Mongolia and China, would result in a colder snowpack, and, in the case of a thin snow cover, resulting from low rates of precipitation, colder ground. This would mean slower melt. Both the end date of melt and the length of the melt season are affected by the air temperature, snow depth, snowpack characteristics, and the ground temperature. These are all regulated by climatic factors. For changes in vegetation to cause significant changes in the melt season timing, such as observed in this study, the vegetation would need to change considerably, for example from bare ground to tree cover. At larger spatial scales, such changes take more than 34 years.
The relationship between vegetation and climate is not straightforward. Existing studies of changes in vegetation, permafrost and impurities in snow [26,51,52,53,54,55] reveal similar spatial patterns of consistent change as do the melt season parameters, but the effect is not the same in all areas. None of the aforementioned factors alone are able to explain the changes over the whole study area. In fact, they can have opposite effects on the albedo in different regions.
The inconsistency in the effects of vegetation on winter time albedo can be partly explained by the different response of vegetation to the changing climate. According to Xu et al. [26], in Eurasia the normalized difference vegetation index (NDVI) is positively correlated with warming temperature, whereas in North America the effect varies in different regions and patterns of greening and browning in North America are fragmented [26]. It is noteworthy that while the NDVI data describe growing season conditions and are thus not directly translatable to winter conditions, they should be considered an indicator of changes that may also be visible in winter, such as growth in shrub size and coverage. The observed changes in vegetation cannot be directly translated to changes in surface albedo. According to Myers-Smith et al. [56] shrub growth is responsive to different drivers in different regions. Sturm et al. [50] found that if shrubs protrude above the snow and cover 10% of the surface, the albedo will decrease by 30%. The spatial coverage of continuous permafrost shows similar spatial patterns with many of the trends for the melt season parameters. For example, at the southern edge of Central Siberian Plain and in Labrador Peninsula continuous permafrost ends in the same area as the trends for melt season change. The difference in trends for melt season parameters can be due to changes in permafrost coverage causing changes in land use, such as vegetation or formation of melt ponds, or by different response of vegetation and snow cover to climatic changes in areas with and without permafrost.

6. Conclusions

The surface albedo before the onset of melt shows clear but spatially varying trends. The clearest trends are observed in the boreal forest zone, and can be as large as 9 absolute albedo percentage units over the 34-year-long study period. This is about 10–15% of the albedo of clean snow cover with no vegetation protruding above the snow surface. At grid cell level, both the albedo prior to melt onset and the start date of the melt season are responsive to changes in air temperature, wind speed and precipitation amount, with air temperature being the most significant driving factor. At most latitudes the mean albedo before the onset of melt has decreased over the 34 years.
The timing of the melt season shows strong rates of change in localized areas. These changes are better explained by climatic factors than land-use changes. Areas with consistent homogenous changes are larger in Eurasia than in North America. In the Central Siberian Plain the melt season takes place earlier than before. In the Canadian Rocky Mountains and the area around the borders of Russia, China and Mongolia, the melt season starts earlier, ends later, and lasts longer than before.
All in all, both the timing of the melt season and the albedo prior to the melt season changed in large areas between 1982 and 2015. In most areas, both the start and end dates of the melt season have advanced, and the albedo prior to melt onset has decreased, indicating a darkening of winter snow surfaces.

Author Contributions

Data curation, K.A., T.M., E.J., A.R. and P.L.; Formal analysis, K.A.; Funding acquisition, T.M.; Investigation, K.A.; Methodology, T.M.; Project administration, K.A.; Supervision, T.M.; Writing—original draft, K.A.

Funding

This research was financially supported by the CM SAF project funded by The European Organisation for the Exploitation of Meteorological Satellites (EUMETSAT).

Acknowledgments

The authors would like to thank the CM SAF team, Vesa Laine and Kaj Andersson for their co-operation in producing the CLARA-A2 SAL data record, and Outi Meinander for supporting discussions. EUMETSAT supported financially the generation of the CLARA-A2 SAL, which is available at www.cmsaf.eu.

Conflicts of Interest

The authors declare no conflict of interest.

References

  1. Hall, A. The role of surface albedo feedback in climate. J. Clim. 2004, 17, 1550–1568. [Google Scholar] [CrossRef]
  2. Smith, N.; Saatchi, S.; Randerson, J. Trends in high northern latitude soil freeze and thaw cycles from 1988 to 2002. J. Geophys. Res. 2004, 109, D12101. [Google Scholar] [CrossRef]
  3. Déry, S.; Brown, R. Recent Northern Hemisphere snow cover extent trends and implications for the snow-albedo feedback. Geophys. Res. Lett. 2007, 34, L22504. [Google Scholar] [CrossRef]
  4. Solomon, S.; Qin, D.; Manning, M.; Averyt, K.; Marquis, M.; Averyt, K.B.; Tignor, M.; Miller, H.L. Climate Change 2007: The Physical Science Basis; Working Group I Contribution to the Fourth Assessment Report of the IPCC; Cambridge University Press: Cambridge, UK; New York, NY, USA, 2007; Volume 4. [Google Scholar]
  5. Brown, R.D.; Robinson, D.A. Northern Hemisphere spring snow cover variability and change over 1922–2010 including an assessment of uncertainty. Cryosphere 2011, 5, 219–229. [Google Scholar] [CrossRef] [Green Version]
  6. Flanner, M.; Shell, K.; Barlage, M.; Perovich, D.; Tschudi, M. Radiative forcing and albedo feedback from the Northern Hemisphere cryosphere between 1979 and 2008. Nat. Geosci. 2011, 4, 151–155. [Google Scholar] [CrossRef] [Green Version]
  7. Derksen, C.; Brown, R. Spring snow cover extent reductions in the 2008–2012 period exceeding climate model projections. Geophys. Res. Lett. 2012, 39. [Google Scholar] [CrossRef]
  8. Foster, J.L.; Cohen, J.; Robinson, D.A.; Estilow, T.W. A look at the date of snowmelt and correlation with the Arctic Oscillation. Ann. Glaciol. 2013, 54, 196–204. [Google Scholar] [CrossRef]
  9. IPCC. Climate Change 2013: The Physical Science Basis; Contribution of Working Group I to the Fifth Assessment Report of the Intergovernmental Panel on Climate Change; Stocker, T.F., Qin, D., Plattner, G.-K., Tignor, M., Allen, S.K., Boschung, J., Nauels, A., Xia, Y., Bex, V., Midgley, P.M., Eds.; Cambridge University Press: Cambridge, UK; New York, NY, USA, 2013; p. 1535. [Google Scholar]
  10. Atlaskina, K.; Berninger, F.; Leeuw, G. Satellite observations of changes in snow-covered land surface albedo during spring in the Northern Hemisphere. Cryosphere 2015, 9, 1879–1893. [Google Scholar] [CrossRef]
  11. Manninen, T.; Stenberg, P. Simulation of the effect of snow covered forest floor on the total forest albedo. Agric. For. Meteorol. 2009, 149, 303–319. [Google Scholar] [CrossRef]
  12. Fassnacht, S.; Cherry, M.; Venable, N.; Saavedra, F. Snow and albedo climate change impacts across the United States Northern Great Plains. Cryosphere 2016, 10, 329–339. [Google Scholar] [CrossRef] [Green Version]
  13. Li, Q.; Ma, M.; Wu, X.; Yang, H. Snow Cover and Vegetation-Induced Decrease in Global Albedo from 2002 to 2016. J. Geophys. Res. Atmos. 2018, 123, 124–138. [Google Scholar] [CrossRef]
  14. Markus, T.; Stroeve, J.C.; Miller, J. Recent changes in Arctic sea ice melt onset, freezeup, and melt season length. J. Geophys. Res. 2009, 114, C12024. [Google Scholar] [CrossRef]
  15. Wang, L.; Derksen, C.; Brown, R.; Markus, T. Recent changes in pan-Arctic melt onset from satellite passive microwave measurements. Geophys. Res. Lett. 2013, 40, 1–7. [Google Scholar] [CrossRef]
  16. Chen, X.; Liang, S.; Cao, Y.; Cao, T.; Wang, D. Observed contrast changes in snow cover phenology in northern middle and high latitudes from 2001–2014. Sci. Rep. 2015, 5. [Google Scholar] [CrossRef] [PubMed]
  17. Malnes, E.; Karlsen, R.S.; Johansen, B.; Bjerke, J.W.; Tømmervik, H. Snow season variability in a boreal-Arctic transition area monitored by MODIS data. Environ. Res. Lett. 2016, 11, 125005. [Google Scholar] [CrossRef] [Green Version]
  18. Rautiainen, K.; Parkkinen, T.; Lemmetyinen, J.; Schwank, M.; Wiesmann, A.; Ikonen, J.; Derksend, C.; Davydove, S.; Davydovae, A.; Boike, J.; et al. SMOS prototype algorithm for detecting autumn soil freezing. Remote Sens. Environ. 2016, 180, 346–360. [Google Scholar] [CrossRef]
  19. Bhatt, U.; Walker, D.A.; Rauynolds, M.K.; Bienek, P.A.; Epstein, H.E.; Comiso, J.C.; Pinzon, J.E.; Tucker, C.J.; Steele, M.; Ermold, W.; et al. Changing seasonality of panarctic tundra vegetation in relationship to climatic variable. Environ. Res. Lett. 2017, 12, 055003. [Google Scholar] [CrossRef]
  20. Essery, R. Large-scale simulations of snow albedo masking by forests. Geophys. Res. Lett. 2013, 40. [Google Scholar] [CrossRef]
  21. Thackeray, C.W.; Fletcher, C.G.; Derksen, C. Quantifying the skill of CMIP5 models in simulating seasonal albedo and snow cover evolution. J. Geophys. Res. Atmos. 2015, 120, 5831–5849. [Google Scholar] [CrossRef] [Green Version]
  22. Abe, M.; Takata, K.; Kawamiya, M.; Watanabe, S. Vegetation masking effect on future warming and snow albedo feedback in a boreal forest region of northern Eurasia according to MIROC-ESM. J. Geophys. Res. Atmos. 2017, 122. [Google Scholar] [CrossRef]
  23. Warren, S. Impurities in snow: Effects on albedo and snowmelt (review). Ann. Glaciol. 1984, 5, 177–179. [Google Scholar] [CrossRef]
  24. Domine, F.; Salvatori, R.; Legagneux, L.; Salzano, R.; Fily, M.; Casacchia, R. Correlation between the specific surface area and the short wave infrared (SWIR) reflectance of snow. Cold Reg. Sci. Technol. 2006, 46, 60–68. [Google Scholar] [CrossRef]
  25. Ménégoz, M.; Krinner, G.; Balkanski, Y.; Cozic, A.; Boucher, O.; Ciais, P. Boreal and temperate snow cover variations induced by black carbon emissions in the middle of the 21st century. Cryosphere 2013, 7, 537–554. [Google Scholar] [CrossRef] [Green Version]
  26. Xu, L.; Myneni, R.; Chapin, F., III; Callaghan, T.; Pinzon, J.; Tucker, C.; Zhu, Z.; Bi, J.; Ciais, P.; Tømmervik, H.; et al. Temperature and vegetation seasonality diminishment over northern lands. Nat. Clim. Chang. 2013, 3, 581–586. [Google Scholar] [CrossRef] [Green Version]
  27. Wiscombe, W.J.; Warren, S.G. A model for the spectral albedo of snow. I: Pure snow. J. Atmos. Sci. 1980, 37, 2712–2733. [Google Scholar] [CrossRef]
  28. Shi, J.; Dozier, J. Estimation of Snow Water Equivalence Using SIR-C/X-SAR, Part II: Inferring Snow Depth and Particle Size. IEEE Trans. Geosci. Remote Sens. 2000, 38, 2475–2488. [Google Scholar]
  29. Warren, S.; Brandt, R.; Hinton, P. Effect of surface roughness on bidirectional reflectance of Antarctic snow. J. Geophys. Res. 1998, 103, 25789–25807. [Google Scholar] [CrossRef] [Green Version]
  30. Nagler, T.; Rott, H. Retrieval of wet snow by means of multitemporal SAR data. Trans. Geosci. Remote Sens. 2000, 38, 754–765. [Google Scholar] [CrossRef]
  31. Robinson, D.A.; Kukla, G. Albedo of a Dissipating Snow Cover. J. Clim. Appl. Meteorol. 1984, 23, 1626–1634. [Google Scholar] [CrossRef] [Green Version]
  32. Robinson, D.A.; Kukla, G. Maximum Surface Albedo of Seasonally Snow-Covered Lands in the Northern Hemisphere. J. Clim. Appl. Meteorol. 1985, 24, 402–411. [Google Scholar] [CrossRef] [Green Version]
  33. Kuittinen, R. Determination of areal snow-water equivalent values using satellite imagery and aircraft gamma-ray spectrometry. In Hydrologic Applications of Space Techology: Proceedings of an International Workshop on Hydrologic Applications of Space Technology, Held in Cocoa Beach, FL, USA, 19–23 August 1985; IAHS Press: Oxfordshire, UK; Institute of Hydrology: Wallingford, UK, 1986; Volume 160, pp. 181–189. [Google Scholar]
  34. Rinne, J.; Aurela, M.; Manninen, T. A Simple Method to determine the timing of snow melt by remote sensing with application to the CO2 balances of northern mire and heath ecosystems. Remote Sens. 1986, 1, 1097–1107. [Google Scholar] [CrossRef]
  35. Solantie, R.; Drebs, A.; Hellsten, E.; Saurio, P. Lumipeitteen tuo-, lähtö-ja Kestoajoista Suomessatalvina 1960/1961–1992/1993; Finnish Meteorological Institute, English Summary; Meteorological publications: Helsinki, Finland, 1996; Volume 34, 159p. [Google Scholar]
  36. Barlage, M.; Zeng, X.; Wei, H.; Mitchell, K.E. A global 0.05° maximum albedo dataset of snow-covered land based on MODIS observations. Geophys. Res. Lett. 2005, 32, L17405. [Google Scholar] [CrossRef]
  37. Anttila, K.; Jääskeläinen, E.; Riihelä, A.; Manninen, T.; Andersson, K.; Hollman, R. Algorithm Theoretical Basis Document: CM SAF Cloud, Albedo, Radiation Data Record Ed. 2—Surface Albedo. 2016. Available online: https://icdc.cen.uni-hamburg.de/fileadmin/user_upload/icdc_Dokumente/EUMETSAT-CMSAF/SAF_CM_FMI_ATBD_GAC_SAL_2_3.pdf (accessed on 14 August 2018).
  38. Karlsson, K.-G.; Anttila, K.; Trentmann, J.; Stengel, M.; Meirink, J.F.; Devastale, A.; Hanschmann, T.; Kothe, S.; Jääskeläinen, E.; Sedlar, J.; et al. CLARA-A2: The second edition of the CM SAF cloud and radiation data record from 34 years of global AVHRR data. Atmos. Chem. Phys. 2017, 17, 5809–5828. [Google Scholar] [CrossRef]
  39. Riihelä, A.; Manninen, T.; Laine, V.; Andersson, K.; Kaspar, F. CLARA-SAL: A global 28 yr timeseries of Earth’s black-sky surface albedo. Atmos. Chem. Phys. 2013, 13, 3743–3762. [Google Scholar] [CrossRef]
  40. Jääskeläinen, E.; Manninen, T.; Tamminen, J.; Laine, M. The Aerosol Index and Land Cover Class Based Atmospheric Correction Aerosol Optical Depth Time Series 1982–2014 for the SMAC Algorithm. Remote Sens. 2017, 9, 1095. [Google Scholar] [CrossRef]
  41. Peltoniemi, J.I.; Suomalainen, J.; Hakala, T.; Puttonen, E.; Näränen, J.; Kaasalainen, S.; Torppa, J.; Hirschmugl, M. Reflectance of various snow types: Measurements, modelling and potential for snow melt monitoring. In Light Scattering Reviews 5: Single Light Scattering and Radiative Transfer; Springer Praxis Books: Berlin/Heidelberg, Germany, 2010; Chapter 9; pp. 393–450. [Google Scholar] [CrossRef]
  42. Eastwood, S. Sea Ice Product User’s Manual OSI-401-a, OSI-402-a, OSI-403-a, Version 3.11. 2014. Available online: http://osisaf.met.no/docs/osisaf_ss2_pum_ice-conc-edge-type_v3p11.pdf (accessed on 14 August 2018).
  43. Schaaf, C.B.; Gao, F.; Strahler, A.H.; Lucht, W.; Li, X.; Tsang, T.; Strugnell, N.C.; Zhang, X.; Jin, Y.; Muller, J.-P.; et al. First operational BRDF, albedo nadir reflectance products from MODIS. Remote Sens. Environ. 2002, 83, 135–148. [Google Scholar] [CrossRef] [Green Version]
  44. Anttila, K.; Jääskeläinen, E.; Riihelä, A.; Manninen, T.; Andersson, K.; Hollman, R. Validation Report: CM SAF Cloud, Albedo, Radiation Data Record Ed. 2—Surface Albedo. 2016. Available online: https://icdc.cen.uni-hamburg.de/fileadmin/user_upload/icdc_Dokumente/EUMETSAT-CMSAF/SAF_CM_FMI_ATBD_GAC_SAL_2_3.pdf (accessed on 14 August 2018).
  45. Riihelä, A.; Laine, V.; Manninen, T.; Palo, T.; Vihma, T. Validation of the Climate-SAF surface broadband albedo product: Comparisons with in situ observations over Greenland and the ice-covered Arctic Ocean. Remote Sens. Environ. 2010, 114, 2779–2790. [Google Scholar] [CrossRef]
  46. Dee, D.P.; Uppala, S.; Simmons, A.; Berrisford, P.; Poli, P.; Kobayashi, S.; Andrae, U.; Alonso-Balmaseda, M.; Balsamo, G.; Bauer, P.; et al. The ERA–Interim reanalysis: Configuration and performance of the data assimilation system. Q. J. R. Meteorol. Soc. 2011, 137, 553–597. [Google Scholar] [CrossRef]
  47. Arino, O.; Ramos, J.; Kalogirou, V.; Defourny, P.; Achard, F. GlobCover 2009. In Proceedings of the Living Planet Symposium, Bergen, Norway, 28 June–2 July 2010. [Google Scholar]
  48. Böttcher, K.; Aurela, M.; Kervinen, M.; Markkanen, T.; Mattila, O.P.; Kolari, P.; Metsämäki, S.; Aalto, T.; Arslan, A.N.; Pulliainen, J. MODIS tile-series-derived indicators for the beginning of the growing season in boreal coniferous forest—A comparison with the CO2 flux measurements and phenological observations in Finland. Remote Sens. Environ. 2014, 140, 625–638. [Google Scholar] [CrossRef]
  49. Sturm, M.; Douglas, T.; Racine, C.; Liston, G. Changing snow and shrub conditions affect albedo with global implications. J. Geophys. Res.-Biogeosci. 2005, 110, G01004. [Google Scholar] [CrossRef]
  50. Bonan, G.B.; Pollard, D.; Thompson, S.L. Effects of boreal forest vegetation on global climate. Nature 1992, 359, 716. [Google Scholar] [CrossRef]
  51. Rigina, O. Environmental impact assessment of the mining and concentration activities in the Kola Peninsula, Russia by multidate remote sensing. Environ. Monit. Assess. 2002, 75, 11–31. [Google Scholar] [CrossRef] [PubMed]
  52. Piao, S.; Wang, X.; Ciais, P.; Zhu, B.; Wang, T. Changes in satellite-derived vegetation growth trend in temperate and boreal Eurasia from 1982 to 2006. Glob. Chang. Biol. 2011, 17, 3228–3239. [Google Scholar] [CrossRef]
  53. Buitenwerf, R.; Rose, L.; Higgins, S. Three decades of multi-dimensional change in global leaf phenology. Nat. Clim. Chang. 2015, 5, 364–368. [Google Scholar] [CrossRef]
  54. Bullard, J.; Baddock, M.; Bradwell, T.; Crusius, J.; Darlington, E.; Gaiero, D.; Gassó, S.; Gisladottir, G.; Hodgkins, R.; McCulloch, R.; et al. High-latitude dust in Earth system. Rev. Geophys. 2016, 54, 447–485. [Google Scholar] [CrossRef]
  55. Helbig, M.; Wischnewski, K.; Kljun, N.; Chasmer, L.E.; Quinton, W.L.; Detto, M.; Sonnentag, O. Regional atmospheric cooling and wetting effect of permafrost thaw-induced boreal forest loss. Glob. Chang. Biol. 2016, 22, 4048–4066. [Google Scholar] [CrossRef] [PubMed]
  56. Myers-Smith, I.H.; Elmerdorf, S.; Becl, P.; Wilmking, M.; Hallinger, M.; Blok, D.; Tape, K.D.; Rayback, S.A.; Macias-Fauria, M.; Forbes, B.C.; et al. Climate sensitivity of shrub growth across the tundra biome. Nat. Clim. Chang. 2015, 5, 887–891. [Google Scholar] [CrossRef]
Figure 1. GlobCover2009 land-use classes coarsened to melt season data resolution.
Remotesensing 10 01619 g001
Figure 2. Sigmoid fitting for 5-day mean albedo data for (a) location 55.375°N, 47.625°E for year 2006 and (b) location 68.125°N, 120.125°E for the year 2007. The growth of vegetation after snow melt is manifested in (b) where the albedo values after melt season increase slightly as the vegetation starts to produce leaves.
Remotesensing 10 01619 g002
Figure 3. Number of successful retrievals of melt season per resolution unit during the 34 years.
Remotesensing 10 01619 g003
Figure 4. (a) The rate of change in albedo before melt season (absolute albedo % per year) between 1982 and 2015 using 5 year rolling mean albedo (showing cases for which R2 of the fitting was larger than 0.5). The positive rates of change mean higher albedo and negative lower albedo values. (b) The GlobCover land-use class for the areas with clear trends in pre-melt albedo. (c) The coefficient of determination (R2) value for trends in albedo before the onset of melt. (d) R2 value for multiple variable linear correlation between albedo before melt season and 6 climatic parameters for 14 days prior onset of melt. The climatic parameters used are the mean air temperature, number of days with maximum temperature above 0 °C, −4 °C and −10 °C, accumulated precipitation and mean wind speed.
Remotesensing 10 01619 g004aRemotesensing 10 01619 g004b
Figure 5. The areas listed in Table 2.
Remotesensing 10 01619 g005
Figure 6. (a) The rates of change for the albedo after melt season (absolute albedo % per year) between 1982 and 2015 using 5-year rolling mean albedo (showing cases for which R2 of the fit was larger than 0.5). (b) The coefficient of determination (R2) value for trends in albedo after the end of melt.
Remotesensing 10 01619 g006
Figure 7. ERA-Interim trends for 1982–2015 for (a) mean air temperature (b) accumulated precipitation (c) snowfall (units are given as amount of snow converted into liquid water) (d) wind speed for 14 days prior to melt onset. The maps show trends for which the coefficient of determination was larger than 0.5.
Remotesensing 10 01619 g007aRemotesensing 10 01619 g007b
Figure 8. (a) The rates of change for the start day of melt between 1982 and 2015 using 5-year rolling mean albedo (showing cases for which R2 of the fit was larger than 0.5). The negative rates of change mean earlier onset of melt and the positive rates of change mean later dates of onset of melt. (b) The coefficient of determination (R2) values for the trend fitting for start day of melt. (c) The multiple variable correlation (R2) between ERA-Interim climate data and start day of melt. R2 value for linear correlation between the time that melt season started (day of year) and 3 climatic parameters for 14 days prior to the onset of melt. The climatic parameters used are the mean air temperature, accumulated precipitation and mean wind speed.
Remotesensing 10 01619 g008aRemotesensing 10 01619 g008b
Figure 9. (a) The rates of change for the end date of melt between 1982 and 2015 using 5-year rolling mean (showing cases for which R2 of the fit was larger than 0.5). The negative rates of change mean earlier end of melt and the positive rates of change mean later dates of end of melt. (b) The coefficient of determination (R2) values for the trend fitting for end day of melt.
Remotesensing 10 01619 g009aRemotesensing 10 01619 g009b
Figure 10. (a) The rates of change for the length of melt season between 1982 and 2015 using 5-year rolling mean (showing cases for which R2 of the fit was larger than 0.5). The negative rates of change mean shorter melt seasons and the positive rates of change mean longer melt season. (b) The coefficient of determination (R2) values for the trend fitting for length of melt season.
Remotesensing 10 01619 g010
Figure 11. The rate of change observations for (a) start and (b) end day of melt. The dashed line shows the mean value of the observations for which R2 is larger than 0.5.
Remotesensing 10 01619 g011
Figure 12. The correlation (R2) between start day of melt and (a) mean air temperature (b) total precipitation and (c) wind speed for 14 days prior to the onset of melt.
Remotesensing 10 01619 g012
Table 1. GlobCover2009 classes found to be most common within one surface albedo (SAL) resolution unit in the study area and the number of occurrences of each class as the most common land-use class in one resolution unit of melt season data.
LUC ClassLabelNumber of Occurrence
11Post-flooding or irrigated croplands (or aquatic)420
14Rainfed croplands5137
20Mosaic cropland (50–70%)/vegetation (grassland/shrubland/forest) (20–50%)5771
30Mosaic vegetation (grassland/shrubland/forest) (50–70%)/cropland (20–50%) 2996
50Closed (>40%) broadleaved deciduous forest (>5 m)7775
70Closed (>40%) needleleaved evergreen forest (>5 m)2472
90Open (15–40%) needleleaved deciduous or evergreen forest (>5 m)31415
100Closed to open (>15%) mixed broadleaved and needleleaved forest (>5 m)3605
110Mosaic forest or shrubland (50–70%)/grassland (20–50%)2299
120Mosaic grassland (50–70%)/forest or shrubland (20–50%) 1883
130Closed to open (>15%) (broadleaved or needleleaved, evergreen or deciduous) shrubland (<5 m)1371
140Closed to open (>15%) herbaceous vegetation (grassland, savannas or lichens/mosses)3869
150Sparse (<15%) vegetation28741
180Closed to open (>15%) grassland or woody vegetation on regularly flooded or waterlogged soil–Fresh, brackish or saline water1639
190Artificial surfaces and associated areas (urban areas >50%)103
200Bare areas7523
210Water bodies115239
220Permanent snow and ice11022
Table 2. The mean trends (R2 > 0.5) for all the melt season and climatic parameters in areas with observed consistently homogenous change. The trends for snowfall and rain were not included in the table due to the fact that the trends for the pre-defined regions presented in the table were so weak that they were less than the yearly variation of the parameter. All climate parameters are derived for 14 days preceding the onset of snow melt. The number of observations in the area are described in the parenthesis. The area “RCM” refers to the area around the border of Russia, China and Mongolia. The negative trends for the melt season timing mean earlier onset or end of melt and shorter melt season and the positive trend directions mean later onset and end of melt and longer melt seasons.
Pre-Melt AlbedoPost-Melt AlbedoStart Day of Melt (Days Per Year)End Day of Melt (Days Per Year)Melt Season Length (Days Per Year)Mean Air Temp. (K/Year)No. Days Above 0 °C (Days Per Year)No. Days Above > −4 °C (Days Per Year)No. Days Above > −10 °C (Days Per Year)Accum. Precip (mm/Year)Wind Speed (m/s Per Year)
Cent. Sib. Plain
7809
−0.25 (4100)−0.08 (1765)−0.61 (2486)−0.50 (2243)0.46 (317)−0.12 (370)−0.06 (359)−0.11 (373)−0.11 (399)−0.28 (169)0.01 (112)
RCM
7191
0.15 (2505)−0.09 (1872)−0.95 (1030)0.71 (577)1.51 (925)−0.25 (720)−0.09 (573)−0.14 (667)−0.18 (604)−0.58 (477)0.01 (378)
Labrador
2640
−0.09 (1111)−0.06 (603)0.28 (95)−0.59 (289)−0.94 (228)0.21 (380)0.03 (113)0.16 (193)0.19 (499)0.33 (84)0.00 (142)
Rocky Mnts
2840
−0.05 (449)−0.07 (626)−1.18 (170)1.17 (303)2.13 (280)−0.21 (254)−0.12 (197)−0.19 (243) −0.18 (197)−0.12 (127)0.01 (104)
Alaska
4866
−0.15 (1121)−0.08 (1024)−0.43 (156)−0.22 (204)0.37 (267)−0.08 (176)−0.05 (214)−0.16 (268)−0.07 (161)−0.09 (130)0.01 (101)
Europ. Arctic
3526
−0.29 (1233)−0.01 (227)−0.79 (510)−0.39 (102)0.88 (303)−0.12 (276)−0.06 (217)−0.06 (376)−0.09 (252)−0.09 (102)0.02 (121)
Canad. archip.
1796
−0.11 (222)−0.26 (432)−0.61 (79)0.03 (79)0.81 (95)0.01 (32)−0.06 (20)−0.1 (30)−0.04 (29)0.33 (27) −0.03 (83)
The Alps
299
−0.17 (22)−0.12 (34)−1.48 (28)1.53 (19)2.69 (30)−0.18 (5)−0.27 (5)−0.18 (4)−0.04 (3)−0.00 (8)−0.02 (7)

