Rapid Coastal Forest Decline in Florida’s Big Bend


1
Institute for Marine Remote Sensing, College of Marine Science, University of South Florida, 140 7th Ave. South, Saint Petersburg, FL 33701, USA
2
Benjamin Dimmitt Photography, 22 DJ Drive, Fairview, NC 28730, USA
*
Author to whom correspondence should be addressed.
Remote Sens. 2018, 10(11), 1721; https://doi.org/10.3390/rs10111721
Submission received: 28 September 2018
/
Revised: 25 October 2018
/
Accepted: 27 October 2018
/
Published: 31 October 2018
(This article belongs to the Special Issue Remote Sensing of Forest Cover Change)
Abstract
:Coastal ecosystems throughout the world are increasingly vulnerable to degradation as a result of accelerating sea-level rise and saltwater intrusion, more frequent and powerful extreme weather events, and anthropogenic impacts. Hardwood swamp forests in the Big Bend region of Florida’s Gulf of Mexico coast (USA) are largely devoid of the latter, but have degraded rapidly since the turn of the 21st Century. Photographs of the forest, collected on the ground since 2009, were used to guide an analysis of a 60 km2 study area using satellite images. The images confirm that the coastal forest area declined 0.60% from 1982 to 2003, but degraded rapidly, by 7.44%, from 2010 to 2017. The forest declined most rapidly along waterways and at the coastal marsh–forest boundary. Additional time series of aerial-photographs corroborated the onset of degradation in 2010. Degradation continued through 2017 with no apparent recovery. Previous research from the area has concluded that increased tidal flooding and saltwater intrusion, of the coastal plain, represent a chronic stress driving coastal forest decline in this region, but these drivers do not explain the abrupt acceleration in forest die-off. Local tide gage data indicate that sea-level rise is 2 mm yr−1 and accelerating, while meteorological data reveal at least two short-term cold snap events, with extreme temperatures exceeding the reported temperature threshold of local vegetation (−10 °C) between January 2010 and January 2011, followed by more extremes in 2016. The Big Bend hardwood forest experienced acute cold snap stress during the 2010–2017 period, of a magnitude not experienced in the previous 20 years, that compounded the chronic stress associated with sea-level rise and saltwater intrusion. This and other coastal forests can be expected to suffer further widespread and lasting degradation as these stresses are likely to be sustained.
Keywords:
sea-level rise; coastal forest; WorldView-2; Landsat; extreme event; cold snap; NDVI; climate change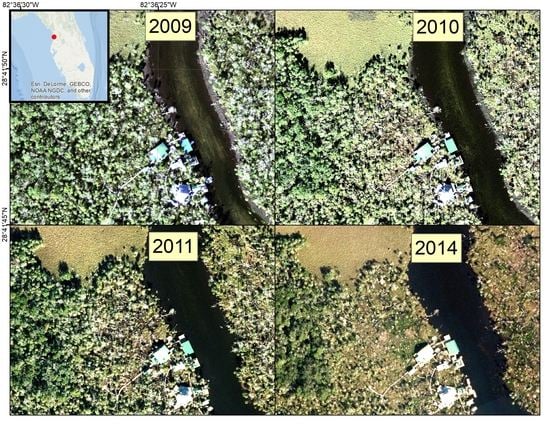
1. Introduction
Coastal natural resources, particularly those in low-lying floodplains, are threatened by the most certain, immediate, and widespread result of anthropogenic climate change—accelerated sea-level rise [1,2]. The global sea level rose at an average rate of 3.2 mm yr−1 between 1993 and 2010 [3], which was up from the rate of 2.0 mm yr−1 between 1971 and 2010. Compounding the chronic inundation due to tides, storm surges flood coastal ecosystems with increasing frequency, leading to an increase in the salinity and saturation of soils in these habitats, with diminished time between sequential disturbance [4,5]. Ecosystems that are unable to migrate landward will be most impacted, resulting in a loss of species diversity [2,6] and of the benefits to society that these areas offer. While this element of coastal vulnerability has received a great deal of attention, others have also reported degradation and die-off of coastal vegetation, such as mangroves, in recent years as a result of both chronic stress and acute events [7].
The response of coastal vegetation to sea-level rise depends on the local relative rate of sea-level change, sediment loading, freshwater hydrology, ability to migrate, and other factors. Donnelly and Bertness [8] studied the effects of sea-level rise on coastal wetlands in New England, using quadrats to evaluate percent vegetation cover change for two saltmarsh species from 1995 to 1999. In this five-year period alone, both sites experienced a five-fold increase and significant landward migration of cordgrass at the expense of high-marsh species. This coincided with sea-level rise acceleration, as measured at a nearby tide gauge. The authors attributed the increase in cordgrass dominance to region-wide sea-level rise, and connected it to an increased frequency of marsh surface flooding. In the Florida Keys, USA, Ross et al. [6] found that the salinization of groundwater, caused by a 15 cm rise in the local sea level, was a major factor in the loss of more than half of the pine forest covered area on Sugarloaf Key over a 70 year period. Koch et al. [9] projected, from regional modelling, future coastal Florida vegetation responses using a sea-level rise estimate of 46 cm by 2060. They predicted that, based on estimated rates of historical sediment accumulation in the region, coastal mangrove forests will not be able to accrete faster than the sea-level rise, and therefore will effectively drown.
Sea-level rise is often studied with regard to the potential inundation of heavily populated metropolitan areas because of the potential for economic devastation. Many cities (e.g., Miami, New York City, and others) are preparing actively to mitigate short-term sea-level rise effects. It is also important to characterize how the rising sea level is impacting low-lying coastal conservation areas.
The Big Bend region of Florida is the largest remaining stretch of undeveloped coastline in the continental United States. Geselbracht et al. [10] used a Sea Level Affecting Marshes Model (SLAMM) of the southern Big Bend to predict a loss of over 24,000 ha (49%) of coastal forest by 2100, under a scenario of a sea-level rise of one meter. Langston et al. [11] recently published the results of over 20 years of in-situ coastal forest evaluations in the Big Bend. They observed decreased coastal forest species richness, and decreased Sabal palmetto (among other species) regeneration and survival, from 1992 to 2014. They attributed the rapid declines to increased tidal flooding that was caused by sea-level rise, as determined by observed and modeled weekly flooding events. Lewis et al. [7] state that mangrove die-offs in protected areas like South Florida constitute a “heart-attack” dynamic, whereby previous changes to local or regional hydrology have created chronic stress that alone would ultimately lead to eventual ecosystem decline, but are compounded by acute events, such as hurricanes, which may accelerate the decline of the now vulnerable habitats, decrease resilience, and preclude recovery.
A decades-long time series of synoptic observations, collected by a suite of satellite sensors, can be used to better quantify changes estimated by previous modeling efforts [12]. The Landsat mission series, for example, has acquired optical data of the globe since the early 1980’s at a spatial resolution of 30 m. More recently, very-high-spatial-resolution (i.e., <5 m) satellite data have been collected, and compliment the longer time series with more precise observations of land change.
In this study, we used time series of satellite images and aerial photography to assess change in coastal forests of the Big Bend region of Florida from 1982 to 2017. Our working hypothesis was that the rapid decline of vegetation reported by Langston et al. [11] as a result of sea-level-rise is exacerbated by one or more acute meteorological events, including extreme cold temperatures that drove some of the vegetation over a threshold and into rapid decline, from which it has yet to recover.
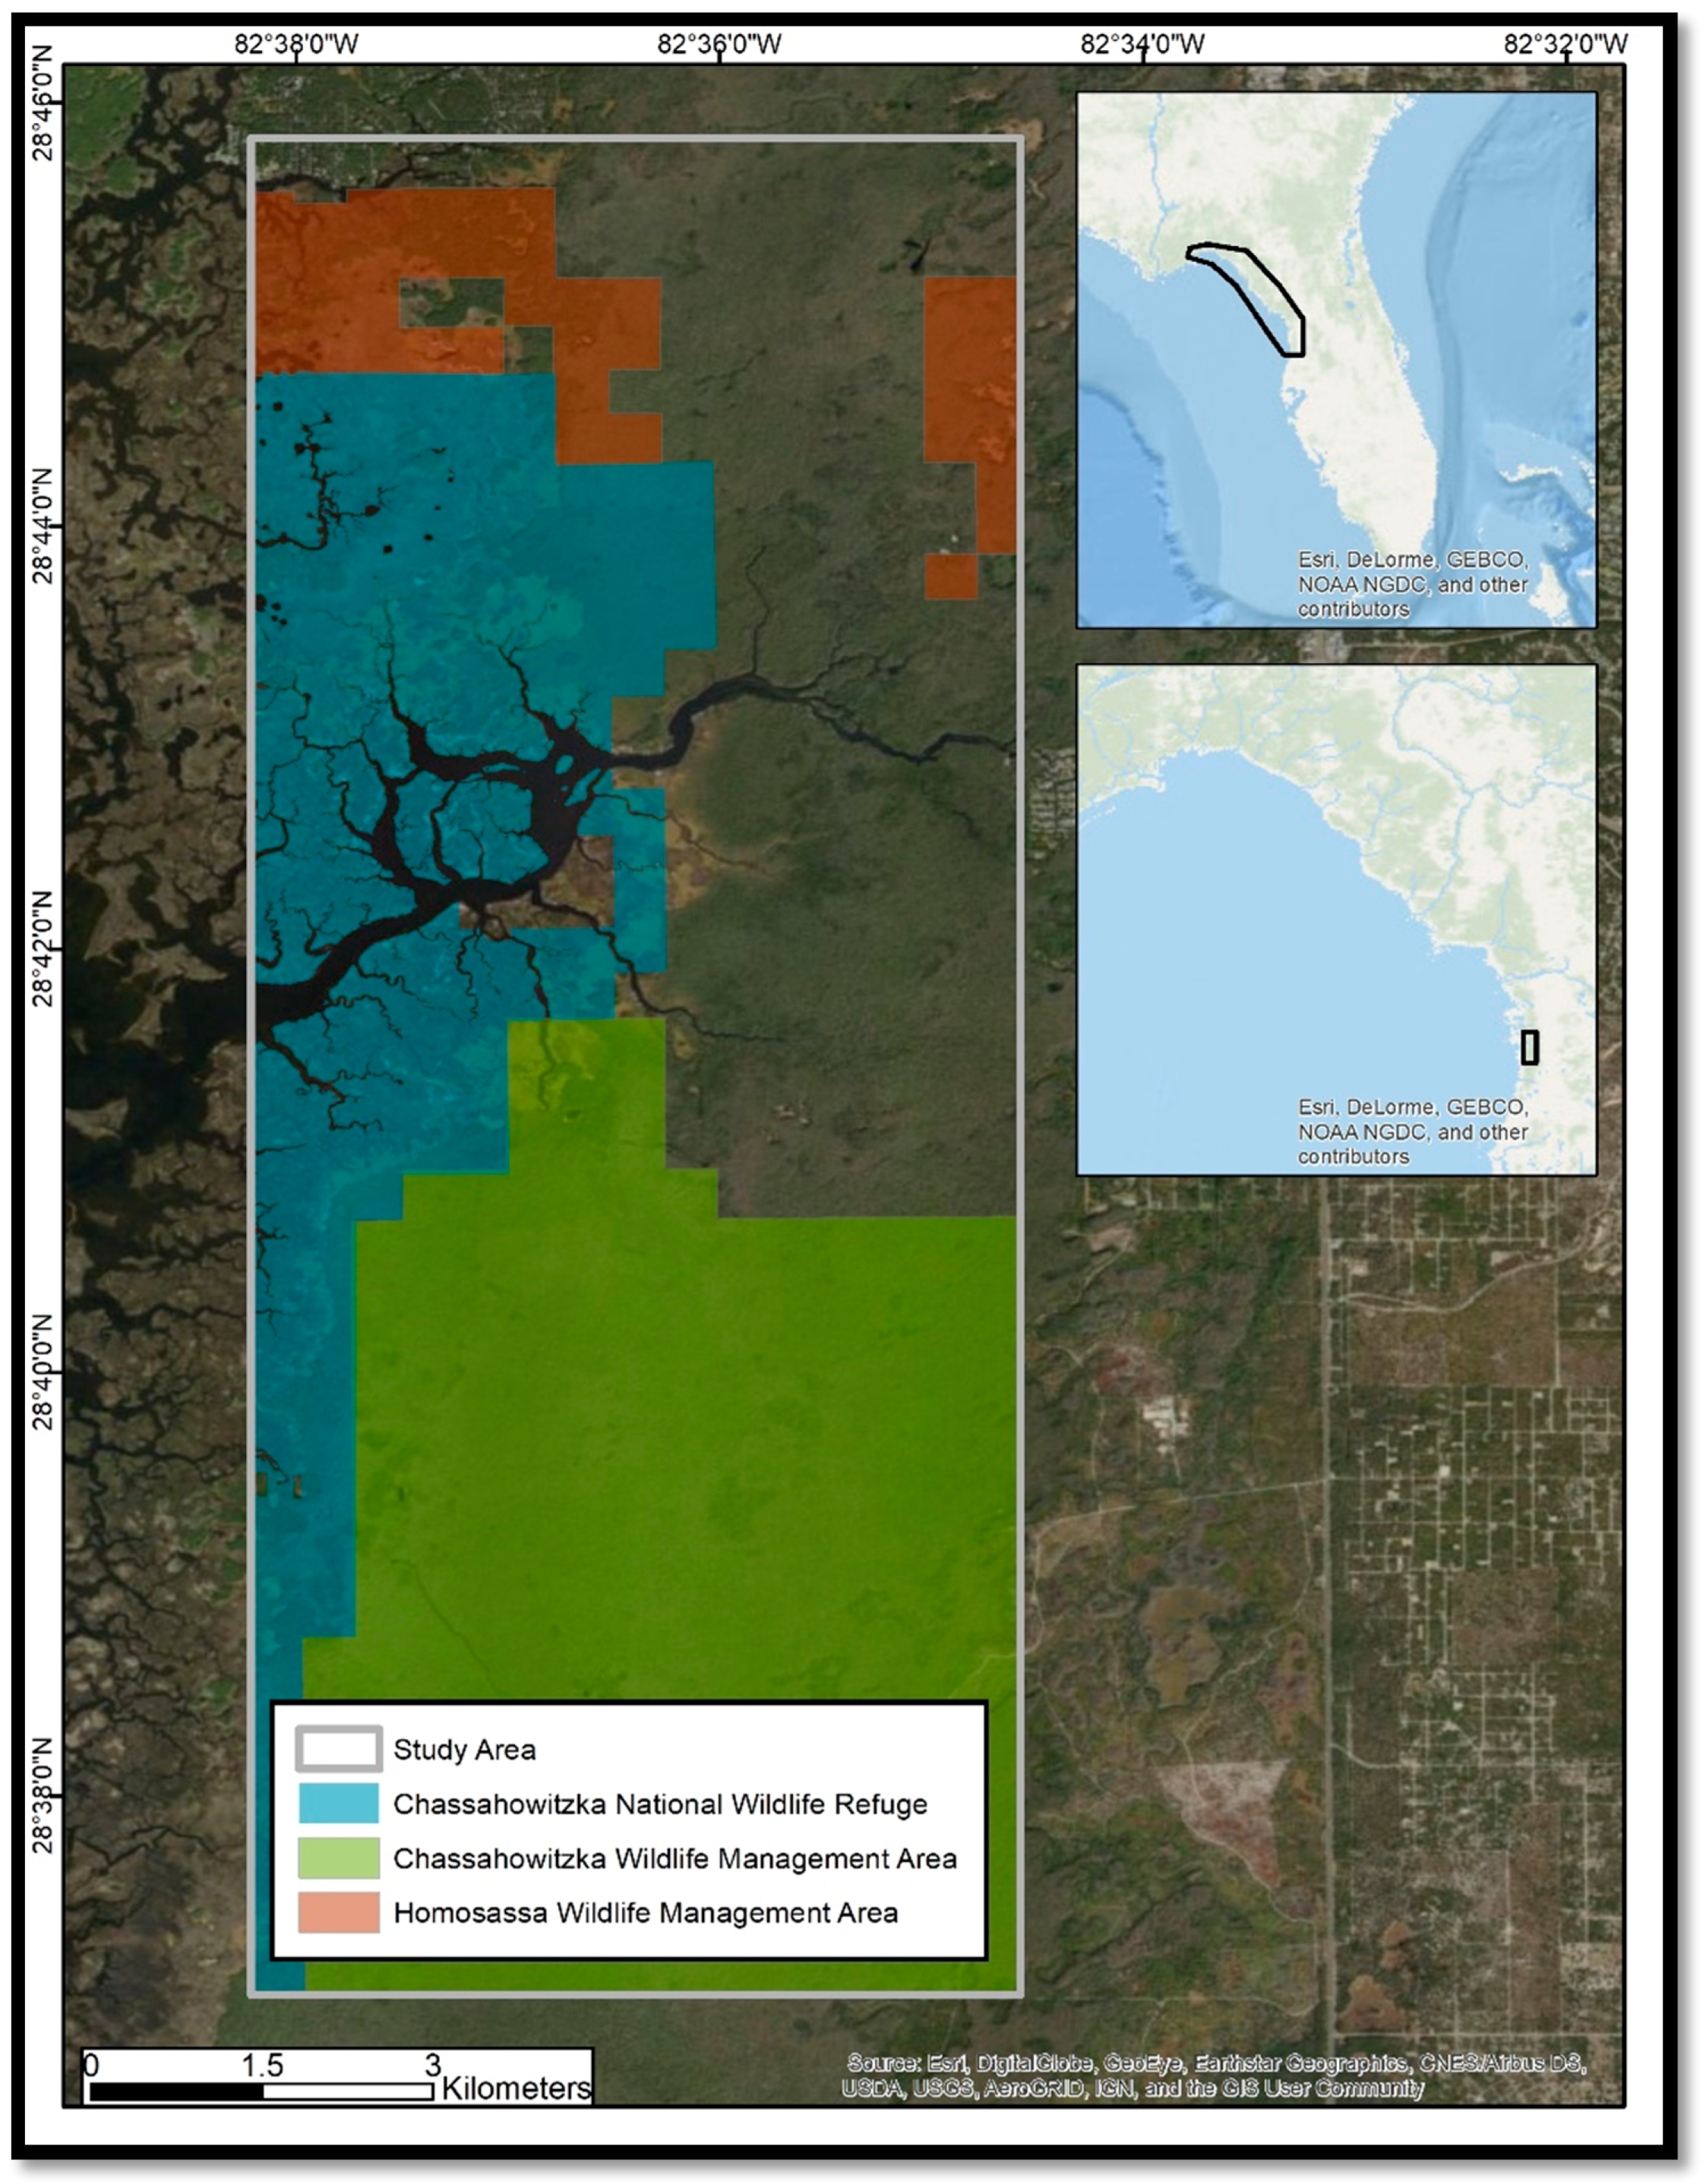
The study area intersects three management areas: The Chassahowitzka National Wildlife Refuge (CNWR), the Chassahowitzka Wildlife Management Area, and the Homosassa Wildlife Management Area (Figure 1). Swampland extends from the coast, approximately 8 km inland, and ranges in elevation from 0 to less than 3 m. Much of this ecosystem is tidally influenced, and fed upstream by a series of freshwater springs. Urban and other human development is sparse in this region. The natural vegetation inland of the tidal marsh is primarily mixed hardwoods, including Acer floridanum, Persea borbonia, Quercus virginiana, and Sabal palmetto, which vary in their tolerance to salinity and cold temperatures. Much of the swamp area consists of poorly drained organic soils atop limestone of the Floridan aquifer system [13].
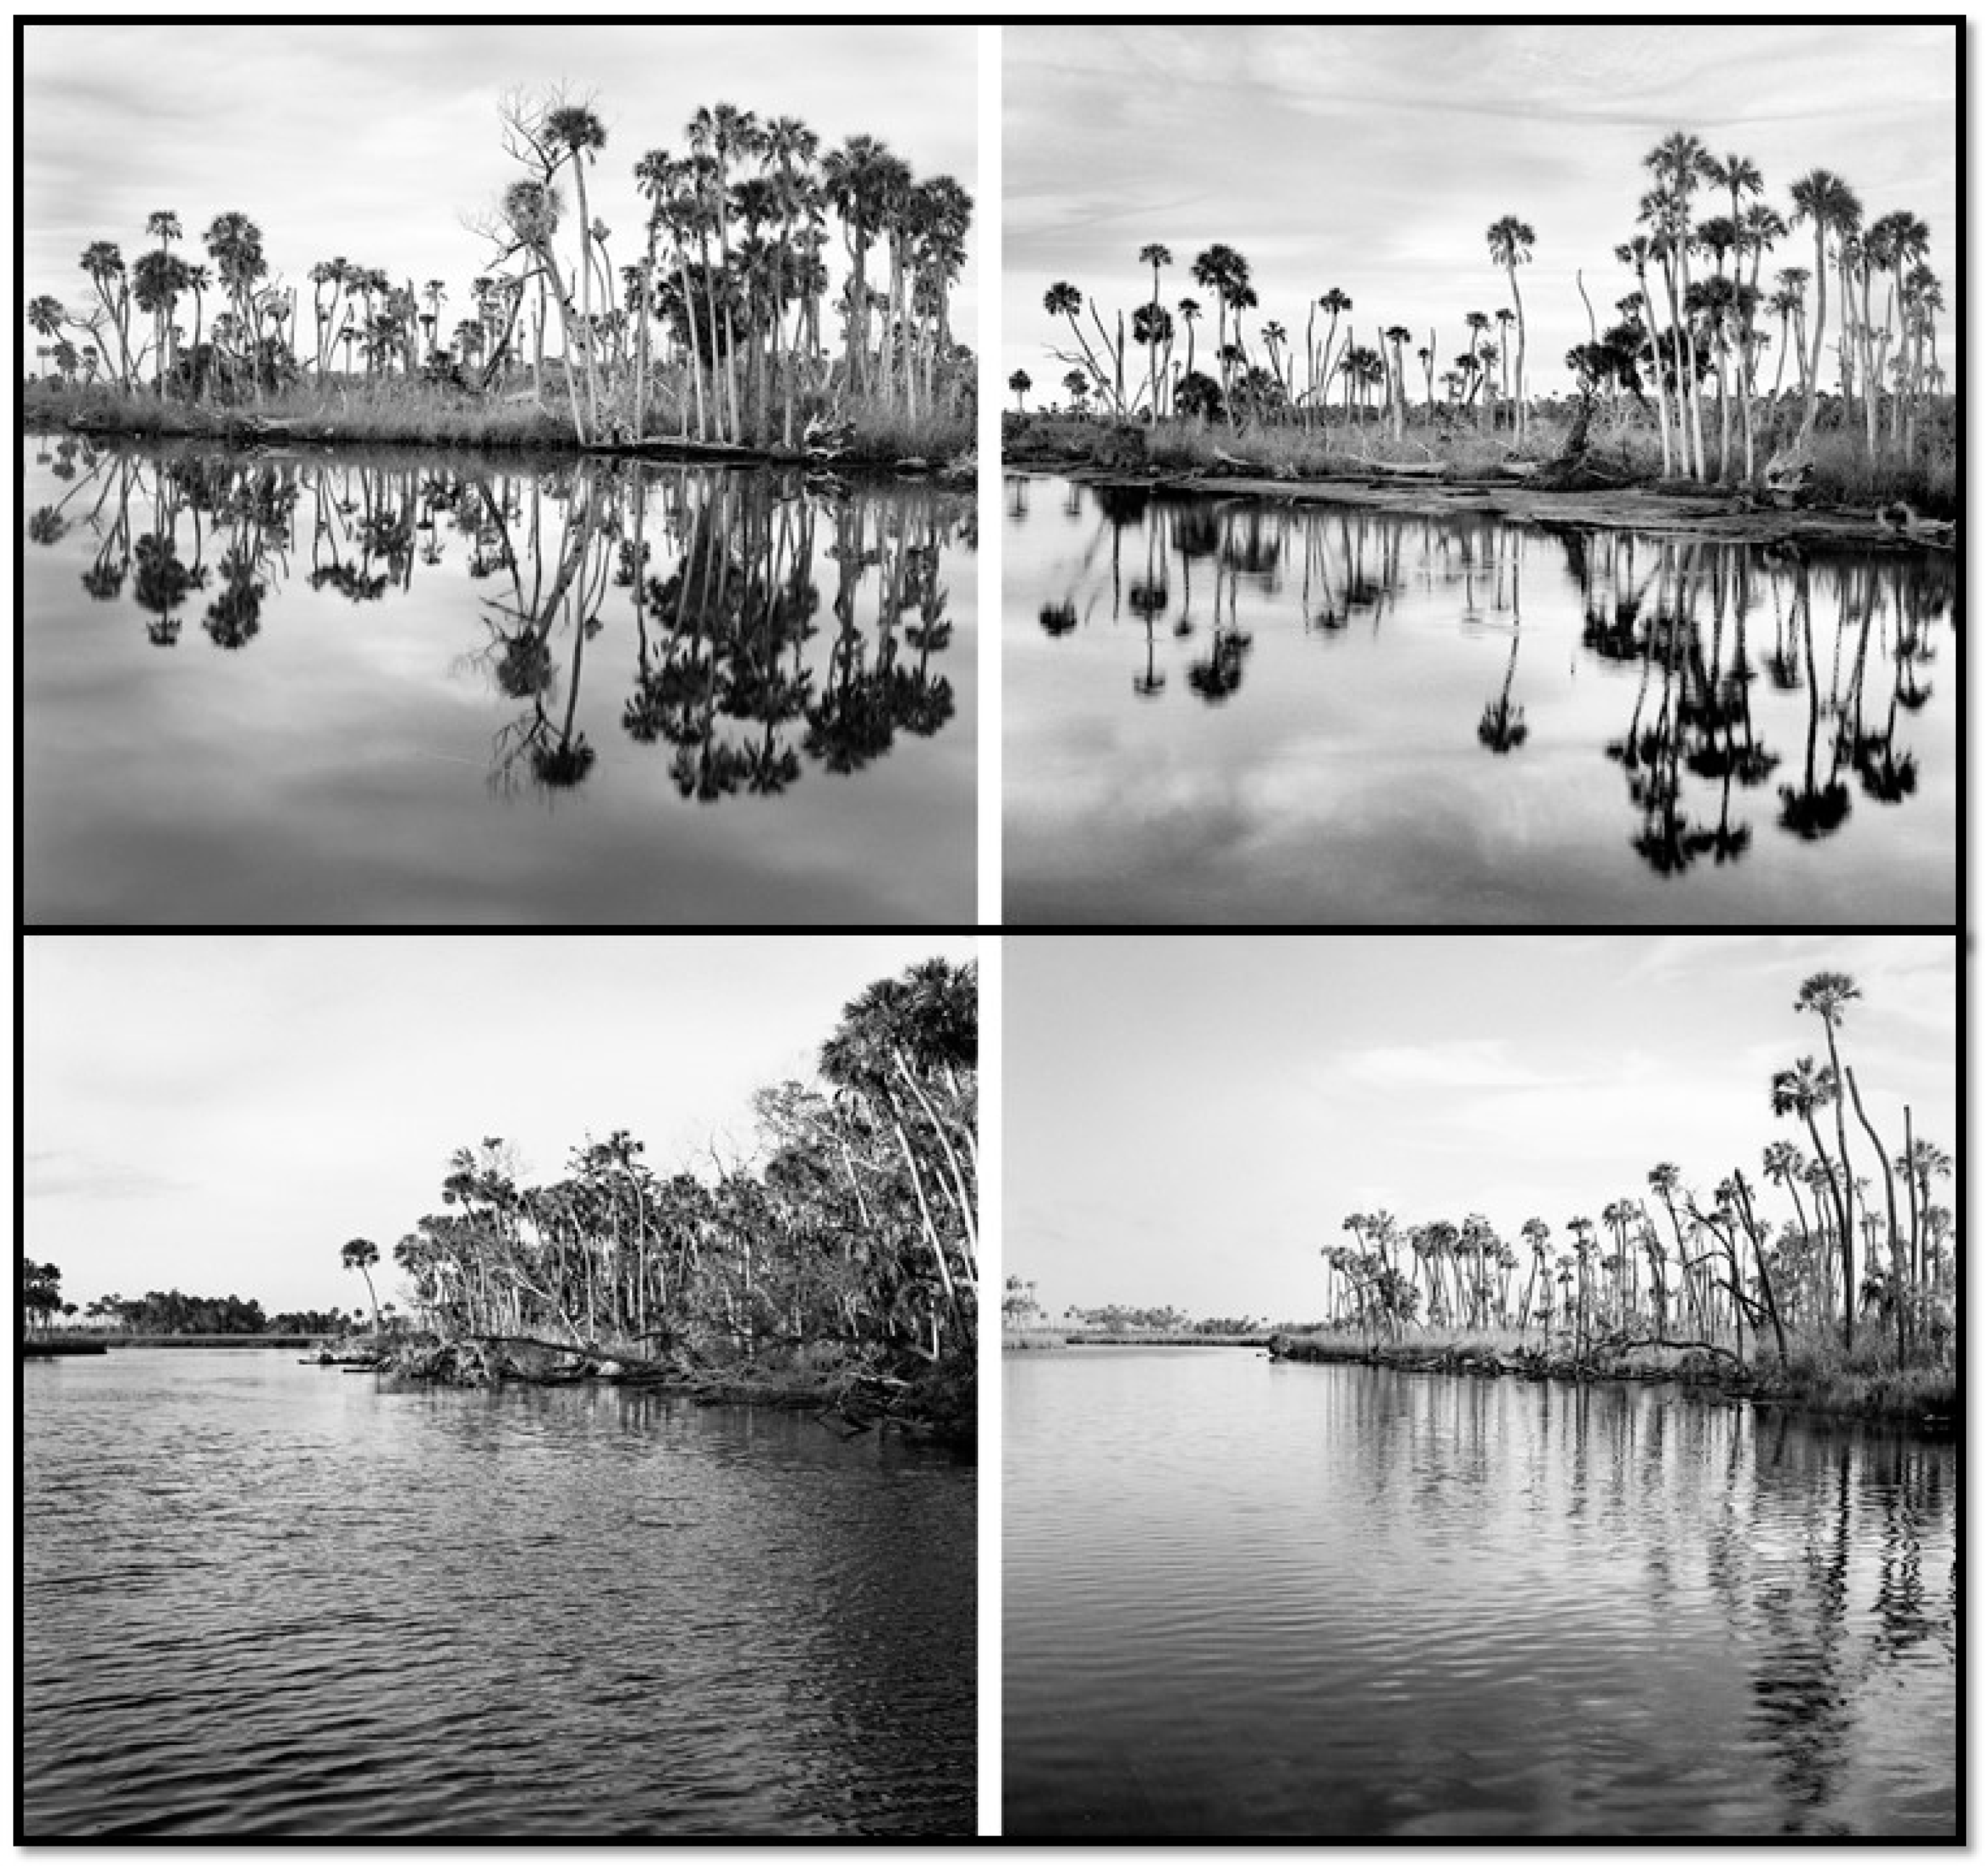
An increasing prevalence of dead palm trees on coastal islands within the study area has been attributed to sea-level rise [13], but the geographic extent of the damage has not yet been quantified. Between 2009 and 2016, co-author Benjamin Dimmitt documented some of the degradation along waterways in and around CNWR using photographs collected from the ground (Figure 2). The CNWR Comprehensive Management Plan [13] has acknowledged that climate change impacts are expected to become more frequent and severe in the 2012–2027 timeframe, although the uncertainty of the severity and extent of the impacts is high. The synergistic effects of sea-level rise and increased storm surges will likely compound the threat to these coastal habitats.
2. Materials and Methods
To visually assess the change in vegetation for the areas shown in Mr. Dimmitt’s photos, we examined aerial photographs for the years 2006–2011, and 2014 from the Florida Land Boundary Information Systems (http://labins.org). To quantify the spatial change between 1982, 2003, and 2015 we obtained three Landsat satellite images (Table 1; source: http://EarthExplorer.usgs.gov). The multispectral Landsat data were used to derive normalized difference vegetation index (NDVI) maps of the study area at 30 m spatial resolution. NDVI is a robust method for evaluating vegetation health changes over time as measured by the spectral reflectance patterns of the vegetation, and results in values between −1 and 1 [14].
To further examine the change of the habitat at scales relevant to individual trees, we derived similar NDVI maps for the study area using very-high-spatial-resolution (2 m) WorldView-2 satellite imagery for the years 2010 and 2017 (source: Digital Globe™).
Landsat images were radiometrically calibrated and converted to top-of-atmosphere reflectance fields using the ENVI™ software, prior to computing NDVI using the red and near-infrared bands. WorldView-2 images were preprocessed to reflectance and corrected for Rayleigh attenuation using a protocol developed by McCarthy et al. [15], before computing NDVI using the red and near-infrared (band 8) bands. Because WorldView-2 imagery covers a much smaller area per image, multiple images were required to cover the study area. The individual NDVI maps were mosaicked together in ArcGIS v10.1. A coastal forest mask was defined using the criteria of the Cooperative Land Cover Map (v3.2.5) of Geselbracht et al. [10] for this study area. The masks were used to select NDVI maps of our region of interest. For all Landsat (1982/2003, 2003/2015) and WorldView image pairs, the “before” NDVI maps were subtracted from the “after” maps to evaluate change. To account for noise or ephemeral changes, “vegetation decline” was defined as those pixels containing an NDVI difference value of less (more negative) than −0.05.
Langston et al. [11] evaluated precipitation, temperature, river discharge, and storm data for their region as potential drivers of the degradation of stands of S. palmetto and other species. We attempted to replicate this approach by evaluating minimum and maximum daily temperatures from Brooksville, Florida (~35 km southeast of CNWR) for 1996–2017, and for Tallahassee, Florida (~250 km northwest of CNWR) for its longer time series (1942–2018). Precipitation data were downloaded from Inverness, Florida (~30 km northeast of CNWR). Monthly mean sea-level anomalies (de-seasonalized) were assessed from tide gauge #8727520 at Cedar Key, Florida (~62 km northwest of CNWR) for 1939–2017. River discharge, conductance, stream-level, and gauge-height data were downloaded for two United States Geologic Survey stations located within the Chassahowitzka River for the period 2007–2016.
3. Results
3.1. Aerial Photography
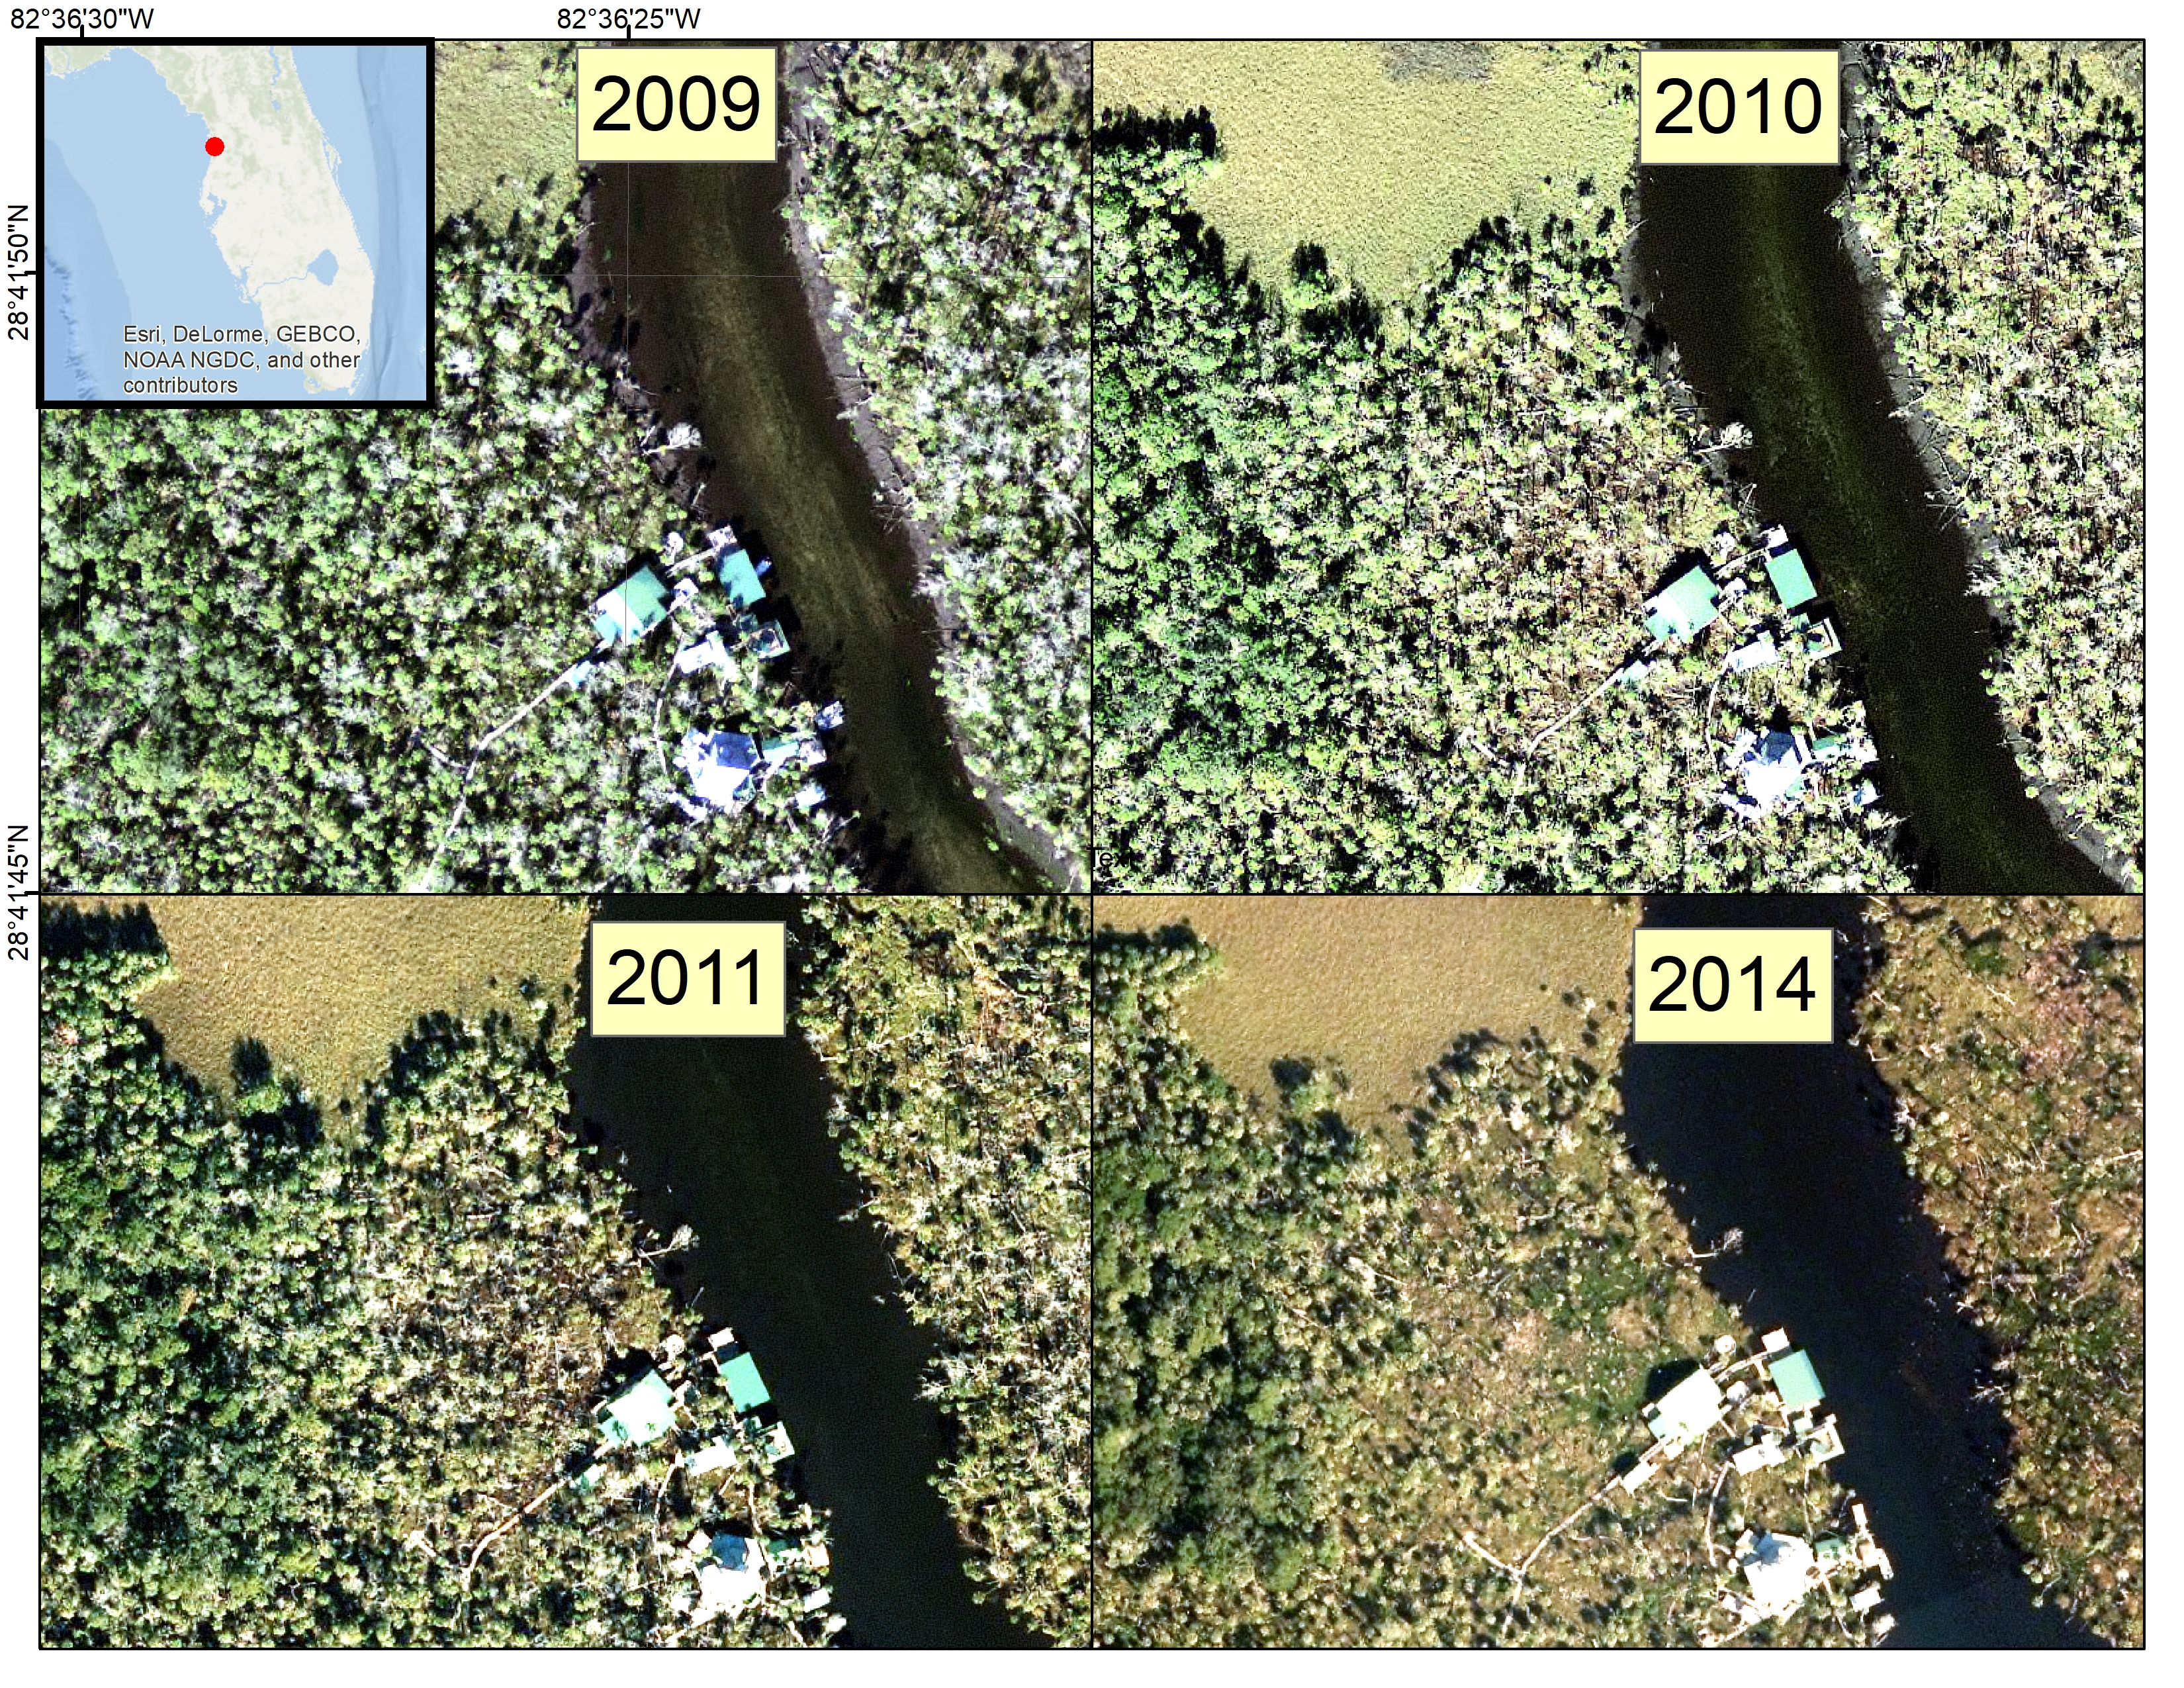
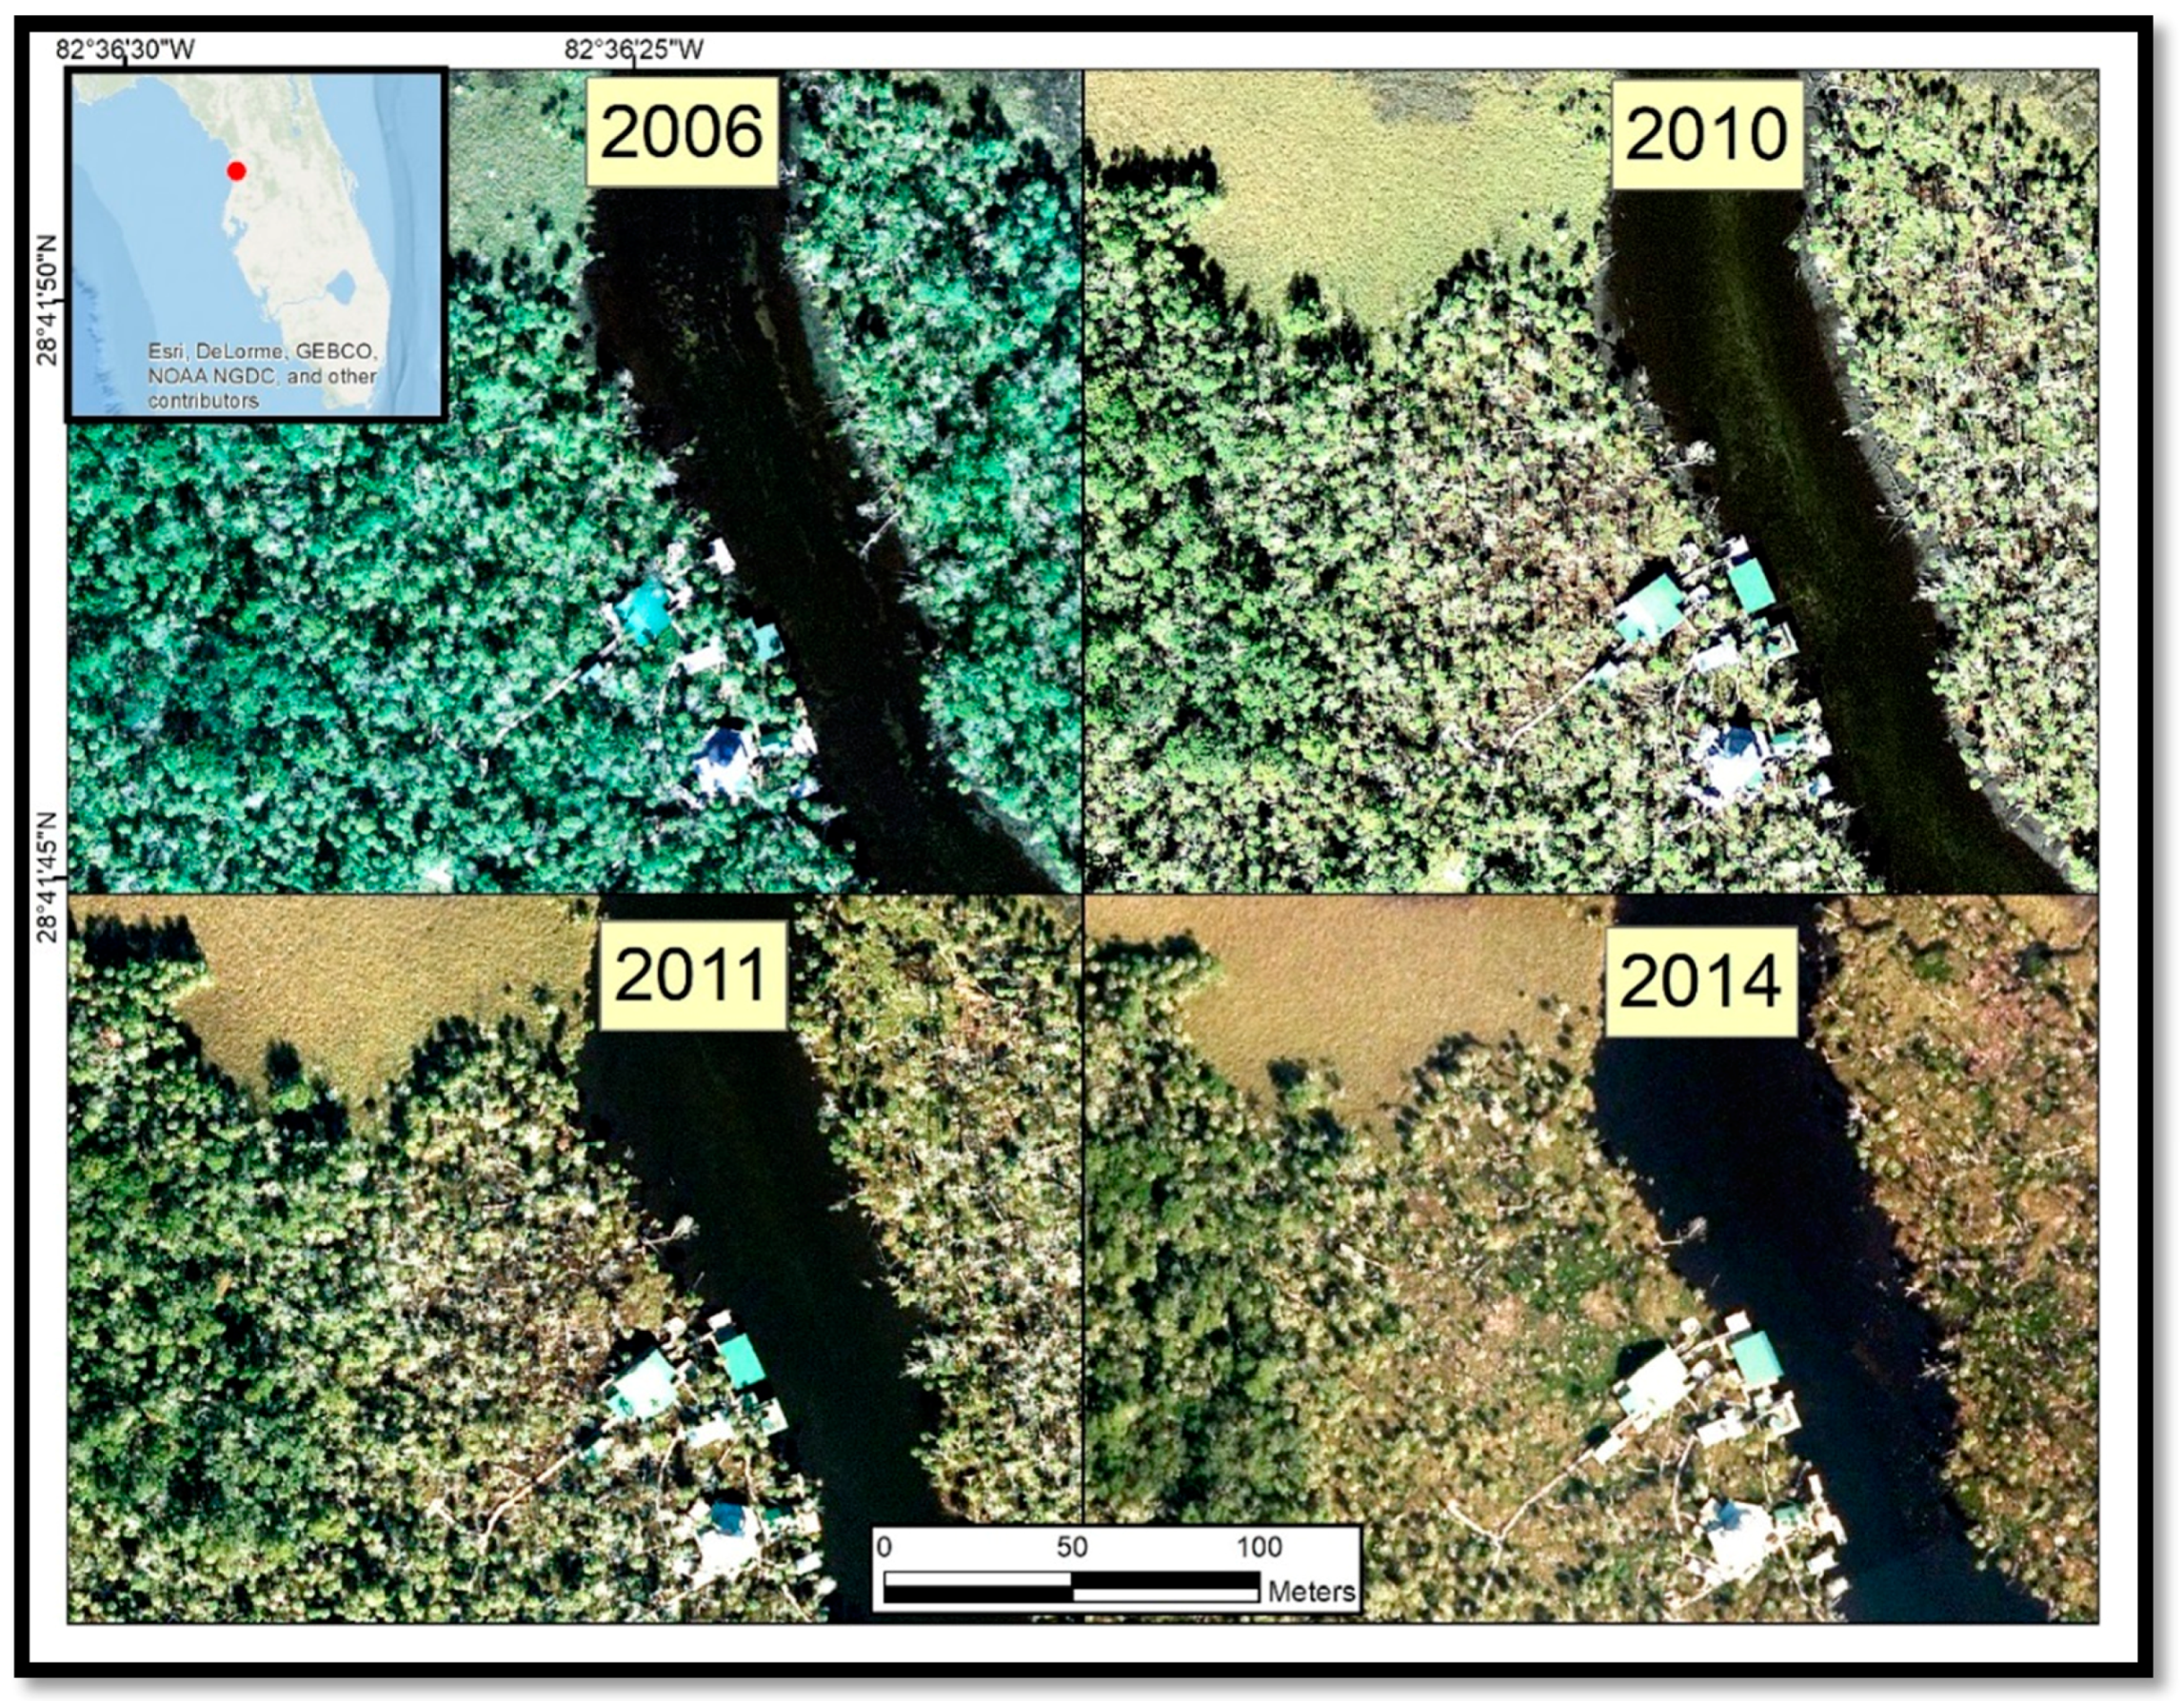
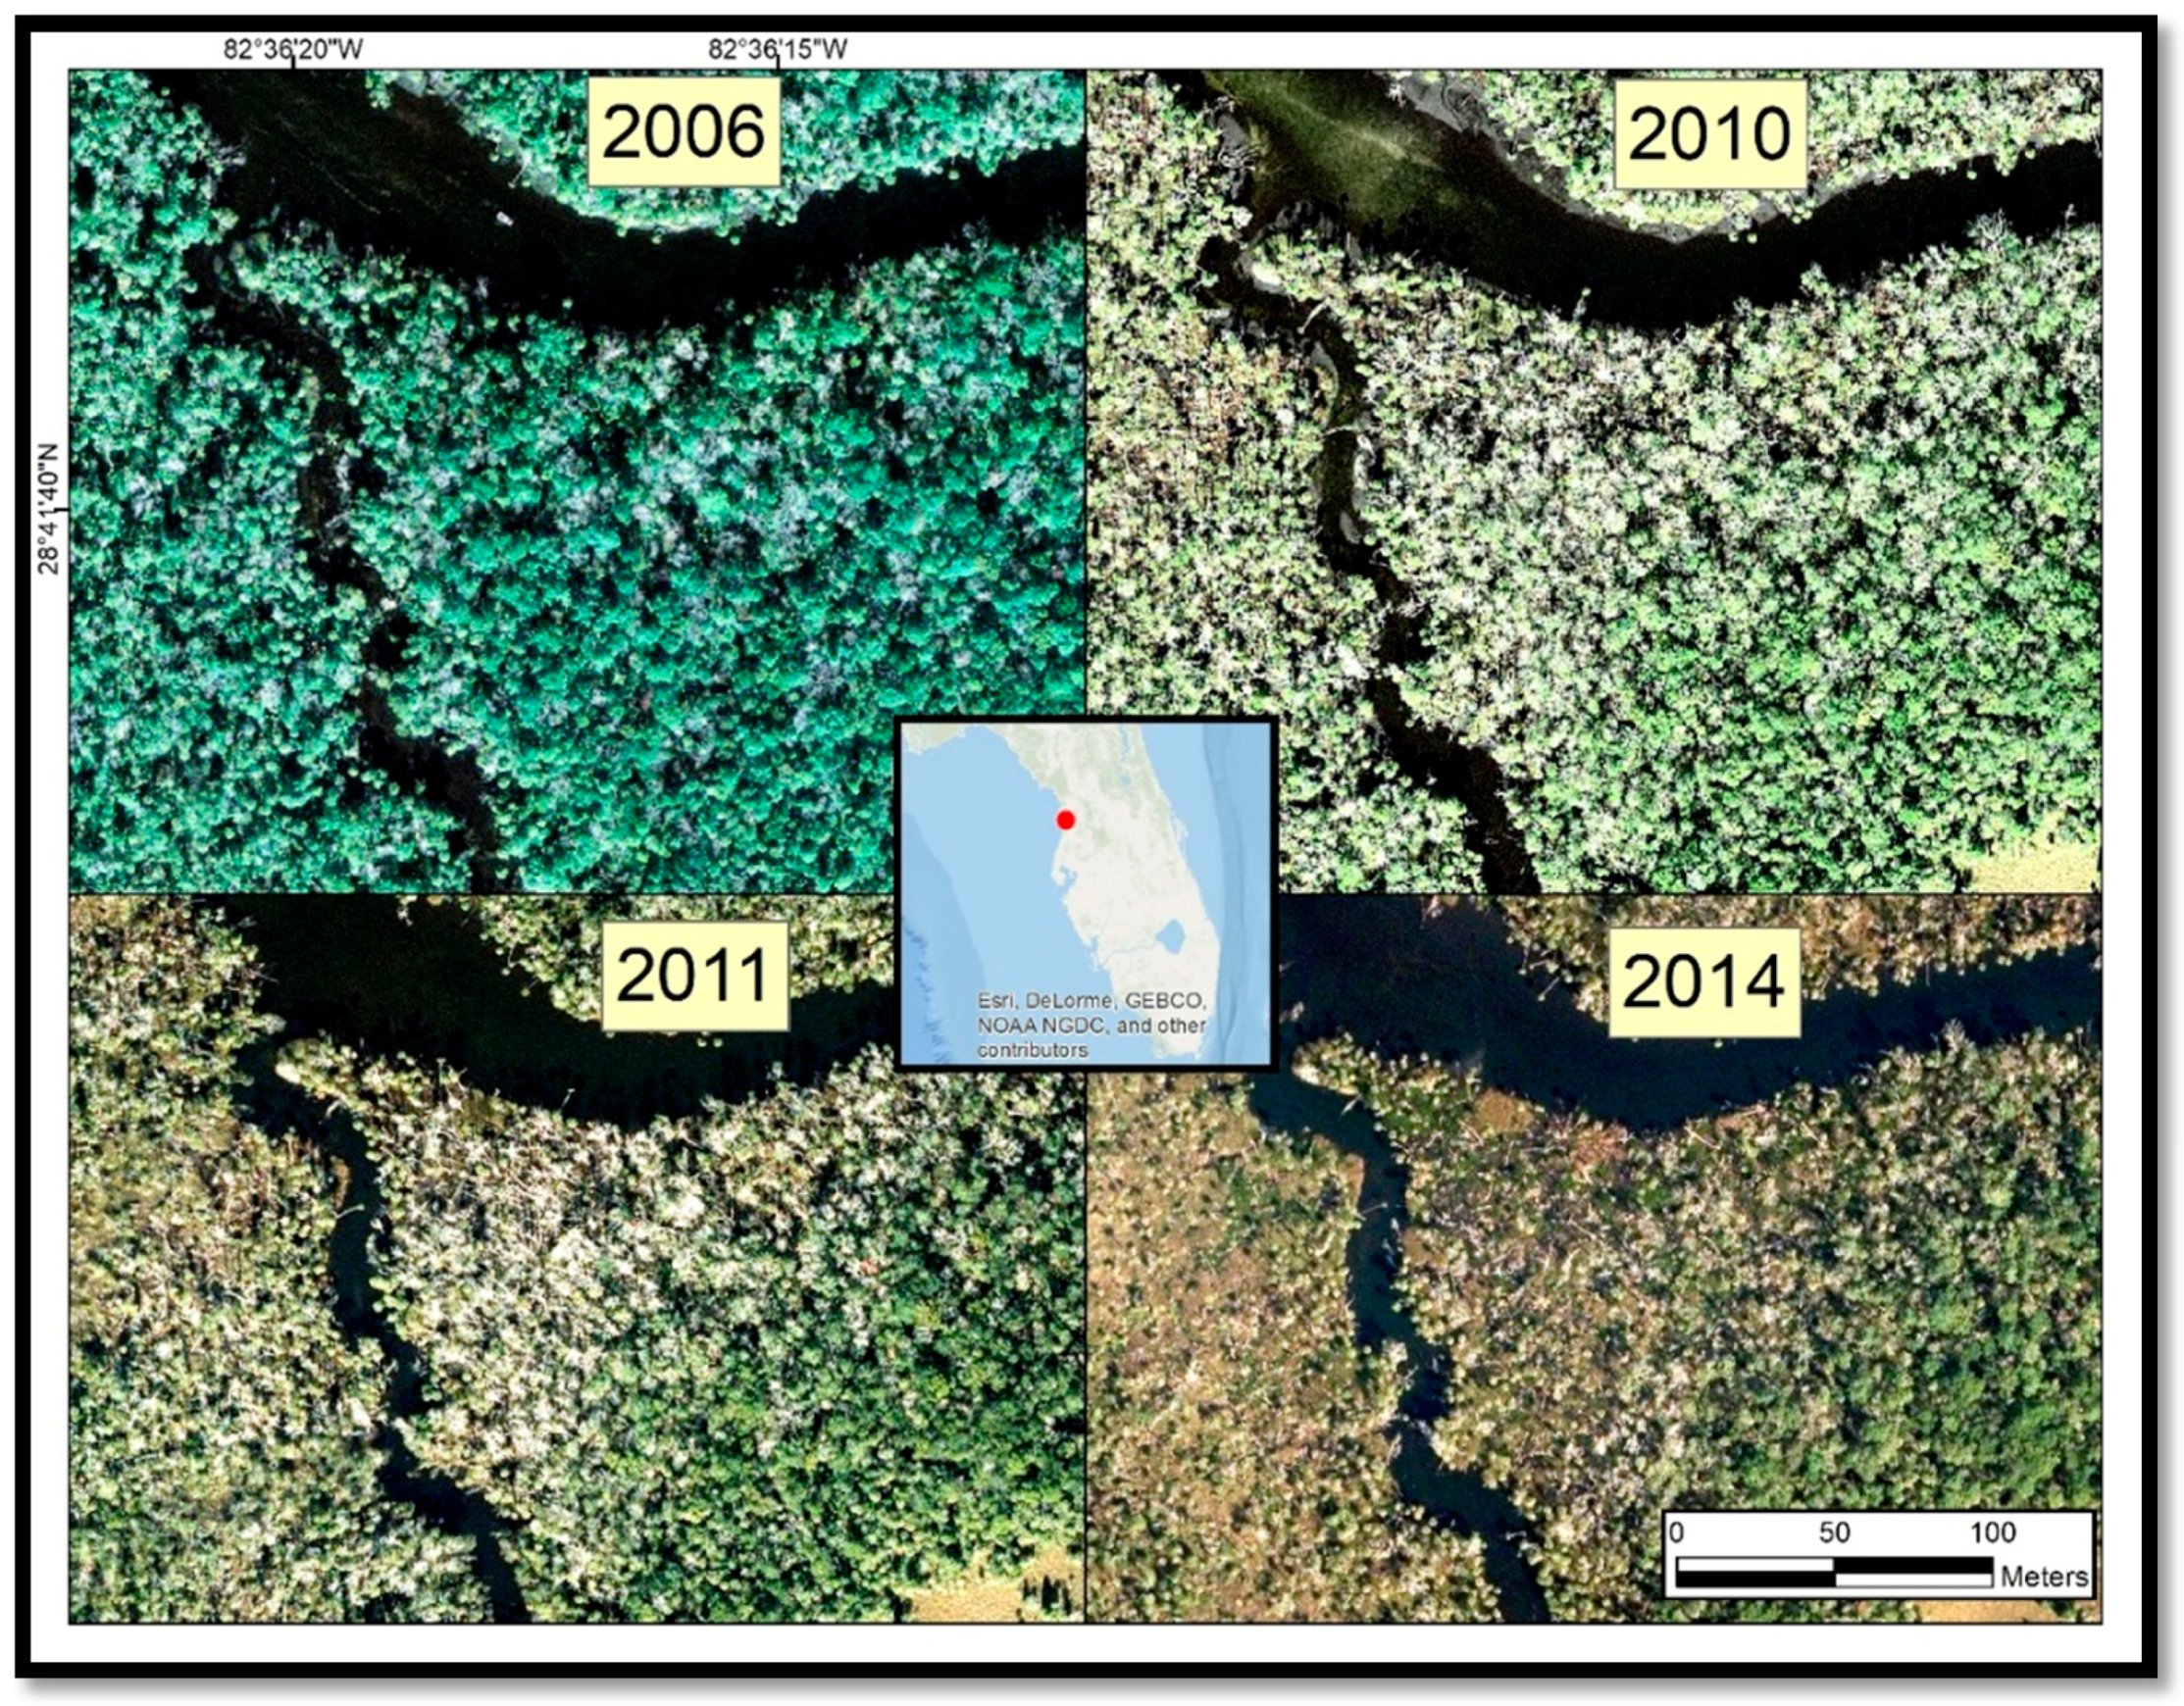
Aerial photographs, collected between 2006 and 2014, showed relatively undisturbed forest along the Chassahowitzka River and its tributaries from 2006 to 2009, followed by extended areas of reduced foliage, downed trees, and patches of bare ground starting in 2010 and 2011 (Figure 3 and Figure 4). By 2014, the majority of tree stands within close proximity to the waterways appeared to have fallen. Notably, tree canopies located farther from the waterways showed little to no change during this period.
3.2. Satellite Imagery Time Series Analysis
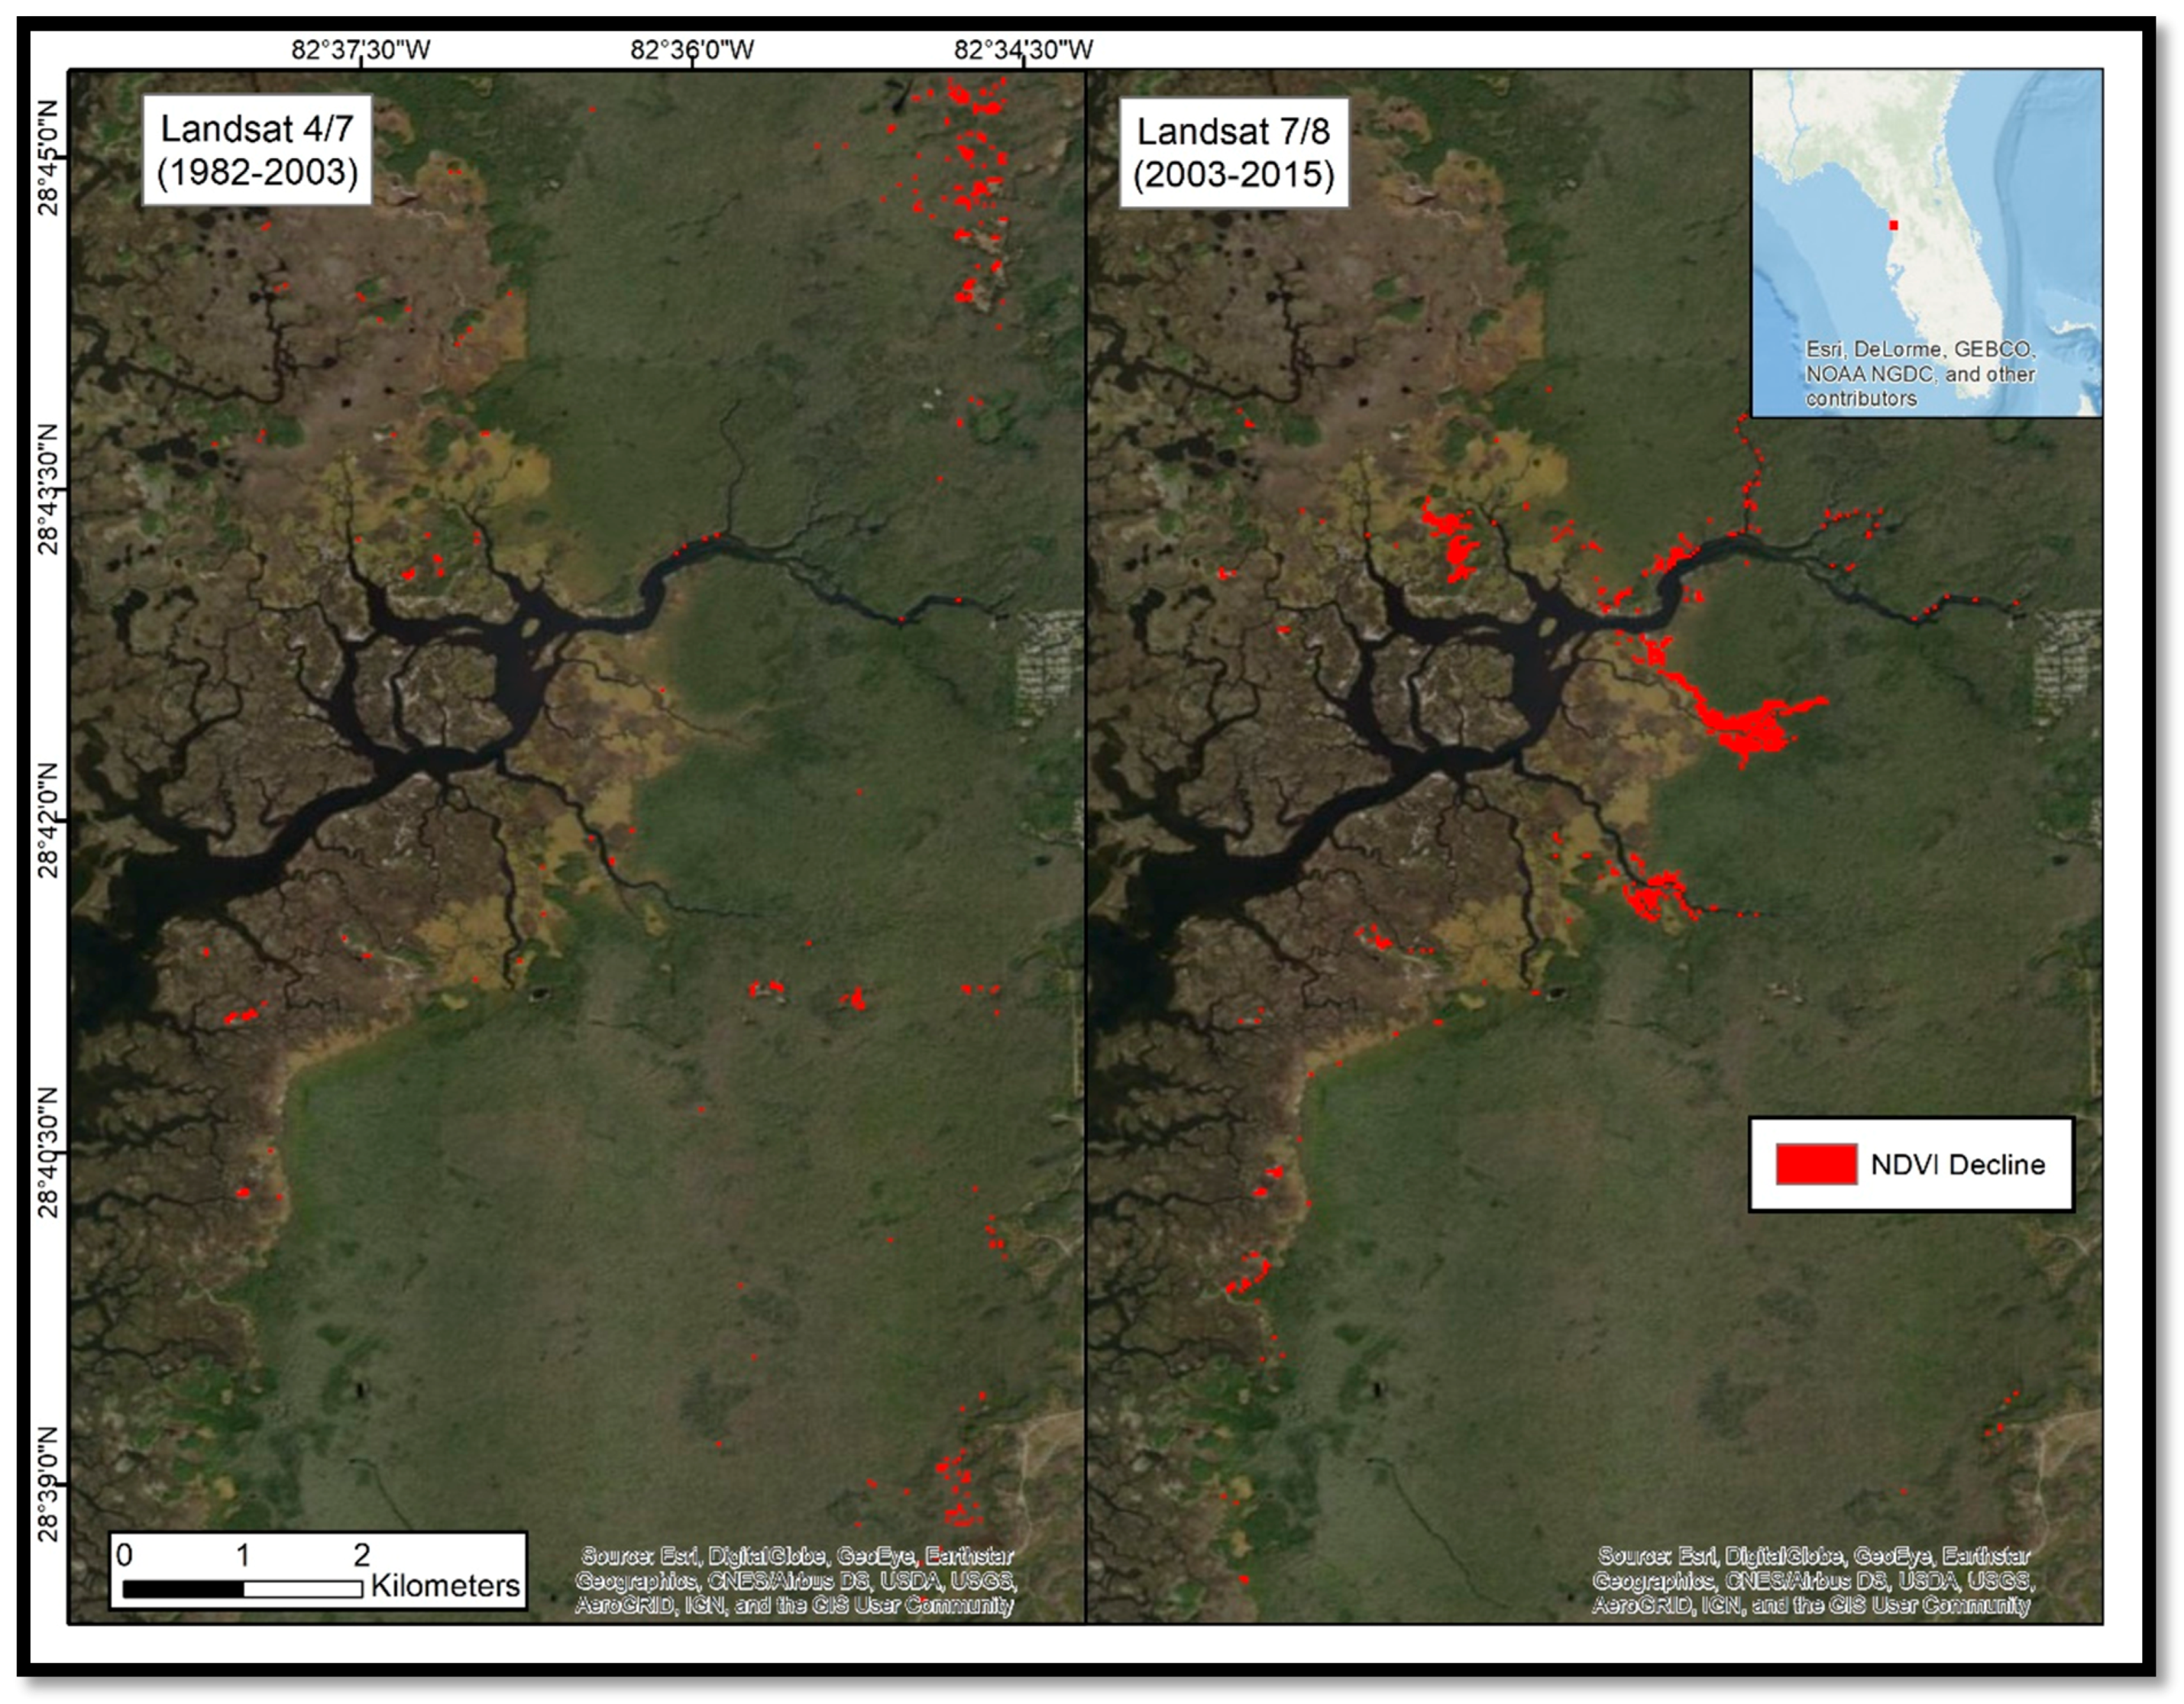
Landsat-derived NDVI maps for the study area indicated virtually no decline in vegetation health in this region from 1982 to 2003 (Figure 5). Only a total of 0.36 km2 (0.60%) of the area experienced NDVI decline. From 2003 to 2015 the decline in forested area was 0.60 km2 (1.00%), concentrated along the Chassahowitzka River and its tributaries, and along the marsh–forest interface in areas farther away from major waterways (Table 2; Figure 5).
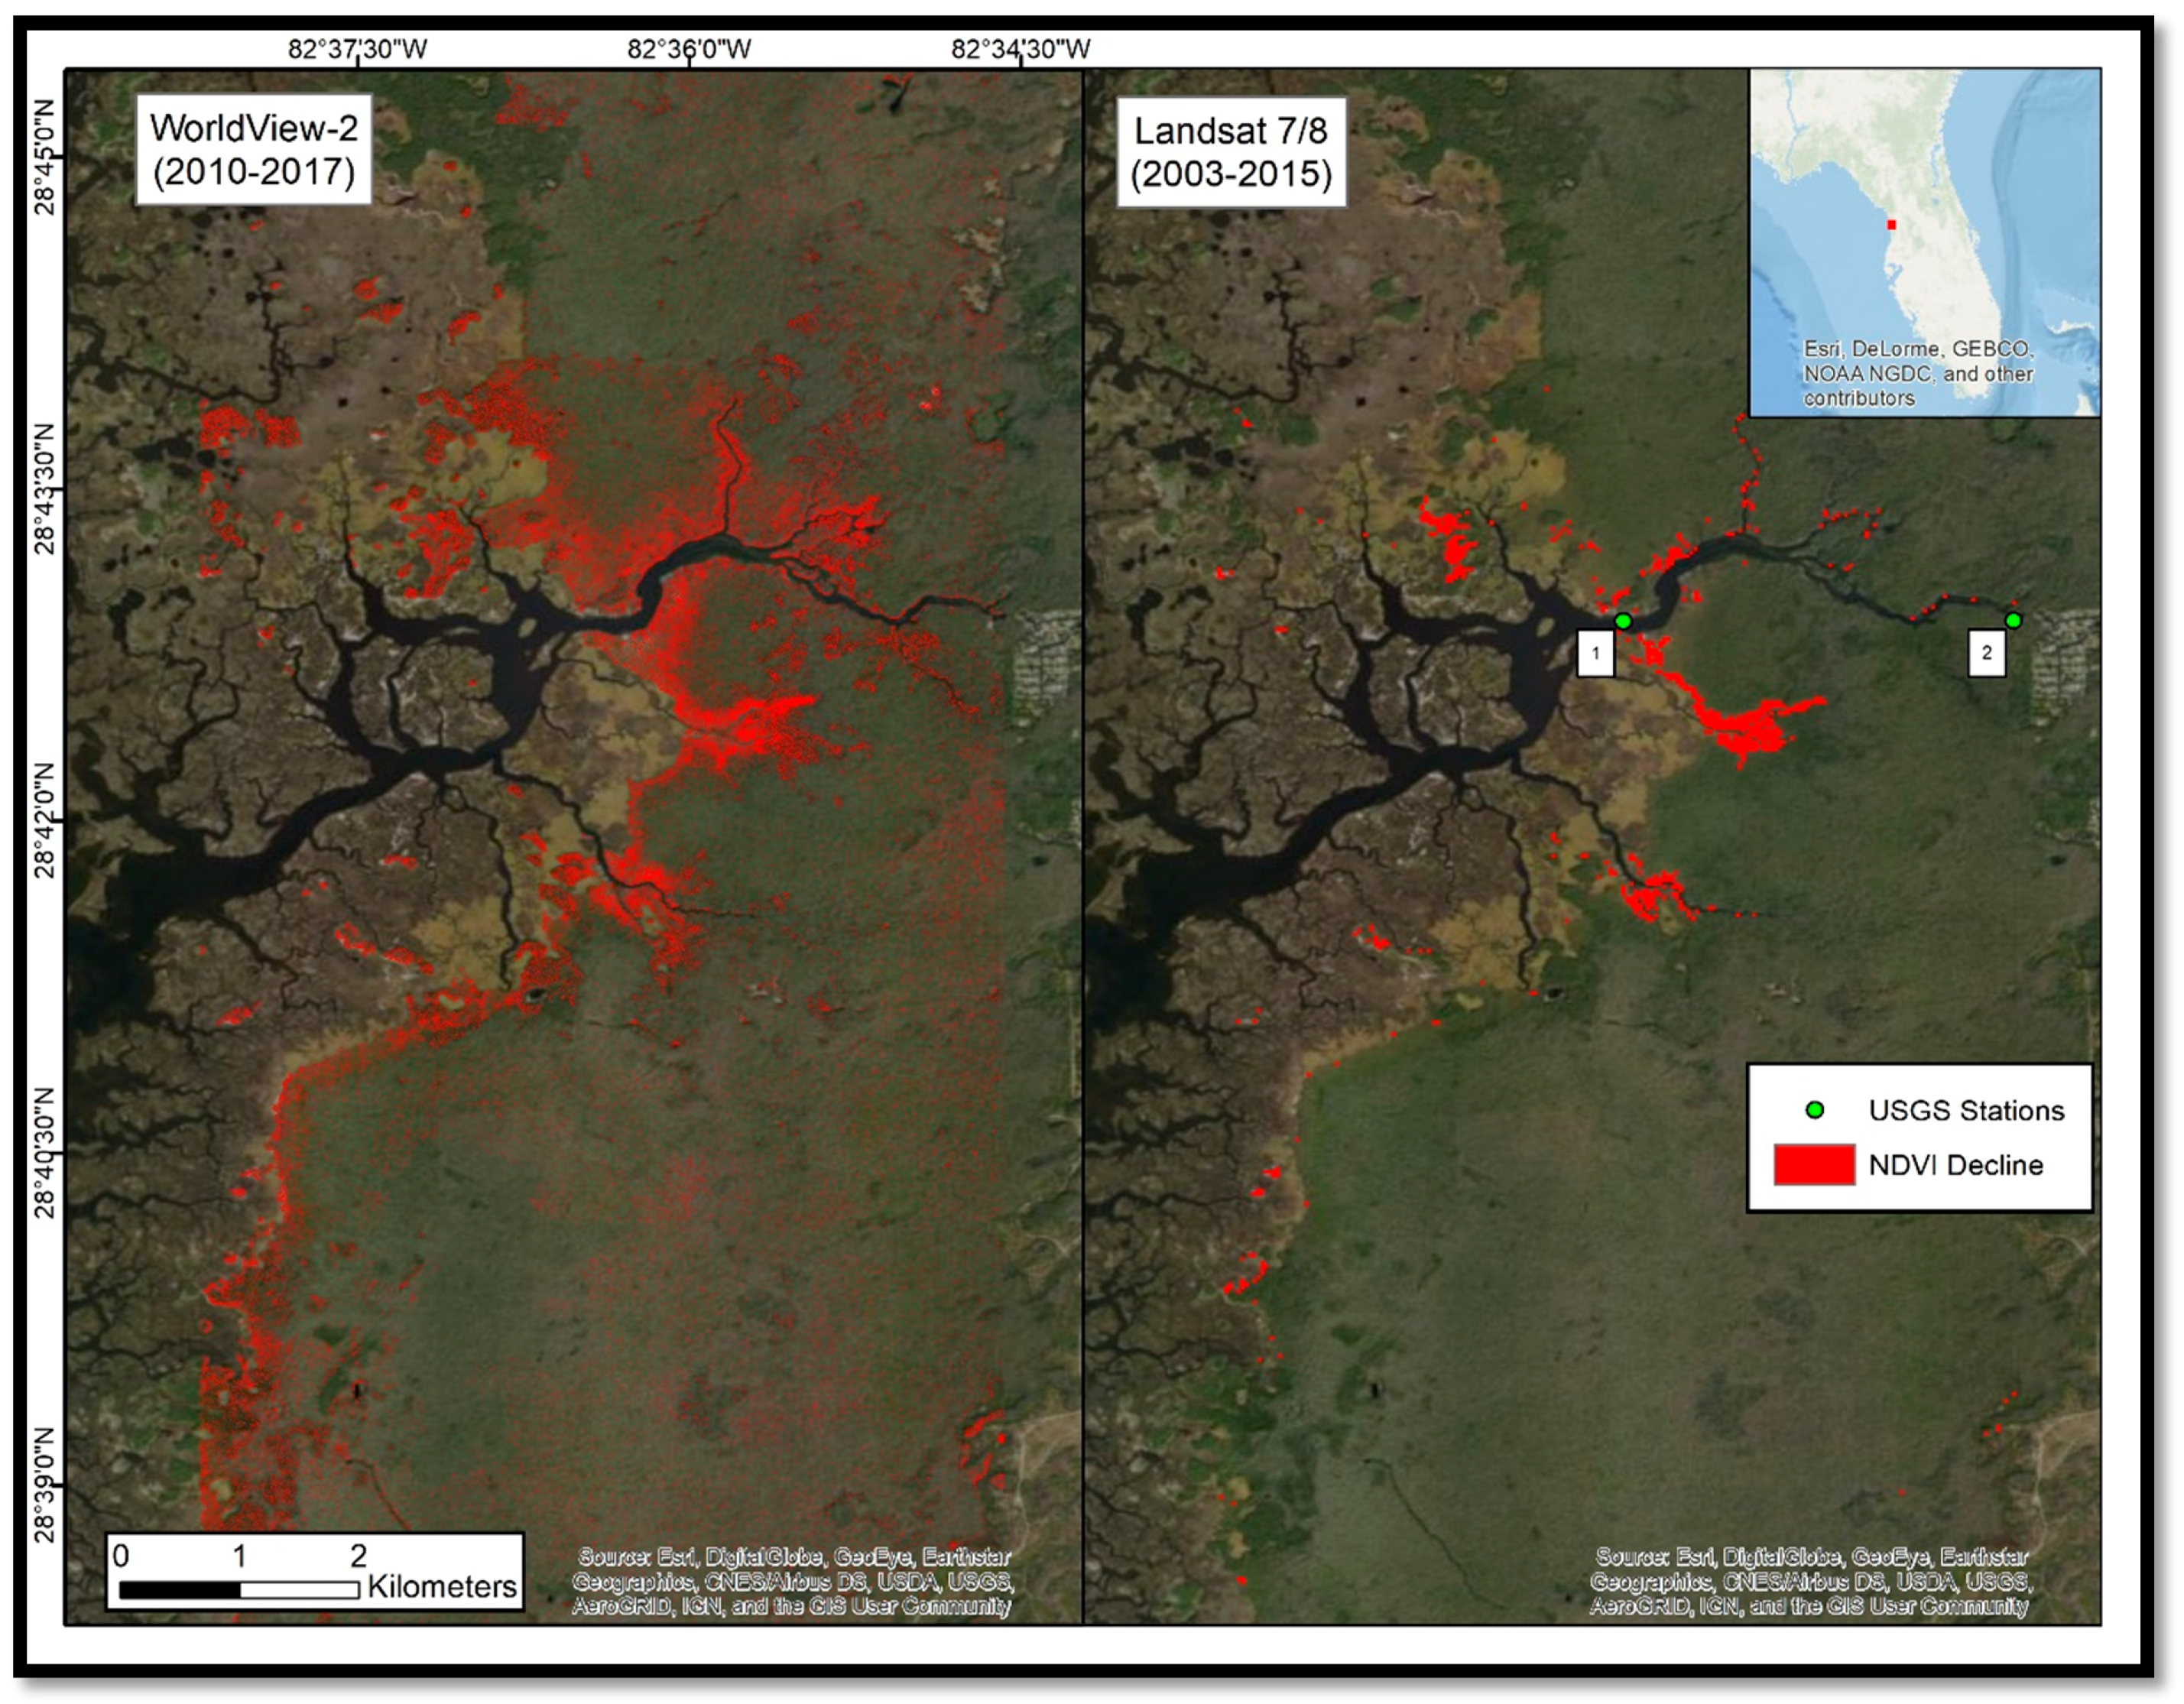
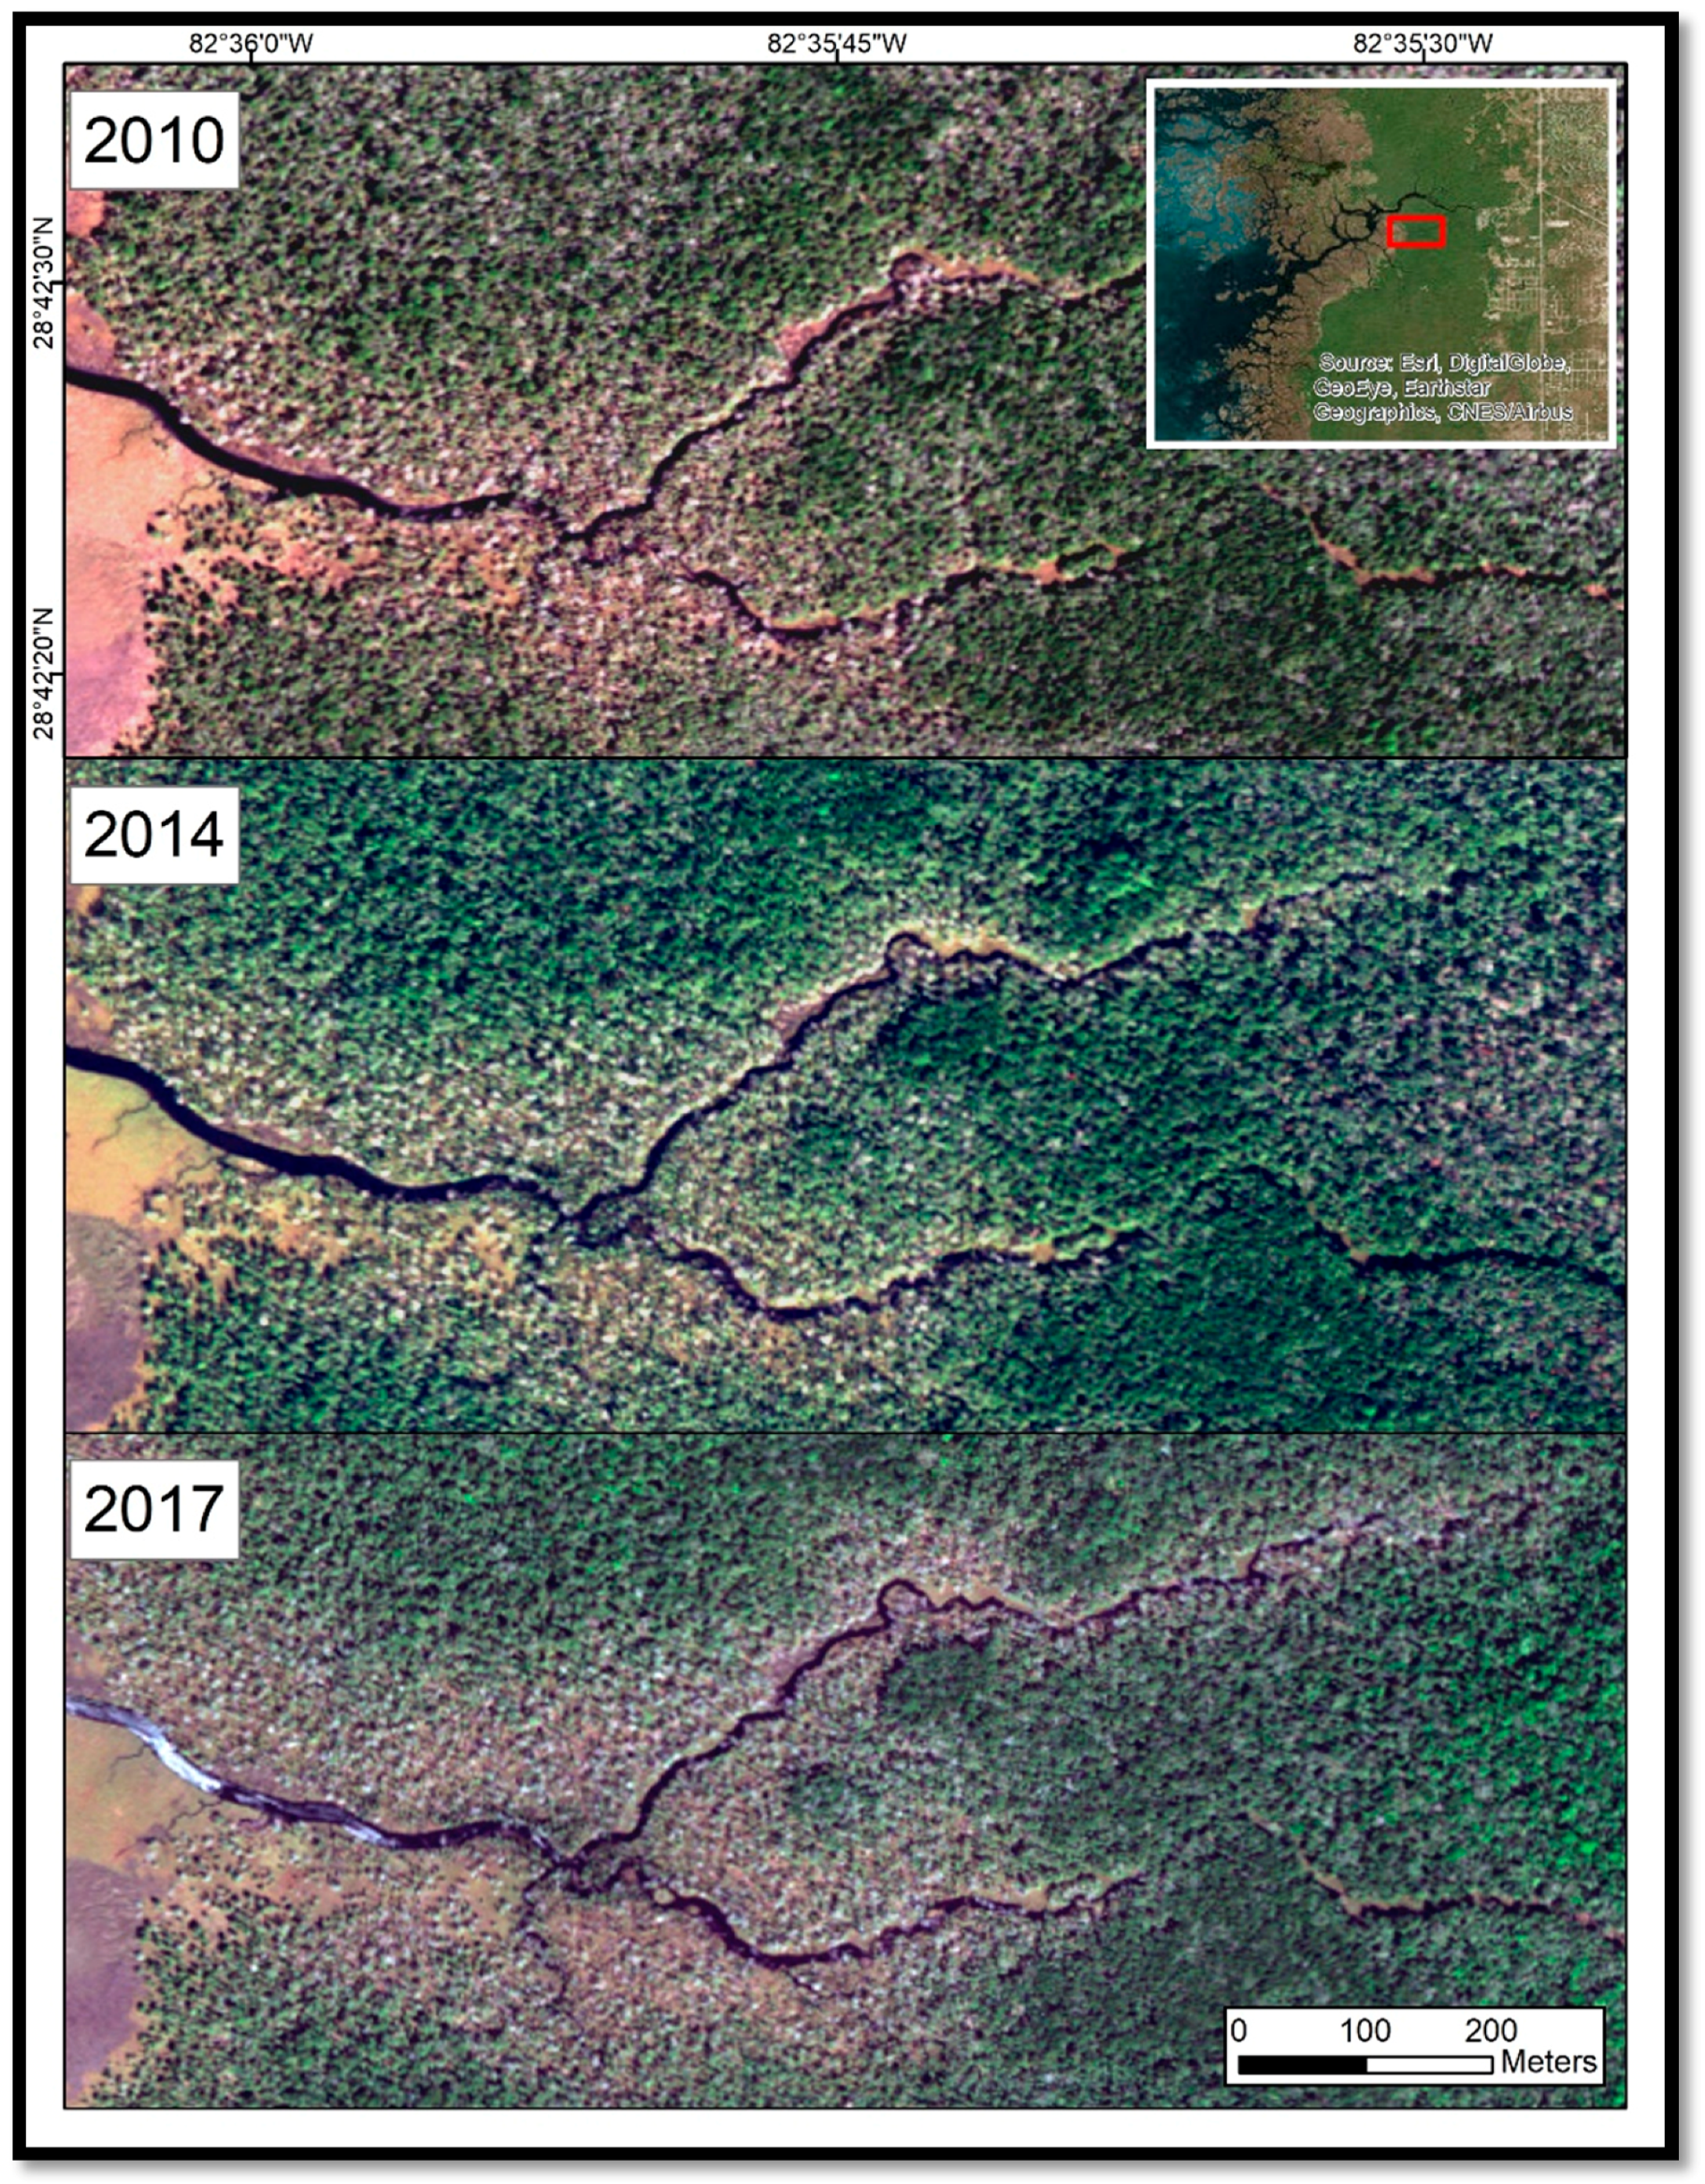
WorldView-2 NDVI maps corroborated these patterns of NDVI decline along waterways and at the marsh–forest boundary, but indicated a loss of 4.37 km2 (7.44%) of forest between 2010 to 2017 (Table 2; Figure 6). Unfortunately, relevant ground truth data do not exist for this study area, and therefore empirical validation was not feasible.
3.3. Meteorological and Sea-Level Rise Data Assessments
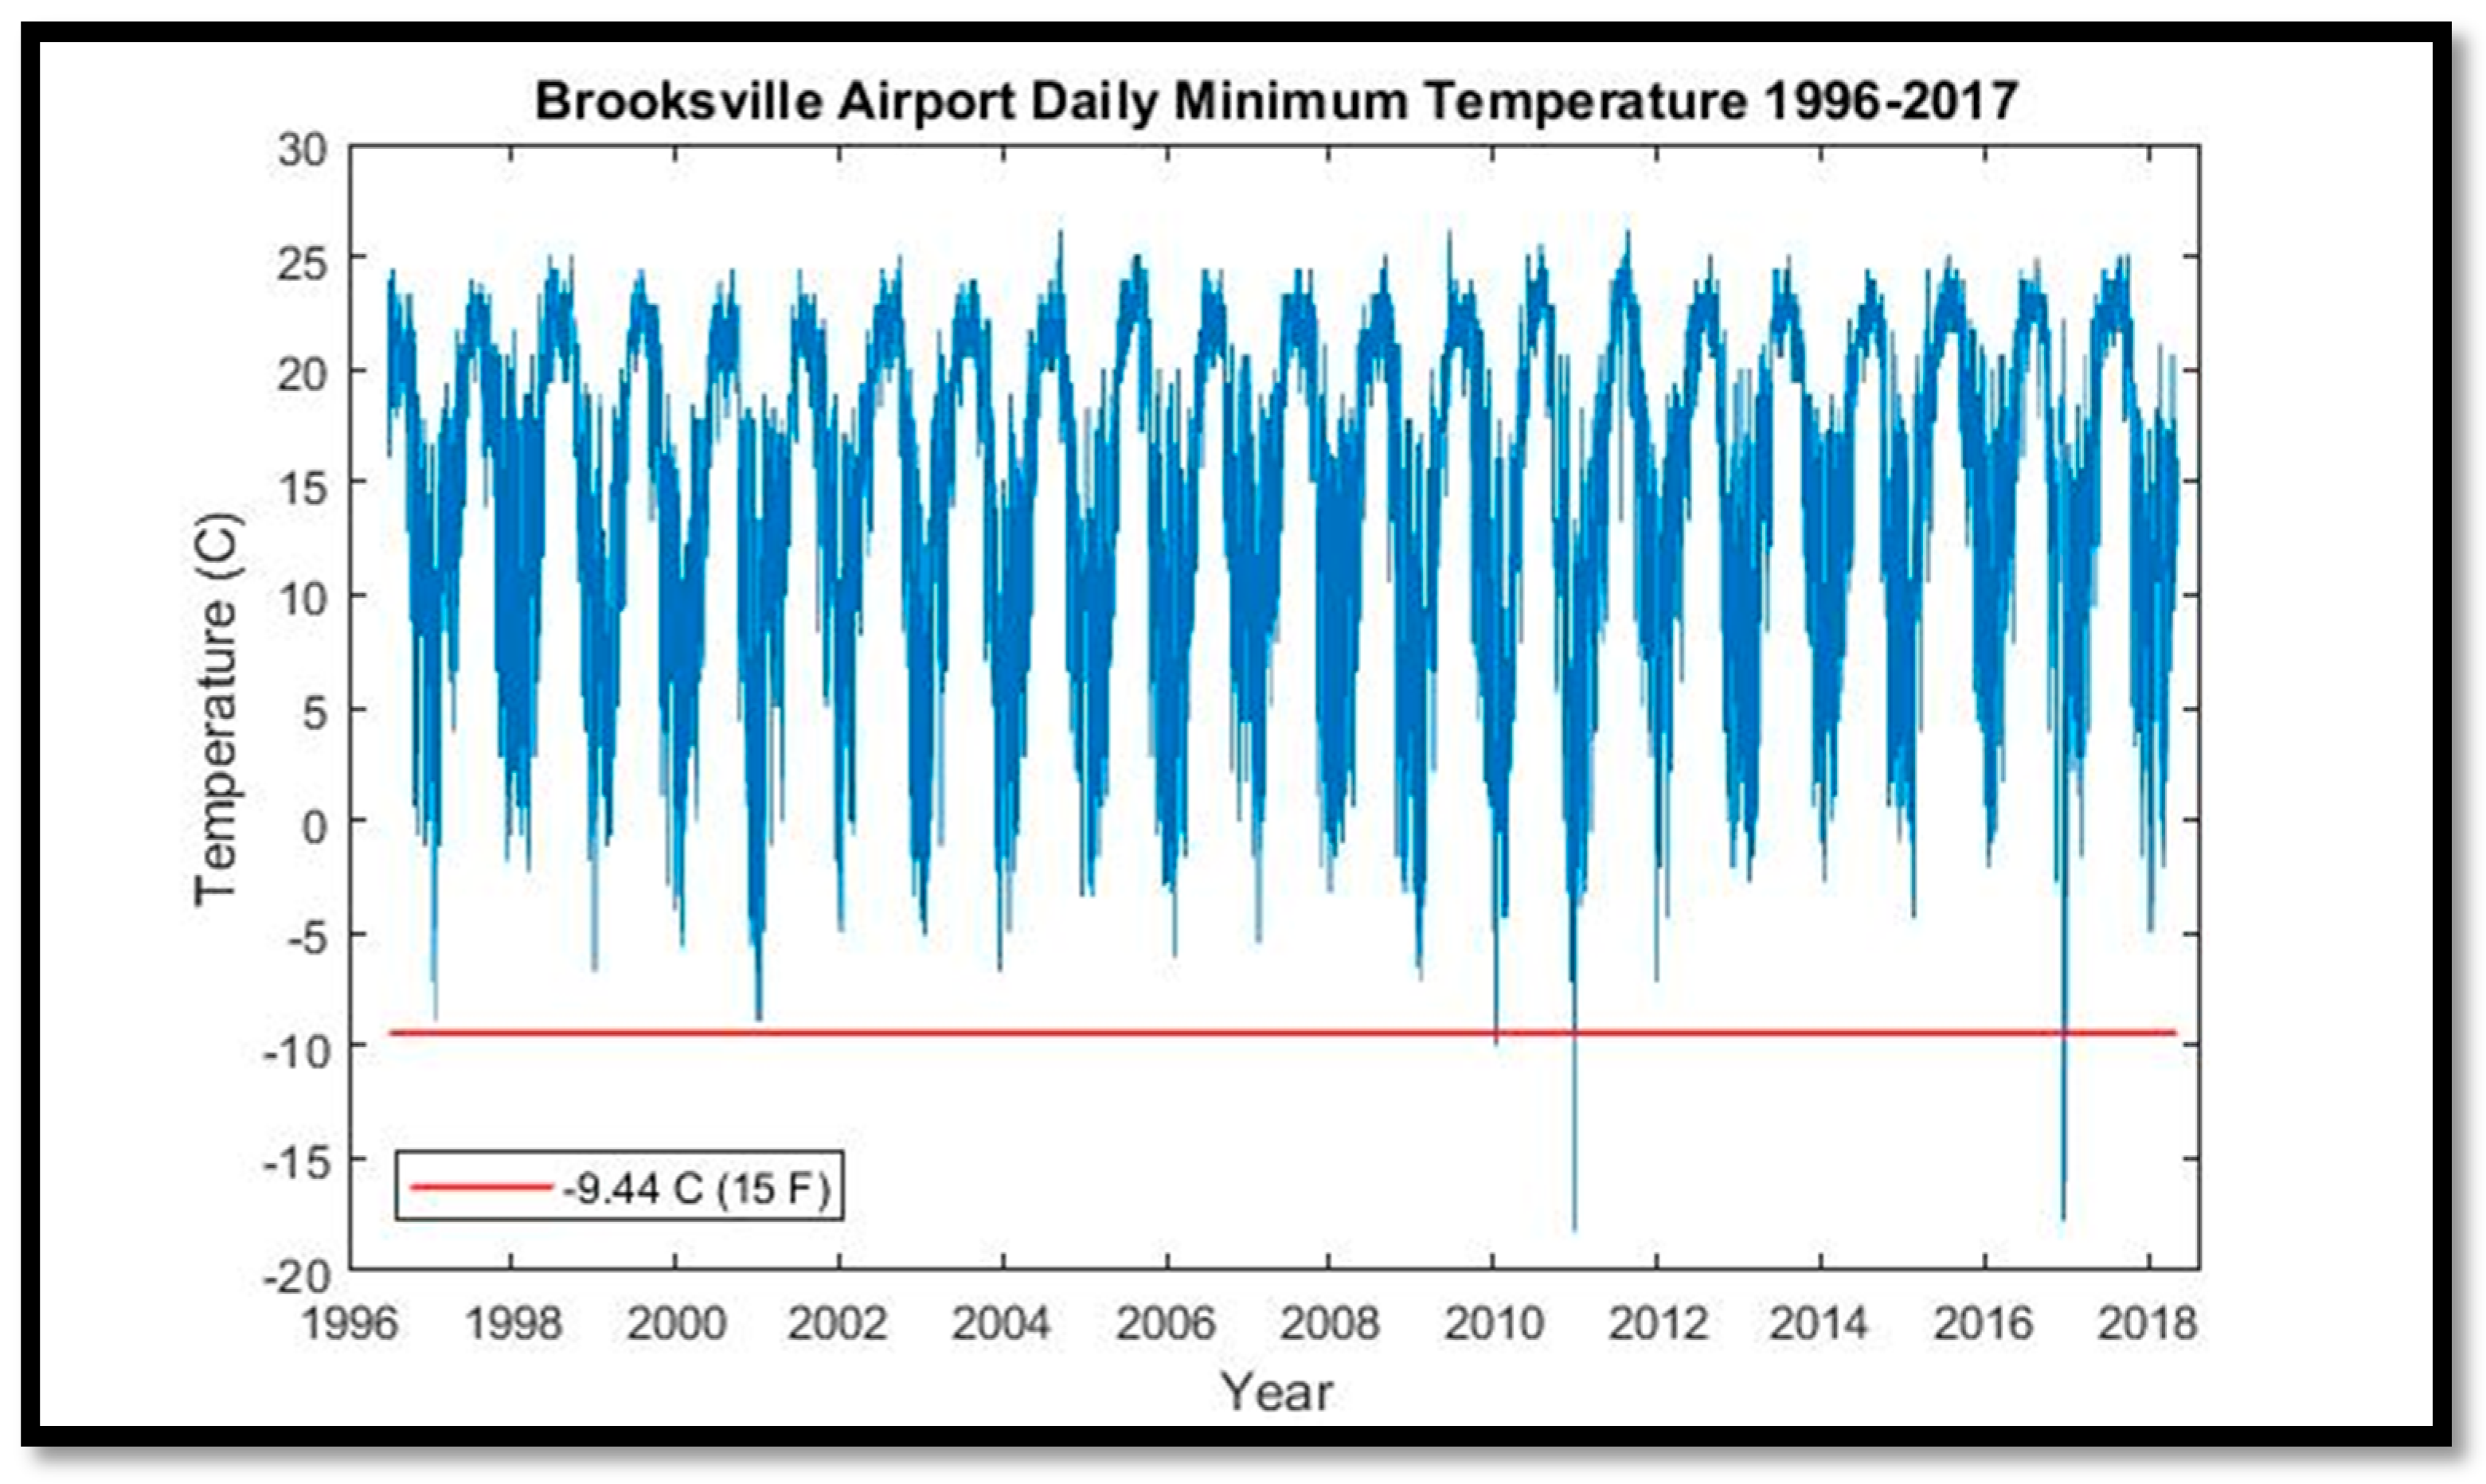
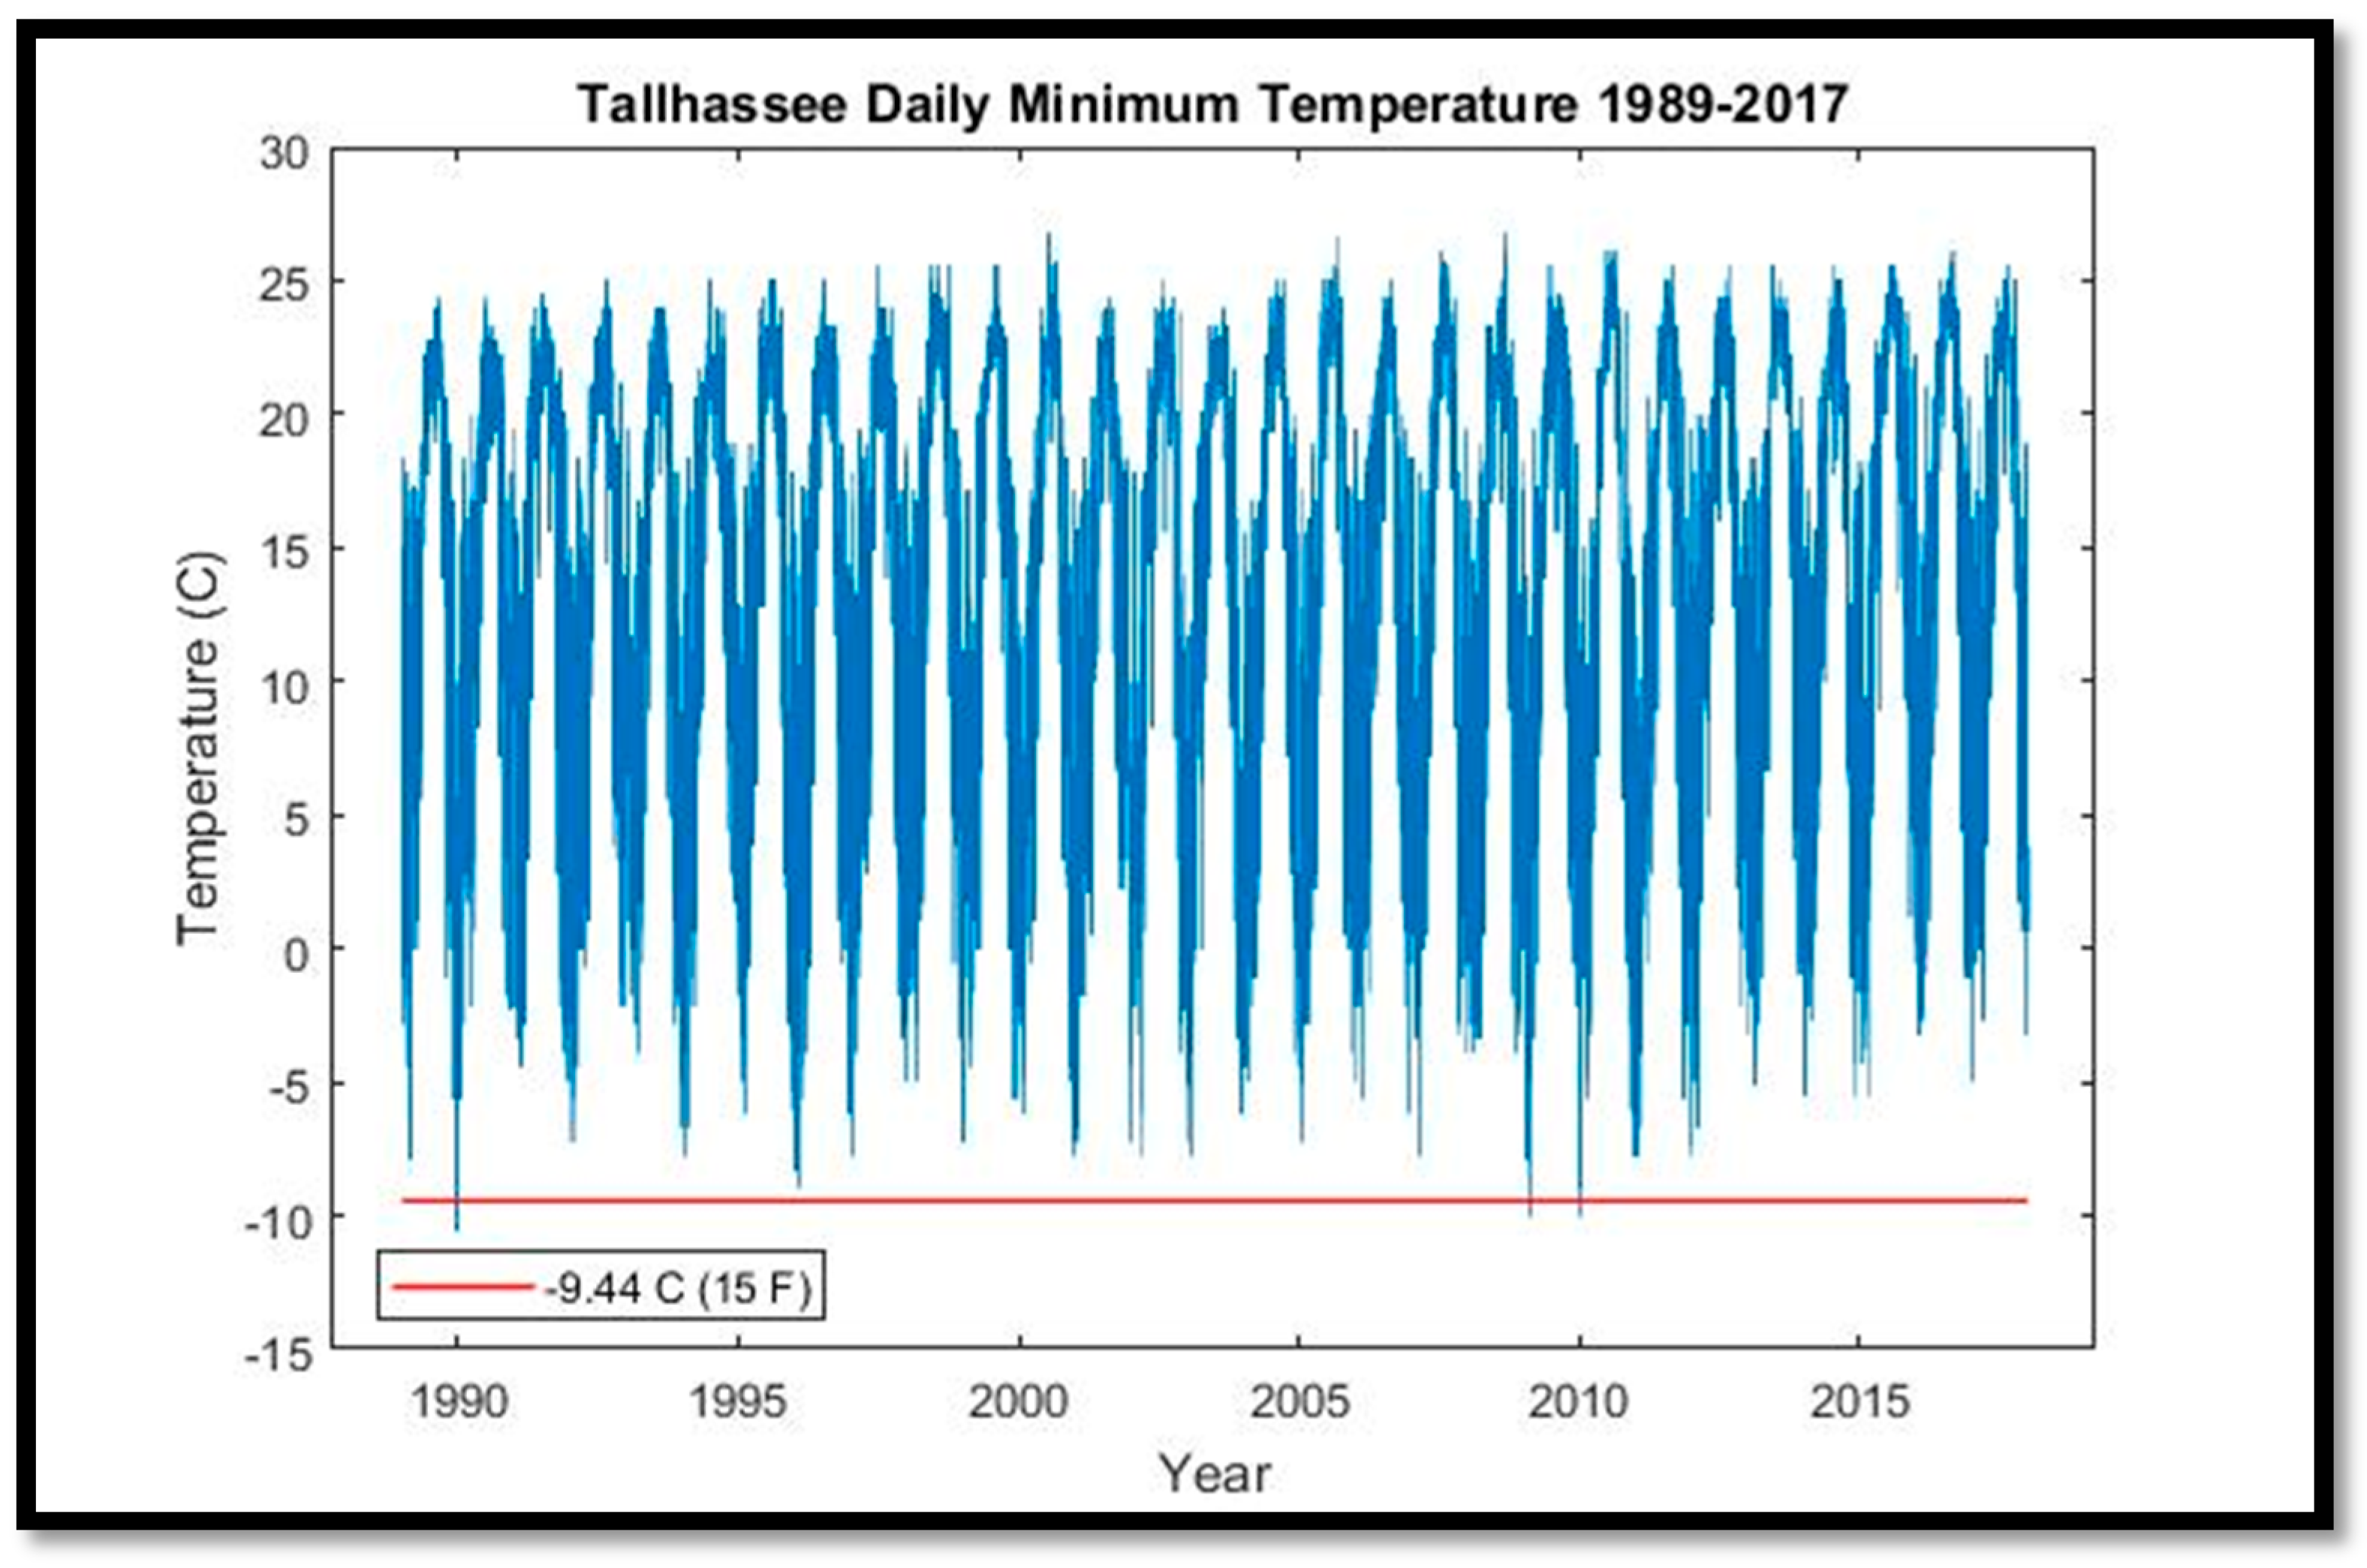
Minimum air temperatures from the Tallahassee Regional Airport, based on ~80 years of observations, indicate anomalously cold events occurred during the winters of 2009 and 2010, with daily minimum temperatures lower than −10 °C (14 °F) on 5 February 2009, for the first time since 1989, and then again on 11 January 2010. A total of 20 cold events occurred between 1940 to 2017, with an average of 922 days passing between cold events. The most recent event prior to the 5 February 2009 event occurred on 24 December 1989 (6983 days prior). The Brooksville Airport data (Figure 7) only date back to 1996, precluding a long-term evaluation of anomalies, but provide a more accurate estimate of local temperatures given the ~35 km distance to the study area. These daily minimum air temperature data corroborate the Tallahassee 11 January 2010 cold snap of −10 °C (Figure 8), but also indicate that the coldest minimum temperature recorded, of −18.2 °C (7.6 °F), occurred on 4 January 2011. Another extreme minimum in temperature (−17.7 °C or 7.9 °F) occurred on 23 December 2016, and all of the five coldest recorded temperature events in the 1996–2017 period occurred in 2010, 2011, and 2016.
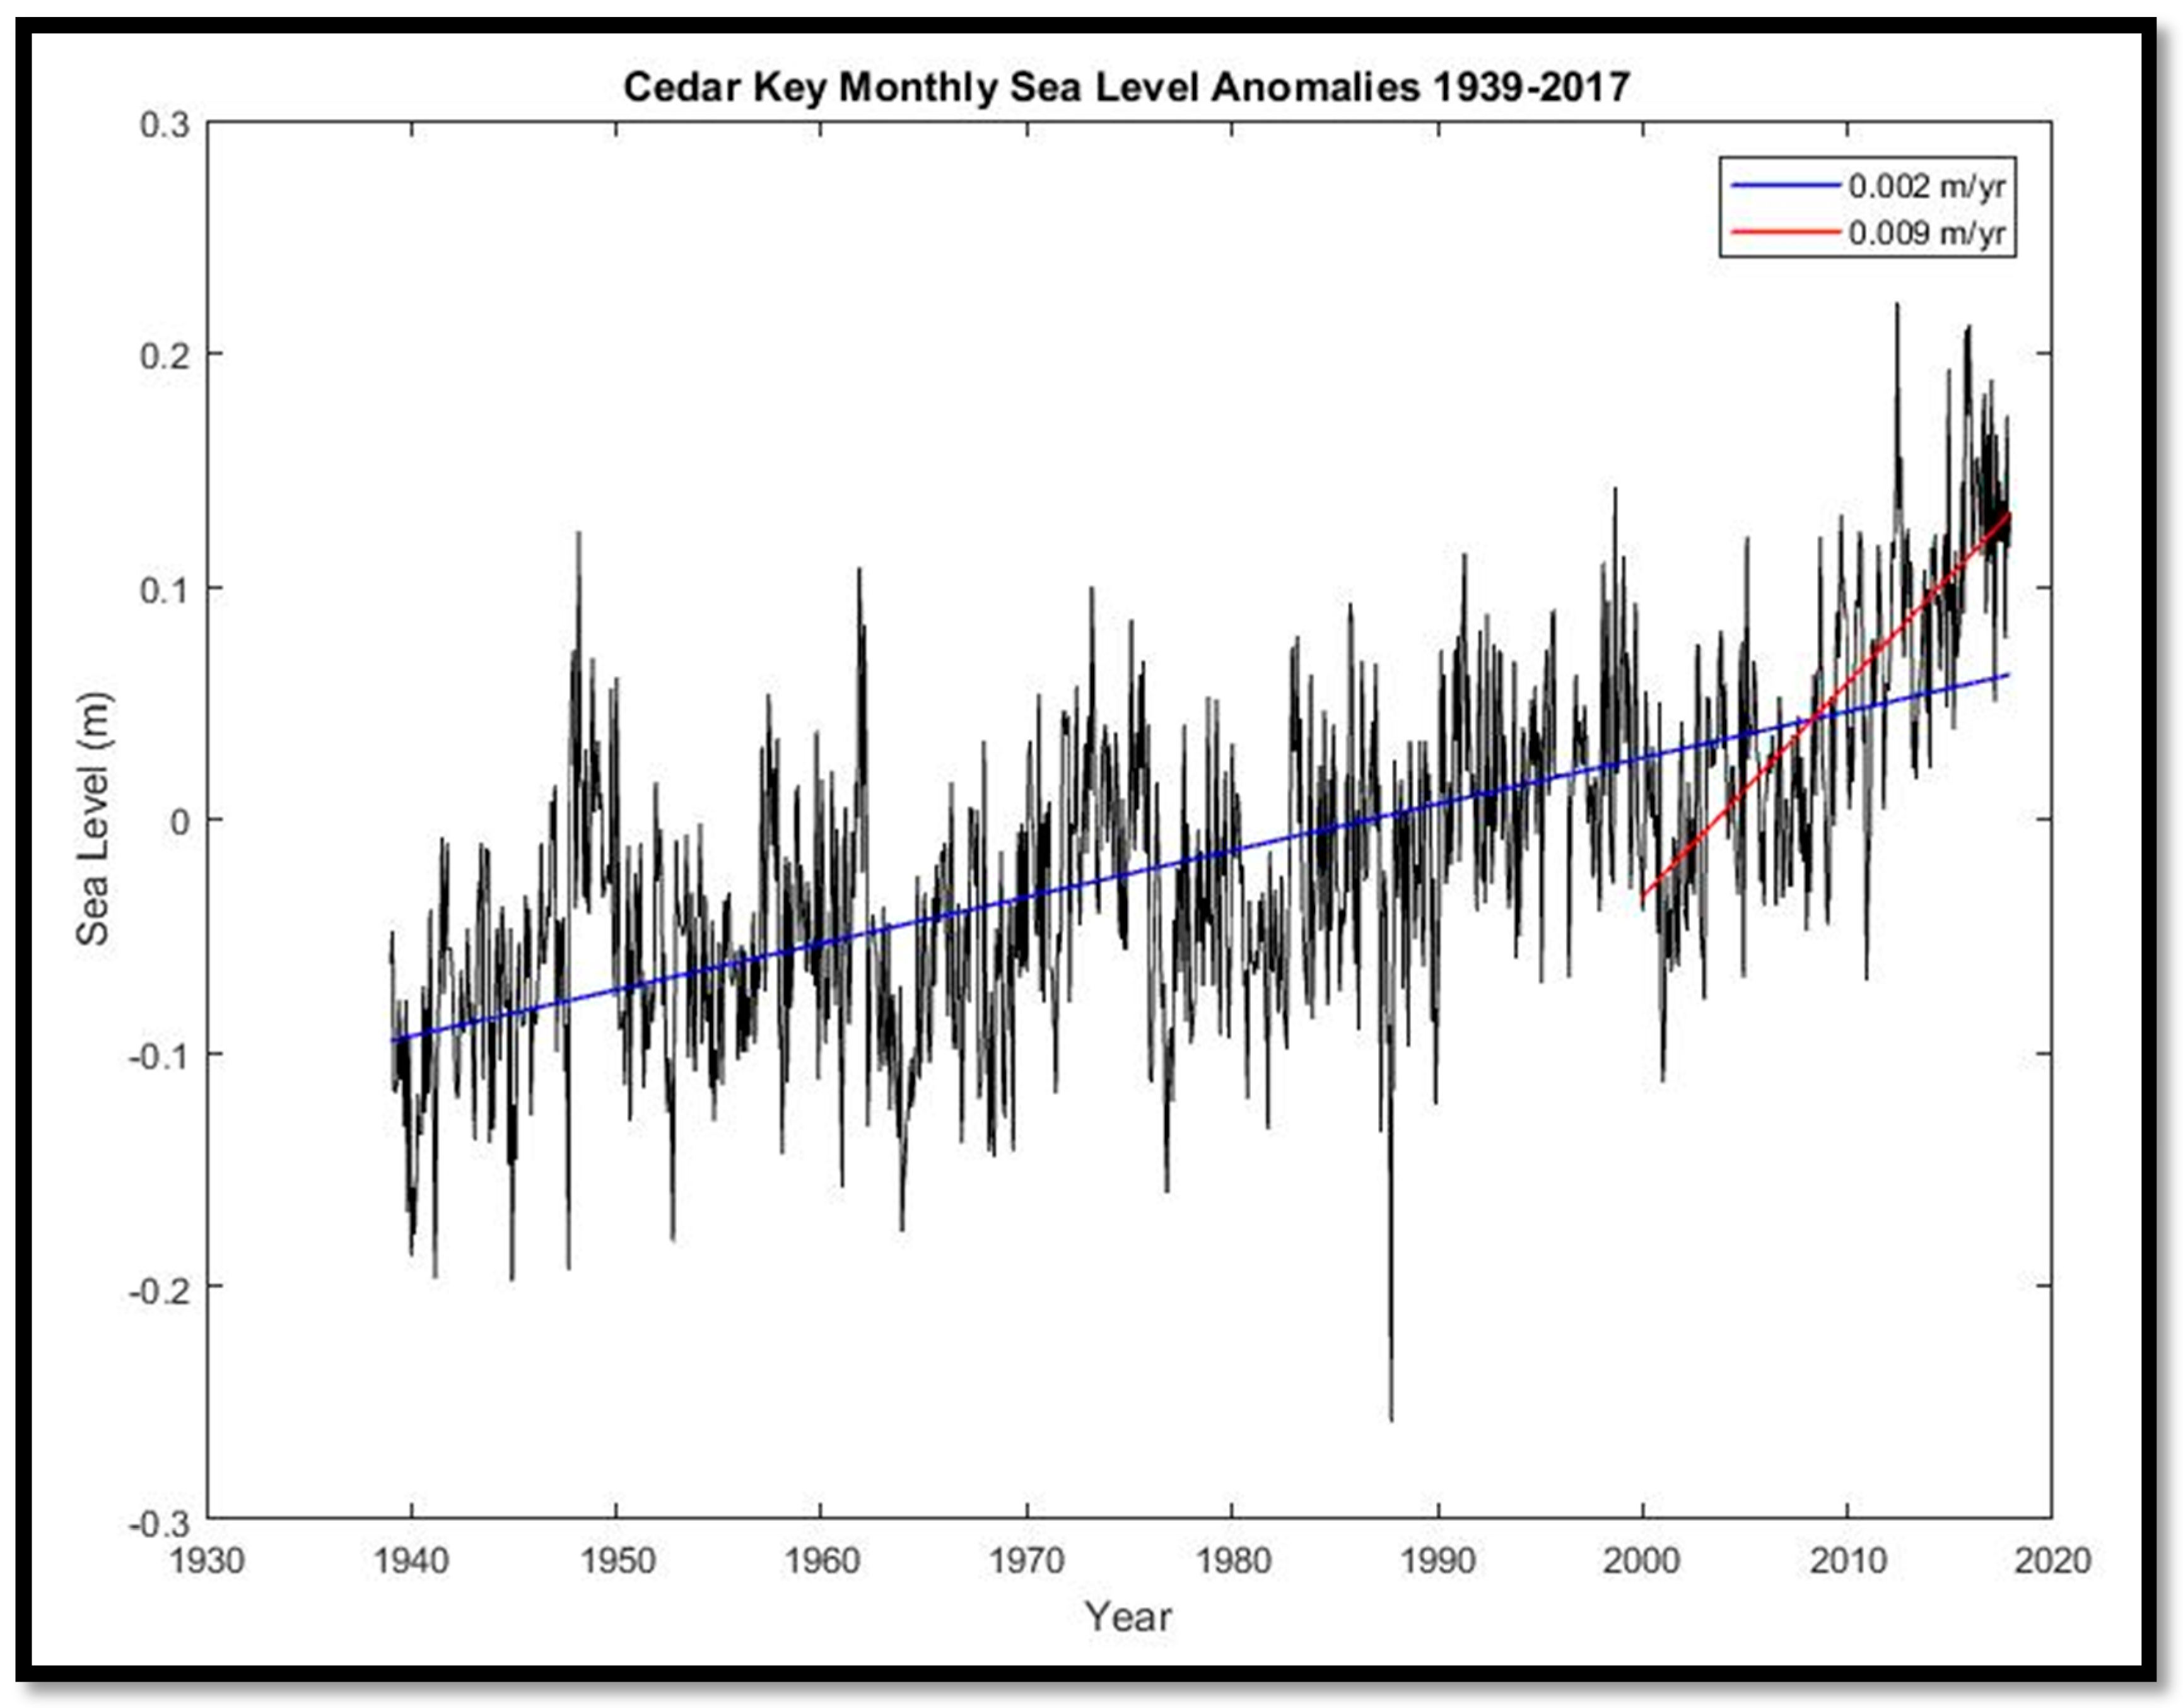
Regressions of daily precipitation data from Inverness, Florida, show that rainfall increased slightly but non-significantly from 2000 to 2017. Monthly tide gauge anomaly data from Cedar Key showed a 2 mm yr−1 rise in sea level between 1939 and 2017 (Figure 9). However, this rate doubles to 3.8 mm per year if only the 1990–2017 period is considered, and accelerates further to 9.1 mm per year for the period 2000–2017, with each period beginning in January and ending in December of the nominal year. The recent higher local sea-level rate is consistent with the findings of Nerem et al. [16] of a global acceleration in sea-level rise in recent years.
4. Discussion
Coastal forests are increasingly vulnerable to extreme events in a changing global climate. Those along the coast in the Big Bend region of Florida are predicted to lose upwards of 50% by 2100 [10,17]. Burkett and Kusler [18] summarize studies that specifically predict large-scale losses of Big Bend coastal marsh and S. palmetto forests as a result of sea-level rise.
Our study found that coastal forest decline at the marsh–forest boundary and along waterways in the Big Bend region accelerated in the 2010–2017 timeframe. Sea-level records showed an acceleration in sea-level rise since 2000. Aerial photographs from 2006 to 2014 suggested that forest degradation did not noticeably occur until 2010. Aerial photographs and satellite imagery indicated that forest degradation continued through 2014 and 2017 (Figure 10).
Time series of digital satellite-images showed only a small decline (0.36 km2) from 1982 to 2003, and a decline of 0.60 km2 from 2003 to 2015 with 30 m Landsat imagery, but a loss of 4.37 km2 from 2010 to 2017 with 2 m WorldView-2 imagery. The discrepancy of the observed decline in the latter two imagery pairs may be explained by the additional two years of study and the greater spatial resolution of the WorldView-2 imagery. The coarser Landsat data may contain mixed signals within each 900 m2 pixel that are better resolved by the 4 m2 WorldView-2 data. Discrepancies in preprocessing steps (i.e., top-of-atmosphere Landsat reflectance vs. atmospherically corrected WorldView-2 reflectance) may also have contributed to the discrepancies. However, Zhang et al. [19] found only marginal differences in agreement (r2 > 0.89 vs. r2 > 0.87, respectively) between NDVI results, from multi-sensor analyses, from when imagery was atmospherically corrected compared to when only converted to top-of-atmosphere reflectance. Further, the use of −0.05 as a threshold for signal vs. noise was chosen arbitrarily as no standard could be identified in the literature. Nonetheless, the patterns of decline location and extent agreed (Figure 6). The visual agreement of apparent degradation, as observed by the four independent data sources (i.e., in-situ photographs, imagery from WorldView-2, Landsat, and aerial surveys), was used to identify −0.05 as an appropriate threshold. Given that appropriate ground-truth data does not exist for this region during the time period studied, we relied on the in-situ photographs and agreement between independent data sources to substantiate the observed patterns of loss.
Langston et al. [11] studied mortality and recovery of 14 coastal tree species relative to tidal flooding, at a site located approximately 47 km northwest of this study area, during field campaigns in 1992–1998, 2000, 2005, and 2014–2016. Flooding rates were observed in 1992 and 1993, and modeled thereafter. The species-specific data shows that Quercus laurafolia, Morus rubra, Pinus taeda, and others were lost or found relict at all sites in 2014, regardless of whether flooding occurred or not. The USDA describes these three species as having no tolerance to salinity, but indicates that they are relatively tolerant to cold air temperatures (−19 to −36 °C; plants.usda.gov). Given that the coldest temperature recorded at Brooksville Airport was −18.2 °C, the loss of these species may be attributable to saltwater-intrusion-induced salt stress. However, S. palmetto, which is characterized as having “medium” salinity tolerance, but a minimum temperature tolerance of only −10 °C (plants.usda.gov), saw new growth in all five of the plots with minimal flooding as of 2014, while the flooded S. palmetto plots contained only lost or relict stands. Their data, however, were unable to resolve the observed 2010 event, or determine when die-off occurred. Further, they reported that Q. virginiana was regenerating in one plot in 2005, but relict there by 2014, relict in two plots, and regenerating in two plots, all of which reportedly experienced zero or one flooding week during this time. The USDA reports that Q. virginiana has a “low” salinity tolerance, and minimum temperature tolerance of −13.8 °C (plants.usda.gov). The Brooksville Airport’s lowest temperature of −18.2 °C occurred in January of 2011, which may help explain the mixed response of this species that has some salinity tolerance and did not experience flooding. Langston et al. [11] did evaluate temperature as a potential driver of decline, but only used annual temperatures, and therefore could not resolve the local single-day record-low temperature events in 2010 and 2011.
The cold snaps beginning in 2009 that exceeded the S. palmetto tolerance threshold of −10 °C were the first in 20 years, which itself set a record for the longest such hiatus over the period of record (1940–2017). The advent of high-spatial-resolution aerial and satellite imagery, combined with interannual or better repeat imagery acquisition, have allowed us to document the timing and extent of coastal forest decline, and correlate it with concomitant environmental phenomena. Further research, including the collection of robust ground validation data, is needed to monitor and assess future patterns of loss.
While Langston et al. [11] report regeneration of some species in some low-flooding plots in 2014, Figure 10 shows continued decline in 2014 and 2017 for our nearby study area. Doyle [20] predicted an estimated loss of 13,000 ha of Big Bend coastal forest under a one meter sea-level rise scenario by 2100, representing a rate of approximately 0.25% loss per year of the area studied here. Geselbracht et al. [10] predicted a loss of 0.5% per year. Our estimates suggest the loss from 2010 to 2017 is approximately 1% per year.
5. Conclusions
There is accelerated die-off of coastal forest along the Big Bend of Florida. The decline is documented by in-situ photographs, and in synoptic aerial and satellite imagery, although formal validation with ground-truth surveys was not feasible. Time series of the latter show that the decline accelerated in the last decade with no apparent regeneration.
We conclude that a combination of chronic sea-level rise stress and acute cold snap events have caused rapid, sustained, and likely irreversible damage to coastal forest along the largest stretch of undeveloped coastal land in the continental United States. Further decline is expected with an accelerating sea-level rise and an increase in extreme weather events.
High-resolution satellite images should be used to monitor seasonal to annual changes for the Big Bend region. This area serves as a canary in the coalmine for the compounded impacts on coastal habitats of sea-level rise and extremes in meteorological events.
Author Contributions
Conceptualization, M.J.M. and B.D.; methodology, M.J.M., B.D., and F.E.M.-K.; software, M.J.M.; validation, M.J.M.; formal analysis, M.J.M.; investigation, M.J.M. and F.E.M.-K.; resources, F.E.M.-K.; data curation, M.J.M. and B.D.; writing—original draft preparation, M.J.M.; writing—review and editing, B.D. and F.E.M.-K.; visualization, M.J.M.; supervision, F.E.M.-K.; project administration, F.E.M.-K.; funding acquisition, F.E.M.-K.
Funding
This work was funded by Research Coordination Networks: Sustained Multidisciplinary Ocean Observations, NSF grant number 1728913 and NASA grant number NNX14AP62A, as well as the NOAA Science Catalyst Grant program grant number NA14NOS4190145. Geospatial support for this work was provided by the Polar Geospatial Center under NSF PLR awards 1043681 and 15559691.
Acknowledgments
We would like to thank the two peer reviewers and editorial staff for considering this work, and for providing valuable constructive feedback.
Conflicts of Interest
The authors declare no conflict of interest. The funders had no role in the design of the study; in the collection, analyses, or interpretation of the data; in the writing of the manuscript, or in the decision to publish the results.
References
- Noss, R.F. Between the devil and the deep blue sea: Florida’s unenviable position with respect to sea level rise. Clim. Chang. 2011, 107, 1–16. [Google Scholar] [CrossRef]
- Zhu, M.-J.; Hoctor, T.S.; Volk, M.; Frank, K.I.; Zwick, P.D.; Carr, M.H.; Linhoss, A.C. Spatial conservation prioritization to conserve biodiversity in response to sea level rise and land use change in the matanzas river basin, northeast florida. Landsc. Urban Plan. 2015, 144, 103–118. [Google Scholar] [CrossRef]
- Intergovernmental Panel on Climate Change (IPCC). Climate Change 2014: Synthesis Report. Contribution of Working Groups I, II, and III to the Fifth Assessment Report of the International Panel on Climate Change; IPCC: Geneva, Switzerland, 2014; p. 151. [Google Scholar]
- Blood, E.R.; Anderson, P.; Smith, P.A.; Nybro, C.; Ginsberg, K.A. Effects of hurricane hugo on coastal soil solution chemistry in south carolina. Biotropica 1991, 23, 348–355. [Google Scholar] [CrossRef]
- Bilskie, M.V.; Hagen, S.C.; Alizad, K.; Medeiros, S.C.; Passeri, D.L.; Needham, H.F.; Cox, A. Dynamic simulation and numerical analysis of hurricane storm surge under sea level rise with geomorphologic changes along the northern gulf of mexico. Earths Future 2016, 4, 177–193. [Google Scholar] [CrossRef]
- Ross, M.S.; O’Brien, J.J.; da Silviera Lobo Sternberg, L. Sea-level rise and the reduction in pine forests in the florida keys. Ecol. Appl. 1994, 4, 144–156. [Google Scholar] [CrossRef]
- Lewis, R.R., 3rd; Milbrandt, E.C.; Brown, B.; Krauss, K.W.; Rovai, A.S.; Beever, J.W., 3rd; Flynn, L.L. Stress in mangrove forests: Early detection and preemptive rehabilitation are essential for future successful worldwide mangrove forest management. Mar. Pollut. Bull. 2016, 109, 764–771. [Google Scholar] [CrossRef] [PubMed]
- Donnelly, J.P.; Bertness, M.D. Rapid shoreward encroachment of salt marsh cordgrass in response to accelerated sea-level rise. Proc. Natl. Acad. Sci. USA 2001, 98, 14218–14223. [Google Scholar] [CrossRef] [PubMed] [Green Version]
- Koch, M.S.; Coronado, C.; Miller, M.W.; Rudnick, D.T.; Stabenau, E.; Halley, R.B.; Sklar, F.H. Climate change projected effects on coastal foundation communities of the greater everglades using a 2060 scenario: Need for a new management paradigm. Environ. Manag. 2015, 55, 857–875. [Google Scholar] [CrossRef] [PubMed]
- Geselbracht, L.L.; Freeman, K.; Birch, A.P.; Brenner, J.; Gordon, D.R. Modeled sea level rise impacts on coastal ecosystems at six major estuaries on florida’s gulf coast: Implications for adaptation planning. PLoS ONE 2015, 10, e0132079. [Google Scholar] [CrossRef] [PubMed]
- Langston, A.K.; Kaplan, D.A.; Putz, F.E. A casualty of climate change? Loss of freshwater forest islands on florida’s gulf coast. Glob. Chang. Biol. 2017, 23, 5383–5397. [Google Scholar] [CrossRef] [PubMed]
- Younes Cárdenas, N.; Joyce, K.E.; Maier, S.W. Monitoring mangrove forests: Are we taking full advantage of technology? Int. J. Appl. Earth Observ. Geoinf. 2017, 63, 1–14. [Google Scholar] [CrossRef]
- Lusk, M. Chassahowitzka National Wildlife Refuge Comprehensive Conservation Plan; U.S. Department of the Interior Fish and Wildlife Service Southeast Region: Atlanta, GA, USA, 2012.
- Wolf, A. Using Worldview 2 Vis-Nir MSI Imagery to Support Land Mapping and Feature Extraction Using Normalized Difference Vegetation Index Ratios; Digital Globe: Westminster, CO, USA, 2010. [Google Scholar]
- McCarthy, M.J.; Radabaugh, K.R.; Moyer, R.P.; Muller-Karger, F.E. Enabling efficient, large-scale high-spatial resolution wetland mapping using satellites. Remote Sens. Environ. 2018, 208, 189–201. [Google Scholar] [CrossRef]
- Nerem, R.S.; Beckley, B.D.; Fasullo, J.T.; Hamlington, B.D.; Masters, D.; Mitchum, G.T. Climate-change-driven accelerated sea-level rise detected in the altimeter era. Proc. Natl. Acad. Sci. USA 2018, 115, 2022–2025. [Google Scholar] [CrossRef] [PubMed]
- Doyle, T.W.; Krauss, K.W.; Conner, W.H.; From, A.S. Predicting the retreat and migration of tidal forests along the northern gulf of mexico under sea-level rise. For. Ecol. Manag. 2010, 259, 770–777. [Google Scholar] [CrossRef]
- Burkett, V.; Kusler, J. Climate change: Potential impacts and interactions in wetlands of the united states. J. Am. Water Resour. Assoc. 2000, 36, 313–320. [Google Scholar] [CrossRef]
- Zhang, H.K.; Roy, D.P.; Yan, L.; Li, Z.; Huang, H.; Vermote, E.; Skakun, S.; Roger, J.-C. Characterization of sentinel-2a and landsat-8 top of atmosphere, surface, and nadir brdf adjusted reflectance and ndvi differences. Remote Sens. Environ. 2018, 215, 482–494. [Google Scholar] [CrossRef]
- Doyle, T.W. Modeling Global Change Effects on Coastal Forests; 1998-0002; USGS: Reston, VA, USA, 1998; pp. 67–80.
Figure 1.
Study area (grey box) showing the three wildlife management and refuge areas within the Big Bend region of Florida’s Gulf coast (inset maps; background map source: ArcGIS® basemaps).
Figure 1.
Study area (grey box) showing the three wildlife management and refuge areas within the Big Bend region of Florida’s Gulf coast (inset maps; background map source: ArcGIS® basemaps).

Figure 2.
Before and after photographs of two sites (see Figure 3 and Figure 4) within the study area. (Top) Site 1 showing photographs from 2011 (left) and 2016 (right). (Bottom) Site 2 showing photographs from 2004 and 2015. The photos reveal a thinning of tree stands and loss of canopy cover at both sites (© Copyright Benjamin Dimmitt).

Figure 3.
Aerial photographs from 2009, 2010, 2011, and 2014 of a tributary along the Chassahowitzka River appear to show substantial loss of coastal forest adjacent to the waterway.
Figure 3.
Aerial photographs from 2009, 2010, 2011, and 2014 of a tributary along the Chassahowitzka River appear to show substantial loss of coastal forest adjacent to the waterway.

Figure 4.
Aerial photographs from 2006, 2010, 2011, and 2014 of a tributary along the Chassahowitzka River.
Figure 4.
Aerial photographs from 2006, 2010, 2011, and 2014 of a tributary along the Chassahowitzka River.

Figure 5.
Decline in coastal forest normalized difference vegetation index (NDVI) (<−0.05) from Landsat series, shown in red, for 1982–2003 (left) and 2003–2015 (right; background map source: ArcGIS® basemaps).
Figure 5.
Decline in coastal forest normalized difference vegetation index (NDVI) (<−0.05) from Landsat series, shown in red, for 1982–2003 (left) and 2003–2015 (right; background map source: ArcGIS® basemaps).

Figure 6.
Decline in coastal forest NDVI (<−0.05), shown in red, from WorldView-2 (left; 2010–2017) and Landsat (right; 2003–2015). United States Geologic Survey (USGS) river gauge station 1 and 2 sites are shown as green dots (background map source: ArcGIS® basemaps).
Figure 6.
Decline in coastal forest NDVI (<−0.05), shown in red, from WorldView-2 (left; 2010–2017) and Landsat (right; 2003–2015). United States Geologic Survey (USGS) river gauge station 1 and 2 sites are shown as green dots (background map source: ArcGIS® basemaps).

Figure 7.
Daily minimum temperature recorded at the Brooksville Airport, Florida, from 1996 to 2017. Sabal palmetto “hardiness” threshold is plotted in red (plants.usda.gov).
Figure 7.
Daily minimum temperature recorded at the Brooksville Airport, Florida, from 1996 to 2017. Sabal palmetto “hardiness” threshold is plotted in red (plants.usda.gov).

Figure 8.
Daily minimum temperature recorded at the Tallahassee Regional Airport, Florida, from 1989 to 2017. S. palmetto “hardiness” threshold is plotted in red.
Figure 8.
Daily minimum temperature recorded at the Tallahassee Regional Airport, Florida, from 1989 to 2017. S. palmetto “hardiness” threshold is plotted in red.

Figure 9.
Monthly mean sea-level anomalies for Cedar Key, Florida (1939–2017). Trendlines are shown for the entire record (2 mm yr−1) and for the period 2000–2017 (9 mm yr−1).
Figure 9.
Monthly mean sea-level anomalies for Cedar Key, Florida (1939–2017). Trendlines are shown for the entire record (2 mm yr−1) and for the period 2000–2017 (9 mm yr−1).

Figure 10.
WorldView-2 imagery (copyright 2010 Digital Globe, Inc.) time series of coastal forest loss along a Chassahowitzka River tributary, from 2010 to 2017, indicating further decline and no apparent recovery after initial 2010 and 2011 cold events.
Figure 10.
WorldView-2 imagery (copyright 2010 Digital Globe, Inc.) time series of coastal forest loss along a Chassahowitzka River tributary, from 2010 to 2017, indicating further decline and no apparent recovery after initial 2010 and 2011 cold events.


Table 1.
Satellite image acquisition information.
| Satellite Sensor | Acquisition Date | Path/Row |
|---|---|---|
| Landsat 4 TM | 18 December 1982 | 17/40 |
| Landsat 7 ETM+ | 11 February 2003 | 17/40 |
| Landsat 8 OLI | 20 February 2015 | 17/40 |
| WorldView-2 | 5 January, 15 February, 26 February, 2010 (12 images) | N/A |
| WorldView-2 | 19 March 2017 (6 images) | N/A |
Table 2.
Decline in NDVI (<−0.05) for image pairs in km2 (percent of study area).
| Image Pair | NDVI Decline |
|---|---|
| 1982–2003 (LS) | 0.36 (0.60%) |
| 2003–2015 (LS) | 0.60 (1.00%) |
| 2010–2017 (WV2) | 4.37 (7.44%) |
© 2018 by the authors. Licensee MDPI, Basel, Switzerland. This article is an open access article distributed under the terms and conditions of the Creative Commons Attribution (CC BY) license (http://creativecommons.org/licenses/by/4.0/).
Share and Cite
MDPI and ACS Style
McCarthy, M.J.; Dimmitt, B.; Muller-Karger, F.E. Rapid Coastal Forest Decline in Florida’s Big Bend. Remote Sens. 2018, 10, 1721. https://doi.org/10.3390/rs10111721
AMA Style
McCarthy MJ, Dimmitt B, Muller-Karger FE. Rapid Coastal Forest Decline in Florida’s Big Bend. Remote Sensing. 2018; 10(11):1721. https://doi.org/10.3390/rs10111721
Chicago/Turabian StyleMcCarthy, Matthew J., Benjamin Dimmitt, and Frank E. Muller-Karger. 2018. "Rapid Coastal Forest Decline in Florida’s Big Bend" Remote Sensing 10, no. 11: 1721. https://doi.org/10.3390/rs10111721
Note that from the first issue of 2016, this journal uses article numbers instead of page numbers. See further details here.