Quantifying Changes on Forest Succession in a Dry Tropical Forest Using Angular-Hyperspectral Remote Sensing


Centre for Earth Observation Sciences (CEOS), Earth and Atmospheric Sciences Department, University of Alberta, Edmonton, AB T6G 2E3, Canada
*
Author to whom correspondence should be addressed.
Remote Sens. 2018, 10(12), 1865; https://doi.org/10.3390/rs10121865
Submission received: 3 October 2018
/
Revised: 17 November 2018
/
Accepted: 19 November 2018
/
Published: 22 November 2018
(This article belongs to the Special Issue Advances in Remote Sensing of Forest Structure and Applications)
Abstract
:The tropical dry forest (TDF) is one the most threatened ecosystems in South America, existing on a landscape with different levels of ecological succession. Among satellites dedicated to Earth observation and monitoring ecosystem succession, CHRIS/PROBA is the only satellite that presents quasi-simultaneous multi-angular pointing and hyperspectral imaging. These two characteristics permit the study of structural and compositional differences of TDFs with different levels of succession. In this paper, we use 2008 and 2014 CHRIS/PROBA images from a TDF in Minas Gerais, Brazil to study ecosystem succession after abandonment. Using a −55° angle of observation; several classifiers including spectral angle mapper (SAM), support vector machine (SVM), and decision trees (DT) were used to test how well they discriminate between different successional stages. Our findings suggest that the SAM is the most appropriate method to classify TDFs as a function of succession (accuracies ~80 for % for late stage, ~85% for the intermediate stage, ~70% for early stage, and ~50% for other classes). Although CHRIS/PROBA cannot be used for large-scale/long-term monitoring of tropical forests because of its experimental nature; our results support the potential of using multi-angle hyperspectral data to characterize the structure and composition of TDFs in the near future.
1. Introduction
The tropical dry forest (TDF) is one of the most endangered ecosystems in Latin America due to the many socio-economic pressures promoting agriculture expansion over its conservation [1]. This expansion affects TDFs biodiversity since this ecosystem shelters one of the highest number of endemic species in the world [2]. This high level of endemism, on top of its contribution to many ecosystem services, makes it of special interest for conservation biologists around the world [3]. Unfortunately, this interest does not translate into large conservation initiatives, since it has been demonstrated that TDF conservation policies in Mexico, Costa Rica, and Brazil are only effective within protected natural areas [4].
Currently, the TDFs in Latin America are associated with agricultural fields combined with urban areas and forests fragments under different stages of ecological succession [5]. Successional stages in TDFs are defined in terms of their structure and composition to avoid local differences (such as microclimate, soil type, and intensity of previous land use [6] that could make comparisons between regions and time frames difficult. As a result, TDFs vary in their species composition and structure as they grow from an early phase of the succession to a more complex and mature stage (Table 1). In general terms, young forests are formed by sparse and short trees and present an open understory usually with remnants of old pastures. In the intermediate succession between young and mature forests, the understory is invaded by saplings of new trees, shrubs, and lianas. Mature forests are formed by taller trees, lianas, and denser canopies.
Remote sensing is an indispensable tool for determining the distribution and health status of tropical forests, given that they provide continuous spatial and temporal information [7]. Moreover, operational satellite platforms collect data from the Earth’s surface regularly, permitting the monitoring of dynamic ecological processes such as deforestation and forest regeneration. Among the satellites designed for monitoring and evaluation of the status of the environment, CHRIS/PROBA presents two useful characteristics for the study of forest succession. This satellite is equipped with a hyperspectral sensor, and it can acquire quasi-simultaneous images with different angles of observation [8]. These two features are very convenient for the integrated study of structural and compositional components of tropical secondary dry forests. In fact, some authors have pointed out that the classification of successional stages, according to their composition and structure, is accurate for temperate and rainforest ecosystems [9,10,11,12]. Furthermore, previous studies have demonstrated that CHRIS/PROBA cannot only be used to discriminates successional stages of the TDFs in the Americas, but also to map their succession at a given moment on time [13,14]. It was also found in [13,14] that off-nadir angles belonging to the shaded hemisphere in the sensor-object-sun geometry provide more accurate results in discriminating TDF successional stages than other geometries.
Although CHRIS/PROBA was originally a one-year experimental mission and predecessor of current operational missions such as the European Space Agency (ESA) missions, Copernicus programme, and EnMAP, it orbited for 11 years. That allowed to conduct more research using this platform, including the multi-temporal dimension of vegetation studies [15,16,17,18,19,20]. Nevertheless, since it was not an operational mission, CHRIS/PROBA was restricted in the number of acquisitions, limiting the area observed and the frequency of visits. This paper builds on previous work [13,14] that used CHRIS/PROBA to map the succession of the Brazilian TDF succession; specifically, the TDF at the Parque Estadual de la Mata-Seca, Minas Gerais, Brazil. This study explores the robustness of three different types of classifiers: support vector machine (SVM, radial basis function), spectral angle mapper (SAM), and decision trees (SEE5) to classify TDF succession changes between two dates 2008 and 2014. Temporal changes in forest degradation and recovery have been primarily reported with operational multispectral missions such as Landsat [21,22,23,24,25]. However, to our knowledge, no study has reported a temporal comparison of forest dynamics using hyperspectral data from multi-angular acquisitions.
2. Materials and Methods
2.1. Study Site
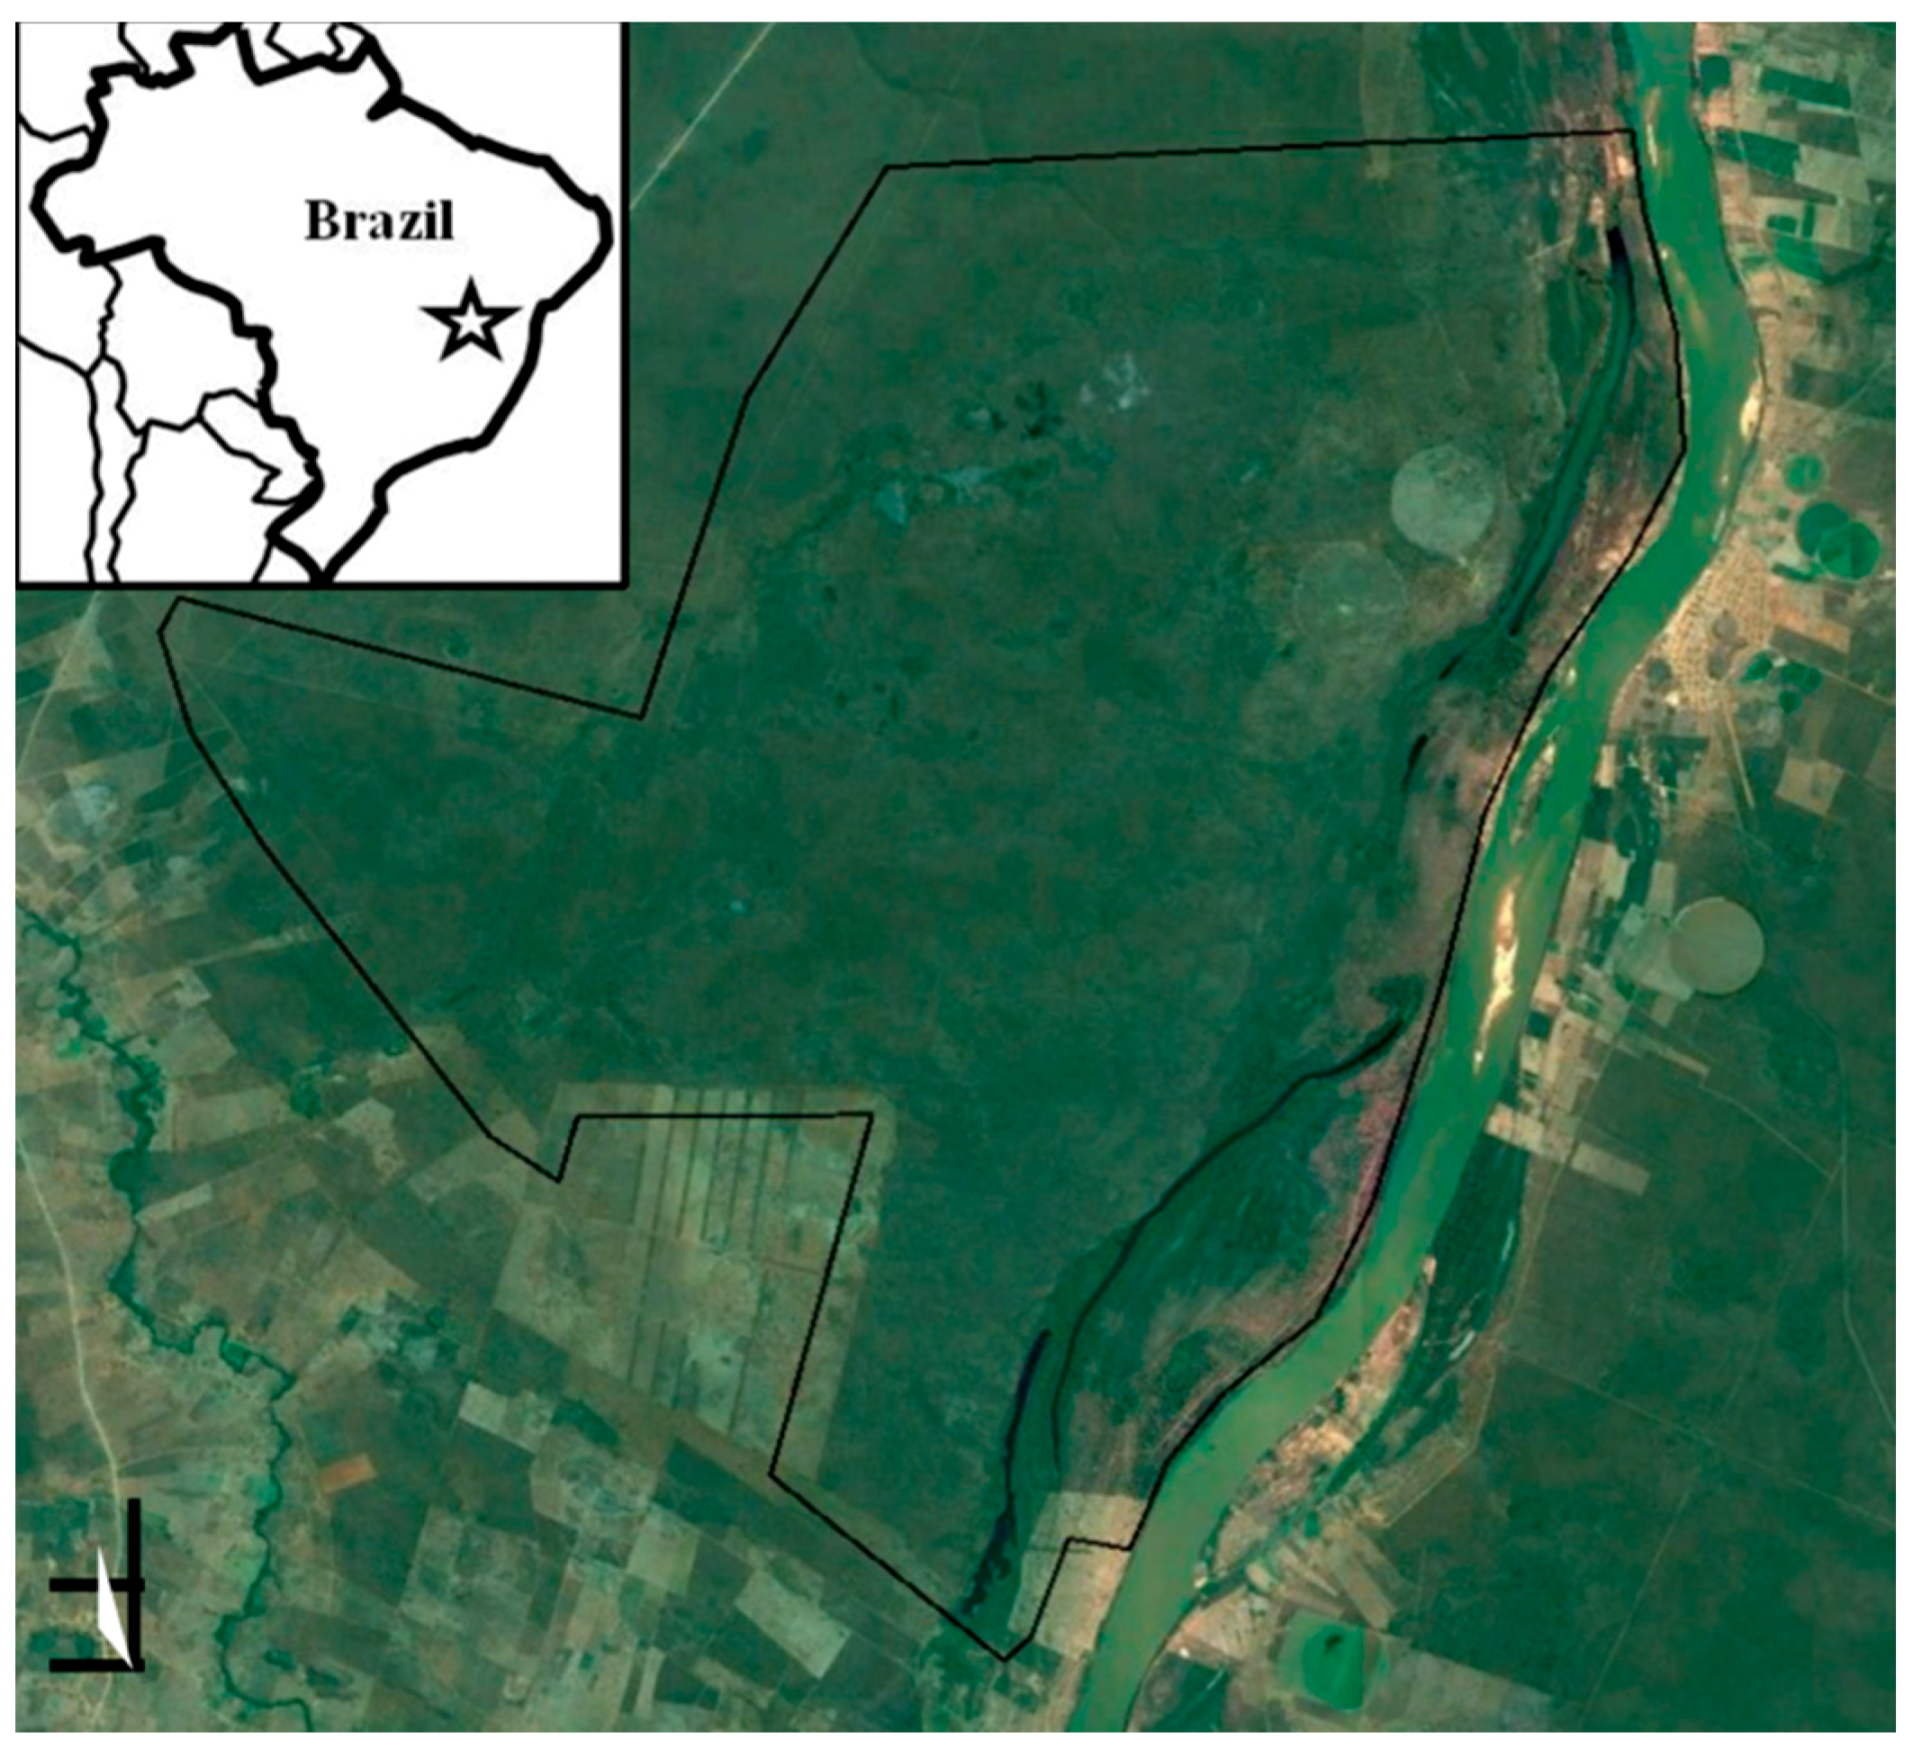
The Parque Estadual de la Mata-Seca (PEMS) in Minas Gerais, Brazil (14°48’36”–14°56’59” S, 43°55’12”–44°04’12” W), was converted into a protected area in 2000 after the expropriation of farmlands (Figure 1). The area protected by the Park is 10,281 ha and lies along the Sao Francisco River (the second longest river of Brazil). Climate in the region is semi-arid tropical (Köppen classification), with an average temperature of 24.4°C defined by a rainy season between October and May (annual average 800–1,250 mm) and a dry season with little or no rainfall for the rest of the year. Potential vegetation in the study area is TDF that grows in rich and flat soils [23]. According to the local classification, the ecosystem is Floresta Tropical Decidual. Most of the species lose their leaves during the dry season, except in areas close to water bodies.
The main economic activities in the area before it was put under protection were cattle ranching and farming (corn and bean). Around 1525 ha were abandoned pasturelands in 2008 with different degrees of ecological regeneration, while the rest of the area was formed by patches of primary and secondary TDFs [26].
At the PEMS, we find three successional stages within the secondary forest, according to a classification based on structure and composition [6]: Late, Intermediate, and Early stages. From the structural point of view, the early stage of succession presents an open and homogeneous tree layer with trees up to 5 m and an understory of abandoned pastures, bare soil, and spread bushes. The intermediate stage presents at least two canopy layers; one formed by older trees with an average height of 10 m, and another by shorter trees with an average of 5 m growing in the canopy gaps. The understory consists of a dense layer of saplings. The late stage consists of a heterogeneous upper layer with trees at an average height of 15 m, and some emergent trees. This stage consists of several tree layers with abundant lianas and a sparse understory. About the species composition, the three successional stages share some species, especially the intermediate and late successional stages, while other species are characteristic of a specific successional stage. As the succession progresses, some species are substituted by other species that are present a different phenology cycle [27,28].
Forest inventory and remote sensing ground measurements have been reported regularly since 2006 for the PEMS, offering a unique opportunity of validating satellite data at any date of acquisition. In 2006, 18 20 × 50 m (0.1 ha) permanent plots were established at the PEMS, 6 per each successional stage. They were characterized by their structure and composition. For all trees > 0.05 m DBH their basal area, height and species were noted. Also, the leaf area index (LAI) was measured with a LiCOR 2000 and hemispherical photos [29]. The Holdridge complexity index (HCI) (modified from [1] was calculated with these all previous parameters and it is a comprehensive indicator of both structural and compositional components of the successional stages of the TDFs, which have been defined as the differential characteristics of forest succession (Table 1). Once the permanent plots were established on 2006, regular collection of data has been recorded until the present day.
Furthermore, a second monitoring campaign was performed on 2010. More than 100 sites were sampled along the park were the successional stage of the forest. The points were separated from each other at least 500 m and into the core of the forest at least 50 m from the edge of the forest, to avoid edge effects, i.e. different forest structure for the extra exposure to light, wind, or exposure factors [30]. This campaign aimed to have a general overview of the distribution of the forest succession at the PEMS and to support long-term remote sensing studies at the site.
2.2. Sensor Description
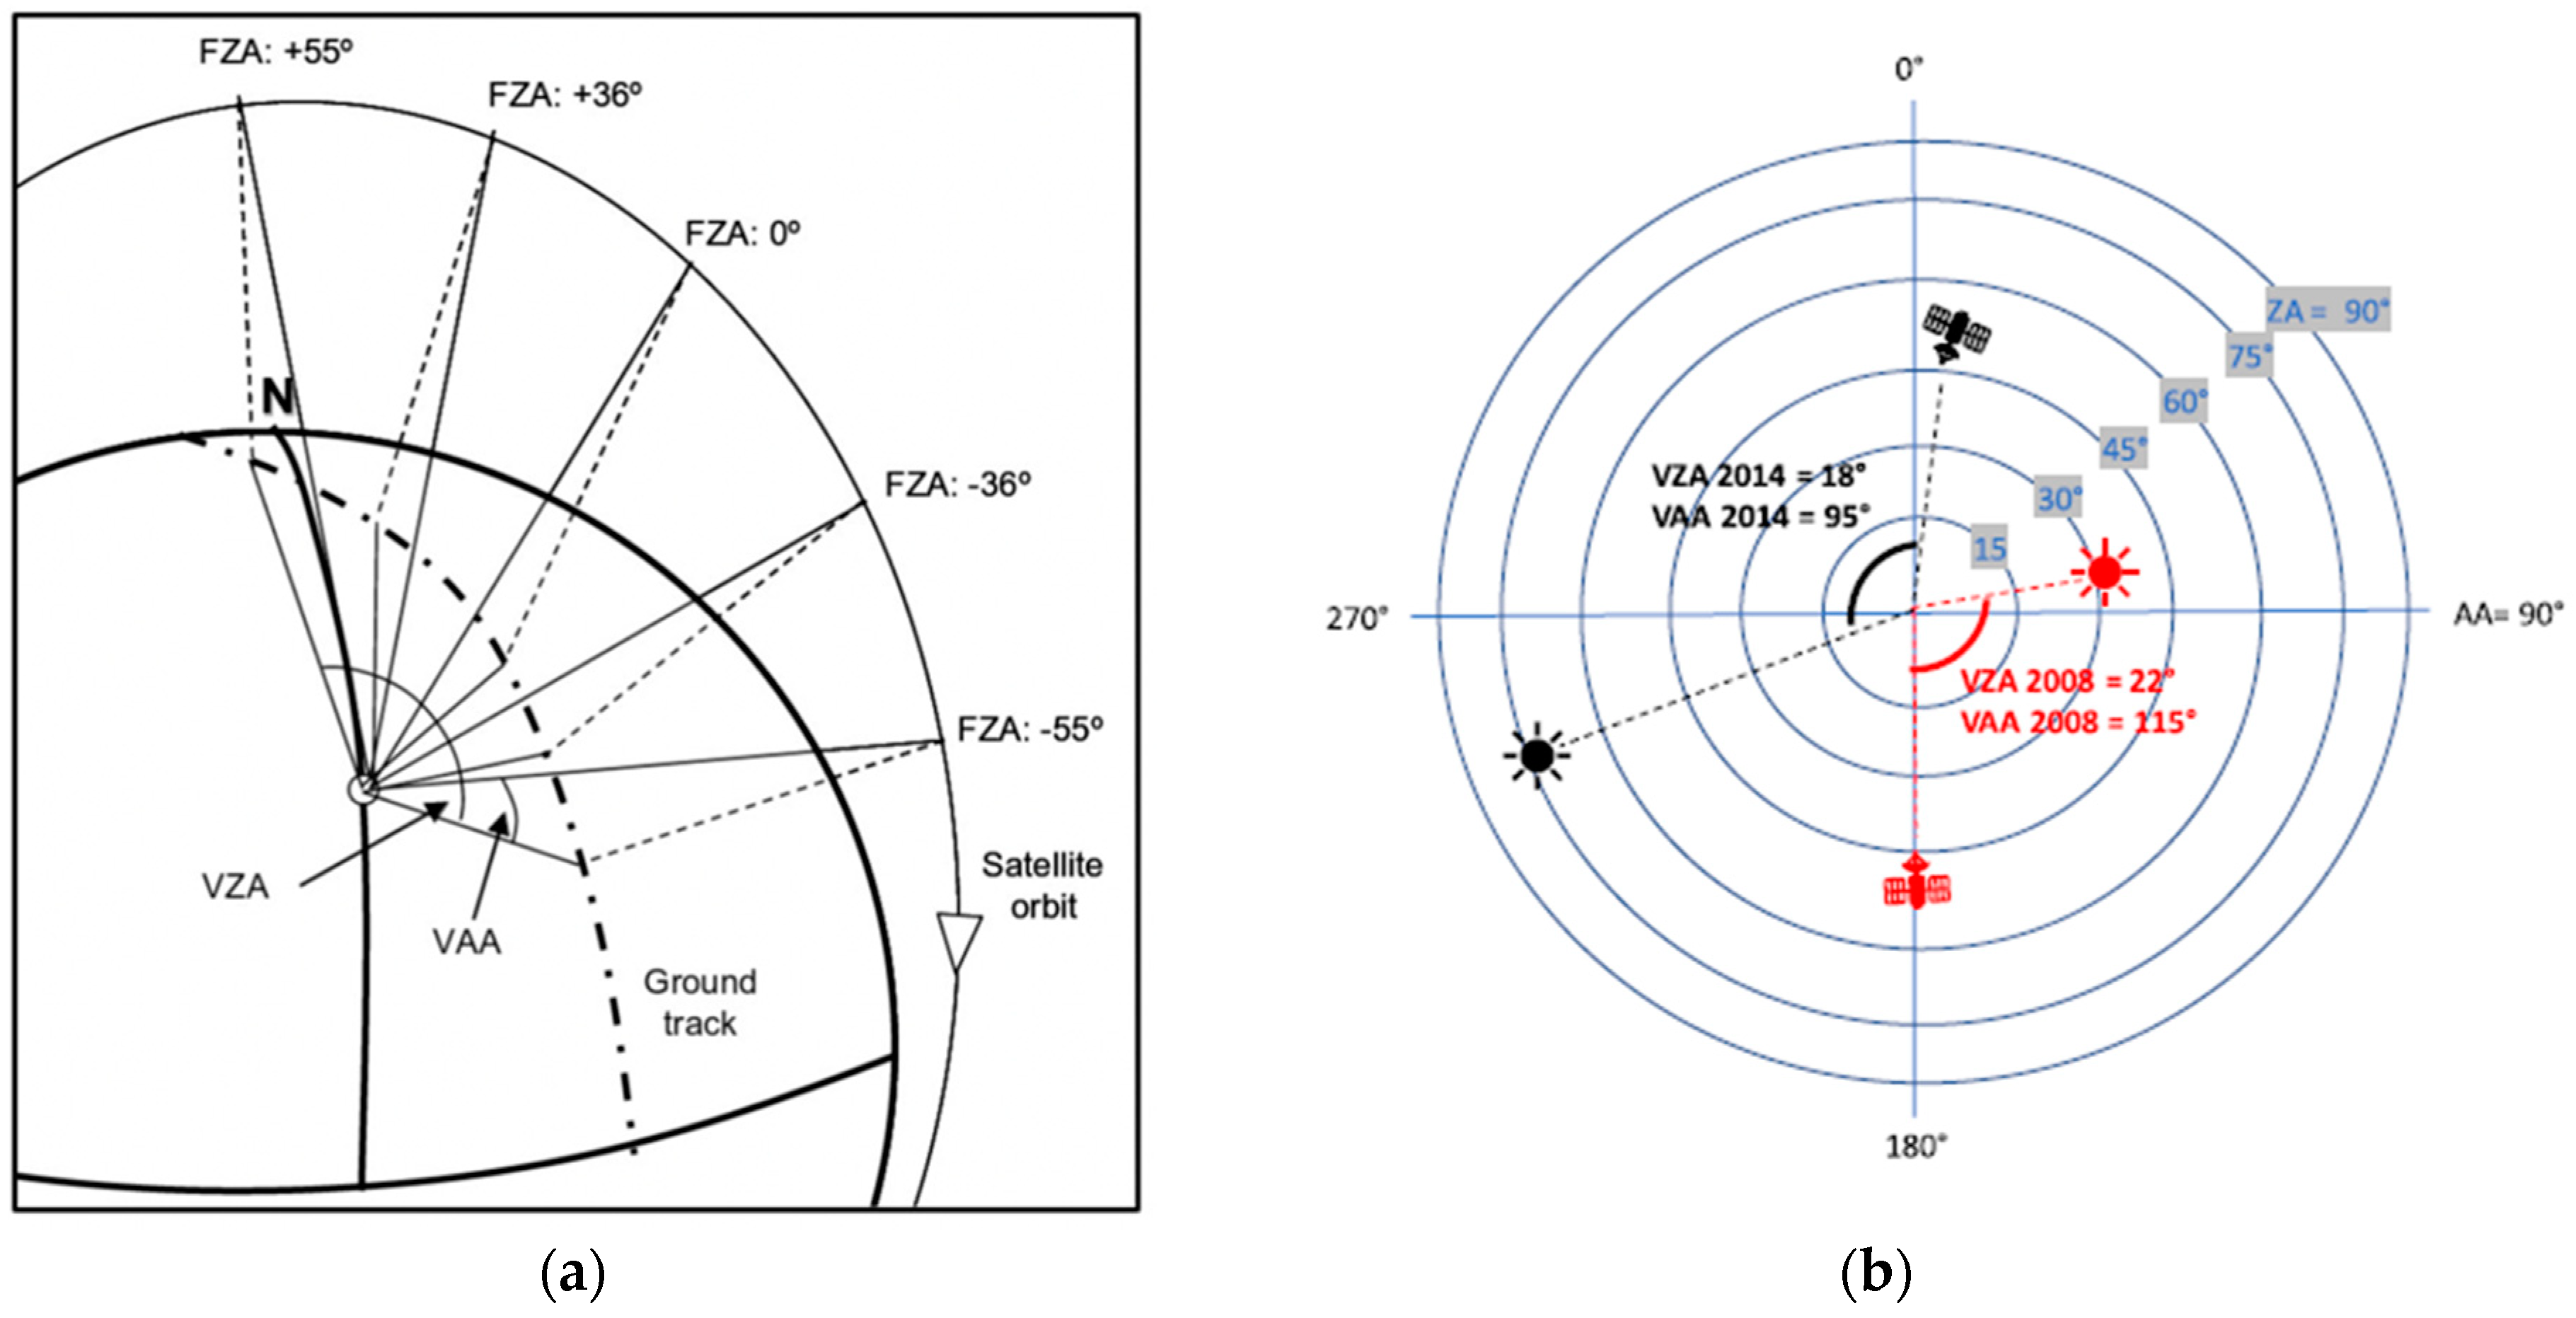
CHRIS is the sensor on board of the PROBA-1 platform (Project for On-Board Autonomy) launched by the European Space Agency (ESA) in 2001 [31]. PROBA-1 describes a solar polar synchronic elliptic orbit and crosses the Equator at 10:30 a.m. in its descending node. The image acquisition can be configured in five different modes that differ in the number and location of spectral bands, depending on the target of study. Also, the swath and pixel size present a different configuration depending on the acquisition mode. In the present study we selected Mode-4 (vegetation) because of the interest in the spectral range related to physiology functions and its smaller pixel resolution (17 m). Mode-4 provides 13 km swath images and covers the spectral range between 400–800 nm in 18 spectral bands, with a bandwidth between 6 and 11 nm (Table 2). Due to the narrow field-of-view (FOV) of the sensor, the satellite ground track rarely coincides with the area of study. Therefore, most of the times the sensor modifies its along and across pointing to focus the target of interest, using four reaction motors installed in the platform. On the other hand, the satellite takes five images with five different angles in its along-track direction. Nominally, these angles of observation are 0°, ±36° and ±55°, respect a normal plane to the ground surface, when the satellite is in its closest point to the target (Figure 2) [8,31]. CHRIS/PROBA’s positive and negative angles refer to the position of the satellite respect to the target. Negative angles are east from the ground track, while positive angles are west from the ground track.
2.3. Acquisition and Data Processing
The first successful image from CHRIS/PROBA was taken at the PEMS on February 2008, and the last one on March 2015. Every year between five to six CHRIS/PROBA images were captured, but most of them had to be discarded because of high cloud cover. It was not possible to undertake a phenology study because the necessary cloud-free images were unavailable. Two CHRIS images whose acquisition dates were furthest apart were selected, and these were from the wet season. As such, two images were selected that covered the largest time frame possible for PEMS, using CHRIS/PROBA (24 February 2008 and 18 December 2014), corresponding to the wet season (Table 3). According to [13,14] images from the dry season present a better spectral separation of the successional stages of the TDFs than images from the wet season, which permit more accurate maps. However, it was impossible to collect cloud-free images of the dry season that covered larger periods than two years and for that reason images of the wet season were selected instead. Extreme observation angles (±55°) were proved to provide better spectral separation of successional stages of the TDFs in different American locations for both the dry and the wet season [13], as such only an angle −55° was used.
All selected images were atmospherically corrected using CHRIS/PROBA ToolBox 4.7.1. [32], a software created specifically for the correction of CHRIS/PROBA and MERIS data. The use of this software involves a three-step process [33]: (1) noise reduction, (2) cloud screening, and (3) atmospheric correction based on the radiative transfer model MODerate resolution TRANsmittance (MODTRAN-4) [34]. The last step converts radiance to reflectance considering adjacency effects [34]. Step three of the atmospheric correction follows the same workflow as the FLAASH model but has been specifically adapted for the calibration parameters of CHRIS/PROBA in the BEAM-Visat tool [35].
Despite these corrections, it is possible to observe stripping linked to push-broom sensors in classified maps generated with these images right after the mentioned atmospheric correction. For that reason, an inverse principal component analysis (PCA) was applied in order to remove background noise and stripping after the atmospheric correction. In the case of the image for 2008, five principal components were selected (with 99.99% variance explained), while three were used for 2014 image (total of 99.89% variance explained). Next, the PCA process was inverted to obtain reflectance bands again, discarding noisy PCs. The 2008 image was georectified to a QuickBird image with a total RMSE of 0.65 for the 2005 image, and a RMSE of 1.14 for the 2014 image.
Since CHRIS/PROBA changes its across-track pointing according to the orbit in the moment of acquisition, the ground footprint of each image is always different, from date to date. Therefore, we only used the area that was common to both dates of study and within the park boundary.
2.4. Training and Validation Data
In 2006 permanent plots were established at the PEMS with the goal of developing long term ecological research activities [6], and periodical monitoring has been done seasonally since then to present. The selection of these plots was random stratified. Three plots per successional stage were identified in the field for which DBH, tree height, and canopy openness were recorded each season (Table 1). The plots were used as training data for classification of the CHRIS images targeting the three forest successional classes. Since 2006, the long-term monitoring plots have grown to the next successional stage: the early successional stage plots in 2008 evolved to intermediate successional stage plots in 2014 and the intermediate stage plots in 2008 growth to late successional stage plots in 2014. Therefore, the plots that were used as ‘early stage’ in 2008 were used as ‘intermediate stage’ in 2014; the plots classified as ‘intermediate stage’ in 2008 has been considered ‘late stage’ in 2014, and the plots corresponding to ‘late stage’ remained as so in both mapping processes. For 2014, new ‘early stage’ training areas were defined in the field, since the early stages defined in 2006 for the permanent plots do not apply as early stages in 2014 anymore, they were considered ‘intermediate stages’. A 20% of pixels within each of the permanent plots were randomly selected for training.
Another field campaign was conducted in 2010 to identify the three forest successional stages and measure tree height at PEMS, collecting more than 100 locations. A systematic stratified sampling method was used following the roads, setting a plot every 500 m along the road and at least 50 m perpendicular to the road inside the forest to avoid forest edge effects. These points have been used for validation as a set of points independent of the training dataset.
2.5. Classification of Forest Successional Stages
The methods used to classify the successional stages at the PEMS were: (i) spectral angle mapper (SAM) [36], (ii) support vector machine (SVM) [37], and (iii) decision trees [38]. Two CHRIS/PROBA images (2008 and 2014) with an angle of observation of −55º were individually mapped and later compared. Each classification method used the same training data (2006 sites) to ensure a systematic comparison among approaches. A set of independent validation points (2010 sites) were used to validate the outcome of the classification methods.
Spectral angle mapper (SAM) compares the angle that separates a given spectra from a reference spectrum in a n-dimensional space, n being the number of spectral bands used. Since CHRIS/PROBA is a hyperspectral sensor with a large number of bands, SAM was selected because it allows the analysis of all bands together, which is expected to help in the spectral separation of similar spectra. In our case, we used the 18 spectral bands of CHRIS/PROBA Mode-4, after the inverse principal component analysis. Smaller angles describe larger similarity between the reference and observed spectra [36]. SAM is insensitive to illumination and albedo effects, which is particularly interesting in multi-angularity multi-temporal studies like the present study, where the light can vary from scene to scene. Since SAM is not a wall-to-wall classification, there is no need to identify all endmembers of the scene, but only the classes of interest. Furthermore, it is possible to set a threshold (in radians) under which pixels will not be classified. Smaller thresholds imply better matches, but also can omit some pixels.
SVM is a machine learning statistical method that separates pixels into classes using a decision surface in an n-dimension space (being n the number of spectral bands, in this case) to maximize the separation between clusters of pixels [37]. The surface is called ‘optimal hyperplane’ and the pixels closest to this surface, ‘support vectors’, which are decisive for the delineation of the classes. SVM is primarily based on binary decisions, but it can also function as a multi-class classifier by combining more than one binary decision and creating a binary classifier for each pair of classes and selecting the highest probability among all combinations. SVM includes also a penalty parameter that is especially useful for non-separable classes, such as the reflectance of intermediate and late successional stages. The penalty parameter creates more flexible hyperplanes that adapt better to the training dataset and do not generalize well to other datasets and for that reason it has been selected in this study, in order to increase the separability of the spectra of the successional stages of the TDF, which are internally similar given the high number of common species between successional stages and high species diversity. It creates a more accurate model by detriment of increasing misclassified points. In the current paper, the radial basis function (RBF) was used, defined by the expression
where γ is the gamma term in the kernel function. In the RBF, the hyperplane is non-linear, and it is defined by linear sub-hyperplanes by kernels of the γ dimension.
K (xi,xj) = exp(−γ||xi − xj||2), γ > 0
Decision tree classifiers arrange pixels into different classes taking binary decisions based on the information provided by the user, in this case, transformed reflectance data, after inverted principal component analysis. The algorithm used in this paper was developed by Ross Quinlan [36], based on non-parametric statistical methods. Decision trees are versatile in terms of the number of bands used in a classification and select the more relevant bands in a stepwise analysis. In this study, all CHRIS bands were input in the first step of the analysis. Moreover, as many objects in nature, TDFs’ spectra do not follow a normal distribution. It is for that reason that non-parametric methods are preferred. Each node of the tree is a decision, from which two branches derive to two classes, or they lead to a new level node. The closer the node is to the origin of the tree, the larger its weight in the tree. Also, each node is defined by a coefficient that explains the weight or importance of the parameter used in that decision (i.e., a particular transformed reflectance band).
After classifying the CHRIS/PROBA images individually, both classified maps were compared on a pixel-by-pixel basis (SVM, SAM and Decision tree). This was done to quantify the trajectory of land cover change processes, and to know the spatial distribution of those changes. The classes derived from the spatio-temporal comparison are described in Table 4. For validation of the final successional stage maps, new reference areas were defined independently to the training areas and located in different locations within the PEMS (100 locations established in 2010). All classes to be considered not a TDF were merged into the category ‘other classes’, in order to evaluate errors of commission. This class covers pastures, cities, water bodies and bare soil. There is not a report on the accuracy of the change maps because it is a simple pixel-to-pixel comparison of succession maps from 2008 and 2014; therefore, the error of the change map is implicit in the errors committed or omitted in the succession maps. However, the errors in succession maps in 2008 and 2014 are implicit somehow in what has been called ‘degradation maps’ that show areas where the forest has been degraded instead of recovered.
2.6. Final Successional Stage Maps
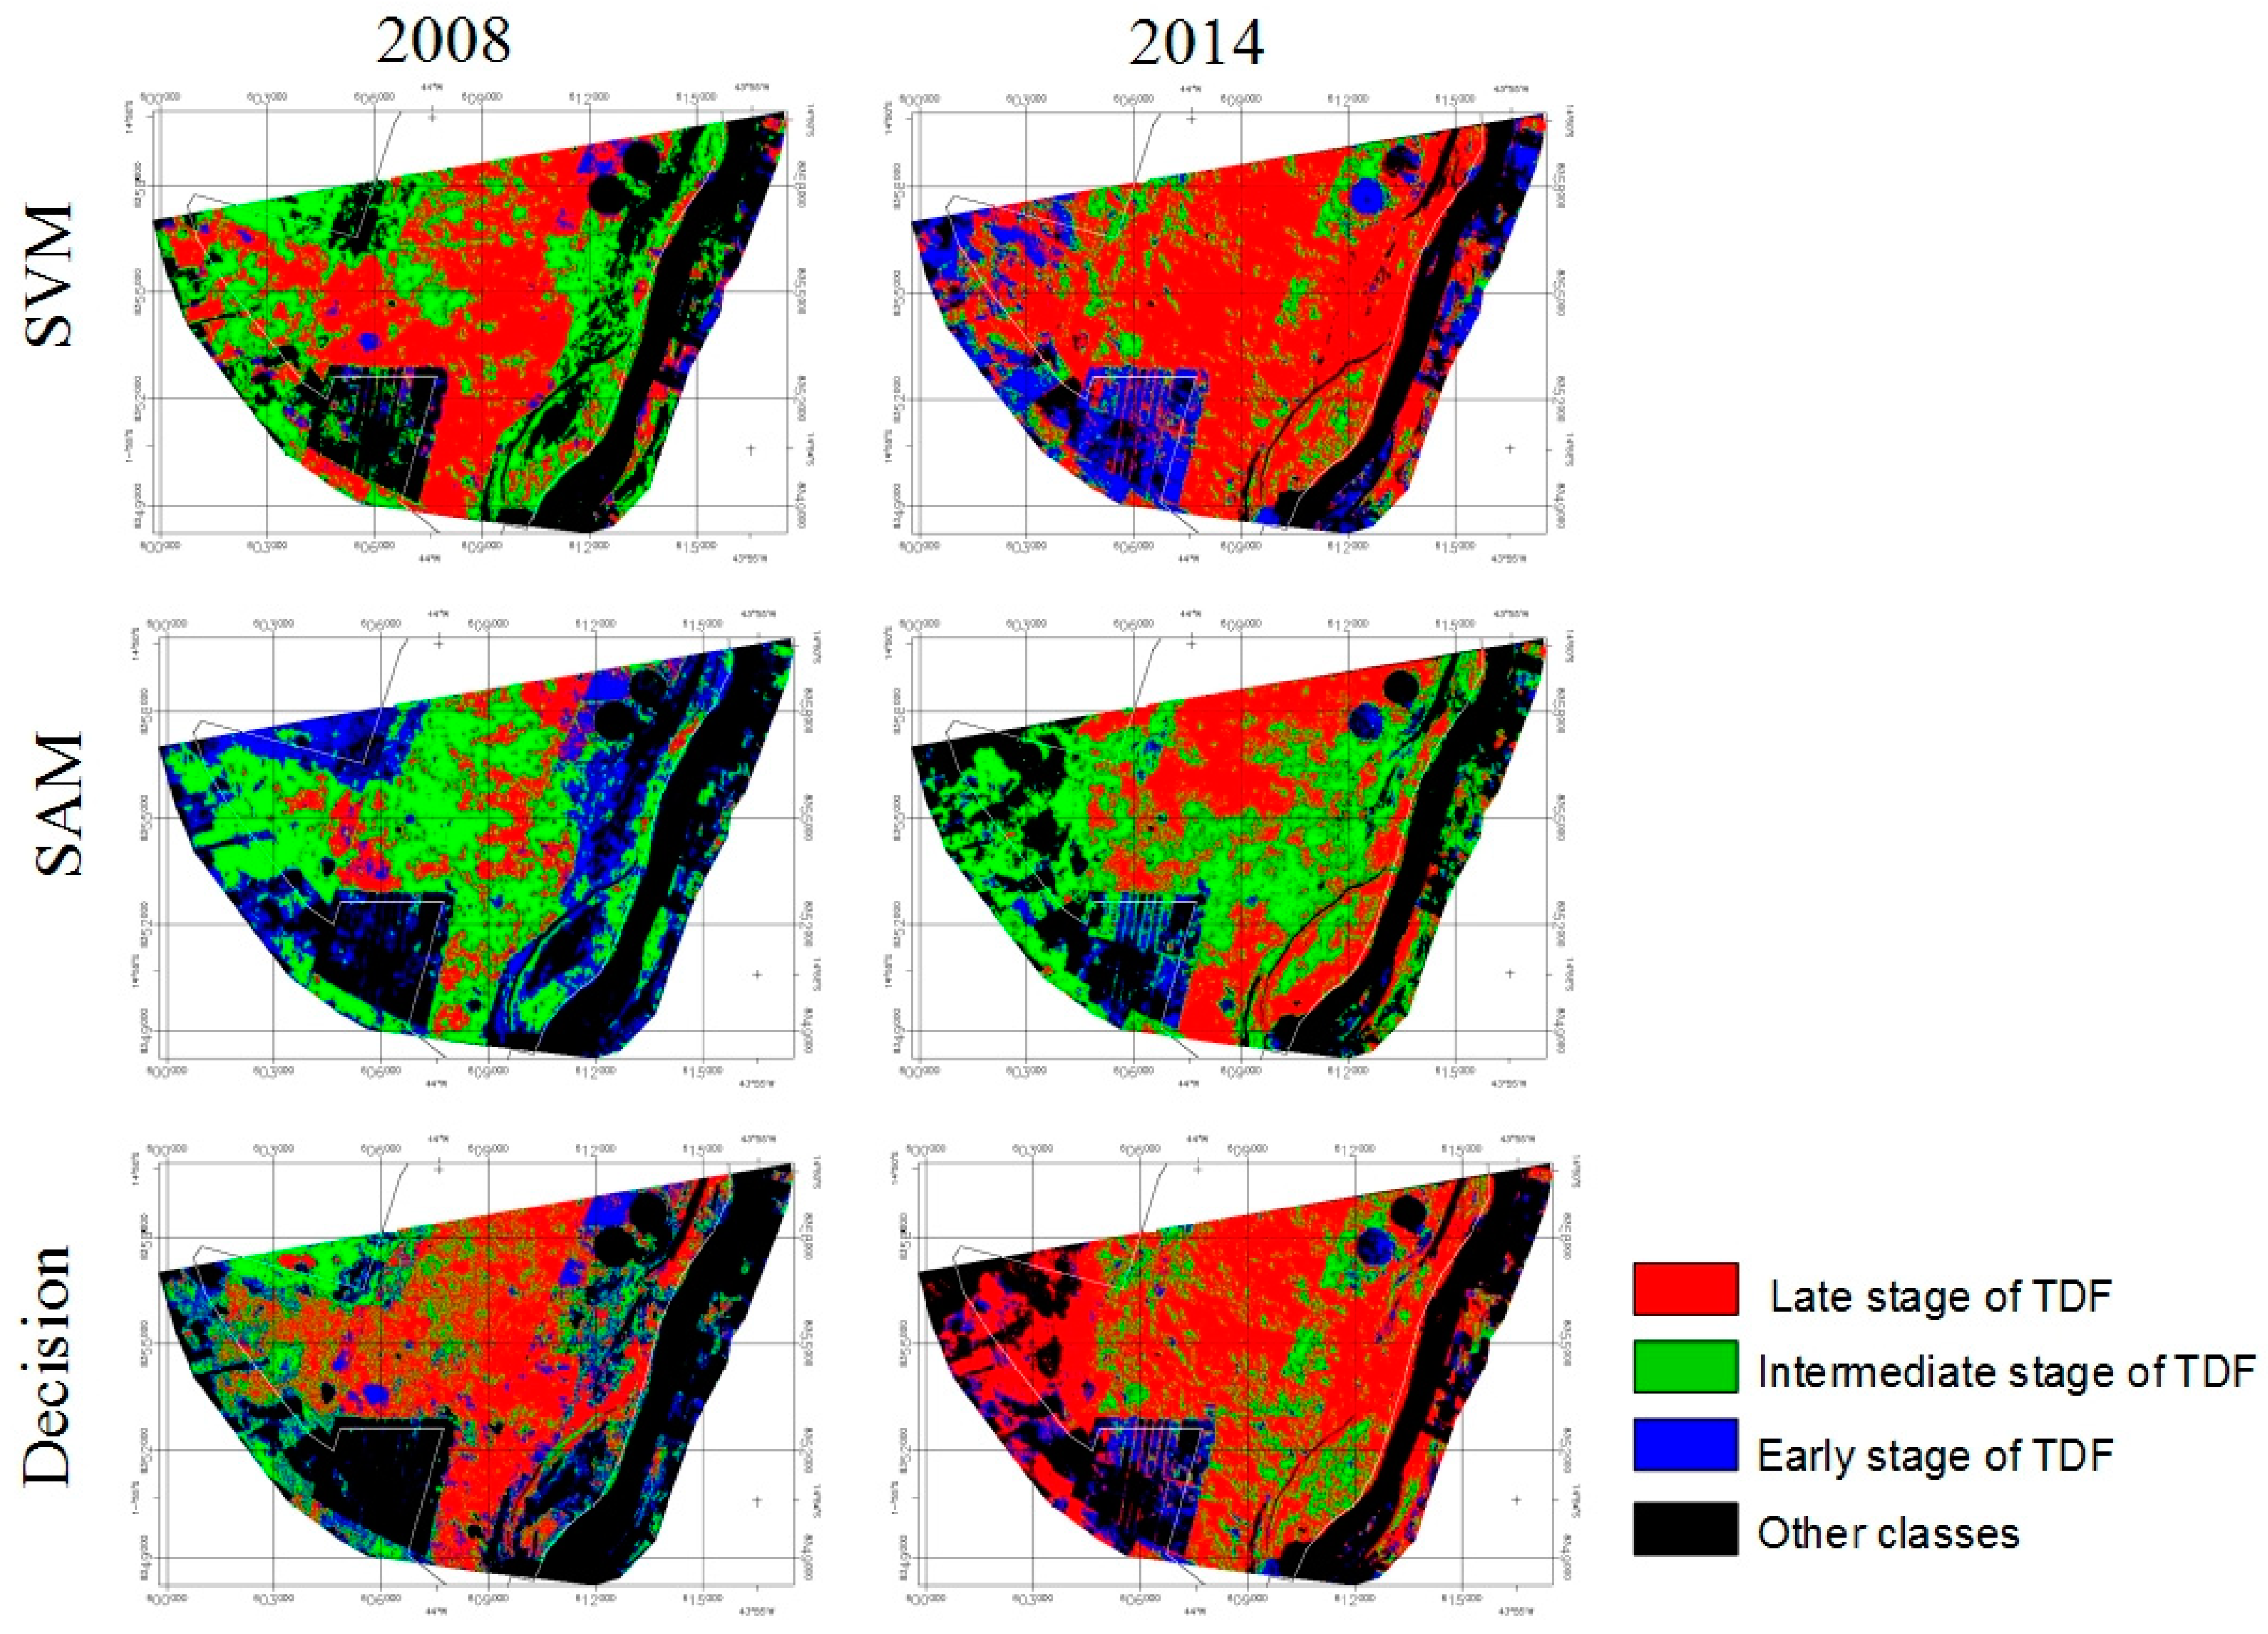
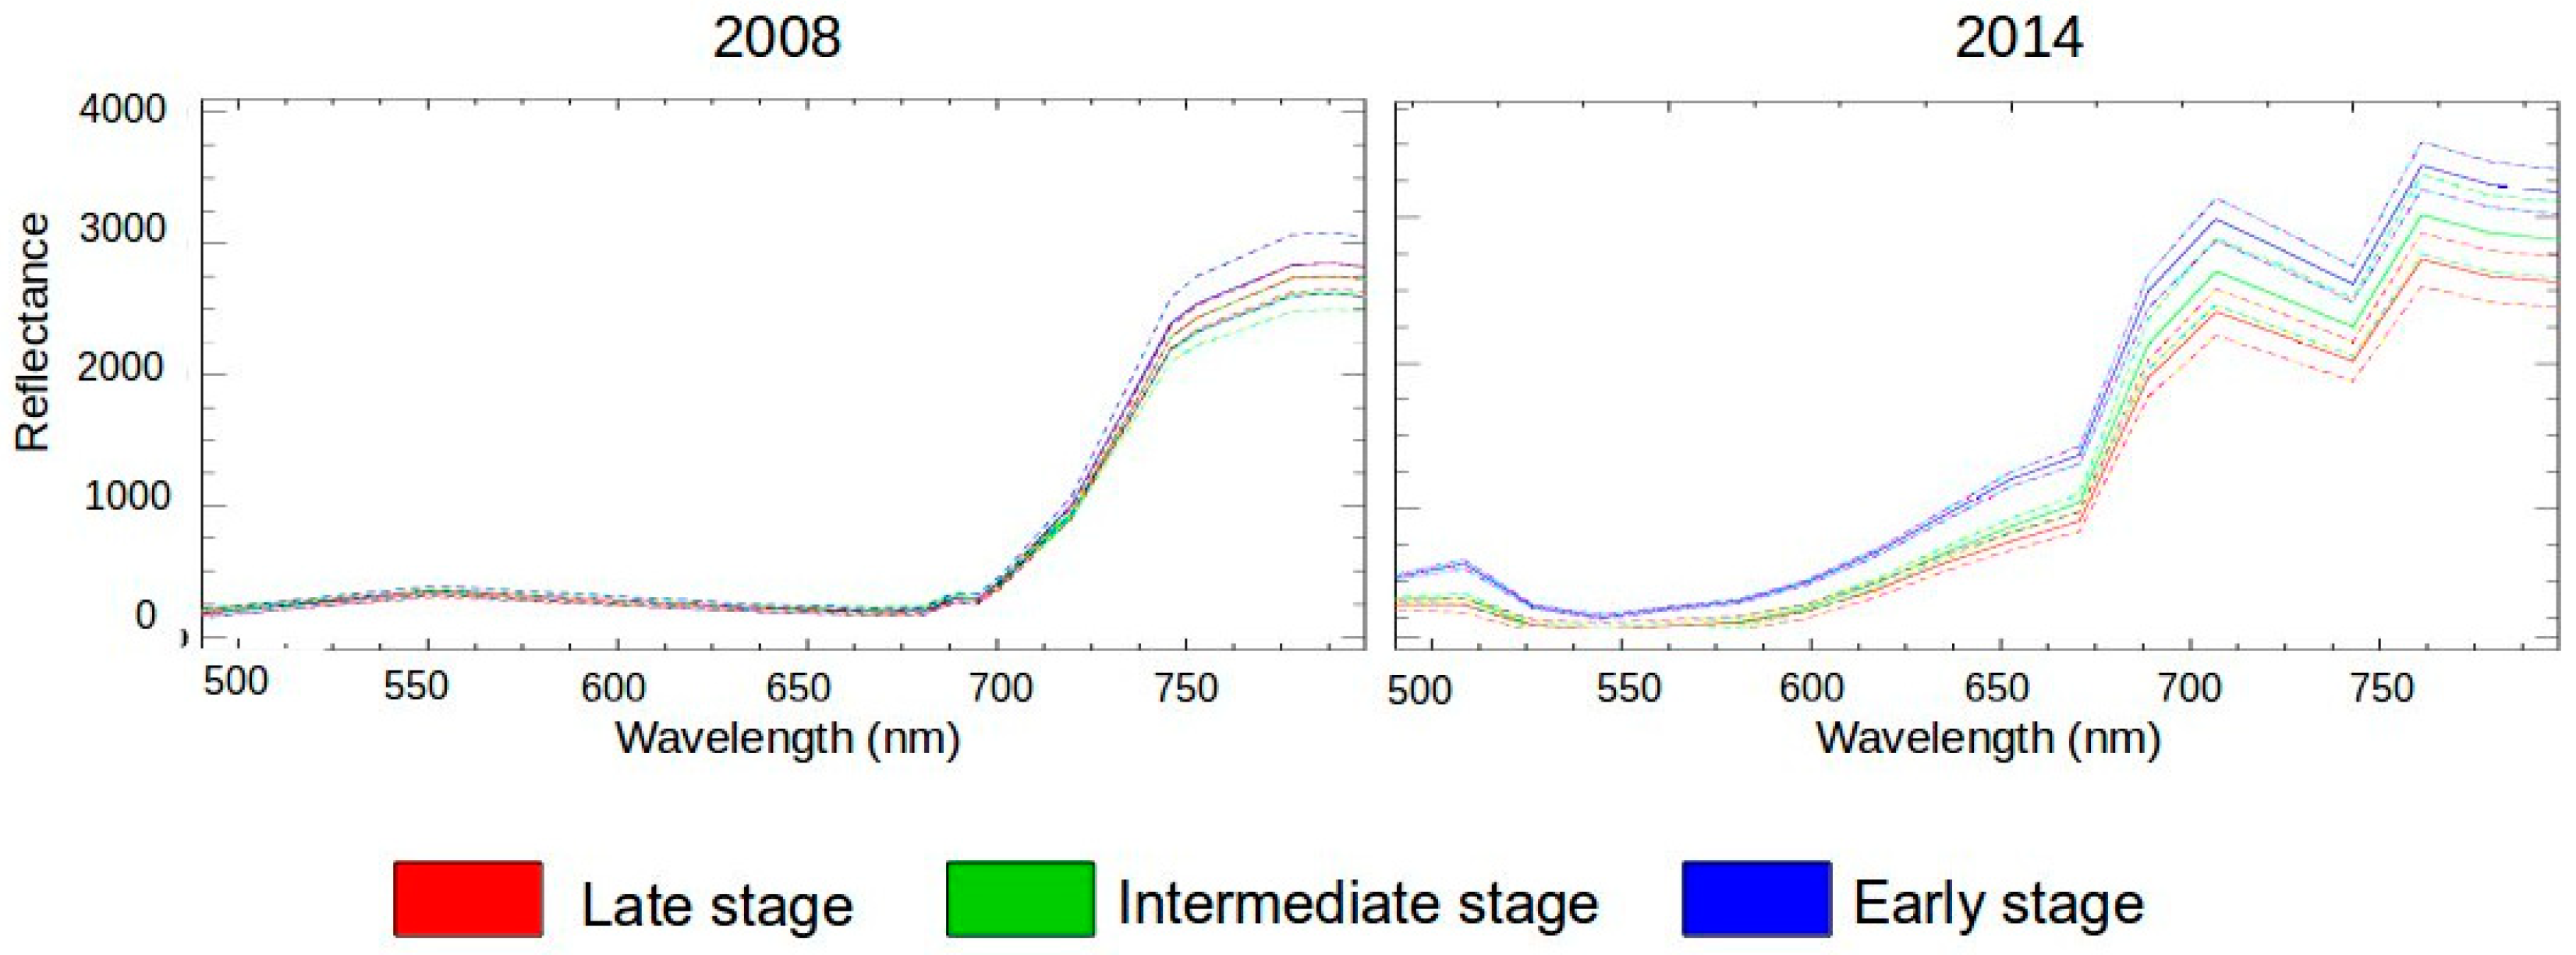
In order to map the successional stages of the TDF in PEMS using CHRIS/PROBA’s angle −55° images, different classifiers were tested (Figure 3). A threshold of 0.1 radians was defined for SAM to reduce the errors of commission. Only three classes were defined: late stage (L), intermediate stage (I), and early stage (E). SAM uses a single pixel per class which is computed as the average of all pixels for each training class. The nature of tropical forests is so complex that there is not a pure pixel that represents each of the successional stages. Moreover, the spectral signatures of the successional stages overlap (Figure 4), because of the shared species among classes (Table 1). For that reason, more than one class per successional stage was defined for SAM (i.e., each permanent plot was defined as one class, namely Late1, Late2, Intermediate1, Intermediate2, etc.). By defining several classes, we are covering the internal variability of the successional stage. All classes for the same successional stage (i.e., late stage) were merged on a final classification map. SVM and DT are wall-to-wall classifiers, for which all endmembers in the scene must be defined. Apart from the three successional stages (late, intermediate, and early), training data for fresh and dry pastures, cities, waterbodies, and bare soil were obtained. In the final maps, all non-forested classes were merged into ‘other classes’.
3. Results
The succession maps for 2008 and 2014 were evaluated using confusion matrices (Table 5). The highest overall classification accuracy was achieved with SVM (64.5% in 2008; 80.5% in 2014) while the lowest accuracies were obtained using the DT classifier (61.2% for 2008) SAM (68.9% for 2014) (Table 5). If we consider the kappa accuracy instead, lowest values are for the DT (0.49 in 2008) and SAM (0.60 in 2014) (Table 5). All overall map accuracies are above 60% (Table 5). These values are acceptable, considering that the spectral signature of the three successional stages are very similar, especially between intermediate and late stages (Figure 4). The statistical separation of classes in a classification depends on the spectral separability of the succession classes. Given that tropical dry forests are highly diverse and successional stages share many species, their spectral signatures overlap and make difficult the classification of successional classes. Moreover, overall accuracy results of all tested methods are consistent (60–65% for 2008, and 70–80% for 2014), supporting the robustness of CHRIS/PROBA for the discrimination of succession in TDFs. The reason for a lower overall accuracy in 2008 is probably linked to a thicker aerosol layer in 2008 image that was difficult to atmospherically correct, reducing the intensity of incoming light to the sensor and decreasing the signal-to-noise ratio.
An examination of individual class accuracies reveals that all methods except SAM overestimate the ‘late stage’ class to the detriment of the ‘early stage’ and ‘intermediate stage’ classes in the 2008 maps, and in the ‘intermediate stage’ in the 2014 map. Producer’s accuracy for the ‘late stage’ varies between 98.2% (SVM) and 76.1% (SAM) for 2008 and between 94.6% (SVM) and 82.4% (SAM) for 2014, while for ‘Early stage’ we found extremely low values at 7.4% (SVM) and 37.9% (DT) for 2008 and also for the ‘Intermediate stage’, showing a 26.9% producer’s accuracy (DT) and 41.9% (SVM), 46.9% (DT) in 2014 (Table 5). For the user’s accuracy, also low accuracy values were observed in 2008’s map for the ‘late stage’ (45.2% for decision trees) and ‘intermediate stage’ (40.6% for decision trees) (Table 5). A general interpretation of overall, producer’s and user’s accuracy show that SAM is the most balanced classifier, since all classes are above 50% of accuracy (with the exception of ‘other classes’ in 2008 and 2014, about 49.8%), which would imply a random classification. Although SVM has best overall accuracy for both dates (2008 and 2014), it presents low values for producer’s accuracy for the ‘early stage’ (7.4%) in 2008 and ‘intermediate stage’ (41.9%) in 2014 (Table 5). DT presents user’s accuracy under 50% in 2008, meaning that they are overestimating the ‘late stage’ class. This is also noticeable in Figure 3, where classification maps for 2008 show the ‘late stage’ covering most of the forested areas for SVM and decision trees while the ‘Intermediate stage’ is the predominant class in the 2008 SAM classification. The main difference between SAM and the other methods is that every forest successional class was defined not only as a single spectral group, but they were defined as several different classes per successional stage. On the ground, the same forest successional stage can have different configurations depending on the species community, understory composition (i.e., old pastures, shrubs, lianas, or bare soil) and tree density. For SAM classification we selected two examples of ‘late stage’ forests, two cases of ‘intermediate stages’ and four types of ‘early stages’. Even though SAM uses the average of each of the defined classes and dismisses the standard deviation and variance of the whole spectral sample, the results are more satisfactory than with SVM and DT.
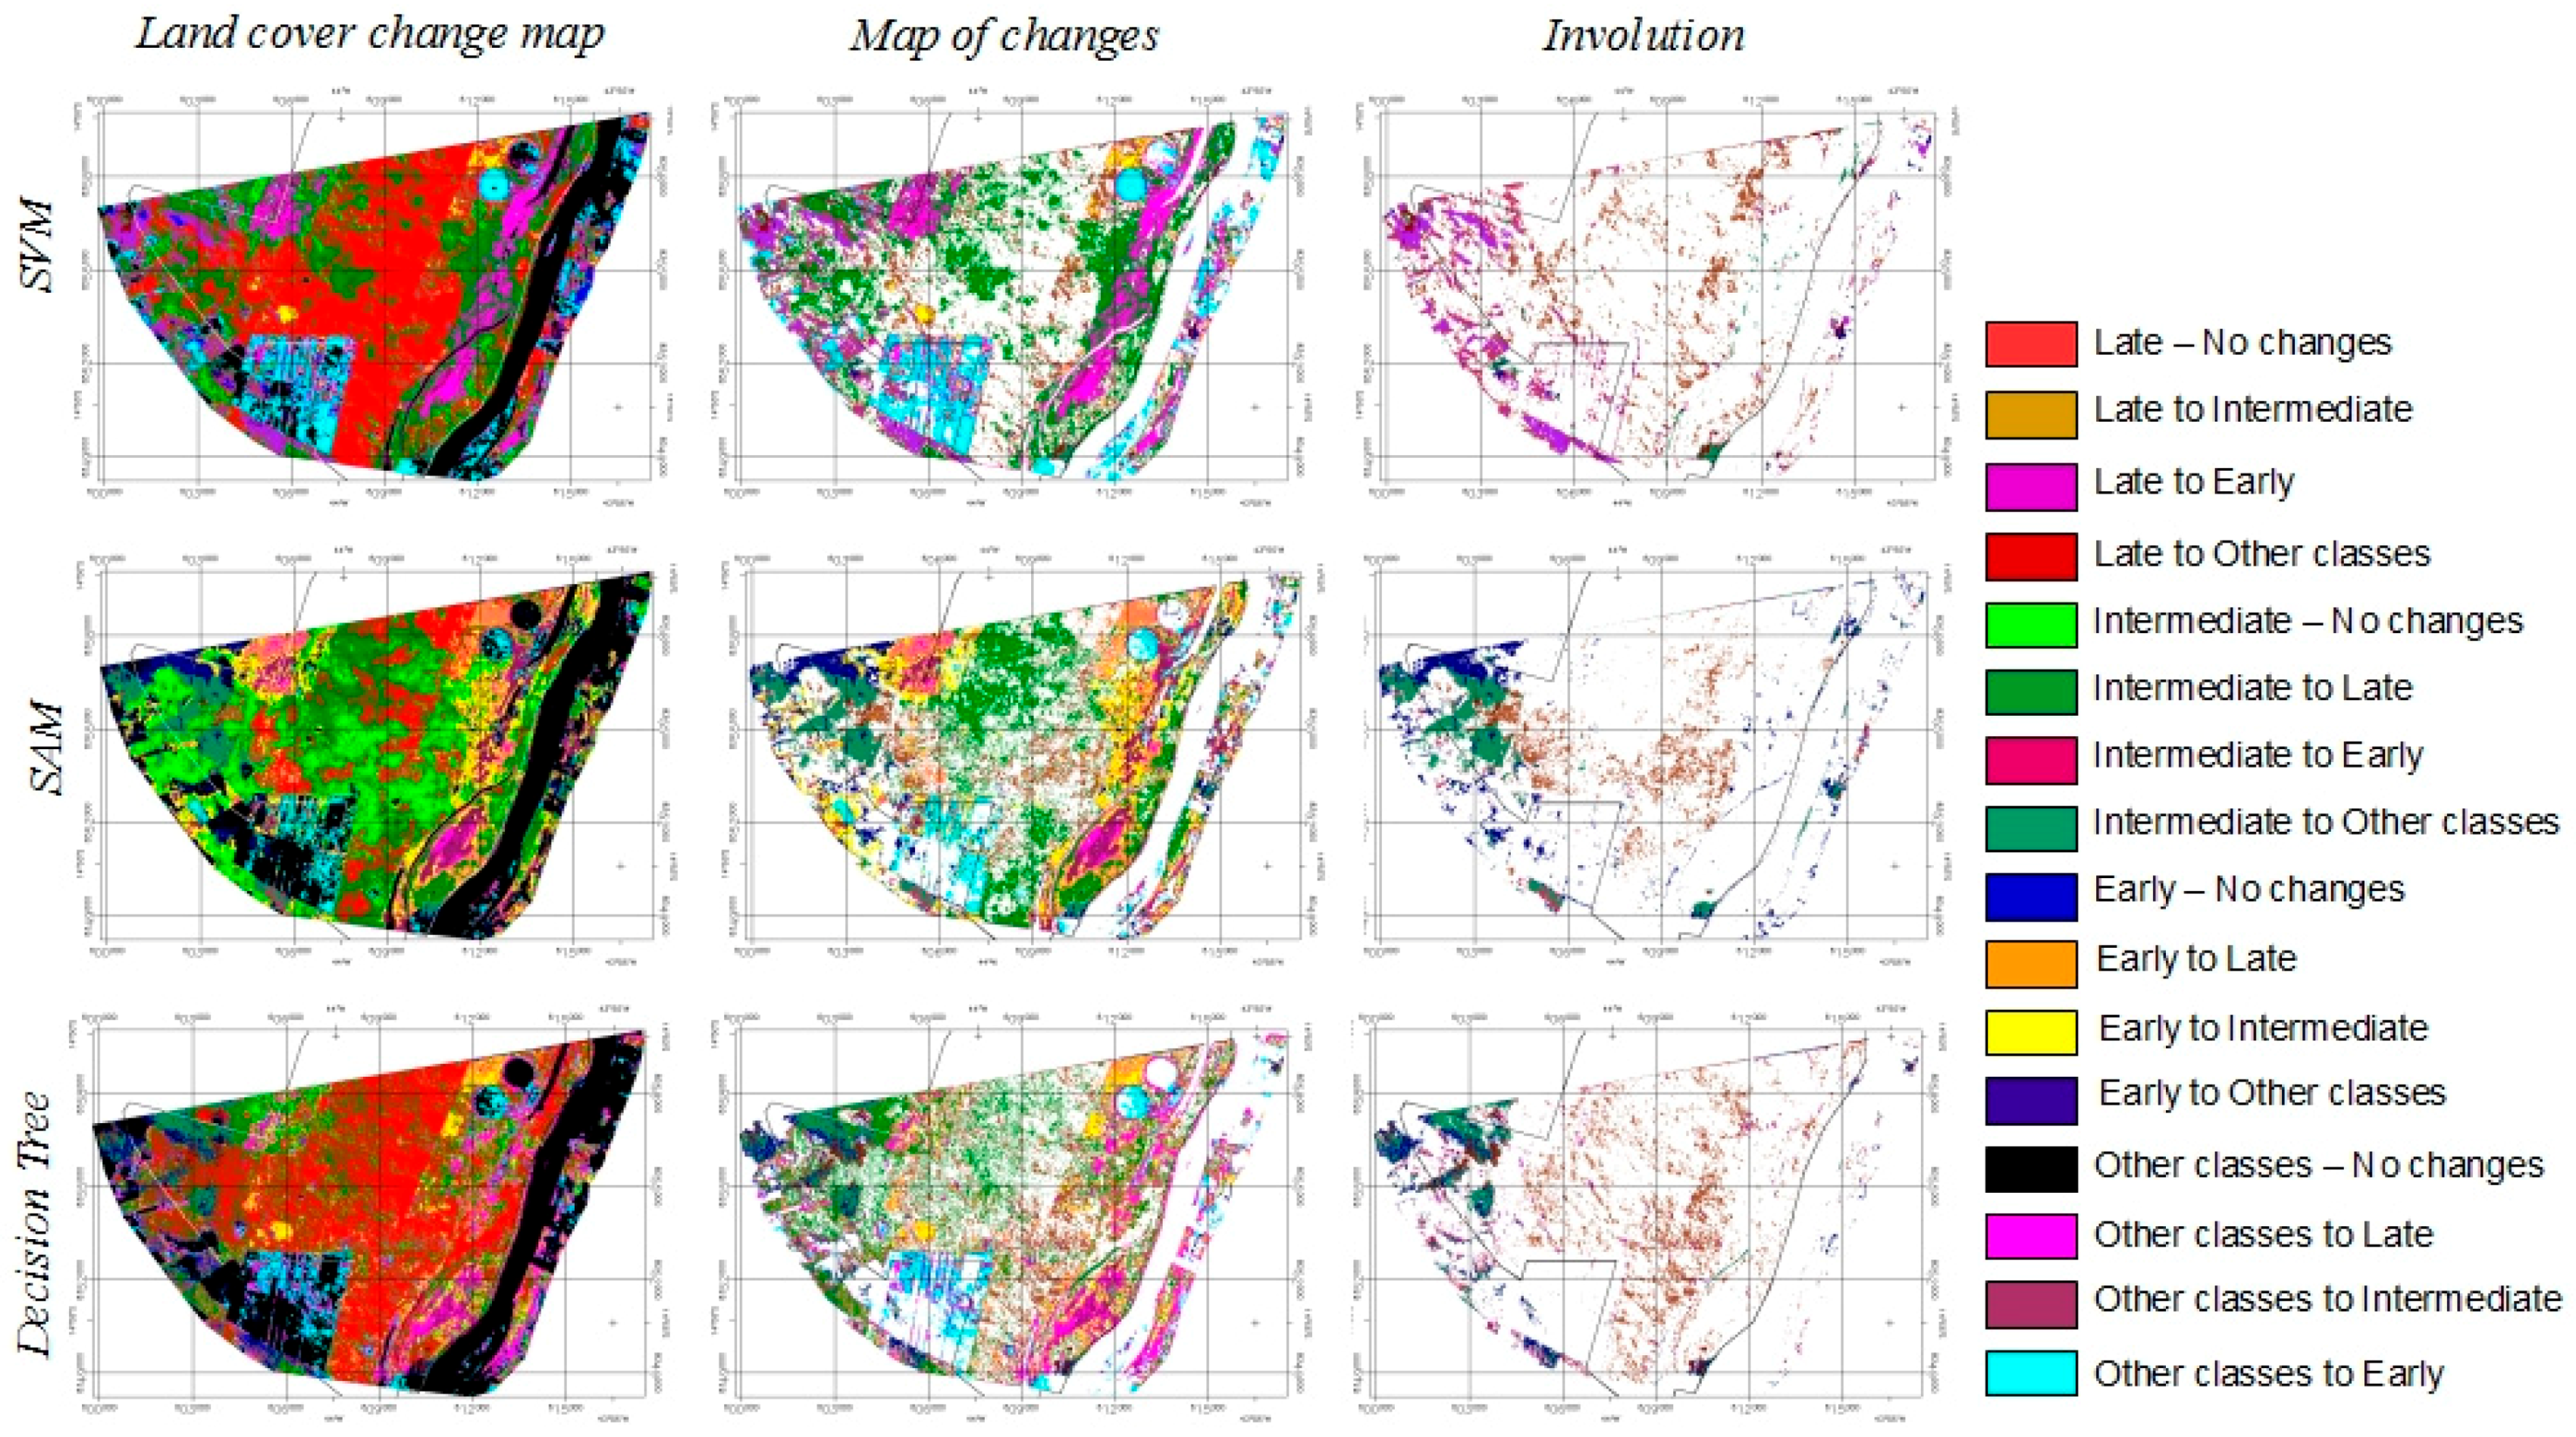
Figure 5 shows the same maps, but each column shows different classes to facilitate the visualization of changes. The left column shows the complete land cover change maps, including areas that changed and did not change between 2008 and 2014. The central column shows only changes, and areas that did not change are displayed in blank; it shows positive changes (succession) and negative changes (degradation). The right column shows the areas where the forest presents degradation between 2008 and 2014. In the central core of the forest mass (center of the scene) mostly a transition from ‘intermediate stage’ to ‘late stage’ has occurred; around a 15–20% of the mapped area (around 1800–2700 ha) evolved from ‘intermediate stage’ to ‘late stage’, depending on the classification method (13.6% according to decision trees, 14.5%, estimated with SAM, and 19.7% if using SVM) (Table 6). It is also remarkable that large areas of old pastures (i.e. agriculture pivots in upper right side of the scene and central lower part of the scene) have evolved to ‘early stage’ (Figure 5): 3.4% when using SAM (457 ha), 4.0% according to decision trees (536 ha) or 7.6% estimated by SVM (1026 ha) (Table 6). In more humid areas, such as the western riverside of the Sao Francisco River, the succession occurs more rapidly and we observe changes from ‘other classes’ (mainly shrubs in 2008) to ‘late stage’ (Figure 5); it is estimated around 1.8% (238.4 ha according to SAM) and 7.8% (1054 ha, according to SVM) of the mapped surface (Table 6). The overall changes are consistent in all maps of changes independently of the classification method in terms of area and location of the changes and differences between methods are never larger than 7% (Table 6). However, given the different results obtained with each classifier per class, the reported changes per class from 2008 to 2014 are different depending on the classification method. Since SAM was considered the most reliable classifier, from this point on only changes observed in maps generated with SAM are commented. In the map of changes generated with SAM it is observed that the early stage forest located at the northern part of the park (upper area of the scene, Figure 5) evolved to late stage in the seven years period (5.8%, 780 ha) (Table 6).
Also, very fast changes are observed in the north-western part of the park, as ‘other classes’ evolved to ‘late stage’ (1.8%, 238 ha) or ‘intermediate stage’ (6.6%, 897 ha) and in border areas, from ‘early stage’ to ‘intermediate stage’ (Table 6). On the southern part of the park, the early stage evolved at a lower rate, turning into ‘intermediate stage’ (9.1%, 1227 ha) (Table 6). The ‘degradation maps’ (Figure 5, right column) represent areas were the succession process is reverted, meaning that the forest is not recovering but degrading its status. For instance, when ‘late stage’ turns into ‘intermediate stage’ or ‘early stage’, or ‘intermediate stage’ changes into ‘early stage’ or ‘other classes’, such as pastures. In the core of the forested area an important number of pixels involved from ‘late stage’ to ‘intermediate stage’ (Figure 5).
According to different classification methods, this degradation involves between a 4.2% (SAM) of the total mapped pixels (Table 6). Given the location of these pixels, in the core of the protected area, this return to a previous class corresponds to errors of classification in CHRIS/PROBA’s images corresponding to 2008 and 2014. Also, important reverse changes are observed in the western part of the park, close to the boundary with active farms. ‘Intermediate stage’ and ‘early stage’ turn into ‘other classes’ in maps generated with SAM and decision trees (around 1.2 to 4.6% for Intermediate stage and 0.4 and 4.3% for ‘early stage’) and from ‘late stage’ or ‘intermediate stage’ to ‘early stage’ with SVM (3.5%, 470 ha), which can be related to an encroachment process or illegal logging (Figure 5, Table 6). As observed in the field campaign in 2010, the park is invaded by ‘carrasco’ formations (Myracrodruon urundeuva) in the northern part of the park, which is a very competitive species that might be taking place to the TDFs in the northern section of the park. In the southern part there is a high pressure caused by farmers, so the hypothesis of illegal logging is very likely to happen in the lower part of the map.
4. Discussion
The present study quantifies the ecological succession in a TDF located at the PEMS, Brazil. A temporal analysis of successional stages between 2008 and 2014 was conducted. Permanent monitoring plots established in 2006 and functional until today have been used training the classifiers for creating the forest successional maps. These permanent plots were defined at early, intermediate, and late successional stages. A second campaign in 2010 identified 100 locations at different successional stages in the PEMS. These sites have been monitored since and were therefore used in this study for classification accuracy assessment of the successional maps. Our findings align with those of other authors such as [39,40,41,42,43]. In addition, our findings support previous work conducted using CHRIS/PROBA, which has demonstrated the importance of the TDF structure for the characterization of forest succession, especially tree height; and the shadows projected on the canopy surface to estimate different successional stages [13,14].
Some forest structural traits (such as tree height, tree density, and crown diameter) can be monitored using the multi-angular capacity of the CHRIS platform while compositional traits and other structural traits (such as leaf area or canopy openness) can be inferred through the on-board spectrometer CHRIS. Forest structure and composition are the parameters that define the successional stages under study on the field level. CHRIS/PROBA images with an angle of −55° and corresponding to the wet season were used because it was previously proved to be more effective in separating the spectra of the three successional stages of the TDF under study (early, intermediate and late) [13].
Several classification methods were tested to support the robustness of our results and determine the best classifier for the particular case of TDF succession: SVM, SAM, and DT. The three classifiers are non-parametric and therefore fit better to natural and complex targets such as tropical forests, but they differ in the statistical approach in the way they cluster the training data into classes. A comparison of classifiers demonstrated that CHRIS/PROBA is able to discriminate successional stages of TDF with a reasonable accuracy (over 60% overall accuracy) independently of the used method, since the results for three classifiers were similar. We consider that our accuracy estimates are land cover studies aimed to support long term ecological monitoring programs, especially considering that the spectra of the selected classes differ slightly and overlap [13].
Defining more than one spectral class for a particular successional stage resulted in better spectral classification (the case for SAM classifier), because a given stage can present more than one compositional and structural configuration, especially early ones. Previous studies reported similar accuracy results when using hyperspectral/multi-angular data for the discrimination of successional stages of tropical forests such as [40]. In [40], they performed a comparison in tropical forest succession classification comparing nadir and off-nadir CHRIS/PROBA images. Their results for the off-nadir classification were 98.3% for early stage, 70.0% for intermediate stage and 76.7% for late stage. Furthermore, the position of the sun is in both dates to the west respect to the sensors, meaning that the sensor is always looking at the shaded side of the observed objects. Certainly, a difference of 20 degrees generates a difference in the length of the projected shadows, causing therefore different classification accuracies. However, even though the azimuth angle is different from image to image, the relative position of the sensor and the sun (viewing angle) is similar, with 20 degrees of difference in azimuth and 4 degrees in zenith. Therefore, we assume that both images are comparable.
Also, our results perform better than those reported for the classification of TDF succession in comparison with multispectral satellite data. For instance, [5] performed a comparative study of Landsat-7 ETM+ vs IKONOS and found out that it was impossible to separate the intermediate and the late stages, due to similar and overlapping of their spectral signatures due to sensor saturation. Ref. [43] classified TDFs of Puerto Rico using mulstipectral Landsat ETM+ and airborne LiDAR data and found out that Landsat did not contribute positively in the accuracy of the classification of successional stages and forest type classes. In addition, studies in the Amazon basin aimed to quantify tropical deforestation and regeneration have reported accuracies between 75 and 90% [44,45,46,47,48]. However, as pointed out by [47] these results are only achievable if large and accurate field measurements are taken.
Based on our observations, the TDF at the PEMS has recovered extremely fast between 2008 and 2014, confirming that limiting or stopping agriculture in protected areas allows TDF to recover [49]. At the PEMS, around a 20% of the intermediate forest has recovered to a mature forest, and about 12% of old pastures have been converted into early forest. In addition, about around a 6% of the PEMS has experienced a fast transition from early forests to intermediate forests.
Our spatial analysis also reveals three important ecological recovery process. First, we have been able to detect that the areas that recovered most rapidly are located close to mature forests and close to humid areas. This finding has been documented for similar dry forests where agricultural practices have been stopped [41,44,45,46,47,48,49]. Our hypothesis is that the provision of seeds from the mature forests either by wind or vertebrates have contributed to the fast recovery [49,50]. On the other hand, slow recovery is detected in the western part of our study area. These areas where low recovery rates were found, had plantations in 2008 and are located close to the boundary of the park, out of which there are only abandoned pastures. Isolation from seed sources and access to water sources (a key element for dry forest recovery) may contribute to slow regrowth rates. Finally, we also observed encroachment in the north-western area of the PEMS. The proximity of early and intermediate forests to a monospecific ‘carrasco’ shrub land (Myracrodruon urundeuva) threatens the forest succession into a mature status. This former degradation process is also related to the occurrence of shallow soils.
Experimental satellite missions such as CHRIS/PROBA were designed and have promoted the development of further remote sensing in recent and future satellite missions from NASA and ESA, such as EnMAP and Sentinel-3 (ESA), HyspIRI and ICE-Sat2 (NASA). Many other previous studies combined airborne hyperspectral and LiDAR campaigns for the determination of species identification [50,51,52,53], forest biomass calculation [54,55,56,57] and forest structure [43], since all these factors are necessary for the correct evaluation of the contribution of forests in climate regulation [57,58,59]. CHRIS/PROBA was created to put both technologies into one platform and test it in orbit. The results of the research done with CHRIS/PROBA have proven the importance of the characterization of structure and composition features of forests to understand forest dynamics and their role in the carbon cycle and climate regulation [8,45,57,58,59], although other technologies have been decided to be more accurate for the definition of forest structure, such as LiDAR (ICE-Sat2) and radar (Sentinel-3). Also, the findings performed with CHRIS/PROBA will be useful in the development of analysis techniques for the blooming UAV industry, which is developing hyperspectral and LiDAR sensors to be mounted on drones, but also gimbals with multi-angular pointing [7].
5. Conclusions
PROBA sensor was put into orbit to explore the potential of hyperspectral imaging for different applications, as well as EO-1 Hyperion. In this study, CHRIS/PROBA has been proved to solve a limitation of satellite mapping that has been unsolved for many years with other satellites: it helped to distinguish between late and intermediate succession stages, as well as to define positive and negative land cover change trends. The findings of this study allowed for not only for the separation and dynamics between successional stages but also help to explain the possible causes of slow recovery or degradation (encroachment, isolation from seed sources and water, illegal logging). This study also discussed the limitations associated with available CHRIS/PROBA data for multi-temporal analysis, which are completely necessary for park managers, conservationists, and basic research.
Author Contributions
Conceptualization, V.G.M. and A.S.A.; Methodology, V.G.M. and A.S.A. Validation, V.G.M. Formal Analysis, V.G.M.; Investigation, V.G.M.; Resources, A.S.A.; Writing—Original Draft Preparation, V.G.M.; Writing—Review & Editing, A.S.A.
Funding
This research was funded by the Inter American Institute for Global Change Research (IAI) Collaborative Research Network Program (CRN3-025 Tropi-Dry), and the Natural Science and Engineering Research Council of Canada, Discovery Grant Program.
Acknowledgments
We thank the European Space Agency for sharing the CHRIS/PROBA images that were used in this study.
Conflicts of Interest
The authors declare no conflict of interest.
References
- Lugo, A.E.; Gonzalez-Liboy, J.A.; Cintron, B.; Dugger, K. Structure, productivity and transpiration of a subtropical dry forest in Puerto Rico. Biotropica 1978, 10, 278–291. [Google Scholar] [CrossRef]
- Sánchez-Azofeifa, G.A.; Kalacska, M.; do Espirito-Santo, M.M.; Fernandes, G.W.; Schnitzer, S. Tropical dry forest succession and the contribution of lianas to Wood Area Index (WAI). For. Ecol. Manag. 2009, 258, 941–948. [Google Scholar] [CrossRef]
- Sánchez-Azofeifa, G.A.; Quesada, M.; Rodriguez, J.P.; Nassar, J.; Stoner, K.E.; Castillo, A.; Garvin, T.; Zent, E.L.; Calvo-Alvarado, J.C.; Kalacska, M.E.R.; et al. Research priorities for neotropical dry forests. Biotropica 2005, 37, 477–485. [Google Scholar]
- Wright, S.J. Tropical forests in a changing environment. Trends Ecol. Evol. 2005, 20, 553–560. [Google Scholar] [CrossRef] [PubMed]
- Portillo-Quintero, C.A.; Sánchez-Azofeifa, G.A. Extent and conservation of tropical dry forests in the Americas. Biol. Conserv. 2010, 143, 144–155. [Google Scholar] [CrossRef]
- Arroyo-Mora, J.P.; Sanchez-Azofeifa, G.A.; Kalacska, M.E.R.; Rivard, B.; Calvo-Alvarado, J.C.; Janzen, D.H. Secondary forest detection in a Neotropical dry forest landscape using Landsat 7 ETM+ and IKONOS Imagery. Biotropica 2005, 37, 497–507. [Google Scholar] [CrossRef]
- Sanchez-Azofeifa, A.; Antonio Guzmán, J.; Campos, C.A.; Castro, S.; Garcia-Millan, V.; Nightingale, J.; Rankine, C. Twenty-first century remote sensing technologies are revolutionizing the study of tropical forests. Biotropica 2017, 49, 604–619. [Google Scholar] [CrossRef]
- Barnsley, M.J.; Settle, J.J.; Cutter, M.A.; Lobb, D.R.; Teston, F. The PROBA/CHRIS mission: A low-cost smallsat for hyperspectral multiangle observations of the earth surface and atmosphere. IEEE Trans. Geosci. Remote Sens. 2004, 42, 1512–1520. [Google Scholar] [CrossRef]
- Kneubühler, M.; Koetz, B.; Richter, R.; Schaepman, M.; Itten, K. Geometric and radiometric pre-Processing of CHRIS/PROBA data over mountainous terrain. In Proceedings of the Third CHRIS/PROBA Workshop, Frascati, Italy, 21–23 March 2005. [Google Scholar]
- Feeley, K.J.; Gillespie, T.W.; Terborgh, J.W. The utility of spectral indices from Landsat ETM+ for measuring the structure and composition of tropical dry forests. Biotropica 2005, 37, 508–519. [Google Scholar] [CrossRef]
- Braswell, B.H.; Hagen, S.C.; Frolking, S.E.; Salas, W.A. A multivariable approach for mapping sub-pixel land cover distributions using MISR and MODIS: Application in the Brazilian Amazon region. Remote Sens. Environ. 2003, 87, 243–256. [Google Scholar] [CrossRef]
- Diner, D.J.; Asner, G.P.; Davies, R.; Knyazikhin, Y.; Muller, J.P.; Nolin, A.W.; Pinty, B.; Schaaf, C.; Stroeve, J.C. New directions in earth observing: Scientific applications of multiangle remote sensing. Bull. Am. Meteorol. Soc. 1999, 80, 2209–2228. [Google Scholar] [CrossRef]
- García Millán, V.E.; Sánchez-Azofeifa, G.A.; Málvarez García, G.C.; Rivard, B. Quantifying tropical dry forest succession in the Americas using CHRIS/PROBA. Remote Sens. Environ. 2014, 144, 120–136. [Google Scholar] [CrossRef]
- Garcia Millan, V.E.; Sanchez-Azofeifa, G.A.; Malvarez, G. Mapping Tropical Dry Forest Succession with CHRIS/PROBA Hyperspectral Images Using Nonparametric Decision Trees. IEEE J. Sel. Top. Appl. Earth Obs. Remote Sens. 2014, 8, 3081–3094. [Google Scholar] [CrossRef]
- Stagakis, S.; Vanikiotis, T.; Sykioti, O. Estimating forest species abundance through linear unmixing of CHRIS/PROBA imagery. ISPRS J. Photogramm. Remote Sens. 2016, 119, 79–89. [Google Scholar] [CrossRef]
- Wang, Q.; Pang, Y.; Zengyuan, L.; Sun, G.; Chen, E.; Ni-Meister, W. The potential of forest biomass inversion based on vegetation indices using multi-angle CHRIS/PROBA data. Remote Sens. 2016, 8, 891. [Google Scholar] [CrossRef]
- Gu, Z.J.; Sanchez-Azofeifa, G.A.; Feng, J.; Cao, S. Predictability of leaf area index using vegetation indices from multiangular CHRIS/PROBA data over eastern China. J. Appl. Remote Sens. 2015, 9, 096085. [Google Scholar] [CrossRef] [Green Version]
- Rautiainen, M.; Lang, M.; Mõttus, M.; Kuusk, A.; Nilson, T.; Kuusk, J.; Lükk, T. Multi-angular reflectance properties of a hemiboreal forest: An analysis using CHRIS PROBA data. Remote Sens. Environ. 2008, 112, 2627–2642. [Google Scholar] [CrossRef]
- Liesenberg, V.; Boehm, H.-D.V.; Gloaguen, R. The contribution of CHRIS/PROBA data for tropical peat swamp landscape discrimination purposes. In Proceedings of the IEEE International Geoscience and Remote Sensing Symposium (IGARSS), Cape Town, South Africa, 12–17 July 2009. [Google Scholar]
- Koetz, B.; Kneubühler, M.; Widlowski, J.L.; Morsdorf, F.; Schaepman, M.; Itten, K. Assessment of canopy structure and heterogeneity from multiangular CHRIS-PROBA data. In Proceedings of the 9th International Symposium on Physical Measurements and Signatures in Remote Sensing (ISPMSRS), Beijing, China, 17–19 October 2005; pp. 73–78. [Google Scholar]
- Lucas, R.; Bunting, P.; Paterson, M.; Chisholm, L. Classification of Australian forest communities using aerial photography, CASI and HyMap data. Remote Sens. Environ. 2008, 112, 2088–2103. [Google Scholar] [CrossRef]
- Lucas, R.M.; Honzak, M.; Foody, G.M.; Curran, P.J.; Corves, C. Characterizing tropical secondary forests using multi-temporal Landsat sensor imagery. Int. J. Remote Sens. 1993, 14, 3061–3067. [Google Scholar] [CrossRef]
- Steininger, M.K. Tropical secondary forest regrowth in the Amazon: Age, area and change estimation with Thematic Mapper data. Int. J. Remote Sens. 1996, 17, 9–27. [Google Scholar] [CrossRef]
- Vieira, I.C.; de Almeida, A.S.; Davidson, E.A.; Stone, T.A.; de Carvalho, C.J.; Guerrero, J.B. Classifying successional forests using Landsat spectral properties and ecological characteristics in eastern Amazonia. Remote Sens. Environ. 2003, 87, 470–481. [Google Scholar] [CrossRef]
- Helmer, E.H.; Ruzycki, T.S.; Wunderle, J.M., Jr.; Vogesser, S.; Ruefenacht, B.; Kwit, C.; Brandeis, T.J.; Ewert, D.N. Mapping tropical dry forest height, foliage height profiles and disturbance type and age with a time series of cloud-cleared Landsat and ALI image mosaics to characterize avian habitat. Remote Sens. Environ. 2010, 114, 2457–2473. [Google Scholar] [CrossRef]
- Alves, R. Zonamento ambiental e os desafios da implementação do Parque Estadual Mata Seca, Municipio de Manga, Norte de Minas Gerais; Instituto de Geociencias da Universidade Federal de Minas Gerais: Belo Horizonte, Brazil, 2008. [Google Scholar]
- Madeira, B.G.; Espirito-Santo, M.M.; D’Angelo Neto, S.; Nunes, Y.R.F.; Sánchez Azofeifa, G.A.; Fernandes, G.W.; Quesada, M. Changes in tree and liana communities along successional gradient in a tropical dry forest in south-eastern Brazil. Plant Ecol. 2009, 201, 291–304. [Google Scholar] [CrossRef]
- Kalacska, M.; Bohlman, S.; Sanchez-Azofeifa, G.A.; Castro-Esau, K.; Caelli, T. Hyperspectral discrimination of tropical dry forest lianas and trees: Comparative data reduction approaches at the leaf and canopy levels. Remote Sens. Environ. 2007, 109, 406–415. [Google Scholar] [CrossRef] [Green Version]
- Kalacska, M.E.R.; Sanchez-Azofeifa, G.A.; Calvo-Alarado, J.C.; Quesada, M.; Rivard, B.; Janzen, D.H. Species composition, similarity and diversity in three successional stages of a seasonally dry tropical forest. For. Ecol. Manag. 2004, 200, 227–247. [Google Scholar] [CrossRef]
- Murcia, C. Edge effects in fragmented forests: Implications for conservation. Trends Ecol. Evol. 1995, 10, 58–62. [Google Scholar] [CrossRef]
- Cutter, M.; Sweeting, M.A. Hyperspectral imaging mission for small satellites—Five years orbit experience. Proc. IEEE 2007, 1–2, 355–360. [Google Scholar]
- Fomferra, N.; Peters, M.; Quast, R.; Zuhlke, M.; Danne, O.; Storm, T.; Brockmann, C.; Regner, P. ESA’s Toolboxes for Optical Earth Observation Data: BEAM, CHRIS-Box and the Glob-Toolbox. In Proceedings of the ESA Living Planet Symposium, Bergen, Norway, 28 June–2 July 2010; Volume 686. [Google Scholar]
- Gómez-Chova, L.; Alonso, L.; Guanter, L.; Camps-Valls, G.; Calpe, J.; Moreno, J. Correction of systematic spatial noise in push-broom hyperspectral sensors: Application to CHRIS/PROBA images. Appl. Opt. 2008, 47, 46–60. [Google Scholar] [CrossRef]
- Guanter, L.; Alonso, L.; Moreno, J. A method for the surface reflectance retrieval from PROBA/CHRIS data over land: Application to ESA SPARC campaigns. IEEE Trans. Geosci. Remote Sens. 2005, 43, 2908–2917. [Google Scholar] [CrossRef]
- Schaepman-Strub, G.; Schaepman, M.E.; Painter, T.H.; Dangel, S.; Martonchik, J.V. Reflectance quantities in optical remote sensing—Definitions and case studies. Remote Sens. Environ. 2006, 103, 27–42. [Google Scholar] [CrossRef]
- Kruse, F.A.; Lefkoff, A.B.; Boardman, J.B.; Heidebrecht, K.B.; Shapiro, A.T.; Barloon, P.J.; Goetz, A.F.H. The Spectral Image Processing System (SIPS)—Interactive Visualization and Analysis of Imaging spectrometer Data. Remote Sens. Environ. 1993, 44, 145–163. [Google Scholar] [CrossRef]
- Cortes, C.; Vapnik, V. Support-vector networks. Mach. Learn. 1995, 20, 273–297. [Google Scholar] [CrossRef] [Green Version]
- Quinlan, J.R. Decision Trees and Instance-Based Classifiers. In CRC Handbook of Computer Science and Engineering; Tucker, A.B., Ed.; CRC Press: Boca Raton, FL, USA, 1996. [Google Scholar]
- Chopping, M.; Moisen, G.G.; Su, L.; Laliberte, A.; Rango, A.; Martochnick, J.V.; Peters, D.P.C. Large area mapping of southwestern forest crown cover, canopy height and biomass using the NASA Multiangle Imaging SpectroRadiometer. Remote Sens. Environ. 2008, 112, 2051–2063. [Google Scholar] [CrossRef]
- Galvão, L.S.; Ponzoni, F.J.; Liesenberg, V.; dos Santos, J.R. Possibilities of discriminating tropical secondary succession in Amazônia using hyperspectral and multiangular CHRIS/PROBA data. Int. J. Appl. Earth Obs. Geoinf. 2009, 11, 8–14. [Google Scholar] [CrossRef]
- Laurin, G.V.; Puletti, N.; Hawthorne, W.; Liesenberg, V.; Corona, P.; Papale, D.; Chen, Q.; Valentini, R. Discrimination of tropical forest types, dominant species, and mapping of functional guilds by hyperspectral and simulated multispectral Sentinel-2 data. Remote Sens. Environ. 2016, 176, 163–176. [Google Scholar] [CrossRef] [Green Version]
- Li, W.; Cao, S.; Campos-Vargas, C.; Sanchez-Azofeifa, G.A. Identifying tropical dry forests extent and succession via the use of machine learning techniques. Int. J. Appl. Earth Obs. Geoinf. 2017, 63, 196–205. [Google Scholar] [CrossRef]
- Martinuzzi, S.; Gould, W.A.; Vierling, L.A.; Hudak, A.T.; Nelson, R.F. Quantifying Tropical Dry Forest Type and Succession: Substantial Improvement with LiDAR. Biotropica 2013, 45, 135–146. [Google Scholar] [CrossRef]
- Tucker, J.M.; Brondizio, E.S.; Moran, E.F. Rates of forest regrowth in Eastern Amazonia: A comparison of Altamira and Bragantina regions, Para State, Brazil. Interciencia 1998, 23, 64–73. [Google Scholar]
- Skole, D.; Tucker, C. Tropical deforestation and habitat fragmentation in the Amazon: Satellite data from 1978 to 1988. Science 1993, 260, 1905–1909. [Google Scholar] [CrossRef] [PubMed]
- Li, Y.; Moran, E.F.; Brondizio, E.S.; Mausel, P.; Wu, Y. Discrimination between advanced secondary succession and mature moist forest near Altamira, Brazil using Landsat TM data. In Proceedings of the American Society for Photogrammetry and Remote Sensing Annual Meeting, Reno, NV, USA, November 1994; Available online: https://www.researchgate.net/profile/Eduardo_Brondizio/publication/267698102_Discrimination_Between_Advanced_Secondary_Succession_and_Mature_Moist_Forest_Near_Altamira_Brazil_Using_Landsat_T_M_Data/links/54a16c330cf257a636036d67.pdf (accessed on 3 October 2018).
- Brondizio, E.S.; Moran, E.F.; Mausel, P.; Wu, Y. Land cover in the Amazon estuary: Linking of the Thematic Mapper with botanical and historical data. Photogramm. Eng. Remote Sens. 1996, 62, 921–929. [Google Scholar]
- Mausel, P.; Wu, Y.; Li, Y.; Moran, E.F.; Brondizio, E.S. Spectral identification of succession stages following deforestation in the Amazon. Geocarto Int. 1993, 8, 61–72. [Google Scholar] [CrossRef]
- Cao, S.; Sanchez-Azofeifa, G.A. Modeling seasonal surface temperature variations in secondary tropical dry forests. Int. J. Appl. Earth Obs. Geoinf. 2017, 62, 122–134. [Google Scholar] [CrossRef]
- Castillo-Nunez, M.; Sánchez-Azofeifa, G.A.; Croitoru, A.; Rivard, B.; Calvo-Alvarado, J.; Dubayah, R.O. Delineation of secondary succession mechanisms for tropical dry forests using LiDAR. Remote Sens. Environ. 2011, 115, 2217–2231. [Google Scholar] [CrossRef]
- Zhang, C.; Qiu, F. Mapping individual tree species in an urban forest using airborne LiDAR data and hyperspectral imagery. Photogramm. Eng. Remote Sens. 2012, 78, 1079–1087. [Google Scholar] [CrossRef]
- Anderson, J.E.; Plourde, L.C.; Martin, M.E.; Braswell, B.H.; Smith, M.-L.; Dubayah, R.O.; Hofton, M.A.; Blair, J.B. Integrating waveform LiDAR with hyperspectral imagery for inventory of a northern temperate forest. Remote Sens. Environ. 2008, 112, 1856–1870. [Google Scholar] [CrossRef]
- Jones, T.G.; Coops, N.C.; Sharma, T. Assessing the utility of airborne hyperspectral and LiDAR data for species distribution mapping in the coastal Pacific Northwest, Canada. Remote Sens. Environ. 2010, 114, 2841–2852. [Google Scholar] [CrossRef]
- Clark, M.L.; Roberts, D.A.; Ewel, J.J.; Clark, D.B. Estimation of tropical rain forest aboveground biomass with small-footprint LiDAR and hyperspectral sensors. Remote Sens. Environ. 2011, 115, 2931–2942. [Google Scholar] [CrossRef]
- Cook, B.D.; Corp, L.A.; Nelson, R.F.; Middleton, E.M.; Morton, D.C.; McCorkel, J.T.; Masek, J.G.; Ranson, K.J.; Ly, V.; Montesano, P.M. NASA Goddard’s LiDAR, hyperspectral and thermal (G-LiHT) airborne imager. Remote Sens. 2013, 5, 4045–4066. [Google Scholar] [CrossRef]
- Koch, B. Status and future of laser scanning, synthetic aperture radar and hyperspectral remote sensing data for forest biomass assessment. ISPRS J. Photogramm. Remote Sens. 2010, 65, 581–590. [Google Scholar] [CrossRef]
- Canadell, J.G.; Le Quere, C.; Raupach, M.R.; Field, C.B.; Buitenhuis, E.T.; Ciais, P.; Gillett, N.P.; Houghton, R.A.; Marland, G. Contributions to accelerating atmospheric CO2 growth from economic activity, carbon intensity, and efficiency of natural sinks. Proc. Natl. Acad. Sci. USA 2007, 104, 18866–18870. [Google Scholar] [CrossRef] [PubMed] [Green Version]
- Achard, F.; Eva, H.D.; Stibig, H.J.; Mayaux, P.; Gallego, J.; Richards, T.; Malingreau, J.P. Determination of deforestation rates of the world’s humid tropical forests. Science 2002, 297, 999–1002. [Google Scholar] [CrossRef] [PubMed]
- Eaton, J.M.; Lawrence, D. Loss of carbon sequestration potential after several decades of shifting cultivation in the Southern Yucatan. For. Ecol. Manag. 2009, 258, 949–958. [Google Scholar] [CrossRef]
Figure 1.
Parque Estatal de Mata-Seca (PEMS), Minas Gerais, Brasil. August 2013.

Figure 2.
(a): Acquisition of nominal angles images in CHRIS/PROBA. FZA: Fly-by-Zenith Angle, VZA: Viewing Zenith Angle, VAA: Viewing Azimuth Angle. (b): Viewing geometry of CHRIS/PROBA and the sun for both images over PEMS. AA: Azimuth Angle, ZA: Zenith Angle.
Figure 2.
(a): Acquisition of nominal angles images in CHRIS/PROBA. FZA: Fly-by-Zenith Angle, VZA: Viewing Zenith Angle, VAA: Viewing Azimuth Angle. (b): Viewing geometry of CHRIS/PROBA and the sun for both images over PEMS. AA: Azimuth Angle, ZA: Zenith Angle.

Figure 3.
Class distribution of the successional stages of the TDF in PEMS (Brazil) for years 2008 and 2014 according to different classifiers.
Figure 3.
Class distribution of the successional stages of the TDF in PEMS (Brazil) for years 2008 and 2014 according to different classifiers.

Figure 4.
Reflectance signature of the three successional stages of TDF for 2008 and 2014, after inverted PCA. Mean value (solid line) and standard deviation (dashed line).
Figure 4.
Reflectance signature of the three successional stages of TDF for 2008 and 2014, after inverted PCA. Mean value (solid line) and standard deviation (dashed line).

Figure 5.
Land cover changes in PEMS, between 2008 and 2014 according to different classifiers.


Table 1.
Structure and composition of the successional stages of the TDFs in Mata-Seca (2006).
| Successional Stage | Early | Intermediate | Late |
|---|---|---|---|
| #Families (0.1 ha) | 4.3 ± 2.1 | 12.0 ± 0.9 | 12.3 ± 2.7 |
| # Species (0.1 ha) | 8.0 ± 1.3 | 20.2 ± 2.1 | 19.6 ± 1.7 |
| Dominant family | Caesalpiniaceae (59.1%) | Bignoniaceae (34.1%) | Bignoniaceae (34.0%) |
| Dominant species | Senna spectabilis | Tabebuia roseo–alba | Tabebuia ochracea |
| (40.5%) | (20.5%) | (24.3%) | |
| #Stems (0.1 ha) | 49.3 ± 21.0 | 109.0 ± 11.6 | 115.3 ± 15.8 |
| Averaged height (m) | 3.4 ± 0.3 | 8.0 ± 2.0 | 11.8 ± 1.7 |
| Basal area (m2/ha) | 0.006 ± 0.001 | 0.009 ± 0.001 | 0.012 ± 0.003 |
| HCI | 0.008 ± 0.003 | 0.15 ± 0.04 | 0.33 ± 0.1 |
Table 2.
Properties of the CHRIS/PROBA Mode 4—vegetation product.
| #bands | 18 |
|---|---|
| Pixel size | 17 m |
| Swath | 13 km |
| Spectral range | 491–797 nm |
| Bandwidth | 5.8–14.9 nm |
| Nominal angles | 0°/±36°/±55° |
Table 3.
Properties of the selected CHRIS/PROBA images.
| Acquisition Date | 24 February 2008 | 18 December 2014 |
|---|---|---|
| Season | Wet | Wet |
| Acquisition time | 12:56 | 15:02 |
| Solar azimuth angle | 84.4° | 249.6° |
| Solar zenith angle | 33.0° | 72.5° |
| Sensor azimuth angle | 179.1° | 4.8° |
| Sensor zenith angle Viewing Azimuth Angle Viewing Zenith Angle | −55.8° 115° 22° | −52.5° 95° 18° |
Table 4.
Description of change detection classes.
| Legend | Land Cover Class in 2008 | Land Cover Class in 2014 |
|---|---|---|
| Late stage | Late stage (no change) | |
| Late stage | Intermediate stage | |
| Late stage | Early stage | |
| Late stage | Other classes (not TDF) | |
| Intermediate stage | Intermediate stage (no change) | |
| Intermediate stage | Late stage | |
| Intermediate stage | Early stage | |
| Intermediate stage | Other classes (not TDF) | |
| Early stage | Early stage (no change) | |
| Early stage | Late stage | |
| Early stage | Intermediate stage | |
| Early stage | Other classes (not TDF) | |
| Other classes (not TDF) | Other classes (no change) | |
| Other classes (not TDF) | Late stage | |
| Other classes (not TDF) | Intermediate stage | |
| Other classes (not TDF) | Early stage |
Table 5.
Accuracy assessment of maps of successional stages in PEMS, for 2008 and 2014.
| Classification Method | Year | Class | n | Producers’ Accuracy | Users’ Accuracy | Map Accuracy | Kappa Accuracy |
|---|---|---|---|---|---|---|---|
| SVM | 2008 | L I E O | 224 346 272 337 | 98.2 53.2 7.4 100.0 | 52.6 55.3 100.0 82.6 | 64.5% | 0.52 |
| 2014 | L I E O | 557 277 239 298 | 94.6 41.9 97.5 76.5 | 78.0 76.3 74.0 100.0 | 80.5% | 0.72 | |
| SAM | 2008 | L I E O | 226 345 329 596 | 76.1 87.3 53.2 49.8 | 78.9 79.2 93.1 83.7 | 63.2% | 0.53 |
| 2014 | L I E O | 557 280 264 595 | 82.4 79.3 72.4 49.8 | 89.8 64.4 99.5 91.4 | 68.9% | 0.60 | |
| Decision Tree | 2008 | L I E O | 224 346 272 299 | 92.0 26.9 37.9 100.0 | 45.2 40.6 91.2 87.2 | 61.4% | 0.49 |
| 2014 | L I E O | 590 203 266 312 | 87.3 46.9 81.2 90.3 | 82.4 64.0 72.9 86.2 | 78.7% | 0.700 |
L: Late stage, I: Intermediate stage, E: Early stage, O: Other classes.
Table 6.
Land cover/land use changes in PEMS between 2008 and 2014.
| SVM | SAM | Decision Tree | |||||||
|---|---|---|---|---|---|---|---|---|---|
| Class Name | #Pixels | % | Ha | #Pixels | % | Ha | #Pixels | % | Ha |
| Late—No changes | 90,822 | 26.9 | 3632.9 | 26,464 | 7.8 | 1058.6 | 81,174 | 24.1 | 3247.0 |
| Late to Intermediate | 20,453 | 6.1 | 818.1 | 14,109 | 4.2 | 564.4 | 21,459 | 6.4 | 858.4 |
| Late to Early | 10,366 | 3.1 | 414.6 | 78 | 0.0 | 3.1 | 2056 | 0.6 | 82.2 |
| Late to Other classes | 1738 | 0.5 | 69.5 | 790 | 0.2 | 31.6 | 2837 | 0.8 | 113.5 |
| Intermediate—No change | 15,267 | 4.5 | 610.7 | 54,559 | 16.2 | 2182.4 | 10,062 | 3.0 | 402.5 |
| Intermediate to Late | 66,363 | 19.7 | 2654.5 | 49,014 | 14.5 | 1960.6 | 45,749 | 13.6 | 1830.0 |
| Intermediate to Early | 11,740 | 3.5 | 469.6 | 2459 | 0.7 | 98.4 | 4290 | 1.3 | 171.6 |
| Intermediate to Other classes | 4051 | 1.2 | 162.0 | 15,467 | 4.6 | 618.7 | 9523 | 2.8 | 380.9 |
| Early—No change | 3986 | 1.2 | 159.4 | 0 | 0.0 | 0.0 | 3649 | 1.1 | 146.0 |
| Early to Late | 3679 | 1.1 | 147.2 | 19,500 | 5.8 | 780.0 | 25,007 | 7.4 | 1000.3 |
| Early to Intermediate | 3000 | 0.9 | 120.0 | 30,689 | 9.1 | 1227.6 | 10,012 | 3.0 | 400.5 |
| Early to Other | 1284 | 0.4 | 51.4 | 14,384 | 4.3 | 575.4 | 6921 | 2.1 | 276.8 |
| Other classes—No change | 46,467 | 13.8 | 1858.7 | 70,153 | 20.8 | 2806.1 | 73,063 | 21.6 | 2922.5 |
| Other classes to Late | 26,349 | 7.8 | 1054.0 | 5959 | 1.8 | 238.4 | 21,049 | 6.2 | 842.0 |
| Other classes to Intermediate | 6285 | 1.9 | 251.4 | 22,428 | 6.6 | 897.1 | 7249 | 2.1 | 290.0 |
| Other classes to Early | 25,639 | 7.6 | 1025.6 | 11,436 | 3.4 | 457.4 | 13,389 | 4.0 | 535.6 |
© 2018 by the authors. Licensee MDPI, Basel, Switzerland. This article is an open access article distributed under the terms and conditions of the Creative Commons Attribution (CC BY) license (http://creativecommons.org/licenses/by/4.0/).
Share and Cite
MDPI and ACS Style
Garcia Millan, V.; Sanchez-Azofeifa, A. Quantifying Changes on Forest Succession in a Dry Tropical Forest Using Angular-Hyperspectral Remote Sensing. Remote Sens. 2018, 10, 1865. https://doi.org/10.3390/rs10121865
AMA Style
Garcia Millan V, Sanchez-Azofeifa A. Quantifying Changes on Forest Succession in a Dry Tropical Forest Using Angular-Hyperspectral Remote Sensing. Remote Sensing. 2018; 10(12):1865. https://doi.org/10.3390/rs10121865
Chicago/Turabian StyleGarcia Millan, Virginia, and Arturo Sanchez-Azofeifa. 2018. "Quantifying Changes on Forest Succession in a Dry Tropical Forest Using Angular-Hyperspectral Remote Sensing" Remote Sensing 10, no. 12: 1865. https://doi.org/10.3390/rs10121865
Note that from the first issue of 2016, this journal uses article numbers instead of page numbers. See further details here.