Hydrological Evaluation of PERSIANN-CDR Rainfall over Upper Senegal River and Bani River Basins

 , ,
, ,  , and
, and
Abstract
:
1. Introduction
2. Materials and Methods
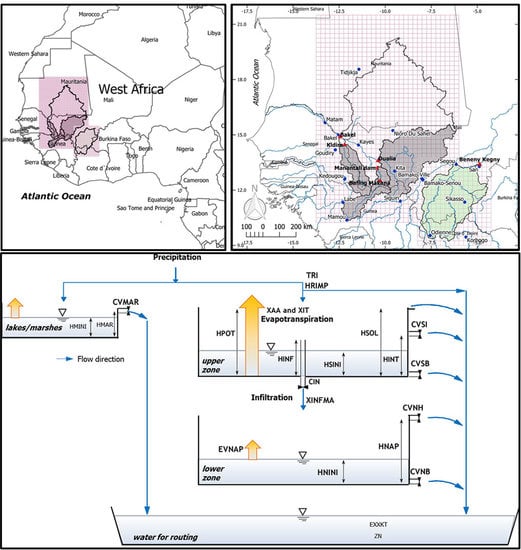
2.1. Study Area
2.2. Climate and Discharge Data
2.2.1. Gauge Network
2.2.2. Discharge and Water Level Data
2.2.3. PERSIANN-CDR Precipitation
2.2.4. ERA-Interim Temperatures
2.3. CEQUEAU Model
2.4. Bias Correction of PERSIANN-CDR Data
2.5. Validation of Input Data
2.6. Model Calibration and Validation
3. Results and Discussions
3.1. PERSIANN-CDR Rainfall Estimates
3.2. Validation of ERA-Interim Daily Temperature Estimates
3.3. Results with Original PERSIANN Data
3.4. Results for PERSIANN-CDR Bias-Corrected
4. Summary and Conclusions
Author Contributions
Funding
Acknowledgments
Conflicts of Interest
References
- Hughes, D.A. Comparison of satellite rainfall data with observations from gauging station networks. J. Hydrol. 2006, 327, 399–410. [Google Scholar] [CrossRef]
- Beck, H.E.; Vergopolan, N.; Pan, M.; Levizzani, V.; Van Dijk, A.I.J.M.; Weedon, G.P.; Brocca, L.; Pappenberger, F.; Huffman, G.J.; Wood, E.F. Global-scale evaluation of 22 precipitation datasets using gauge observations and hydrological modeling. Hydrol. Earth Syst. Sci. 2017, 21, 6201–6217. [Google Scholar] [CrossRef] [Green Version]
- Karimi, P.; Bastiaanssen, W.G.M.; Sood, A.; Hoogeveen, J.; Peiser, L.; Bastidas-Obando, E.; Dost, R.J. Spatial evapotranspiration, rainfall and land use data in water accounting—Part 2: Reliability of water acounting results for policy decisions in the Awash Basin. Hydrol. Earth Syst. Sci. 2015, 19, 533–550. [Google Scholar] [CrossRef]
- Bitew, M.M.; Gebremichael, M.; Ghebremichael, L.T.; Bayissa, Y.A. Evaluation of High-Resolution Satellite Rainfall Products through Streamflow Simulation in a Hydrological Modeling of a Small Mountainous Watershed in Ethiopia. J. Hydrometeorol. 2012, 13, 338–350. [Google Scholar] [CrossRef]
- Dembélé, M.; Zwart, S.J. Evaluation and comparison of satellite-based rainfall products in Burkina Faso, West Africa. Int. J. Remote Sens. 2016, 37, 3995–4014. [Google Scholar] [CrossRef] [Green Version]
- Miao, C.; Ashouri, H.; Hsu, K.-L.; Sorooshian, S.; Duan, Q. Evaluation of the PERSIANN-CDR Daily Rainfall Estimates in Capturing the Behavior of Extreme Precipitation Events over China. J. Hydrometeorol. 2015, 16, 1387–1396. [Google Scholar] [CrossRef]
- Poméon, T.; Jackisch, D.; Diekkrüger, B. Evaluating the performance of remotely sensed and reanalysed precipitation data over West Africa using HBV light. J. Hydrol. 2017, 547, 222–235. [Google Scholar] [CrossRef]
- Stisen, S.; Jensen, K.H.; Sandholt, I.; Grimes, D.I.F. A remote sensing driven distributed hydrological model of the Senegal River basin. J. Hydrol. 2008, 354, 131–148. [Google Scholar] [CrossRef]
- Lekula, M.; Lubczynski, M.W.; Shemang, E.M.; Verhoef, W. Validation of satellite-based rainfall in Kalahari. Phys. Chem. Earth 2018, 105, 84–97. [Google Scholar] [CrossRef]
- Iqbal, M.F.; Athar, H. Validation of satellite based precipitation over diverse topography of Pakistan. Atmos. Res. 2018, 201, 247–260. [Google Scholar] [CrossRef]
- Bodian, A.; Dezetter, A.; Deme, A.; Diop, L. Hydrological Evaluation of TRMM Rainfall over the Upper Senegal River Basin. Hydrology 2016, 3, 18. [Google Scholar] [CrossRef]
- Kimani, M.W.; Hoedjes, J.C.B.; Su, Z. An Assessment of Satellite-Derived Rainfall Products Relative to Ground Observations over East Africa. Remote Sens. 2017, 9, 1–21. [Google Scholar] [CrossRef]
- Gan, Y.; Liang, X.-Z.; Duan, Q.; Ye, A.; Di, Z.; Hong, Y.; Li, J. A systematic assessment and reduction of parametric uncertainties for a distributed hydrological model. J. Hydrol. 2018, 564, 697–711. [Google Scholar] [CrossRef]
- Looper, J.P.; Vieux, B.E.; Moreno, M.A. Assessing the impacts of precipitation bias on distributed hydrologic model calibration and prediction accuracy. J. Hydrol. 2012, 418–419, 110–122. [Google Scholar] [CrossRef]
- Dee, D.P.; Uppala, S.M.; Simmons, A.J.; Berrisford, P.; Poli, P.; Kobayashi, S.; Andrae, U.; Balmaseda, M.A.; Balsamo, G.; Bauer, P.; et al. The ERA-Interim reanalysis: Configuration and performance of the data assimilation system. Q. J. R. Meteorol. Soc. 2011, 137, 553–597. [Google Scholar] [CrossRef]
- Modèle hydrologique CEQUEAU. Available online: http://ete.inrs.ca/ete/publications/modele-hydrologique-cequeauPaquet (accessed on 01 January 2007).
- Bâ, K.M.; Díaz-Delgado, C.; Rodríguez Osorio, V. Simulación de caudales de los ríos Amacuzac y San Jerónimo en el Estado de Mexico, México. Ing. Hidráulica en México 2001, 16, 117–126. [Google Scholar]
- Llanos, H.; Ba, K.M.; Canalejo, A.C. Modelización hidrológica de la cuenca alta del río Ega (País Vasco y Navarra). Ing. Agua 1999, 6, 241–250. [Google Scholar] [CrossRef]
- WMO. Results of an intercomparison of models of snowmelt runoff. In Modelling Snowmwlt-Induced Processes (Proccedings of the Budapest Symposium, July 1986); WMO: Geneve, Switzerland, 1986. [Google Scholar]
- WMO. Simulated Real-Time Intercomparison of Hydrological Models; WMO: Geneve, Switzerland, 1992. [Google Scholar]
- Bâ, K.M.; Diaz, V.; Gómez-Albores, M.A.; Díaz-Delgado, C.; Nájera-Mota, N.; Seidou, O.; Ortiz, F. Spatially distributed hydrological modelling of a Western Africa basin. EPiC Ser. Eng. 2018, 3, 343–350. [Google Scholar] [CrossRef]
- Chaibou Begou, J.C.; Jomaa, S.; Benabdallah, S.; Bazie, P.; Afouda, A.; Rode, M. Multi-Site Validation of the SWAT Model on the Bani Catchment: Model Performance and Predictive Uncertainty. Water 2016, 8, 23. [Google Scholar] [CrossRef]
- Ruelland, D.; Ardoin-bardin, S.; Collet, L.; Roucou, P. Simulating future trends in hydrological regime of a large Sudano-Sahelian catchment under climate change. J. Hydrol. 2012, 424–425, 207–216. [Google Scholar] [CrossRef]
- Ashouri, H.; Hsu, K.L.; Sorooshian, S.; Braithwaite, D.K.; Knapp, K.R.; Cecil, L.D.; Nelson, B.R.; Prat, O.P. PERSIANN-CDR: Daily Precipitation Climate Data Record from Multisatellite Observations for Hydrological and Climate Studies. Bull. Am. Meteorol. Soc. 2015, 96, 69–83. [Google Scholar] [CrossRef]
- Mooney, P.A.; Mulligan, F.J.; Fealy, R. Comparison of ERA-40, ERA-Interim and NCEP/NCAR reanalysis data with observed surface air temperatures over Ireland. Int. J. Climatol. 2011, 31, 545–557. [Google Scholar] [CrossRef]
- Simmons, A.J.; Willett, K.M.; Jones, P.D.; Thorne, P.W.; Dee, D.P. Low-frequency variations in surface atmospheric humidity, temperature, and precipitation: Inferences from reanalyses and monthly gridded observational data sets. J. Geophys. Res. 2010, 115, 1–21. [Google Scholar] [CrossRef]
- Gao, L.; Bernhardt, M.; Schulz, K. Elevation correction of ERA-Interim temperature data in complex terrain. Hydrol. Earth Syst. Sci. 2012, 16, 4661–4673. [Google Scholar] [CrossRef] [Green Version]
- Morin, G. CEQUEAU hydrological model. In Mathematical Models of Large Watershed Hydrology; Singh, V.P., Frevert, D., Eds.; Water Resources Publications: Baton Rouge, LA, USA, 2002; pp. 507–576. ISBN 1-887201-34-3. [Google Scholar]
- Morin, G.; Sochanski, W.; Paquet, P. Modélisation Hydrologique et Prévision en Temps réel des Apports des Basins Versants Chute du Diable et Mistassibi à L’aide du Modèle CEQUEAU; INRS-Eau: Quebec, QC, USA, 1997. [Google Scholar]
- Ouellet-Proulx, S.; St-Hilaire, A.; Boucher, M.-A. Water temperature ensemble forecasts: Implementation using the CEQUEAU model on two contrasted river systems. Water 2017, 9. [Google Scholar] [CrossRef]
- Bâ, K.M.; Díaz-Delgado, C.; Quentin, E.; Guerra-Cobian, V.H.; Ojeda-Chihuahua, J.I.; Cârsteanu, A.A.; Franco-Plata, R. Hydrological modeling of large watersheds: Case study of the Senegal River, West Africa, West Africa. Tecnol. Ciencias Agua 2013, 4, 129–136. [Google Scholar]
- Eleuch, S.; Carsteanu, A.; Bâ, K.; Magagi, R.; Goïta, K.; Diaz, C. Validation and use of rainfall radar data to simulate water flows in the Rio Escondido basin. Stoch. Environ. Res. Risk Assess. 2010, 24, 559–565. [Google Scholar] [CrossRef]
- Guerra-Cobián, V.H. Análisis del Efecto de Discretización Espacial en el Modelado de Cuencas Hidrológicas Utilizando el Modelo Distribuido CEQUEAU-ONU. Ph.D. Thesis, Centro Interamericano de Recursos del Agua, Universidad Autónoma del Estado de México, Toluca, México, 2007. [Google Scholar]
- Dugdale, S.J.; St-Hilaire, A.; Curry, A. Automating drainage direction and physiographic inputs to the CEQUEAU hydrological model: Sensitivity testing on the lower Saint John river watershed, Canada. J. Hydroinform. 2017, 19, 469–492. [Google Scholar] [CrossRef]
- Valdés-Pineda, R.; Demaría, E.M.C.; Valdés, J.B.; Wi, S.; Serrat-Capdevila, A. Bias correction of daily satellite-based rainfall estimates for hydrologic forecasting in the Upper Zambezi, Africa. Hydrol. Earth Syst. Sci. 2016, 1, 28. [Google Scholar] [CrossRef]
- Demaría, E.; Serrat-Capdevila, A. Validation of Remote Sensing-Estimated Hydrometeorological Variables. In Earth Observation for Waer Resources Management; García, L., Rodriguez, M., Wijnen, M., Pakulski, I., Eds.; The World Bank: Washington, DC, USA, 2016; pp. 167–192. ISBN 9781464804755. [Google Scholar]
- Stisen, S.; Sandholt, I. Evaluation of remote-sensing-based rainfall products through predictive capability in hydrological runoff modelling. Hydrol. Process. 2010, 24, 879–891. [Google Scholar] [CrossRef]
- Worqlul, A.W.; Ayana, E.K.; Maathuis, B.H.P.; MacAlister, C.; Philpot, W.D.; Osorio Leyton, J.M.; Steenhuis, T.S. Performance of bias corrected MPEG rainfall estimate for rainfall-runoff simulation in the Upper Blue Nile Basin. J. Hydrol. 2017, 556, 1182–1191. [Google Scholar] [CrossRef]
- Powell, M.J. An efficient Method for Finding the Minimum of a Function of Several Variables without Calculating Derivatives. Comput. J. 1964, 7, 155–162. [Google Scholar] [CrossRef]
- Moriasi, D.N.; Gitau, M.W.; Pai, N.; Daggupati, P. Hydrologic and Water Quality Models: Performance Measures and Evaluation Criteria. Am. Soc. Agric. Biol. Eng. 2015, 58, 1763–1785. [Google Scholar] [CrossRef]
- Jarvis, A.; Reuter, H.I.; Nelson, A.; Guevara, E. Hole-filled seamless SRTM data V4, International Centre for Tropical Agriculture (CIAT). Available online: http://srtm.csi.cgiar.org (accessed on 13 January 2016).
- Ruelland, D.; Ardoin-Bardin, S.; Billen, G.; Servat, E. Sensitivity of a lumped and semi-distributed hydrological model to several methods of rainfall interpolation on a large basin in West Africa. J. Hydrol. 2008, 361, 96–117. [Google Scholar] [CrossRef]


| Efficiency | NSE [-] | PBIAS [%] | R2 [-] |
|---|---|---|---|
| Very good | NSE > 0.80 | PBIAS < ±5 | R2 > 0.85 |
| Good | 0.70 < NSE ≤ 0.80 | ±5 ≤ PBIAS < ±10 | 0.75 < R2 ≤ 0.85 |
| Satisfactory | 0.50 < NSE ≤ 0.70 | ±10 ≤ PBIAS < ±15 | 0.60 < R2 ≤ 0.75 |
| Not satisfactory | NSE ≤ 0.50 | PBIAS ≥ ±15 | R2 ≤ 0.60 |
| Gauge Name | X | Y | Altitude (masl) | Statistics over Monthly Rainfall | Statistics over Yearly Rainfall | |||||
|---|---|---|---|---|---|---|---|---|---|---|
| Om | R2 | RMSE | Oy | ArG | ArP | Error (%) | ||||
| Matam | −13.880 | 16.170 | 16 | 96 | 0.76 | 32.5 | 0 | NA | NA | |
| Goudiry | −11.400 | 16.630 | 128 | 300 | 0.83 | 36.0 | 25 | 589 | 712 | 21 |
| Bakel | −13.170 | 16.430 | 30 | 290 | 0.86 | 28.3 | 19 | 509 | 569 | 12 |
| Mamou | −12.085 | 10.375 | 740 | 298 | 0.85 | 63.9 | 23 | 1713 | 1922 | 12 |
| Kedougou | −12.200 | 12.600 | 160 | 300 | 0.84 | 53.2 | 25 | 1119 | 1190 | 6 |
| Labe | −12.290 | 11.336 | 1030 | 273 | 0.86 | 74.7 | 20 | 1474 | 1845 | 25 |
| Kayes | −10.300 | 14.720 | 280 | 213 | 0.85 | 53.2 | 15 | 578 | 646 | 12 |
| Nioro Du Sahel | −9.584 | 15.233 | 240 | 225 | 0.80 | 28.7 | 16 | 417 | 484 | 16 |
| Kita | −9.482 | 13.036 | 327 | 224 | 0.90 | 33.1 | 17 | 903 | 952 | 5 |
| Siguiri | −9.186 | 11.402 | 388 | 293 | 0.85 | 50.0 | 24 | 1156 | 1283 | 11 |
| Bamako-Ville | −8.013 | 12.633 | 325 | 210 | 0.85 | 43.5 | 12 | 938 | 953 | 2 |
| Bamako-Senou | −7.946 | 12.549 | 390 | 287 | 0.89 | 33.7 | 23 | 898 | 963 | 7 |
| Segou | −6.150 | 13.400 | 287 | 263 | 0.88 | 29.6 | 20 | 630 | 672 | 7 |
| Tidjikja | −11.428 | 18.557 | 398 | 300 | 0.77 | 9.1 | 25 | 90 | 111 | 3 |
| Odienne | −7.565 | 9.534 | 400 | 136 | 0.86 | 45.6 | 5 | 1431 | 1547 | 8 |
| San | −4.892 | 13.278 | 290 | 204 | 0.89 | 28.5 | 6 | 698 | 751 | 8 |
| Sikasso | −5.683 | 11.350 | 382 | 275 | 0.89 | 36.3 | 10 | 1178 | 1167 | −1 |
| Korhogo | −5.616 | 9.450 | 380 | 108 | 0.77 | 53.4 | 4 | 1168 | 1177 | 1 |
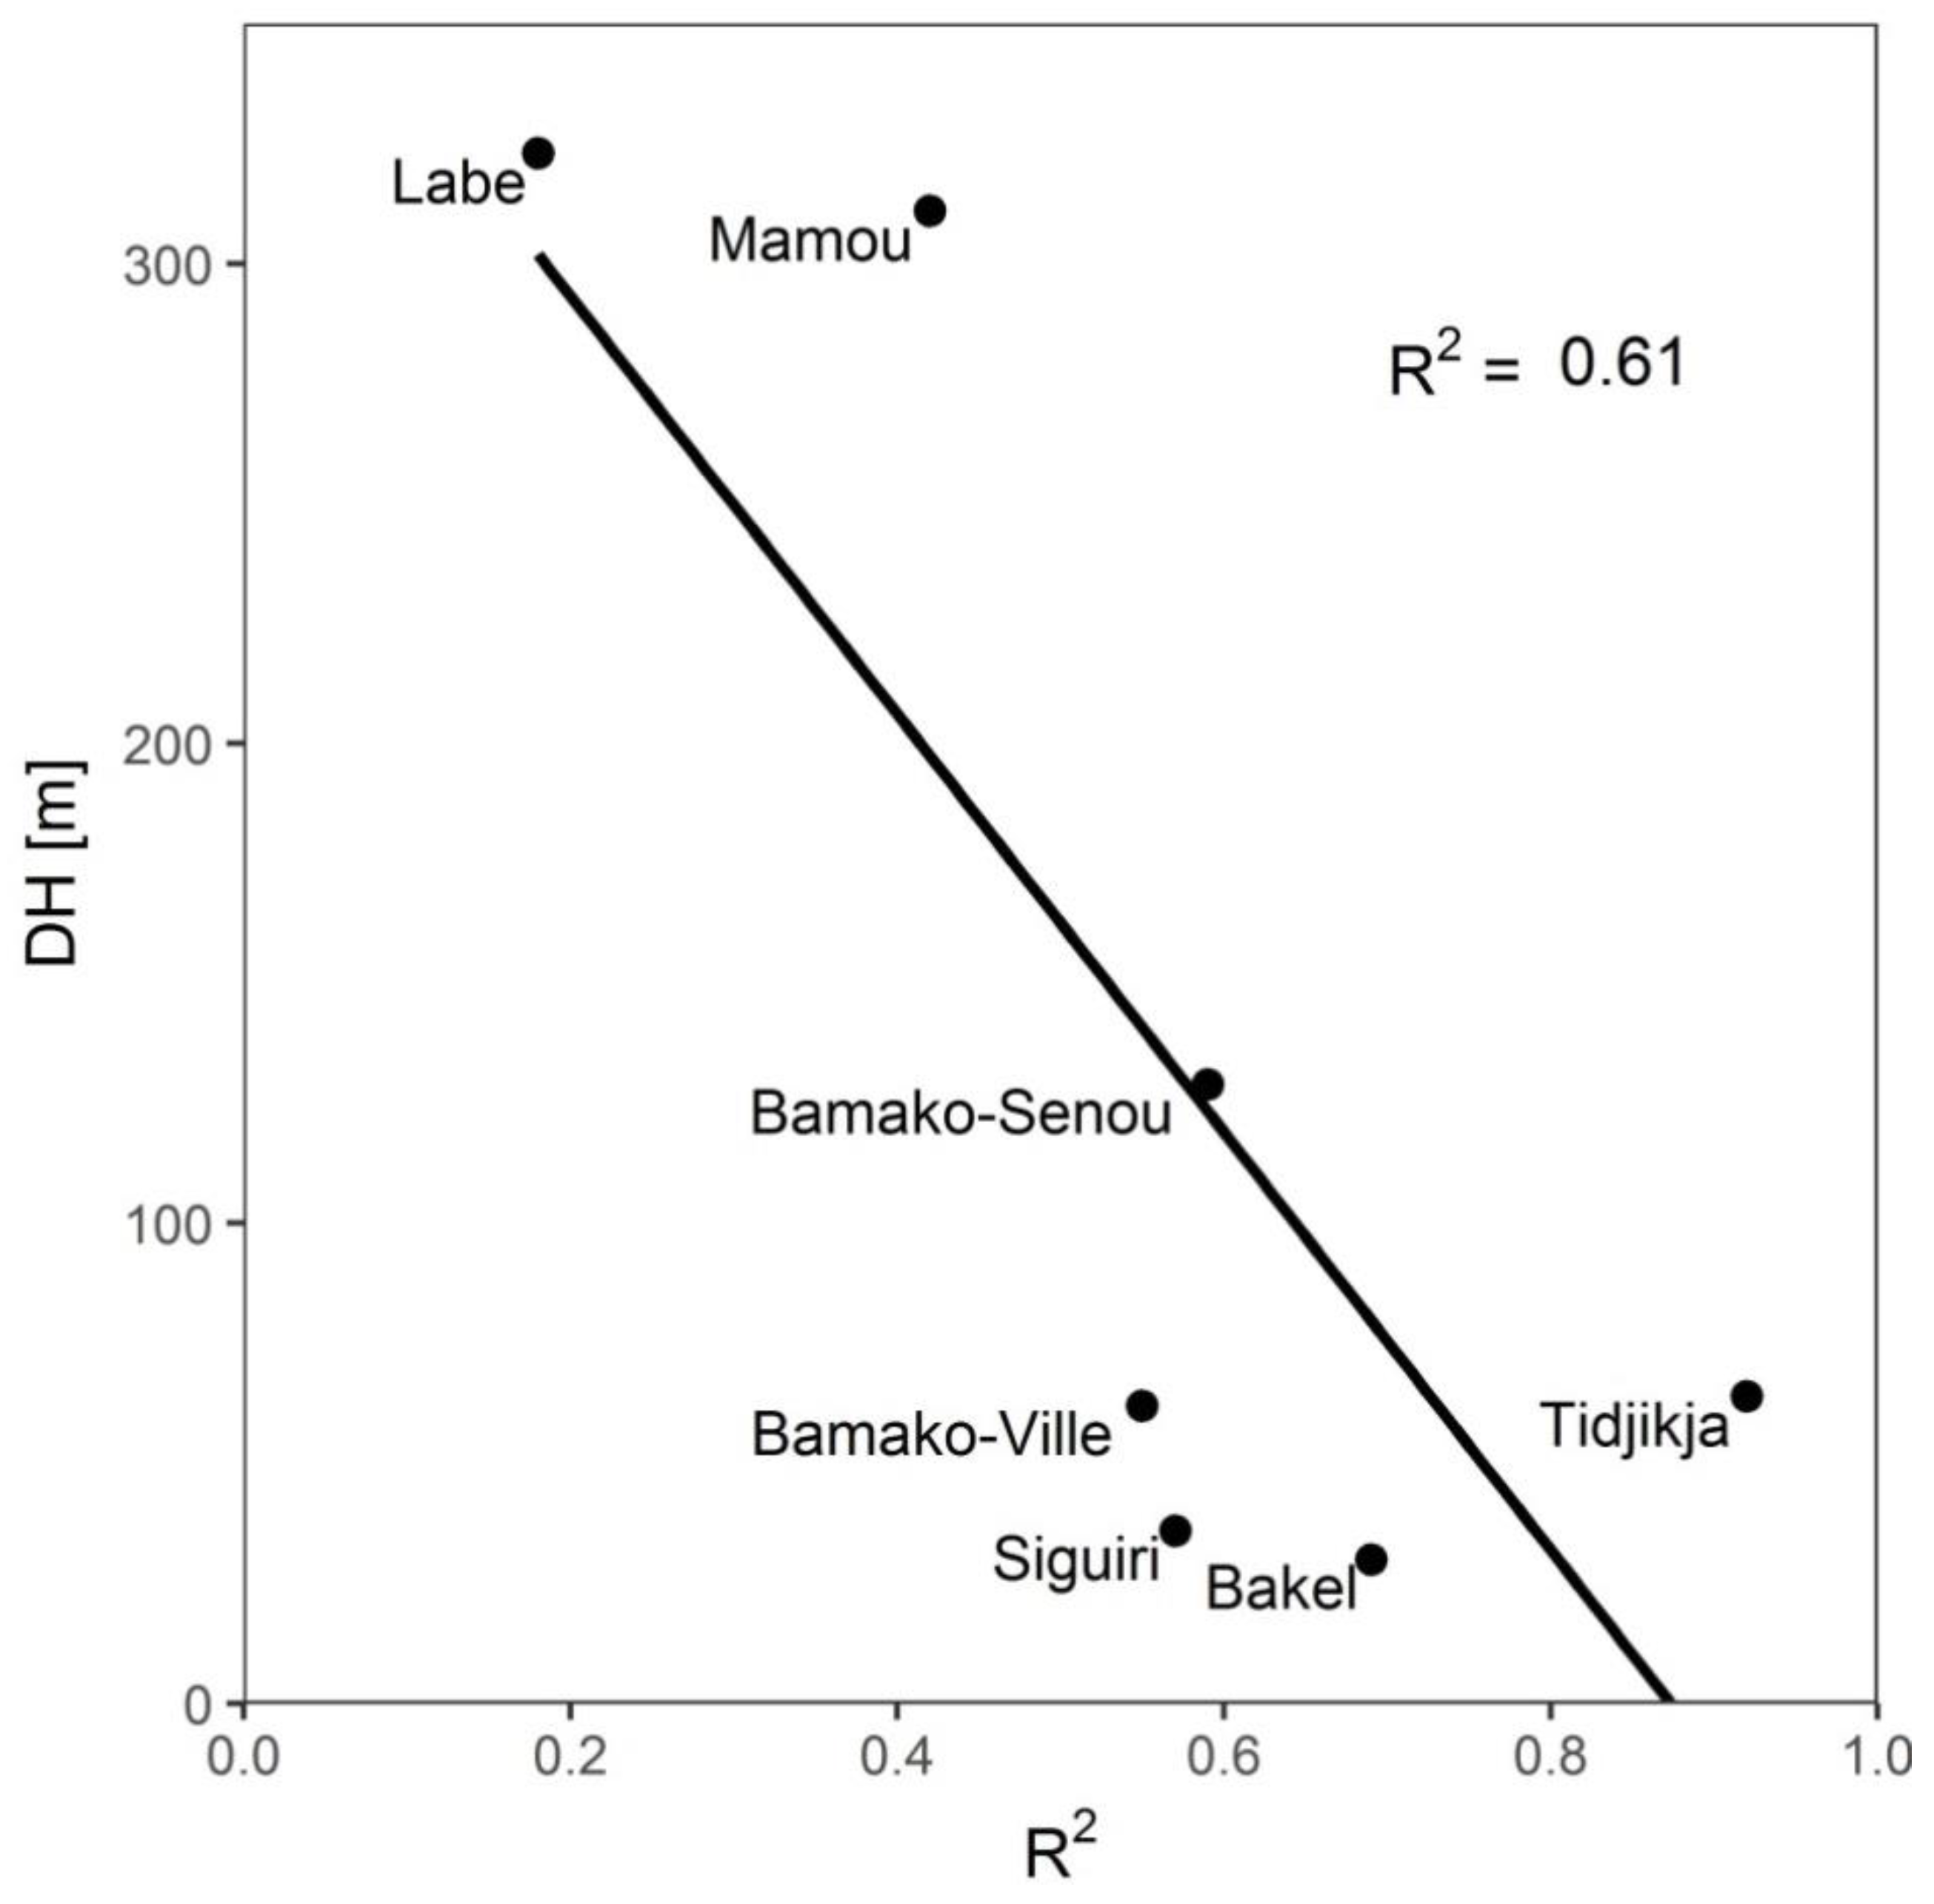
| Name | R2 | Altitude DEM | Altitude Mean DEM | Altitude Min DEM | Altitude Max DEM |
|---|---|---|---|---|---|
| Tidjikja | 0.92 | 398 | 442 | 378 | 520 |
| Siguiri | 0.57 | 388 | 368 | 332 | 452 |
| Mamou | 0.42 | 740 | 748 | 437 | 1052 |
| Labe | 0.18 | 1030 | 1036 | 713 | 1282 |
| Bamako-Senou | 0.59 | 390 | 444 | 315 | 609 |
| Bamako-Ville | 0.55 | 325 | 361 | 299 | 553 |
| Bakel | 0.69 | 30 | 41 | 11 | 123 |
| Basin | Niger | Senegal | ||||||||
|---|---|---|---|---|---|---|---|---|---|---|
| River | Bani | Bakoye | Faleme | Bafing | Bafing | |||||
| Gauge | Beneny Kegny | Oualia | Kidira | Bafing Makana | Manantali Dam | |||||
| Year | NSE | R2 | NSE | R2 | NSE | R2 | NSE | R2 | NSE | R2 |
| 1995 | 0.86 | 0.98 | 0.89 | 0.93 | 0.90 | 0.93 | 0.88 | 0.88 | 0.23 | 0.67 |
| 1996 | 0.77 | 0.96 | 0.88 | 0.88 | 0.77 | 0.87 | 0.83 | 0.89 | 0.96 | 0.96 |
| 1997 | 0.86 | 0.92 | 0.83 | 0.83 | 0.90 | 0.9 | 0.84 | 0.88 | 0.94 | 0.95 |
| 1998 | 0.97 | 0.98 | 0.71 | 0.81 | 0.70 | 0.76 | 0.91 | 0.93 | 0.93 | 0.98 |
| 1999 | 0.94 | 0.98 | 0.88 | 0.88 | 0.88 | 0.89 | 0.83 | 0.89 | 0.83 | 0.88 |
| 2000 | 0.74 | 0.89 | 0.80 | 0.88 | 0.77 | 0.88 | 0.74 | 0.81 | 0.09 | 0.58 |
| 2001 | 0.94 | 0.96 | 0.65 | 0.78 | 0.70 | 0.83 | 0.74 | 0.78 | 0.54 | 0.79 |
| 2002 | 0.85 | 0.91 | 0.73 | 0.74 | 0.74 | 0.81 | 0.87 | 0.89 | 0.81 | 0.92 |
| 2003 | 0.96 | 0.97 | 0.85 | 0.88 | 0.83 | 0.88 | 0.83 | 0.84 | 0.84 | 0.89 |
| 2004 | - | - | 0.31 | 0.76 | 0.66 | 0.74 | 0.46 | 0.70 | 0.57 | 0.79 |
| 2005 | 0.93 | 0.93 | 0.63 | 0.86 | 0.62 | 0.83 | 0.76 | 0.81 | 0.55 | 0.71 |
| 2006 | 0.90 | 0.96 | 0.63 | 0.84 | 0.46 | 0.73 | 0.64 | 0.91 | 0.57 | 0.84 |
| 2007 | 0.93 | 0.95 | 0.85 | 0.89 | 0.87 | 0.91 | 0.84 | 0.85 | 0.95 | 0.99 |
| 2008 | 0.84 | 0.95 | 0.86 | 0.88 | 0.80 | 0.82 | 0.92 | 0.93 | 0.91 | 0.96 |
| 2009 | 0.81 | 0.97 | 0.65 | 0.81 | 0.72 | 0.94 | 0.86 | 0.94 | 0.75 | 0.82 |
| 2010 | 0.81 | 0.93 | 0.86 | 0.87 | 0.65 | 0.83 | 0.61 | 0.78 | 0.69 | 0.81 |
| 2011 | 0.84 | 0.90 | 0.55 | 0.65 | 0.32 | 0.73 | 0.72 | 0.92 | 0.21 | 0.47 |
| 2012 | 0.86 | 0.95 | 0.72 | 0.76 | 0.81 | 0.84 | 0.82 | 0.84 | 0.80 | 0.91 |
| 2013 | 0.97 | 0.97 | 0.77 | 0.86 | 0.74 | 0.86 | 0.74 | 0.79 | 0.88 | 0.93 |
| 2014 | 0.96 | 0.97 | 0.49 | 0.87 | 0.91 | 0.92 | 0.83 | 0.86 | 0.81 | 0.94 |
| 2015 | 0.96 | 0.97 | 0.78 | 0.81 | 0.60 | 0.83 | 0.84 | 0.88 | 0.80 | 0.92 |
| Month | 1 | 2 | 3 | 4 | 5 | 6 | 7 | 8 | 9 | 10 | 11 | 12 |
|---|---|---|---|---|---|---|---|---|---|---|---|---|
| Bani Basin | 1.04 | 1.53 | 0.82 | 0.82 | 0.88 | 0.85 | 0.96 | 0.97 | 0.93 | 0.91 | 0.91 | 0.66 |
| Senegal Basin | 3.03 | 0.90 | 2.75 | 1.99 | 1.17 | 0.86 | 0.87 | 0.87 | 0.87 | 0.84 | 2.07 | 2.08 |
| Basin | Niger | Senegal | ||||||||
|---|---|---|---|---|---|---|---|---|---|---|
| River | Bani | Bakoye | Faleme | Bafing | Bafing | |||||
| Gauge | Beneny Kegny | Oualia | Kidira | Bafing Makana | Manantali Dam | |||||
| Year | NSE | R2 | NSE | R2 | NSE | R2 | NSE | R2 | NSE | R2 |
| 1995 | 0.69 | 0.98 | 0.89 | 0.90 | 0.88 | 0.93 | 0.92 | 0.94 | 0.75 | 0.90 |
| 1996 | 0.57 | 0.95 | 0.76 | 0.79 | 0.75 | 0.92 | 0.81 | 0.92 | 0.92 | 0.95 |
| 1997 | 0.73 | 0.90 | 0.72 | 0.76 | 0.92 | 0.93 | 0.85 | 0.92 | 0.89 | 0.95 |
| 1998 | 0.97 | 0.98 | 0.70 | 0.80 | 0.67 | 0.75 | 0.86 | 0.93 | 0.98 | 0.98 |
| 1999 | 0.95 | 0.95 | 0.68 | 0.83 | 0.85 | 0.86 | 0.75 | 0.94 | 0.77 | 0.91 |
| 2000 | −1.01 | 0.98 | 0.65 | 0.89 | 0.66 | 0.89 | 0.77 | 0.88 | −0.15 | 0.50 |
| 2001 | 0.92 | 0.97 | 0.56 | 0.75 | 0.65 | 0.84 | 0.74 | 0.86 | 0.24 | 0.82 |
| 2002 | 0.77 | 0.93 | 0.72 | 0.75 | 0.72 | 0.85 | 0.80 | 0.84 | 0.85 | 0.95 |
| 2003 | 0.97 | 0.97 | 0.83 | 0.90 | 0.91 | 0.93 | 0.82 | 0.86 | 0.89 | 0.92 |
| 2004 | - | - | 0.30 | 0.70 | 0.57 | 0.70 | 0.58 | 0.84 | 0.41 | 0.75 |
| 2005 | 0.89 | 0.91 | 0.58 | 0.83 | 0.81 | 0.89 | 0.70 | 0.82 | 0.59 | 0.75 |
| 2006 | 0.87 | 0.97 | 0.81 | 0.83 | 0.01 | 0.71 | 0.33 | 0.82 | 0.39 | 0.78 |
| 2007 | 0.97 | 0.97 | 0.89 | 0.89 | 0.83 | 0.93 | 0.81 | 0.82 | 0.99 | 1.00 |
| 2008 | 0.77 | 0.95 | 0.84 | 0.88 | 0.78 | 0.82 | 0.84 | 0.90 | 0.88 | 0.96 |
| 2009 | 0.85 | 0.95 | 0.63 | 0.79 | 0.81 | 0.93 | 0.83 | 0.90 | 0.82 | 0.88 |
| 2010 | 0.87 | 0.94 | 0.81 | 0.84 | 0.72 | 0.86 | 0.59 | 0.78 | 0.74 | 0.85 |
| 2011 | 0.89 | 0.91 | 0.54 | 0.61 | 0.55 | 0.83 | 0.58 | 0.86 | 0.30 | 0.52 |
| 2012 | 0.91 | 0.97 | 0.62 | 0.71 | 0.78 | 0.81 | 0.82 | 0.83 | 0.88 | 0.96 |
| 2013 | 0.97 | 0.98 | 0.83 | 0.86 | 0.77 | 0.89 | 0.71 | 0.82 | 0.80 | 0.90 |
| 2014 | 0.93 | 0.95 | 0.68 | 0.86 | 0.90 | 0.92 | 0.91 | 0.91 | 0.87 | 0.96 |
| 2015 | 0.97 | 0.98 | 0.76 | 0.84 | 0.64 | 0.86 | 0.90 | 0.93 | 0.84 | 0.94 |
| Gauge | Calibration (2001–2011) | Validation 1 (1995–2000) | Validation 2 (2012–2015) | |||||||||
|---|---|---|---|---|---|---|---|---|---|---|---|---|
| Raw | Bias-Corrected | Raw | Bias-Corrected | Raw | Bias-Corrected | |||||||
| (a) | (b) | (a) | (b) | (a) | (b) | (a) | (b) | (a) | (b) | (a) | (b) | |
| Beneny K. | 0.98 | 7.4 | 0.99 | 2.5 | 0.99 | −1.2 | 0.97 | −26.5 | 0.97 | 9.3 | 0.99 | 5.3 |
| Oualia | 0.96 | −1.2 | 0.95 | −5.1 | 0.97 | −5.6 | 0.94 | −14.2 | 0.91 | 0.3 | 0.86 | 2.9 |
| Kidira | 0.94 | −1.8 | 0.96 | 1.2 | 0.92 | −22.2 | 0.90 | −15.5 | 0.83 | 22.0 | 0.84 | 27.3 |
| Bafing M. | 0.93 | −4.5 | 0.95 | −1.1 | 0.89 | −21.3 | 0.88 | −25.8 | 0.89 | −8.1 | 0.91 | −11.0 |
| Manantali | 0.89 | 0.0 | 0.95 | −0.1 | 0.91 | 0.1 | 0.91 | −0.1 | 0.89 | 0.0 | 0.92 | −0.3 |
| Authors | Model | Source | Gauge | Calibration | NSEP | Validation | NSEP |
|---|---|---|---|---|---|---|---|
| This paper | CEQUEAU | PERSIANN-CDR | Beneny Kegny | 2001–2011 | 0.98 | 1995–2000 2012–2015 | 0.99 0.97 |
| Bâ et al. [21] | CEQUEAU | Gauge | Beneny Kegny | 1992–1996 | 0.96 | 1997–1999 | 0.88 |
| Bâ et al. [21] | CEQUEAU | TRMM | Beneny Kegny | 2005–2016 | 0.91 | 1998–2003 | 0.96 |
| Bâ et al. [21] | CEQUEAU | TRMMRT | Beneny Kegny | 2008–2016 | 0.88 | 2001–2007 | 0.83 |
| Ruelland et al. [23] | Hydro–Strahler | Gauge | Douna | 1961–1990 | 0.92 | 1952–1960 1991–2000 | 0.94 0.89 |
| Chaibou Begou et al. [22] | SWAT | Gauge | Douna | 1983–1992 | 0.76 | 1993–1997 | 0.85 |
| Authors | Model | Source | Gauge | Calibration | NSEP | Validation | NSEP |
|---|---|---|---|---|---|---|---|
| This paper | CEQUEAU | PERSIANN-CDR | Oualia | 2001–2011 | 0.96 | 1995–2000 2012–2015 | 0.97 0.91 |
| Stisen and Sandholt [37] | Mike SHE | Gauge | Oualia | 1991–1996 | 0.83 | 1987–1990 | 0.76 |
| This paper | CEQUEAU | PERSIANN-CDR | Bafing Makana | 2001–2011 | 0.93 | 1995–2000 2012–2015 | 0.89 0.89 |
| Stisen and Sandholt [37] | Mike SHE | Gauge | Bafing Makana | 1991–1996 | 0.88 | 1987–1990 | 0.90 |
| Bodian et al. [11] | GR4J | Gauge | Bafing Makana | 1963–1982 1983–1997 | 0.88 0.79 | 1983–1997 1963–1982 1998–2004 | 0.84 0.80 0.88 |
| Bodian et al. [11] | GR4J | TRMM | Bafing Makana | 1998–2004 | 0.80 | ||
| Stisen and Sandholt [37] | Mike SHE | Gauge | Bafing Makana | 1991–1996 | 0.88 | 1987–1990 | 0.90 |
| This paper | CEQUEAU | PERSIANN-CDR | Manantali Dam | 2001–2011 | 0.89 | 1995–2000 2012–2015 | 0.91 0.89 |
| This paper | CEQUEAU | PERSIANN-CDR bias | Manantali Dam | 2001–2011 | 0.95 | 1995–2000 2012–2015 | 0.91 0.92 |
| Bâ et al. [31] | CEQUEAU | Gauge | Manantali Dam | 1988–2000 | 0.94 |
© 2018 by the authors. Licensee MDPI, Basel, Switzerland. This article is an open access article distributed under the terms and conditions of the Creative Commons Attribution (CC BY) license (http://creativecommons.org/licenses/by/4.0/).
Share and Cite
Bâ, K.M.; Balcázar, L.; Diaz, V.; Ortiz, F.; Gómez-Albores, M.A.; Díaz-Delgado, C. Hydrological Evaluation of PERSIANN-CDR Rainfall over Upper Senegal River and Bani River Basins. Remote Sens. 2018, 10, 1884. https://doi.org/10.3390/rs10121884
Bâ KM, Balcázar L, Diaz V, Ortiz F, Gómez-Albores MA, Díaz-Delgado C. Hydrological Evaluation of PERSIANN-CDR Rainfall over Upper Senegal River and Bani River Basins. Remote Sensing. 2018; 10(12):1884. https://doi.org/10.3390/rs10121884
Chicago/Turabian StyleBâ, Khalidou M., Luis Balcázar, Vitali Diaz, Febe Ortiz, Miguel A. Gómez-Albores, and Carlos Díaz-Delgado. 2018. "Hydrological Evaluation of PERSIANN-CDR Rainfall over Upper Senegal River and Bani River Basins" Remote Sensing 10, no. 12: 1884. https://doi.org/10.3390/rs10121884