Article

An Identification Method for Spring Maize in Northeast China Based on Spectral and Phenological Features

1
State Key Laboratory of Earth Surface Processes and Resource Ecology, Beijing Normal University, Beijing 100875, China
2
Beijing Engineering Research Center for Global Land Remote Sensing Products, Institute of Remote Sensing Science and Engineering, Faculty of Geographical Science, Beijing Normal University, Beijing 100875, China
*
Author to whom correspondence should be addressed.
Remote Sens. 2018, 10(2), 193; https://doi.org/10.3390/rs10020193
Submission received: 16 October 2017 / Revised: 25 January 2018 / Accepted: 25 January 2018 / Published: 28 January 2018
(This article belongs to the Section Remote Sensing in Agriculture and Vegetation)

Abstract

:
Accurate data about the spatial distribution and planting area of maize is important for policy making, economic development, environmental protection and food security under climate change. This paper proposes a new identification method for spring maize based on spectral and phenological features derived from the moderate resolution imaging spectroradiometer (MODIS) land surface reflectance time-series data. The method focused on the spectral differences of different land cover types in the specific phenological phases of spring maize by testing the selections and combinations of classification metrics, feature extraction methods and classifiers. Taking Liaoning province, a representative planting region of spring maize in Northeast China, as the study area, the results indicated that the combined multiple metrics, including the red reflectance, near-infrared reflectance and normalized difference vegetation index (NDVI), were conducive to the maize identification and were better than any single metric. With regard to the feature extraction and selection, maize identification based on different phenological features selected with prior knowledge was more efficient than that based on statistical features derived from the principal component analysis. Compared with the maximum likelihood classification method, the decision tree classification based on expert knowledge was more suitable for phenological features selected from some prior knowledge. In summary, discriminant rules were defined with those phenological features from multiple metrics, and the decision tree classification was used to identify maize in the study area. The producer’s accuracy of maize identification was 98.57%, and the user’s accuracy was 81.18%. This method can be potentially applied to an operational identification of maize at large scales based on remote sensing time-series data.

Graphical Abstract

1. Introduction

Maize is one of the world’s major grain crops [1]. Accurate data about the spatial distribution and planting area of maize is of great significance for crop yield estimation, agricultural production management, agricultural policy-making and food security under climate change [2,3,4,5]. The field survey is a traditional way to investigate crop distribution, but it is unable to meet the needs of modern crop investigation for a precise, comprehensive and efficient development aim [6]. Remote sensing technology has the advantages of large-scale synchronous observation, high visiting frequency and low cost, so it can be potentially and conveniently used to obtain the actual crop spatial distribution at large scales [7,8].
Crop identification based on remote sensing data is essentially a refined classification of the vegetation types on the arable land. Different crop types within the same growing season may have similar spectral and textural features in remote sensing images at a large scale. Therefore, crop types cannot be effectively distinguished if only a single-phase remote sensing image is used during the growing season [9]. Temporal features corresponding to the whole process of crop growth and development can reflect the variations of crop biomass and coverage with time [10]. The continuous time series of remote sensing images with a high temporal resolution can reflect the crop phenological phases. According to the phenological differences among different crops, the large-scale crop spatial distribution may be accurately extracted [11].
Previous studies tended to use features from a single metric (e.g., mostly vegetation index) to distinguish crop types and then obtain the spatial distribution of a specific crop [8,12,13,14,15,16]. However, features from a single metric are weak at discriminating different crops which have a similar growing cycle and planting structure. Moreover, the error tolerance for temporal noise in time-series remote sensing data is relatively low for a single metric, which will further affect the identification of a specific crop. For example, the normalized difference vegetation index (NDVI) has the advantage of compositive information from the red and near-infrared reflectance band and is often used as a single metric (i.e., the red or near-infrared reflectance band is not further used) to identify crop types. However, it may mask the differences in the red and/or near-infrared reflectance band between a specific crop and other land cover types. Maize can be widely planted and has a wide ecological amplitude that tends to overlap with other crop types. The identification accuracy for maize may be very low if only the features from a single metric are used [17]. To solve this problem, many researchers have attempted to combine multiple metrics, such as vegetation indices [18,19], multi-spectral reflectance [20] and phenological metrics [21,22]. However, these metrics are always constrained by the high demand of simultaneity about high spatial and temporal resolution of remote sensing images which is difficult to be reached currently. Image fusion [23,24,25] and mixed pixel decomposition [9,20,26] are other ways to solve this problem, but the inconsistency of multi-source image data and the reliability of mixed pixel decomposition model would have impacts on crop identification.
Though the combination of multi-metric variables can enhance spectral information, it is likely to cause information redundancy [27], resulting in a low efficiency for data storage and processing. Besides, too many features may lead to data redundancy and overfitting. That is, the classification accuracy does not increase with the increasing number of features, but decreases. Redundant information largely exists in the remote sensing time-series data. In order to improve the classification efficiency, it is necessary to find effective information from these redundant time-series data: namely, feature extraction and selection. There are two common types of method for this: one is the unsupervised feature extraction and selection based on statistics, and the other is the supervised feature extraction and selection based on prior knowledge. The principal component analysis (PCA) is a traditional unsupervised feature extraction method based on information compression [28], but it may be not a good feature selection method because the last principal components may be more contributive to a given classification [29]. By contrast, the random forest (RF) [30], genetic algorithm (GA) [31] and particle swarm optimization (PSO) [32] can handle redundant features very well and provide some hints for feature selection and reduction.
Aiming to improve the identification accuracy of spring maize from the optimal combination of the main classification processes, this study took Liaoning province, a representative planting region of spring maize in Northeast China, as an example and proposed a new identification method for spring maize based on spectral and phenological features from multiple metrics. The following three hypotheses were first tested and verified, and then an optimal identification method for maize was summarized.
(1)
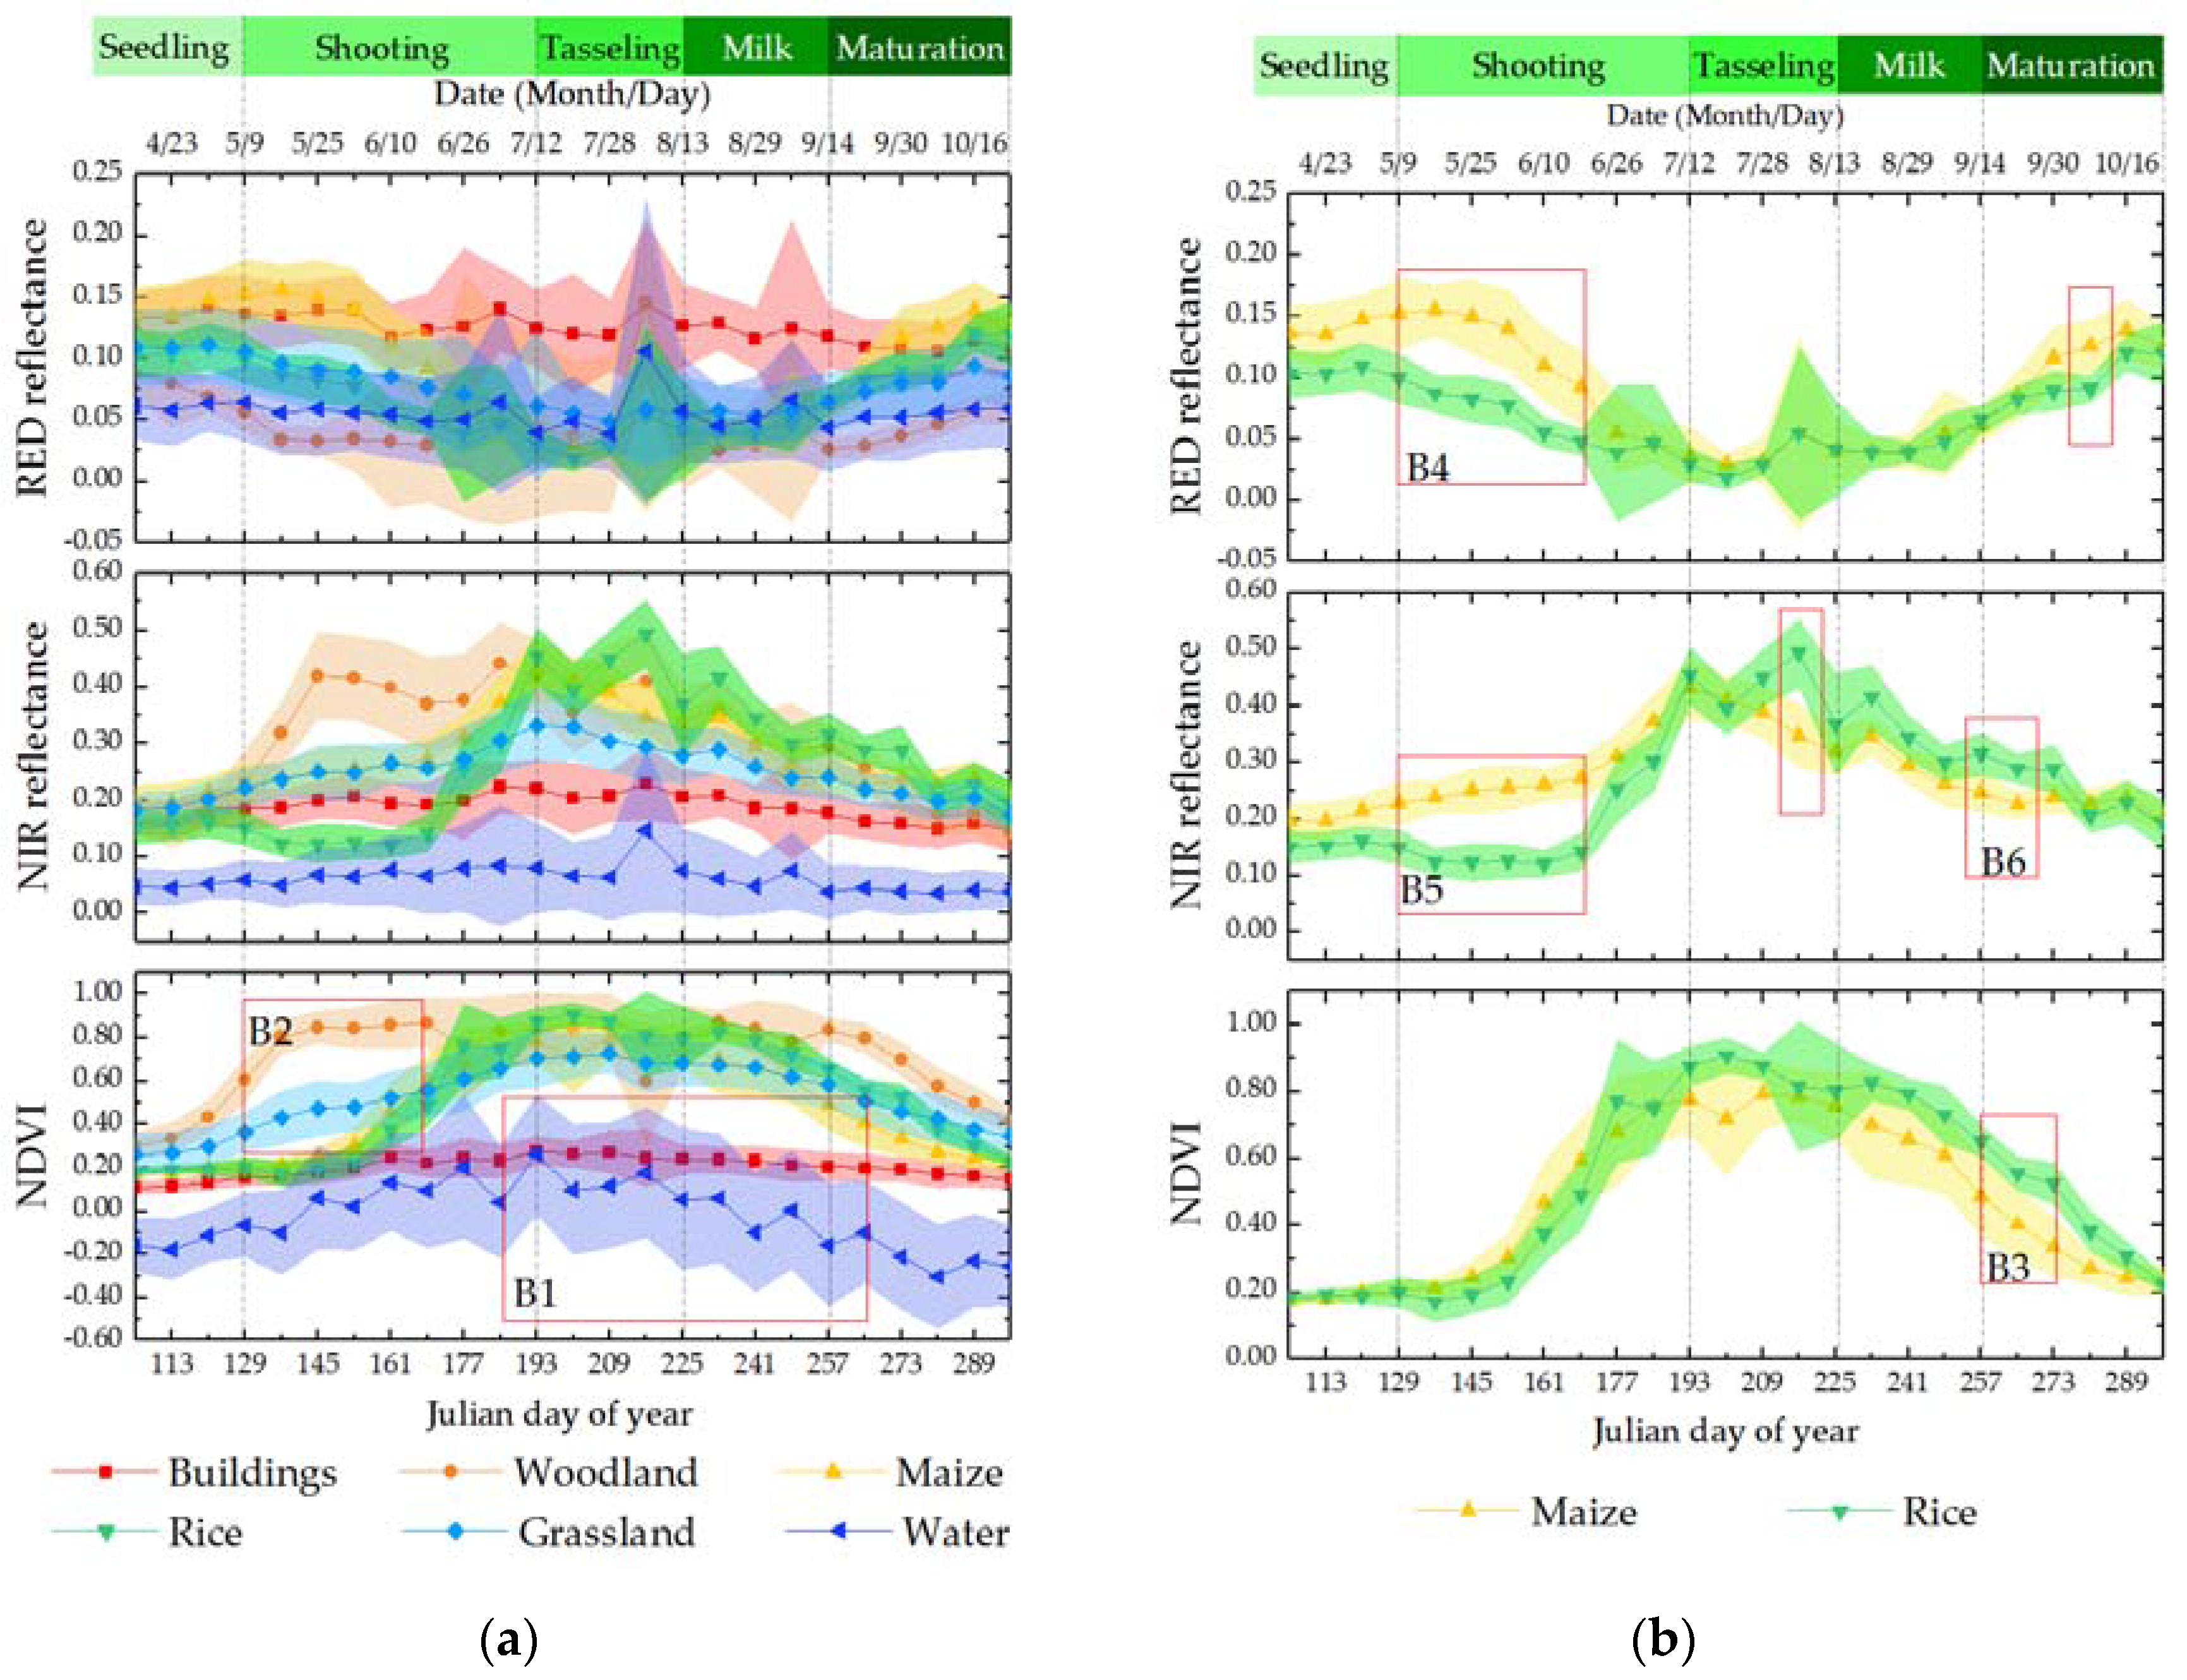
For this study, differences between maize and other land cover types may be more obvious in the red and/or near-infrared band than NDVI in some certain phenological stages of maize.
(2)
Since time-series data can reflect the growing rhythm of vegetation, the selected phenological features based on prior knowledge may be better than the statistical features derived from the PCA method.
(3)
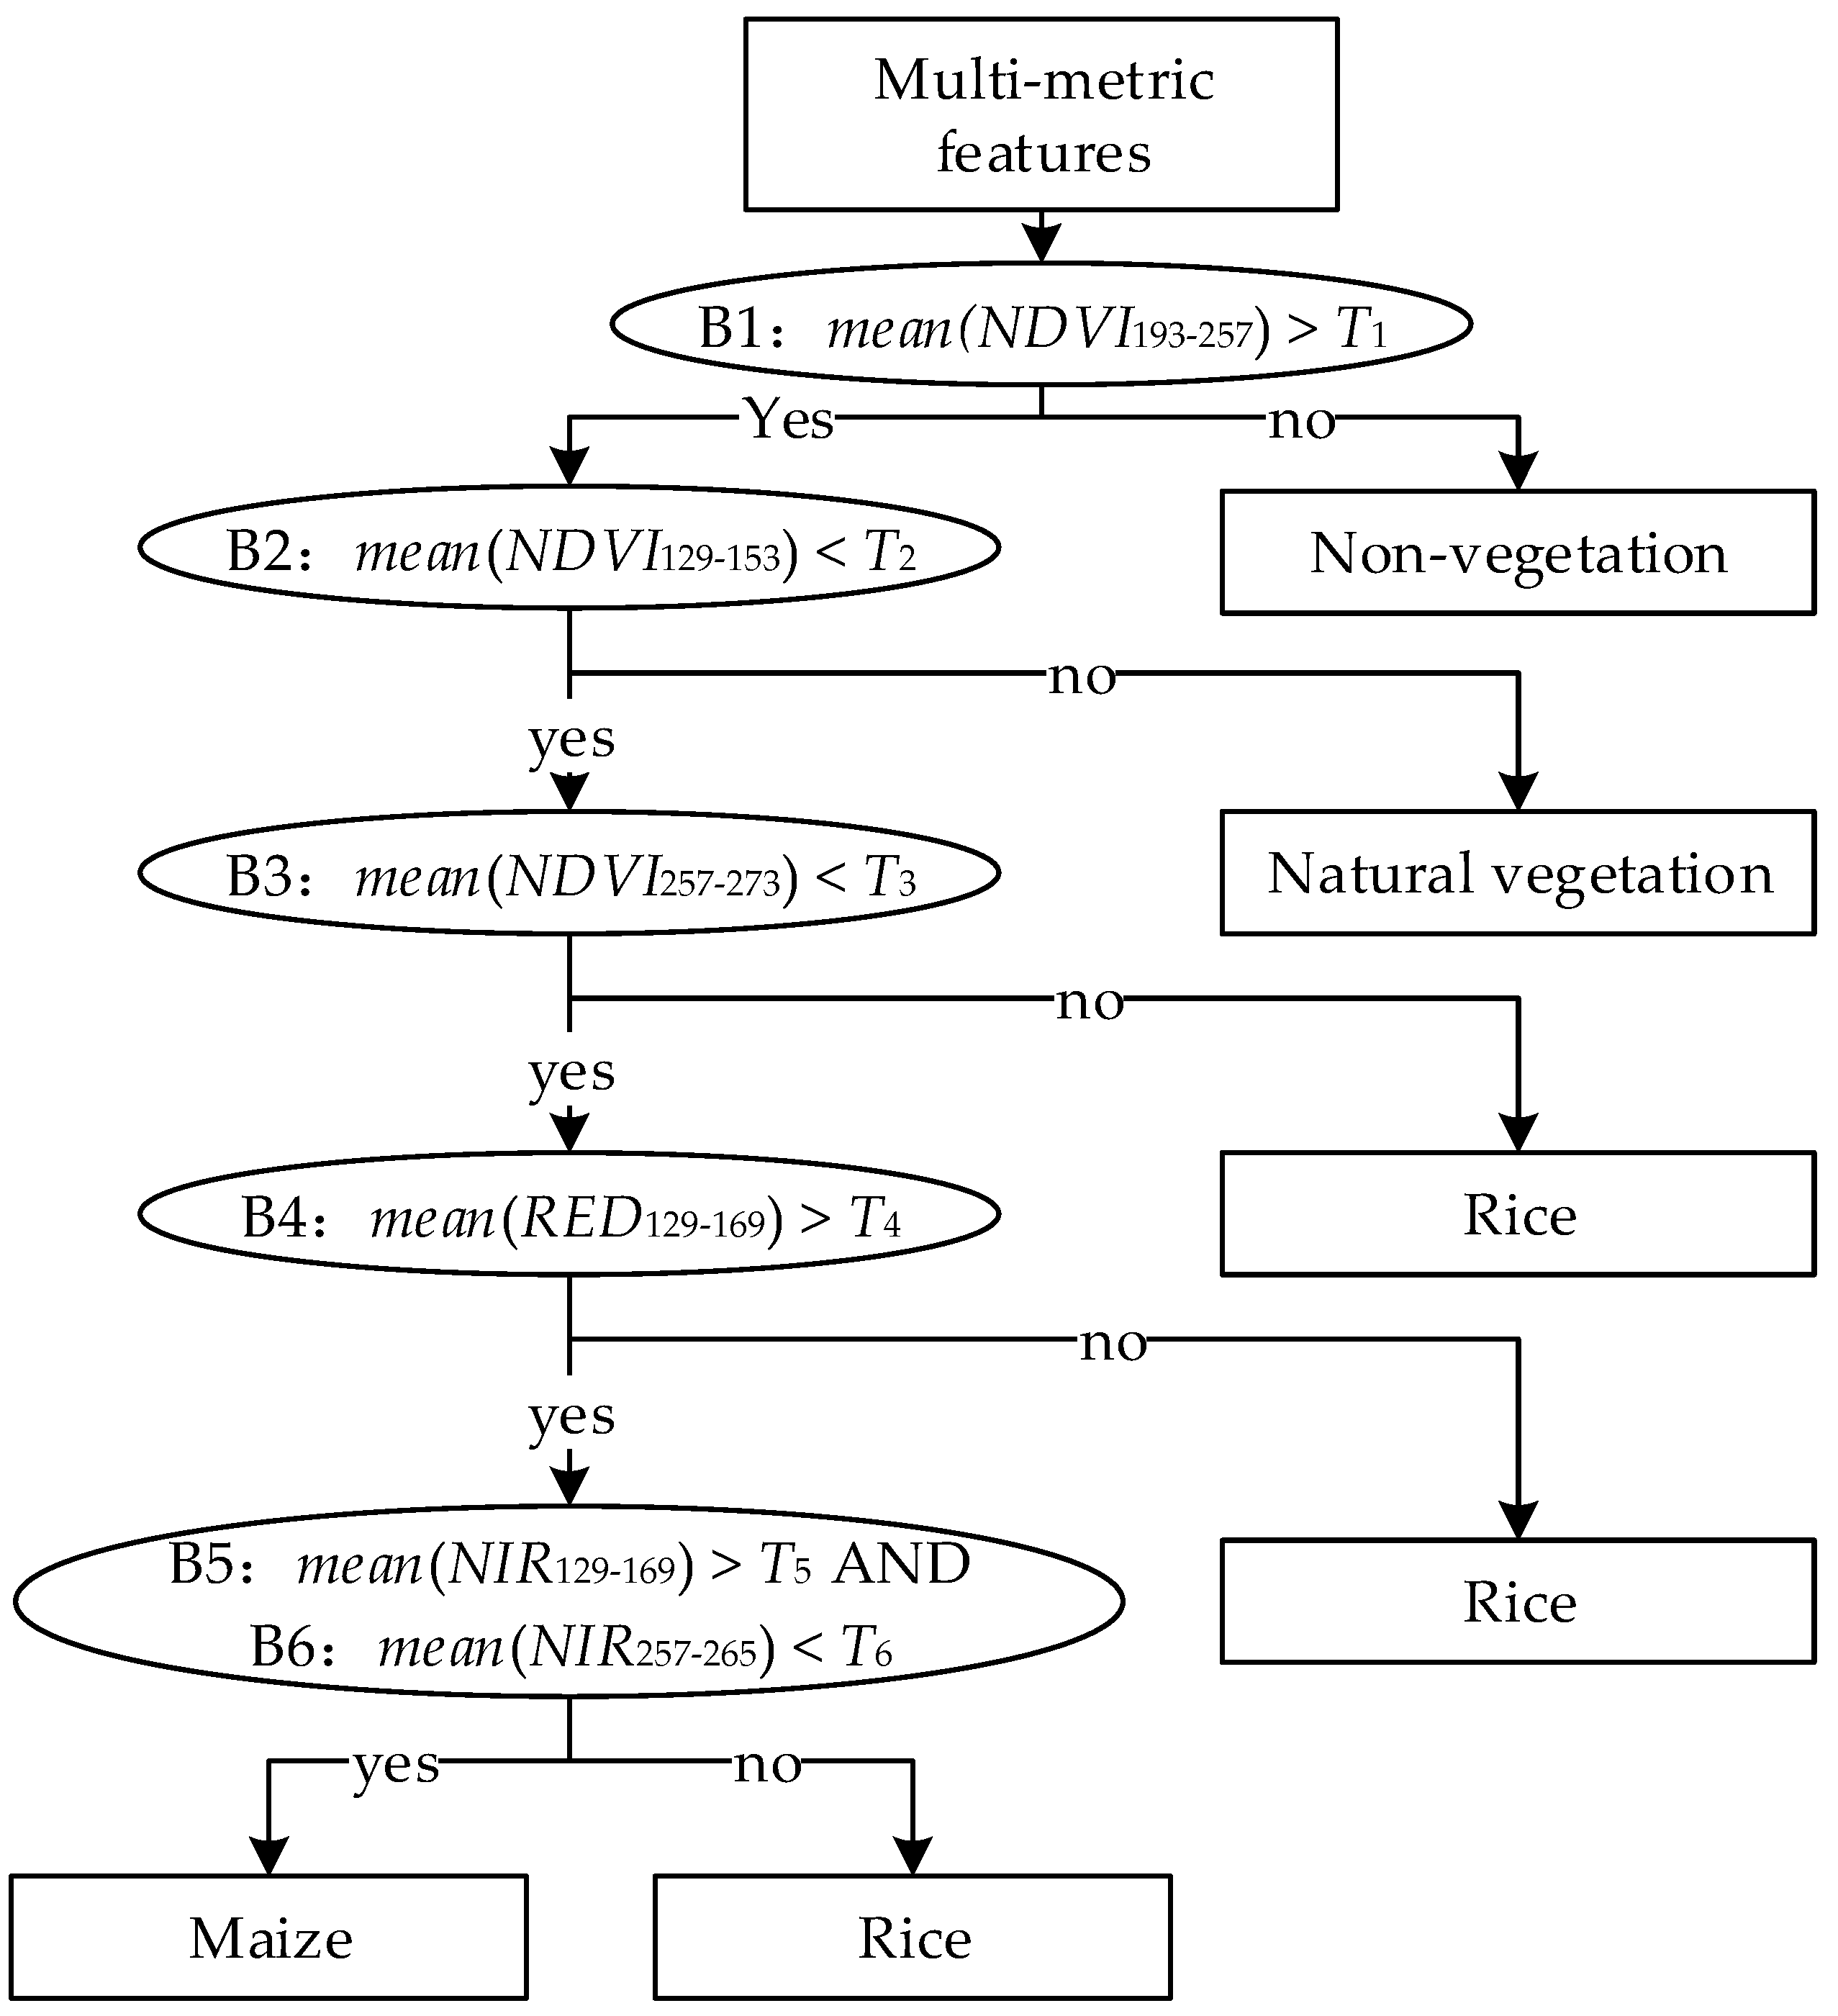
In this study, the decision tree classifier based on expert knowledge may be more matched than the maximum likelihood classifier based on statistics according to the selected features.

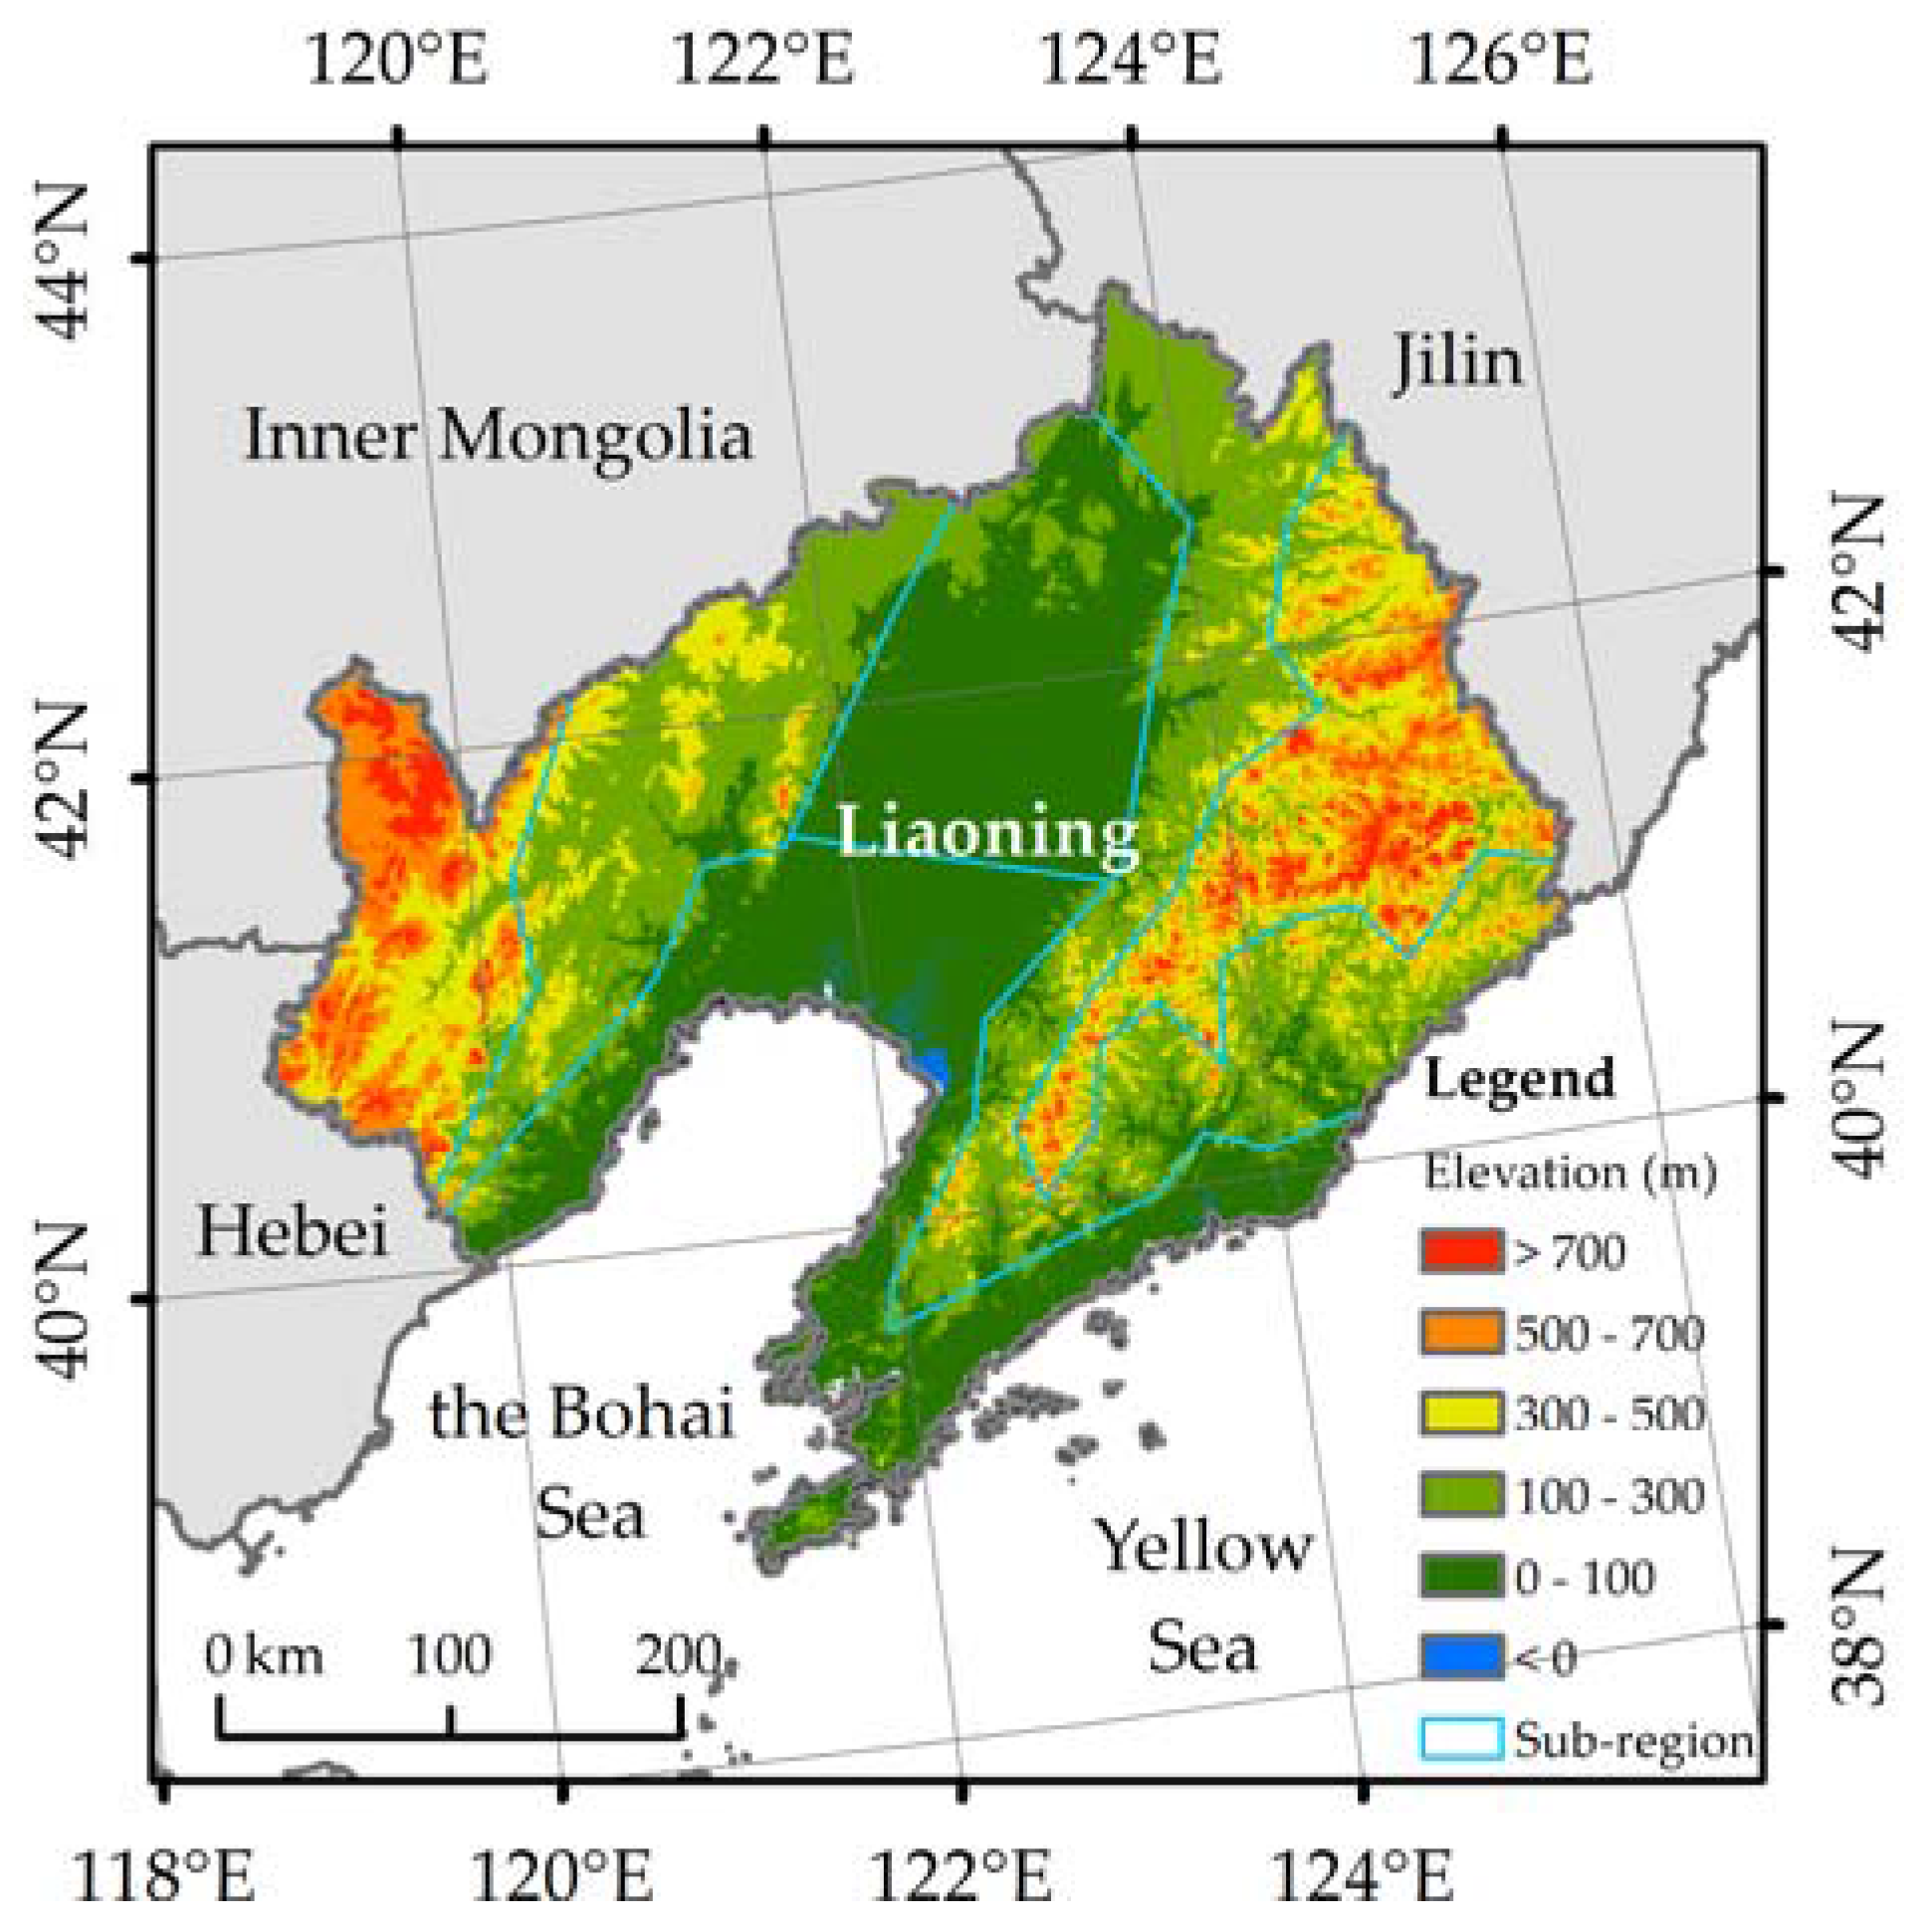
2. Study Area and Materials

2.1. Study Area

Liaoning province is located in the south of Northeast China. Its terrain tilts from north to south and from both east and west to the central plain (Figure 1). Both east and west are mainly featured by mountains with limited arable land. Liaohe Plain, lying in the center of the province, is the major farming area. Located in the mid-latitude region of the east Eurasia coast, Liaoning province has a temperate continental monsoon climate with a synchronous variation of heat and moisture, abundant sunshine and high accumulated temperature. Liaoning province is one of the main planting areas of maize in China. The maize sown area was 2.417 million hectares in 2015, accounting for 57.27% of the total crop sown area in Liaoning province [33]. Rice is also an important crop and its sown area was 544.9 thousand hectares, accounting for 12.9% of the total crop sown area. Besides this, beans, peanuts and other crops are planted as well, but all of their areas are less than 7%. In the classification, crops with a small sown area (e.g., beans, peanuts, etc.) are merged to a single class (i.e., other crop types).

2.2. Materials

2.2.1. Time-Series Data

The 8-day composite moderate resolution imaging spectroradiometer (MODIS) land surface reflectance data product (MOD09Q1) with a 250-m spatial resolution was freely downloaded from the National Aeronautics and Space Administration (NASA) website (https://earthdata.nasa.gov/). It includes the red and near-infrared land surface reflectance band. Taking into account the scale and crop planting structure of the study area, the MOD09Q1 with a spatial resolution of 250 m and a temporal resolution of 8 days is a more suitable data source, since it is difficult to have a full time series of images with a high temporal visiting cycle (e.g., shorter than 10 days) to cover the whole growing season of maize. On the other hand, an image with a too-low spatial resolution will lead to a relatively serious spectral mixing problem.
Three tiles (i.e., h26v04, h27v04 and h27v05) were used to cover the whole study area. There are 46 images for each tile in one year. The images in 2015 were used for analysis. The three tiles, at the same time, were first mosaicked and re-projected to the Albers conical equal area projection using the MODIS re-projection tool (MRT). The red and near-infrared reflectance time series were then stacked, respectively, and they were used to compute the NDVI time series according to Formula (1).
NDVI = ( ρ n i r ρ r e d ) / ( ρ n i r + ρ r e d )
where ρ n i r and ρ r e d are the MODIS red and near-infrared land surface reflectance, respectively.

2.2.2. Other Ancillary Data

  • Eighty in-situ maize samples of 200 m × 200 m in 2015 from the Survey Office of the National Bureau of Statistics in Liaoning for the selection of samples. This data came from field surveys, and they were mainly used as the base to select maize samples.
  • Google Earth high-resolution images in 2015 for the replenishment of samples. Google Earth provides high-resolution images and user-submitted location-based pictures that can be used to select samples by visual interpretation based on the textures, colors and shapes of different land cover types.
  • Global land cover data (finer resolution observation and monitoring of global land cover, FROM-GLC) in 2010 from the Department of Earth System Science, Tsinghua University, for the selection of samples. FROM-GLC was only used as an ancillary reference for sample selection to help determine the type of a given land cover, since its overall classification accuracy is 64.9% and its phase is in 2010.
  • Crop calendar data of Liaoning province in 2015 from the Department of Planting Management, Ministry of Agriculture, China, for analyzing the phenological features of crops.
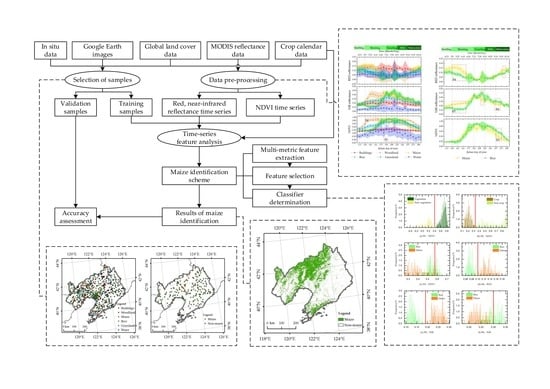
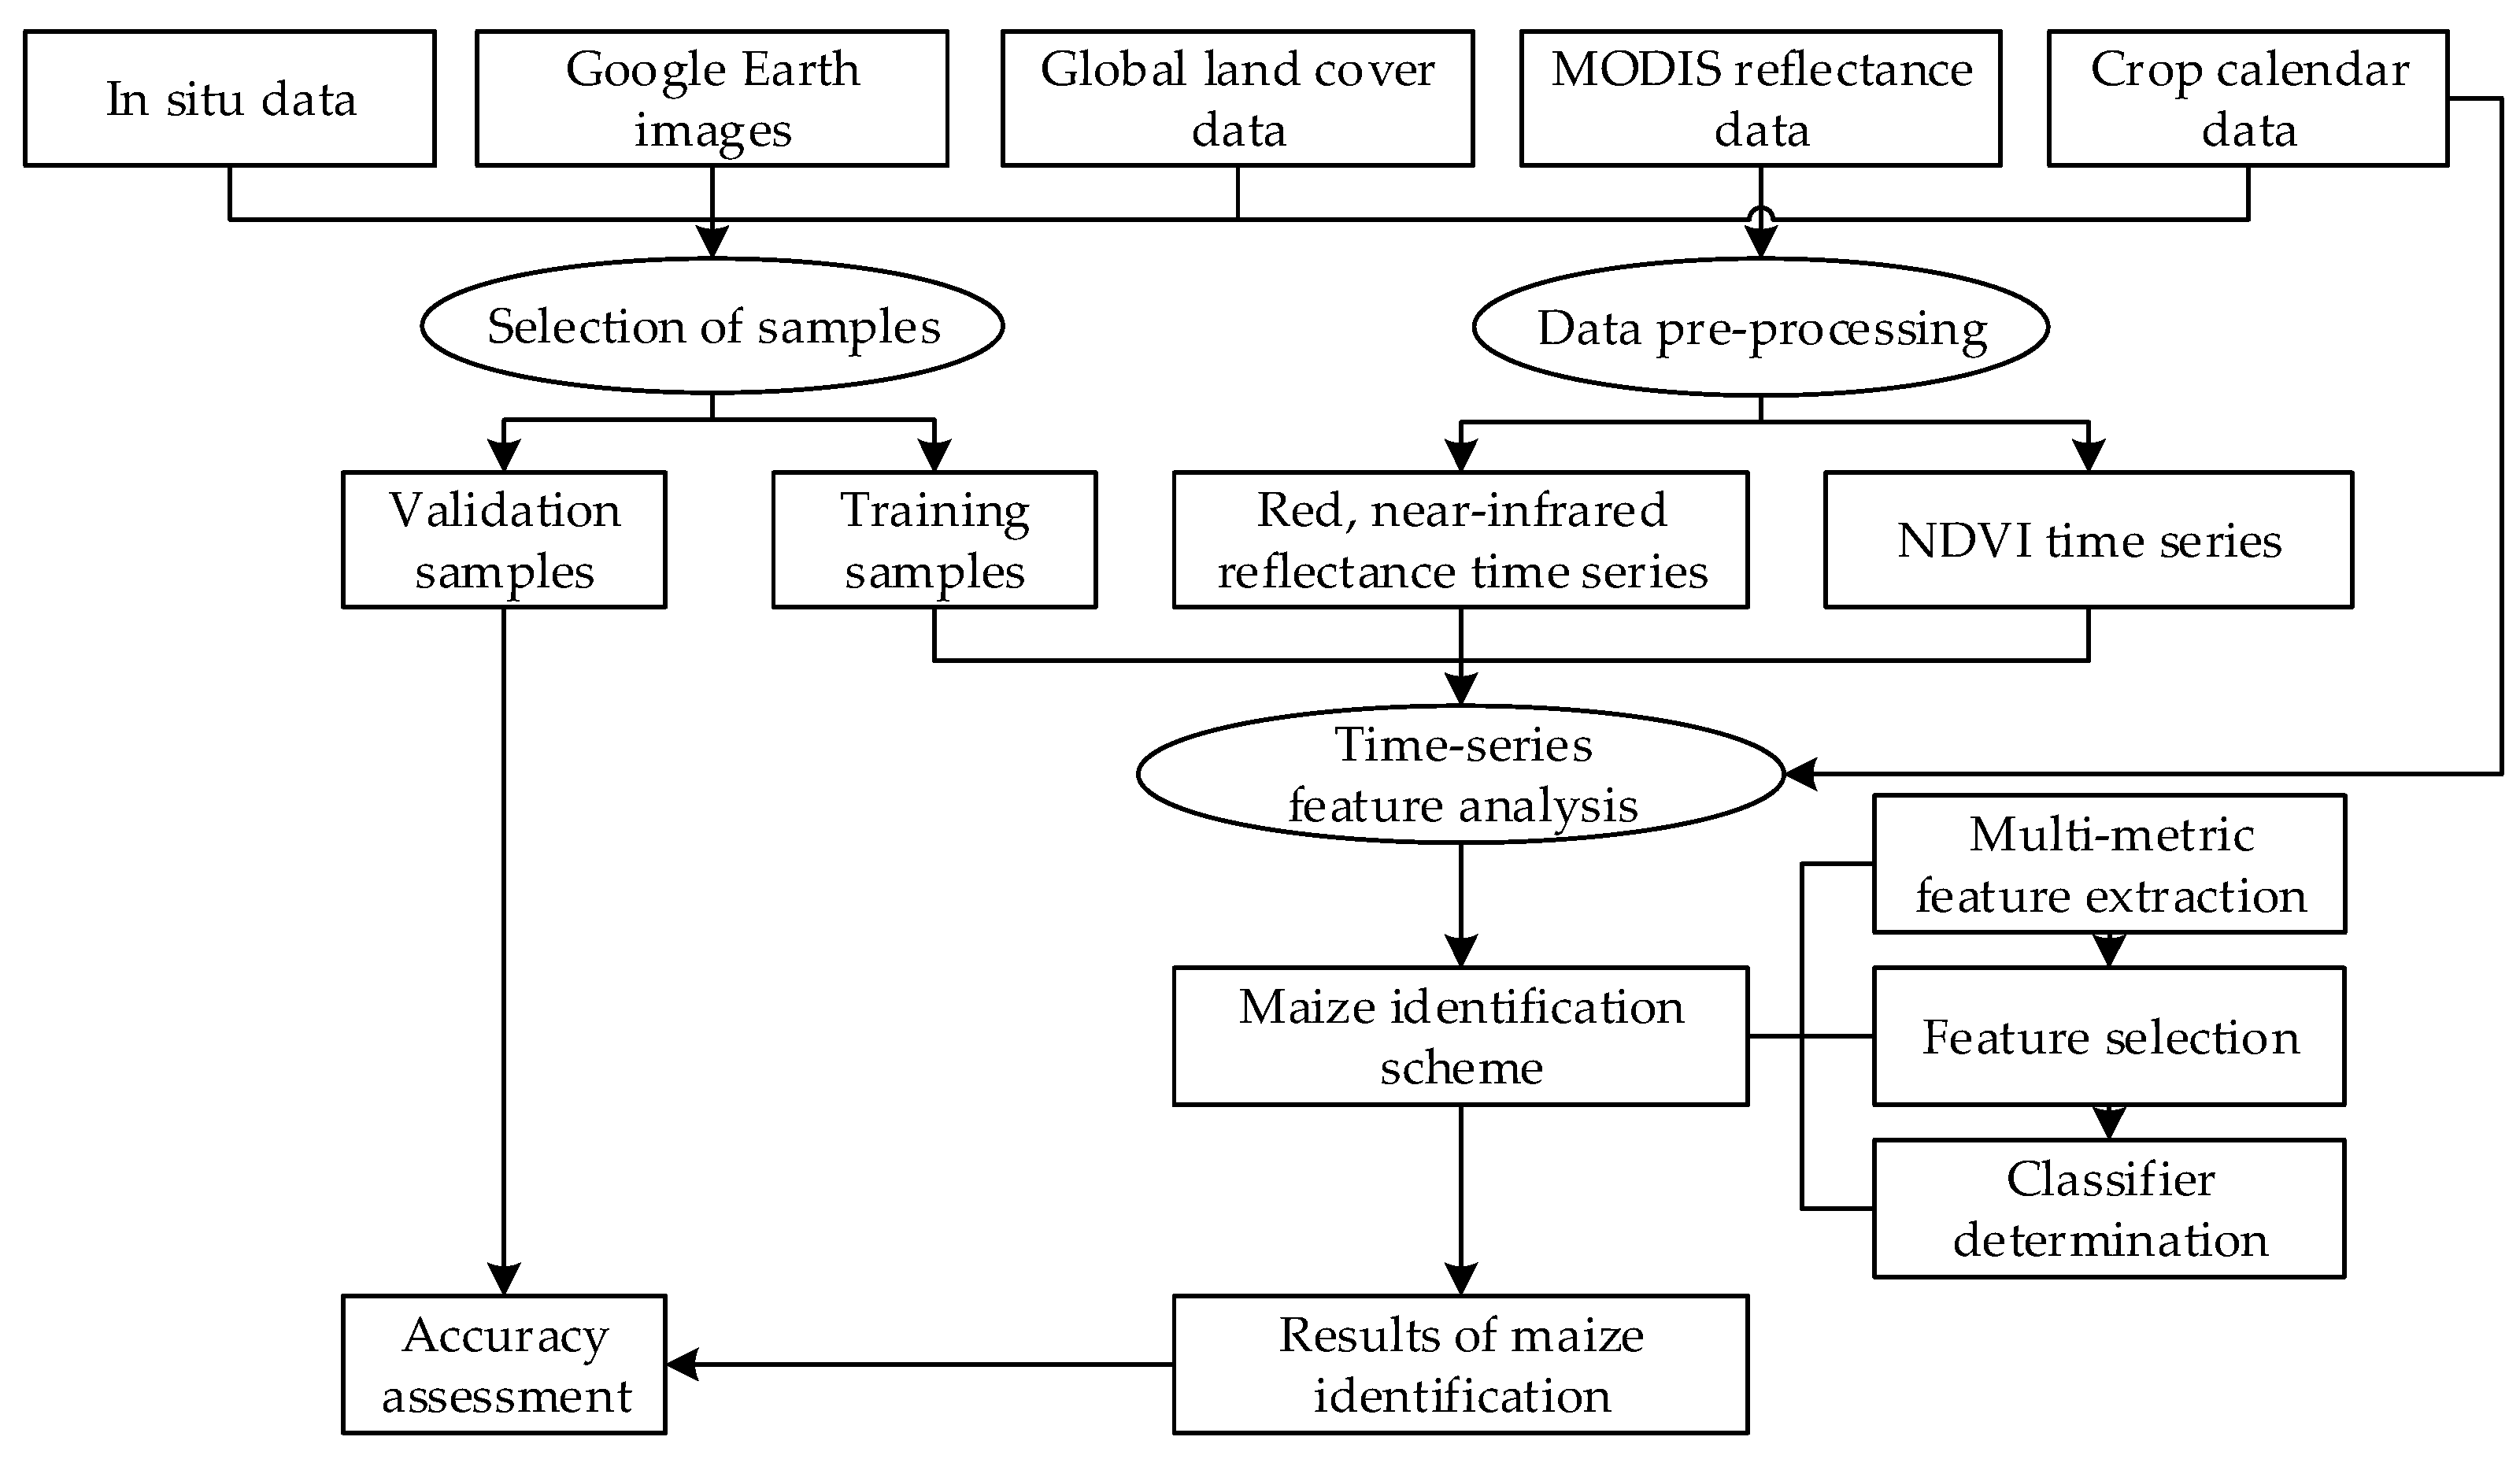
3. Methods

Maize was identified by analyzing the phenological features from multiple metrics (i.e., red reflectance, near-infrared reflectance and NDVI) (Figure 2). Training and validation samples were selected mainly based on the in-situ survey data, assisted with the Google Earth images in the same year, global land cover data and crop calendar data. Then, the red reflectance, near-infrared reflectance and NDVI time-series curves of training samples were extracted. The differences between maize and other land cover types for the three metrics at each phenophase were analyzed. Based on these differences, the first hypothesis was tested to evaluate whether multiple metrics contribute to maize identification much more than a single metric. To test the second hypothesis, different feature extraction and selection methods and their impacts on the maize identification accuracy were compared. As for the third hypothesis, the scheme of maize identification was constructed and tested. Finally, an identification method for spring maize based on spectral and phenological features was summarized.

3.1. Selection of Samples

3.1.1. Design of Classification System

According to the target crop (spring maize), the main land cover types in Liaoning and the separability among land cover types in the 250 m-resolution MODIS images, a classification system was designed, including maize, rice, woodland (including forest and shrub), grassland (including other types of crops, such as vegetables, soybean, etc.), buildings and water.

3.1.2. Selection of Samples

According to the classification system and the crop calendar, 900 training samples for six categories were selected by visually interpreting the Google Earth high-resolution images based on the in-situ survey data (Figure 3a, Table 1). The area for each sample was more than 500 m × 500 m. The Jeffries–Matusita separation degrees, which is one of the most common used distance measures to evaluate the separability of training samples [34], were all greater than 1.999 for the training samples among different land cover types. Since the range of the Jeffries–Matusita distance is between 0 and 2 and a value greater than 1.9 indicates a very good performance, these training samples satisfied the requirement of land cover classification.
230 validation samples were randomly scattered in the study area (Figure 3b, Table 1), and they were also visually interpreted from the Google Earth high-resolution images and FROM-GLC. These validation samples were divided into six types, just as in the case of the training samples. They were used to evaluate the accuracy of maize identification.

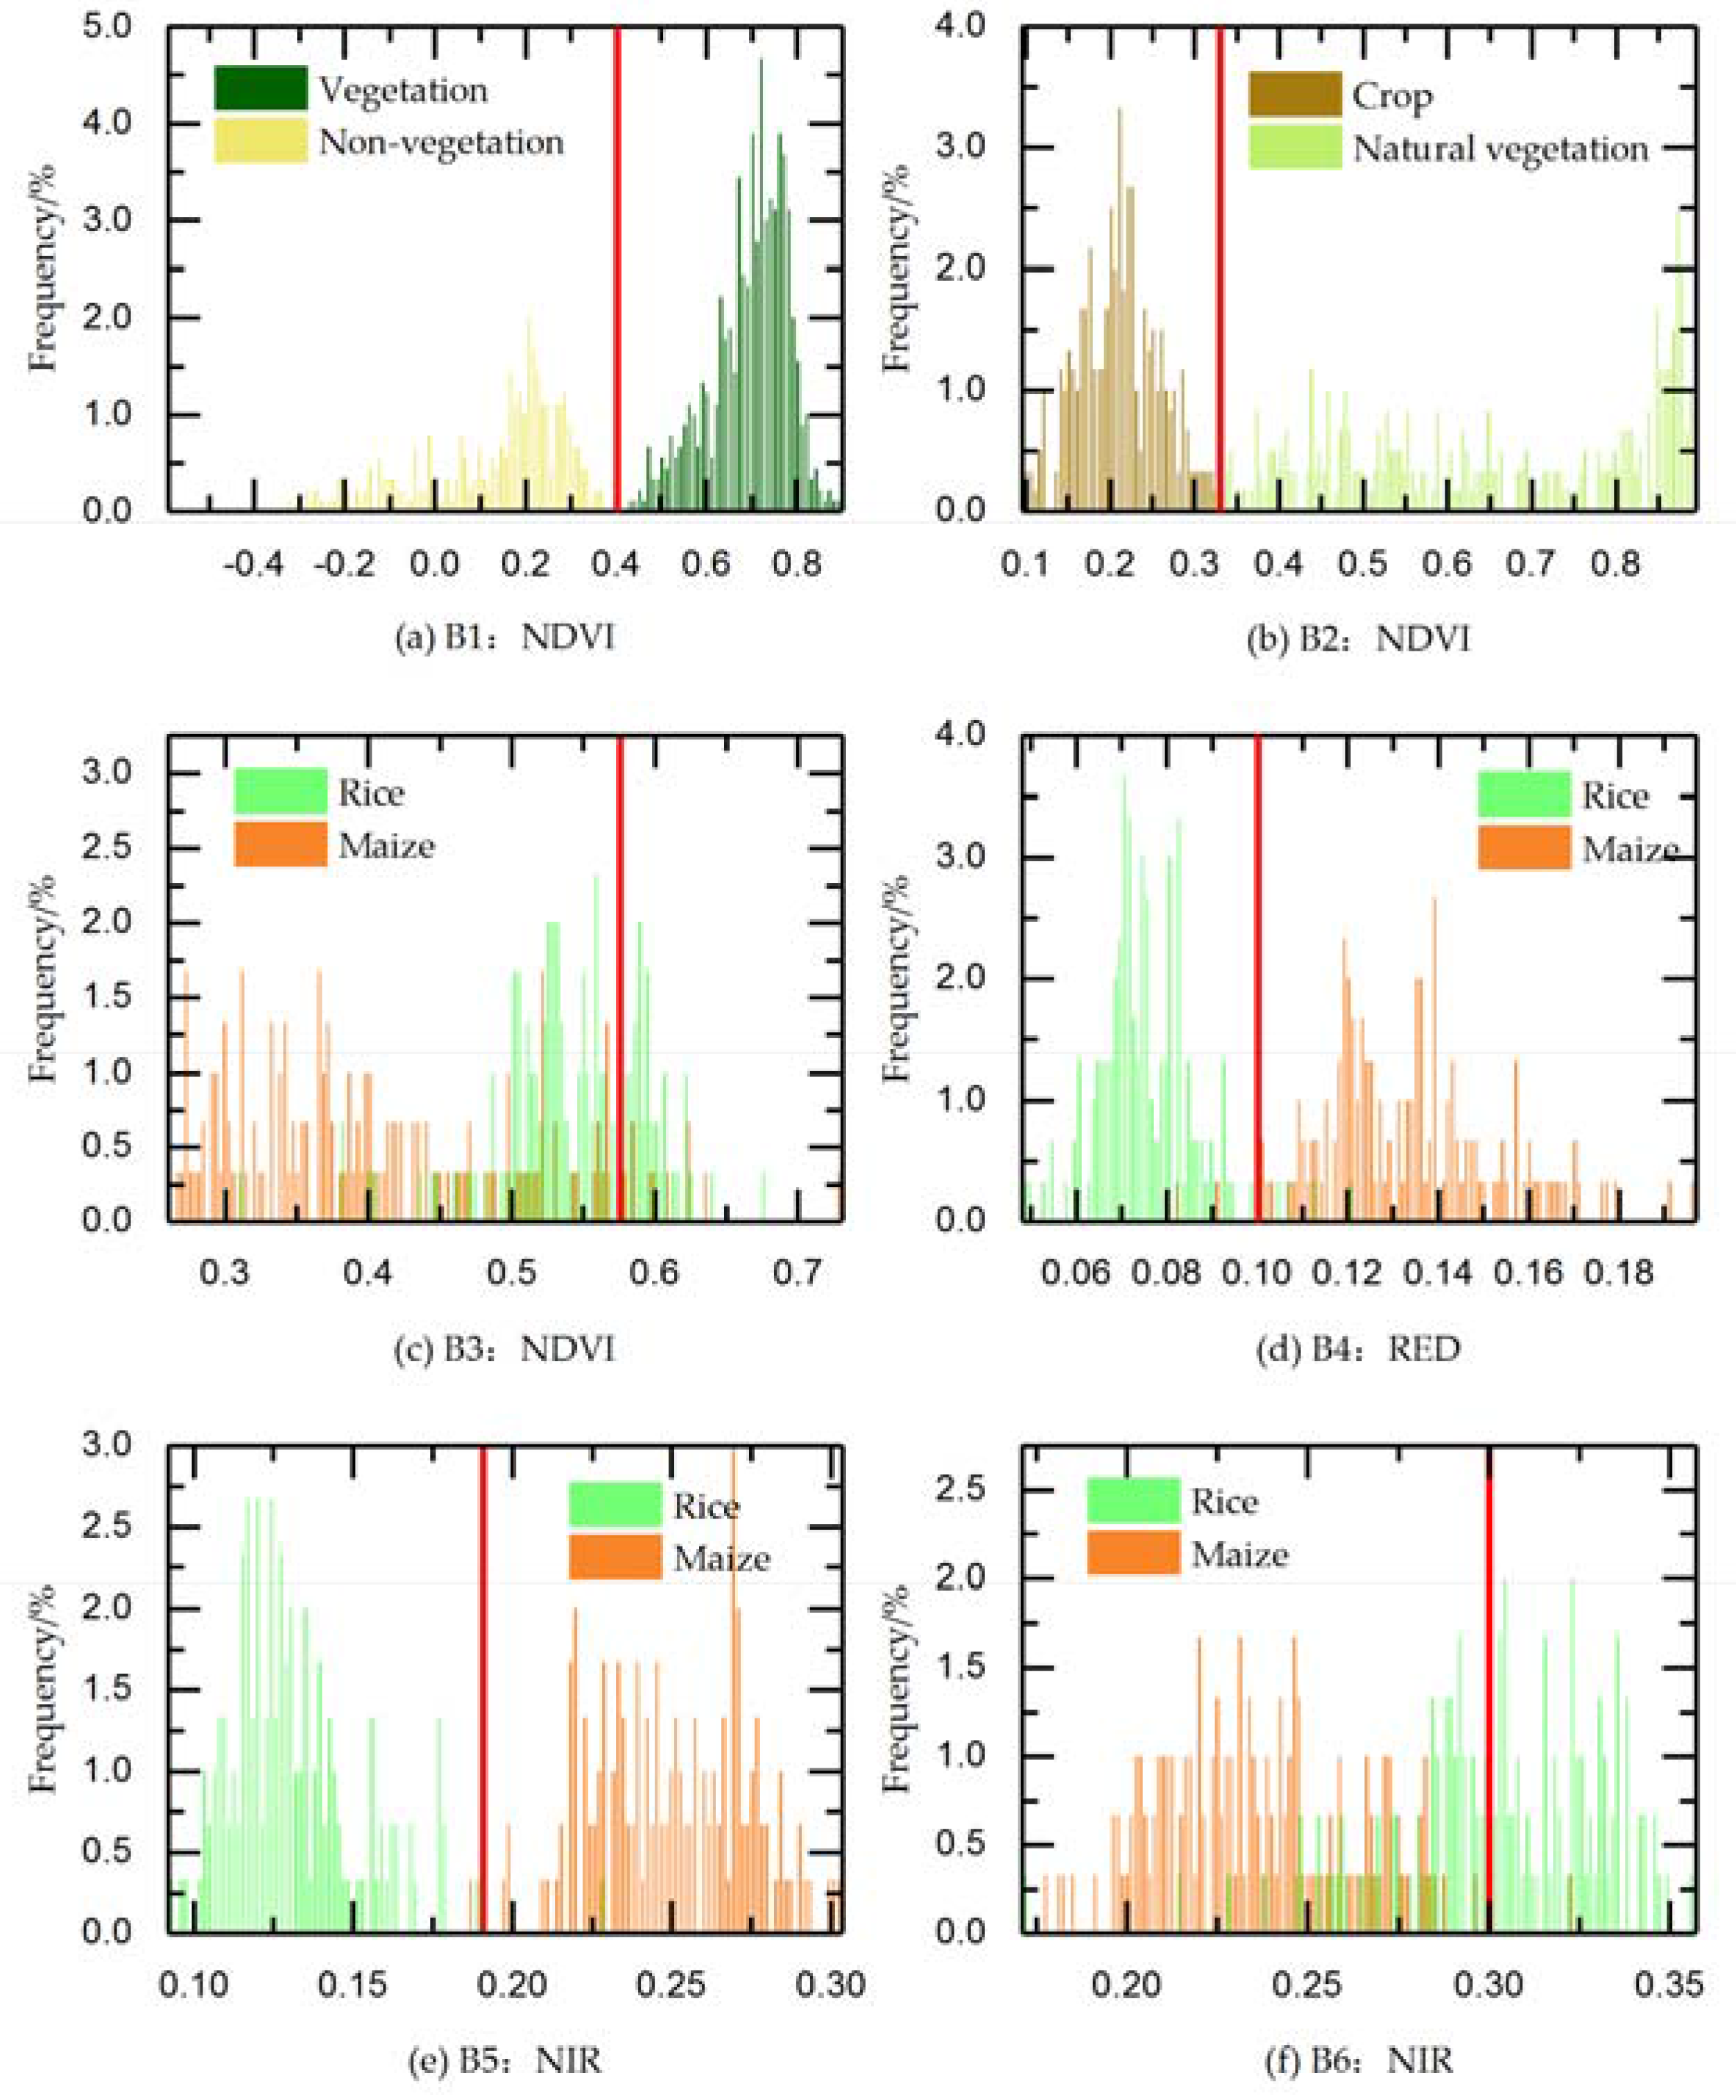
3.2. Analysis of Phenological Features for Different Land Cover Types

3.2.1. Characteristics of Different Land Cover Types in NDVI Time Series

Different land cover types showed different NDVI curve shapes (Figure 4), especially in the key phenophases of maize. The crop calendar and NDVI time-series curves showed that the growing season of maize is from late April (Julian day of year (DOY) 113) to mid-October (DOY 289) in Liaoning province. Before mid-April, maize has not been sown, and the farmland mainly shows bare soil information. Therefore, the NDVI values are all less than 0.2. From late April to mid-May at the seeding stage of maize, the NDVI values of maize show a slowly upward trend. From mid-May to early July at the shooting stage, the NDVI values of maize increase remarkably. From mid-July to mid-August, maize is at the tasseling stage and its NDVI values reach the peak. It is the rainy season in Liaoning province at this time, so the NDVI time series may be contaminated by cloud and rain. From the milk stage to maturation stage, the NDVI values of maize decrease gradually. In mid-October, maize is harvested, and the farmland returns to be bare soil.
Rice is sown in late April and harvested in mid-October in Liaoning province. Its growing season overlaps with maize. Therefore, the NDVI time-series curve of rice resembles that of maize (Figure 4). There is no obvious difference in NDVI between rice and maize during the seedling stage of rice from late April to early May. From mid-May to early June, there is a distinctive transplanting stage for rice. The paddy fields are irrigated at this time, and the NDVI values of paddy field decline slightly. At the same time, the NDVI values of maize continue to rise slowly since there is no transplanting stage for maize. From mid-June to early July, rice and maize are both in the shooting stage with a sharp rise in NDVI values. However, the NDVI values of rice increase much faster than maize. From mid-July to mid-August, rice and maize are both in the heading (tasseling) stage, and their NDVI values reach the peak. At this time, the NDVI values of rice are greater than 0.8, while those of maize are less than 0.8. After late August, the NDVI values of rice and maize decrease gradually. From mid-September to mid-October, rice gets into the maturation stage, and its NDVI values show a slow decline, while those of maize show a sharp decline. According to the NDVI time-series curves of the two crops, the differences between rice and maize are very small.
The NDVI values of water are negative in the non-growing season of vegetation. However, the growth of aquatic plants in July and August will lead to an increase in NDVI values with a peak of about 0.3. The NDVI values of the buildings are always low throughout the whole year. Woodland’s NDVI values begin to increase in early April and reach the peak in late May. At this time, the NDVI values of grassland and crops just begin to increase, but grass grows earlier than crops. Compared to other vegetation types (i.e., woodland, maize and rice), the peak NDVI values that grassland can reach are lower throughout the whole year, below 0.7.

3.2.2. Characteristics of Different Land Cover Types in the Red and Near-Infrared Reflectance Time Series

Although the NDVI time-series data have the advantage of compositive information in distinguishing land cover types, some of the original red and near-infrared reflectance information may be lost in the synthesizing process, resulting in a weak identification capacity for different crops that have a similar growth cycle. The phenological features of maize and rice in the NDVI time series have little differences within the range of mean ± 1 times of the standard error (Figure 5). However, there are large differences between maize and rice in the red and near-infrared reflectance time series (Figure 5b).
The NDVI values of non-vegetation types (i.e., buildings and water) are always low throughout the whole year (Figure 5a). The largest difference between non-vegetation and vegetation exists in the vigorous growing stage of vegetation (shown in the B1 window in Figure 5a). Therefore, the average NDVI values in the period from the tasseling to milk stage of maize (DOY 193–257) can be used to distinguish vegetation types from non-vegetation types. For vegetation types, natural vegetation types (i.e., woodland and grassland) and crops (i.e., maize and rice) have a large difference in the shooting stage of maize (shown in the B2 window in Figure 5a). In this period, woodland turns green first, then grassland and crops last. Woodland has reached its peak with a high NDVI value of about 0.8, grassland develops with a moderate NDVI value of about 0.6, and the two crops just start to elongate with a low NDVI value of about 0.2. Therefore, the average NDVI values in the shooting stage of maize (DOY 129–153) can be used to distinguish crops from natural vegetation types.
Maize and rice are both the major crops, with similar growth cycles and NDVI time-series curves, in Liaoning province. Except for the early stage of maturation for maize (DOY 265–273) (shown in the B3 window in Figure 5b), they cannot be distinguished in the NDVI time-series curves. However, large differences exist in the red and near-infrared reflectance time-series curves between maize and rice (shown in the B4, B5 and B6 window in Figure 5b). These periods with large differences correspond to the phenophases of maize in the early stage of shooting (DOY 129–169) and the early stage of maturation (DOY 257–265). These large differences will be used to distinguish between maize and rice. Though differences also exist in the middle stage of tasseling (DOY 217) in the near-infrared reflectance and in the middle stage of maturation (DOY 273) in the red reflectance, they are susceptible to noise because of the only one-phase image. Therefore, these differences are not used to distinguish between maize and rice.
In short, the key temporal features of NDVI can be used to distinguish vegetation from non-vegetation and crops from natural vegetation, while the key temporal features of red and near-infrared reflectance can be used to distinguish between maize and rice. Furthermore, the training samples were used to plot the frequency distribution of different land cover types in each period (Figure 6), whereby the discrimination thresholds of features can be visually determined according to the trough between the two different sample types (Figure 6a,b,d,e) or the statistics that nearly more than 98% of the maize samples (Figure 6c,f, Table 2).

3.3. Comparison of Different Features for Maize Identification

The single NDVI metric for maize identification was tested first, because NDVI synthesizes the red and near-infrared reflectance. Through the analysis in Section 3.2, phenological features of NDVI in the B1–B3 time window (Figure 5, Table 2) could be used to identify maize. A decision tree classification was adopted as the identification method, and the discriminant rules were as follows.
First, non-vegetation types (i.e., buildings and water) were excluded according to the higher NDVI values of vegetation types (i.e., woodland, grassland, maize and rice) during the phenophase of tasseling to milk of maize (DOY 193–257) with Formula (2):
B1: mean(NDVI193–257) > T1
Second, natural vegetation types (i.e., woodland and grassland) were excluded according to the lower NDVI values of crops (i.e., maize and rice) during the early stage of shooting of maize (DOY 129–153) with Formula (3):
B2: mean(NDVI129–153) < T2
Third, rice was excluded according to the lower NDVI values of maize in the early maturation stage of maize with Formula (4):
B3: mean(NDVI257–273) < T3
As a comparison of the single NDVI metric with the multiple metrics (i.e., NDVI, red and near-infrared reflectance), phenological features from the red and near-infrared reflectance were added to identify maize, and the decision tree classification method was used for maize identification as well.
When the red reflectance features were added, the first two steps utilized the same discriminant rules as the NDVI metric, but in the third step, the Formula (5) was added, that is, Formulas (4) and (5) should be satisfied simultaneously in the third step, which would be considered as maize.
B4: mean(RED129–169) > T4
When the near-infrared reflectance features were added, the first two steps utilized the same discriminant rules as the NDVI metric, but in the third step, the Formulas (5)–(7) were added; that is, the third step should satisfy all of the Formula (4)–(7) at the same time, which would be considered as maize.
B5: mean(NIR129–169) > T5
B6: mean(NIR257–265) < T6

3.4. Comparison of Different Feature Extraction and Selection Methods for Maize Identification

The extraction and selection of features from the time-series data can be achieved with either an unsupervised method (e.g., the PCA method based on statistics) or a supervised method (e.g., extracted phenological features based on prior knowledge). Tests were taken to verify which method is more optimal for maize identification. The multi-metric phenological features introduced in Section 3.3 were adopted as the ones from the supervised method. The first several components from the PCA method with their accumulated information greater than 95% were selected as the statistical features for each time series (i.e., NDVI, red and near-infrared reflectance) during the maize growing season. The maximum likelihood classification method was used to test and evaluate the two different feature datasets.

3.5. Comparison of Different Classifiers for Maize Identification

Based on the multi-metric phenological features (B1–B6 in Section 3.3), two classifiers were tested and compared. One is the maximum likelihood classifier, one of the most widely-used supervised classification methods, and the other is the decision tree classification based on expert knowledge. The decision tree was built with the criterions and thresholds in Table 2, and it is shown in Figure 7.

3.6. Statistical Significance Test Among Different Comparisons

The study area was divided into six sub-regions according to the terrain and crop planting structure (Figure 1). The identification accuracies (i.e., the overall, producer’s and user’s accuracy) obtained by different identification schemes in each sub-region were calculated. The paired-by-two t-test was conducted to determine whether there was a significant difference between the two compared identification schemes among the six sub-regions. If the p value is equal or less than 0.05, it indicates a significant difference between the two compared identification schemes.

4. Results

4.1. Identification Accuracy of Maize Based on Different Metrics

When the phenological features from the single NDVI metric were used to identify maize, the producer’s accuracy was 100%, but the user’s accuracy was 70% (Item (1) in Table 3). The greater producer’s accuracy than the user’s accuracy means that more other land cover types were falsely identified as maize, since the producer’s accuracy indicates the probability that a certain category on the ground is correctly classified by the cartographer, while the user’s accuracy indicates the probability that a category in a classification result is correctly classified [35].
After adding phenological features from the red reflectance, the producer’s accuracy of maize decreased by 1.43%, but the user’s accuracy increased by 6.67% (Item (2) in Table 3). After adding phenological features from the near-infrared reflectance, the producer’s accuracy of maize kept unchanged, while the user’s accuracy increased by 4.51% and reached to 81.18% (Item (3) in Table 3). These results indicated that some other land cover types falsely identified as maize with the single NDVI metric were further excluded when adding the phenological features from the red and near-infrared reflectance time series.

4.2. Identification Accuracy of Maize Based on Different Feature Datasets

With regard to the statistical features, the principal components from NDVI, red and near-infrared reflectance were extracted by the PCA method. It was found that their first principal component contained more than 98% of the information of the time series in the whole growing season. Thus, the first NDVI principal component, the first red reflectance principal component and the first near-infrared reflectance principal component were selected as the statistical features for maize identification. As for the supervised phenological features, B1–B6 introduced in Section 3.3 were selected.
The maximum likelihood classification was chosen for maize identification based on both the unsupervised statistical features and supervised phenological features. The same training samples were used to identify maize, while the same validation samples were used to evaluate their accuracies (Table 4). Results showed that the producer’s accuracy for maize based on the supervised phenological features was 14.29% higher, and the user’s accuracy was 11.26% higher than that of the statistical features. There was a significant difference in the maize identification accuracies between the two feature datasets according to the six sub-regions.

4.3. Identification Accuracy of Maize Based on Different Classifiers

Based on the same phenological features (B1–B6 introduced in Section 3.3), the identification accuracies of maize were compared between the decision tree classification and the maximum likelihood classification. Results showed that the maize producer’s and user’s accuracy from the decision tree classifier was 7.14% and 4.07% higher than that of the maximum likelihood classifier, respectively (Item (3) in Table 3 vs. Item (1) in Table 4), which indicated that the decision tree classifier was more suitable for maize identification based on phenological features from multiple metrics.
Figure 8 shows the spatial distribution of maize identified with the decision tree classifier based on the multi-metric phenological features. Maize was mainly distributed in the central plain area of Liaoning province. A small amount of maize was distributed in the western hills. In the south-central region near the north of the Bohai Bay, there was little amount of maize distributed, because the sufficient water and heat resources in this region is more suitable for planting rice than maize.

5. Discussion

5.1. Advantages of Phenological Features from Multiple Metrics in Identifying Maize

The identification accuracy of maize can be improved substantially when using multiple metrics comparing with any single metric from NDVI, red or near-infrared reflectance. We found that more other land cover types were falsely identified as maize when the phenological features from the single NDVI metric were used to identify maize. However, these land cover types falsely identified as maize can be further excluded when adding the phenological features from the red and near-infrared reflectance time series. Multiple metrics may provide complementary information to improve crop identification accuracy. For example, Brian et al. [11] investigated the general applicability of the time-series MODIS enhanced vegetation index (EVI) and NDVI datasets for crop-related classification in the U.S. Central Great Plains. Both the MODIS EVI and NDVI depicted similar seasonal variations and were highly correlated among all crops. However, a few subtle but consistent differences between the two VIs existed distinctly during the senescence. Xiao et al. [18] developed a paddy rice mapping algorithm through using multi-metric features, including the time series of three indices (i.e., land surface water index (LSWI), EVI and NDVI) derived from MODIS images, and reported a high accuracy in mapping paddy rice fields in 13 provinces of southern China.

5.2. The Importance of Feature Extraction and Selection in Identifying Maize

Our results demonstrated the importance of feature extraction and selection in identifying maize. The maize identification accuracies were significantly higher for the supervised phenological feature datasets than those for the statistical feature datasets derived from the PCA method. As for the time-series data, typical phenological features of the land cover types in some particular periods are usually selected as the classification features. For example, Jia et al. [36] reported that phenological features such as the beginning and ending dates of the growing season, the length of the growing season, the seasonal amplitude and the maximum fitted NDVI value had a statistically significant effect on improving the land cover classification accuracy, particularly for vegetation type discrimination. Methods based on the unsupervised feature extraction and selection from statistical information are usually used in classifying land cover types [37,38]. The PCA method is generally used to extract features, and many machine learning methods based on statistics, such as the random forest [39], can be used in feature identification with considerable performance. Therefore, the PCA method can be combined with these machine learning methods to extract and select features simultaneously.

5.3. Determination of the Matched Classifier Based on the Supervised Phenological Features in Identifying Maize

The maize identification accuracies (i.e., the overall, producer’s and user’s accuracy) from the decision tree classifier were all higher than those from the maximum likelihood classifier, which indicated that the decision tree classifier based on expert knowledge was more matched for multiple metrics phenological features based on prior knowledge extraction and selection to identify maize. The determination of the optimal classifier depends on the data source in some way. Compared with the maximum likelihood method, the decision tree classifier, which is independent of the distribution of feature variables of training samples, is more suitable for the time-series data. Belward et al. [40] compared the maximum likelihood classification and decision tree classification for crop cover estimation with multi-temporal Landsat multiple spectral scanner (MSS) data, and suggested that the decision tree may be a viable alternative to the maximum likelihood for the analysis of datasets with a high dimensionality such as the multi-temporal data.
The determination of the optimal classifier depends on the classification features as well. Phenological features extracted from the supervised method have a clear physical meaning and involve some prior knowledge, which is more matched with the decision tree classifier based on the expert knowledge. For example, Friedl et al. [41] concluded that the decision tree algorithms consistently outperformed the maximum likelihood in regard to classification accuracy. Massey et al. [42] used a decision tree approach based on phenology to hierarchically classify crop types over large areas for long-term cropland monitoring successfully.

5.4. The Optimal Identification Method of Maize Based on Remote Sensing Time-Series Data and Further Improvements

Based on the analysis of the differences of phenological features from multiple metrics among land cover types, this study tested the selections and combinations of classification metrics, features and classifiers. The results showed that the construction of discriminant rules from multi-metric phenological features and the adoption of the decision tree classifier can maximize the maize identification accuracy in the study area.
Potential improvements can be further considered for the proposed identification method of maize. In view of the scale and crop planting structure of the study area, only the MOD09Q1 250-meter time-series red and near-infrared reflectance data were used in this study. Other remote sensing data, such as Sentinel-2A with a 10-meter spatial resolution and more red edge bands, may be more suitable for crop identification [43]. In addition, multi-source data can also be used to improve crop identification accuracy. For example, synthetic aperture radar (SAR) data can be used to extract or exclude rice at its transplanting stage [44]. We only tested NDVI in this study. However, previous studies have shown that the enhanced vegetation index (EVI) can reduce the impact of soil background reflectance and partly overcome the saturation of high density vegetation [45]. Therefore, the time-series EVI may perform better than NDVI in identifying crop types. As for feature extraction and selection, we only compared the supervised phenological features with the statistical features derived from the PCA method. Other unsupervised feature extraction and selection methods, such as random forest [39], can be also considered. Since the supervised and unsupervised feature extraction and selection methods have their own strengths, and they may be combined to improve the crop identification performance. There were six thresholds involved in the identification of maize in this proposed method. Each threshold may have an effect on the maize identification accuracy. Moreover, the optimal combination of these thresholds may also affect the accuracy. Therefore, it will be very helpful to develop a method and corresponding computer programs to search these optimal thresholds automatically. Though the decision tree classifier achieved higher accuracy than the maximum likelihood classifier in this study, support vector machine (SVM) [14], random forest [46] and other machine learning classifiers [47,48] can be also tested to get an optimal combination of the main classification processes in identifying maize.
It should be noted that this method was only tested in Liaoning province, indicating that it can be successfully applied to Northeast China to identify spring maize. In particular, it has advantages in distinguishing spring maize from rice. For other regions, the phenological features may be adjusted according to different planting structures. For example, there is no need to consider the transplanting period for the planting structure of winter wheat and summer maize in Shandong province because of the absence of rice. For other regions with a different climate and planting structures of crops, planting division of maize should be first carried out according to the topography and geomorphology (e.g., plains, hills and mountains), planting structure and sown area of maize. Then, for each region, the differences of phenological features from multiple metrics among land cover types could be analyzed, and an optimal identification method for maize could be summarized through the selection and combination of suitable metrics, features and classifiers.

6. Conclusions

Taking Liaoning province, a representative planting region of spring maize in Northeast China, as an example, the differences in multiple metrics (i.e., NDVI, red and near-infrared reflectance time series from MODIS in 2015) among different land cover types in the key phenophases of maize were analyzed. Through testing the selections and combinations of classification metrics, features and classifiers, a new identification method for spring maize based on spectral and phenological features was proposed. The main conclusions are as follows.
Although NDVI integrates the red and near-infrared reflectance, the phenological features in the NDVI time series between maize and rice had little differences in Liaoning province. However, large differences between maize and rice existed in the red and near-infrared reflectance time series.
The identification accuracy of maize can be improved substantially when using multiple metrics comparing with any single metric from NDVI, red or near-infrared reflectance. Moreover, the phenological feature datasets are very important to the improvement of the maize identification accuracy, as demonstrated in this study that the supervised selection based on prior knowledge were superior to the statistical feature datasets from the unsupervised selection based on the PCA method for the identification of maize. Furthermore, compared with the maximum likelihood classifier, the decision tree classification method based on expert knowledge was more matched for the identification of maize with phenological features.
The construction of discriminant rules from multi-metric phenological features and the adoption of the decision tree classifier can maximize the maize identification accuracy. This method can be successfully applied to Northeast China to identify spring maize. In particular, it has advantages in distinguishing spring maize from rice. As for other planting regions of maize, planting division of maize is suggested to be carried out first, and then the key phenological phases and corresponding discrimination thresholds should be adjusted according to the regional characteristics to achieve an optimal identification accuracy of maize. This method provides a way to extract crops over a large scale, which can be further localized to other crops such as rice and wheat in other regions. That is, extracting multi-metric phenological features from time-series data at first, then confirming the key phenophases and their thresholds, and finally constructing the discriminant rules to extract the target crop.

Acknowledgments

This work was supported by National Basic Research Program of China (Grant No. 2015CB953603) and National Natural Science Foundation of China (Grant No. 41371389, 41771047).

Author Contributions

Ke Tang and Wenquan Zhu conceived and designed the experiments. Ke Tang performed the experiments. Ke Tang and Wenquan Zhu analyzed the data and wrote the paper. Pei Zhan and Siyang Ding contributed valuable ideas and considerations.

Conflicts of Interest

The authors declare no conflict of interest.

References

  1. Food and Agriculture Organization (FAO). Fao Statistical Pocketbook 2015; FAO: Rome, Italy, 2015; p. 28. [Google Scholar]
  2. Thenkabail, P.S.; Hanjra, M.A.; Dheeravath, V.; Gumma, M. A holistic view of global croplands and their water use for ensuring global food security in the 21st century through advanced remote sensing and non-remote sensing approaches. Remote Sens. 2010, 2, 211–261. [Google Scholar] [CrossRef] [Green Version]
  3. He, Q.; Zhou, G. The climatic suitability for maize cultivation in China. Chin. Sci. Bull. 2012, 57, 395–403. [Google Scholar] [CrossRef]
  4. Fritz, S.; See, L.; McCallum, I.; You, L.; Bun, A.; Moltchanova, E.; Duerauer, M.; Albrecht, F.; Schill, C.; Perger, C. Mapping global cropland and field size. Glob. Chang. Biol. 2015, 21, 1980–1992. [Google Scholar] [CrossRef] [PubMed] [Green Version]
  5. Thenkabail, P.S.; Biradar, C.M.; Noojipady, P.; Dheeravath, V.; Li, Y.; Velpuri, M.; Gumma, M.; Gangalakunta, O.R.P.; Turral, H.; Cai, X.; et al. Global Irrigated Area Map (GIAM), derived from remote sensing, for the end of the last millennium. Int. J. Remote Sens. 2009, 30, 3679–3733. [Google Scholar] [CrossRef]
  6. Atzberger, C. Advances in remote sensing of agriculture: Context description, existing operational monitoring systems and major information needs. Remote Sens. 2013, 5, 949–981. [Google Scholar] [CrossRef]
  7. Frolking, S.; Qiu, J.; Boles, S.; Xiao, X.; Liu, J.; Zhuang, Y.; Li, C.; Qin, X. Combining remote sensing and ground census data to develop new maps of the distribution of rice agriculture in China. Glob. Biogeochem. Cycles 2002, 16, 38-1–38-10. [Google Scholar] [CrossRef]
  8. Chang, J.; Hansen, M.C.; Pittman, K.; Carroll, M.; DiMiceli, C. Corn and soybean mapping in the United States using MODIS time-series data sets. Agron. J. 2007, 99, 1654–1664. [Google Scholar] [CrossRef]
  9. Pan, Y.; Li, L.; Zhang, J.; Liang, S.; Zhu, X.; Sulla-Menashe, D. Winter wheat area estimation from MODIS-EVI time series data using the crop proportion phenology index. Remote Sens. Environ. 2012, 119, 232–242. [Google Scholar] [CrossRef]
  10. Huete, A.; Didan, K.; Miura, T.; Rodriguez, E.P.; Gao, X.; Ferreira, L.G. Overview of the radiometric and biophysical performance of the MODIS vegetation indices. Remote Sens. Environ. 2002, 83, 195–213. [Google Scholar] [CrossRef]
  11. Wardlow, B.; Egbert, S.; Kastens, J. Analysis of time-series MODIS 250 m vegetation index data for crop classification in the U.S. Central Great Plains. Remote Sens. Environ. 2007, 108, 290–310. [Google Scholar] [CrossRef]
  12. Wardlow, B.D.; Egbert, S.L. Large-area crop mapping using time-series MODIS 250 m NDVI data: An assessment for the U.S. Central Great Plains. Remote Sens. Environ. 2008, 112, 1096–1116. [Google Scholar] [CrossRef]
  13. Zhang, X.; Sun, R.; Zhang, B.; Tong, Q. Land cover classification of the North China Plain using MODIS_EVI time series. ISPRS J. Photogramm. Remote Sens. 2008, 63, 476–484. [Google Scholar] [CrossRef]
  14. Zheng, B.; Myint, S.W.; Thenkabail, P.S.; Aggarwal, R.M. A support vector machine to identify irrigated crop types using time-series Landsat NDVI data. Int. J. Appl. Earth Obs. Geoinf. 2015, 34, 103–112. [Google Scholar] [CrossRef]
  15. Mingwei, Z.; Qingbo, Z.; Zhongxin, C.; Jia, L.; Yong, Z.; Chongfa, C. Crop discrimination in Northern China with double cropping systems using fourier analysis of time-series MODIS data. Int. J. Appl. Earth Obs. Geoinf. 2008, 10, 476–485. [Google Scholar] [CrossRef]
  16. Lunetta, R.S.; Shao, Y.; Ediriwickrema, J.; Lyon, J.G. Monitoring agricultural cropping patterns across the Laurentian Great Lakes Basin using MODIS-NDVI data. Int. J. Appl. Earth Obs. Geoinf. 2010, 12, 81–88. [Google Scholar] [CrossRef]
  17. De la Casa, A.C.; Ovando, G.G.; Ravelo, A.C.; Abril, E.G.; Bergamaschi, H. Estimating maize ground cover using spectral data from AQUA-MODIS in Córdoba, Argentina. Int. J. Remote Sens. 2014, 35, 1295–1308. [Google Scholar] [CrossRef]
  18. Xiao, X.; Boles, S.; Liu, J.; Zhuang, D.; Frolking, S.; Li, C.; Salas, W.; Moore, B. Mapping paddy rice agriculture in Southern China using multi-temporal MODIS images. Remote Sens. Environ. 2005, 95, 480–492. [Google Scholar] [CrossRef]
  19. Zhong, L.; Hu, L.; Yu, L.; Gong, P.; Biging, G.S. Automated mapping of soybean and corn using phenology. ISPRS J. Photogramm. Remote Sens. 2016, 119, 151–164. [Google Scholar] [CrossRef]
  20. Lobell, D.B.; Asner, G.P. Cropland distributions from temporal unmixing of MODIS data. Remote Sens. Environ. 2004, 93, 412–422. [Google Scholar] [CrossRef]
  21. Jiang, L.; Shang, S.; Yang, Y.; Guan, H. Mapping interannual variability of maize cover in a large irrigation district using a vegetation index—Phenological index classifier. Comput. Electron. Agric. 2016, 123, 351–361. [Google Scholar] [CrossRef]
  22. Chen, Y.; Song, X.; Wang, S.; Huang, J.; Mansaray, L.R. Impacts of spatial heterogeneity on crop area mapping in Canada using MODIS data. ISPRS J. Photogramm. Remote Sens. 2016, 119, 451–461. [Google Scholar] [CrossRef]
  23. Velpuri, N.M.; Thenkabail, P.S.; Gumma, M.K.; Biradar, C.; Dheeravath, V.; Noojipady, P.; Yuanjie, L. Influence of resolution in irrigated area mapping and area estimation. Photogramm. Eng. Remote Sens. 2009, 75, 1383–1395. [Google Scholar] [CrossRef]
  24. Dalponte, M.; Bruzzone, L.; Gianelle, D. Tree species classification in the Southern Alps based on the fusion of very high geometrical resolution multispectral/hyperspectral images and LIDAR data. Remote Sens. Environ. 2012, 123, 258–270. [Google Scholar] [CrossRef]
  25. Zhang, J.; Wei, F.; Sun, P.; Pan, Y.; Yuan, Z.; Yun, Y. A stratified temporal spectral mixture analysis model for mapping cropland distribution through MODIS time-series data. J. Agric. Sci. 2015, 7. [Google Scholar] [CrossRef]
  26. Xie, D.; Zhang, J.; Zhu, X.; Pan, Y.; Liu, H.; Yuan, Z.; Yun, Y. An improved STARFM with help of an unmixing-based method to generate high spatial and temporal resolution remote sensing data in complex heterogeneous regions. Sensors 2016, 16, 207. [Google Scholar] [CrossRef] [PubMed]
  27. Carrão, H.; Gonçalves, P.; Caetano, M. Contribution of multispectral and multitemporal information from MODIS images to land cover classification. Remote Sens. Environ. 2008, 112, 986–997. [Google Scholar] [CrossRef]
  28. Wold, S.; Esbensen, K.; Geladi, P. Principal component analysis. Chemometr. Intell. Lab. 1987, 2, 37–52. [Google Scholar] [CrossRef]
  29. Cheriyadat, A.; Bruce, L.M. Why principal component analysis is not an appropriate feature extraction method for hyperspectral data. In Proceedings of the 2003 IEEE International Geoscience and Remote Sensing Symposium, Toulouse, France, 21–25 July 2003; Volume 3426, pp. 3420–3422. [Google Scholar]
  30. Genuer, R.; Poggi, J.-M.; Tuleau-Malot, C. Variable selection using random forests. Pattern Recogn. Lett. 2010, 31, 2225–2236. [Google Scholar] [CrossRef]
  31. Yang, J.; Honavar, V. Feature subset selection using a Genetic Algorithm. IEEE Intell. Syst. App. 1998, 13, 44–49. [Google Scholar] [CrossRef]
  32. Wang, X.; Yang, J.; Teng, X.; Xia, W.; Jensen, R. Feature selection based on rough sets and Particle Swarm Optimization. Pattern Recognit. Lett. 2007, 28, 459–471. [Google Scholar] [CrossRef] [Green Version]
  33. National Bureau of Statistics of China. China Statistical Yearbook, 1st ed.; China Statistics Press: Beijing, China, 2016.
  34. Bruzzone, L.; Roli, F.; Serpico, S.B. An extension of the Jeffreys-Matusita distance to multiclass cases for feature selection. IEEE Trans. Geosci. Remote Sens. 1995, 33, 1318–1321. [Google Scholar] [CrossRef]
  35. Story, M. Accuracy assessment: A user’s perspective. Photogramm. Eng. Remote Sens. 1986, 52, 397–399. [Google Scholar]
  36. Jia, K.; Liang, S.; Wei, X.; Yao, Y.; Su, Y.; Jiang, B.; Wang, X. Land cover classification of Landsat data with phenological features extracted from time series MODIS NDVI data. Remote Sens. 2014, 6, 11518–11532. [Google Scholar] [CrossRef]
  37. Gong, P.; Marceau, D.J.; Howarth, P.J. A comparison of spatial feature extraction algorithms for land-use classification with SPOT HRV data. Remote Sens. Environ. 1992, 40, 137–151. [Google Scholar] [CrossRef]
  38. Comber, A.J.; Harris, P.; Tsutsumida, N. Improving land cover classification using input variables derived from a geographically weighted principal components analysis. ISPRS J. Photogramm. Remote Sens. 2016, 119, 347–360. [Google Scholar] [CrossRef]
  39. Hao, P.; Zhan, Y.; Wang, L.; Niu, Z.; Shakir, M. Feature selection of time series MODIS data for early crop classification using Random Forest: A case study in Kansas, USA. Remote Sens. 2015, 7, 5347–5369. [Google Scholar] [CrossRef]
  40. Belward, A.S.; de Hoyos, A. A comparison of supervised maximum likelihood and decision tree classification for crop cover estimation from multitemporal LANDSAT MSS data. Int. J. Remote Sens. 1987, 8, 229–235. [Google Scholar] [CrossRef]
  41. Friedl, M.A.; Brodley, C.E. Decision tree classification of land cover from remotely sensed data. Remote Sens. Environ. 1997, 61, 399–409. [Google Scholar] [CrossRef]
  42. Massey, R.; Sankey, T.T.; Congalton, R.G.; Yadav, K.; Thenkabail, P.S.; Ozdogan, M.; Sánchez Meador, A.J. MODIS phenology-derived, multi-year distribution of conterminous U.S. crop types. Remote Sens. Environ. 2017, 198, 490–503. [Google Scholar] [CrossRef]
  43. Immitzer, M.; Vuolo, F.; Atzberger, C. First experience with Sentinel-2 data for crop and tree species classifications in Central Europe. Remote Sens. 2016, 8, 166. [Google Scholar] [CrossRef]
  44. Tso, B.; Mather, P.M. Crop discrimination using multi-temporal SAR imagery. Int. J. Remote Sens. 1999, 20, 2443–2460. [Google Scholar] [CrossRef]
  45. Wardlow, B.D.; Egbert, S.L. A comparison of MODIS 250-m EVI and NDVI data for crop mapping: A case study for Southwest Kansas. Int. J. Remote Sens. 2010, 31, 805–830. [Google Scholar] [CrossRef]
  46. Sonobe, R.; Tani, H.; Wang, X.; Kobayashi, N.; Shimamura, H. Random Forest classification of crop type using multi-temporal TerraSAR-X dual-polarimetric data. Remote Sens. Lett. 2014, 5, 157–164. [Google Scholar] [CrossRef]
  47. Ornella, L.; Tapia, E. Supervised machine learning and heterotic classification of maize (Zea mays l.) using molecular marker data. Comput. Electron. Agric. 2010, 74, 250–257. [Google Scholar] [CrossRef]
  48. Sonobe, R.; Tani, H.; Wang, X. An experimental comparison between KELM and CART for crop classification using Landsat-8 OLI data. Geocarto Int. 2017, 32, 128–138. [Google Scholar] [CrossRef]
Figure 1. The location and terrain of the study area.
Remotesensing 10 00193 g001
Figure 2. Flowchart of maize identification.
Remotesensing 10 00193 g002
Figure 3. Distribution of samples. (a) Training samples; and, (b) Validation samples.
Remotesensing 10 00193 g003
Figure 4. Averaged normalized difference vegetation index (NDVI) time-series curves for different land cover types based on training samples during 2015.
Remotesensing 10 00193 g004
Figure 5. Averaged NDVI, red reflectance and near-infrared reflectance time-series curves for different land cover types (a) and major crops (b). The shadows represent the range of mean ± 1 times of the standard error.
Remotesensing 10 00193 g005
Figure 6. Frequency distribution of the training samples for different land cover types. B1–B6 correspond to the time windows in Figure 5. Red thick vertical lines show the locations of discrimination thresholds in Table 2.
Remotesensing 10 00193 g006
Figure 7. The decision tree for maize identification.
Remotesensing 10 00193 g007
Figure 8. The spatial distribution of maize identified with the decision tree classifier from multi-metric phenological features.
Remotesensing 10 00193 g008
Table 1. The number of samples.
Type of SampleMaizeRiceWoodland 1Grassland 2BuildingsWaterTotal
Training samples150150150150150150900
Validation samples702076451410230
1 Woodland includes forest and shrub. 2 Grassland includes other types of crops, such as vegetables, soybean, etc.
Table 2. The visually-determined discrimination thresholds for each metric in different periods.
MetricPeriod *DOYPhenophaseCriterionThreshold
NDVIB1193–257Tasseling to milk stageVegetation types with a higher value are distinguished from non-vegetation type with a lower valueT1: 0.40
NDVIB2129–153Early stage of tillering and shootingCrops with a lower value are distiguished from natural vegetation with a higher valueT2: 0.33
NDVIB3257–273Early stage of maturationMaize with a lower value is distinguished from rice with a higher valueT3: 0.57
Red reflectanceB4129–169Early stage of tillering and shootingMaize with a higher value is distinguished from rice with a lower valueT4: 0.10
Near-infrared reflectanceB5129–169Early stage of tillering and shootingMaize with a higher value is distinguished from rice with a lower valueT5: 0.18
Near-infrared reflectanceB6257–265Early stage of maturationMaize with a lower value is distinguished from rice with a higher valueT6: 0.30
* B1–B6 correspond to the time windows in Figure 5.
Table 3. Identification accuracy of maize based on different metrics.
ItemFeatures *TypeProducer’s Accuracy/%Omission/%User’s Accuracy/%Commission/%Overall Accuracy/%Kappa Coefficient
(1)B1–B3Maize100.000.0070.0030.0081.740.7011
Rice25.0075.0083.3316.67
Natural vegetation91.388.6292.987.02
Non-vegetation29.1770.8370.0030.00
(2)B1–B4Maize98.571.4376.6723.3383.910.7407
Rice55.0045.0068.7531.25
Natural vegetation91.388.6292.987.02
Non-vegetation29.1770.8370.0030.00
(3)B1–B6Maize98.571.4381.1818.8283.910.7426
Rice55.0045.0052.3847.62
Natural vegetation91.388.6292.987.02
Non-vegetation29.1770.8370.0030.00
* B1–B6 corresponds to the time windows in Figure 5.
Table 4. Identification accuracy of maize based on different feature datasets.
ItemFeature DatasetsTypeProducer’s Accuracy/%Omission/%User’s Accuracy/%Commission/%Overall Accuracy/%Kappa Coefficient
(1)Phenological featuresMaize91.438.5777.1122.8981.300.6883
Rice40.0060.00100.000.00
Natural vegetation93.106.9083.7216.28
Non-vegetation29.1770.8370.0030.00
(2)Statistical featuresMaize77.1422.8665.8534.1569.130.5069
Rice35.0065.0031.8268.18
Natural vegetation77.5922.4178.2621.74
Non-vegetation33.3366.6772.7327.27

