SBAS Analysis of Induced Ground Surface Deformation from Wastewater Injection in East Central Oklahoma, USA


Department of Earth and Atmospheric Sciences, Saint Louis University, St. Louis, MO 63108, USA
*
Author to whom correspondence should be addressed.
Remote Sens. 2018, 10(2), 283; https://doi.org/10.3390/rs10020283
Submission received: 20 December 2017
/
Revised: 29 January 2018
/
Accepted: 7 February 2018
/
Published: 12 February 2018
(This article belongs to the Special Issue Radar Interferometry for Geohazards)
Abstract
:The state of Oklahoma has experienced a dramatic increase in the amount of measurable seismic activities over the last decade. The needs of a petroleum-driven world have led to increased production utilizing various technologies to reach energy reserves locked in tight formations and stimulate end-of-life wells, creating significant amounts of undesirable wastewater ultimately injected underground for disposal. Using Phased Array L-band Synthetic Aperture Radar (PALSAR) data, we performed a differential Synthetic Aperture Radar Interferometry (InSAR) technique referred to as the Small BAseline Subset (SBAS)-based analysis over east central Oklahoma to identify ground surface deformation with respect to the location of wastewater injection wells for the period of December 2006 to January 2011. Our results show broad spatial correlation between SBAS-derived deformation and the locations of injection wells. We also observed significant uplift over Cushing, Oklahoma, the largest above ground crude oil storage facility in the world, and a key hub of the Keystone Pipeline. This finding has significant implications for the oil and gas industry due to its close proximity to the zones of increased seismicity attributed to wastewater injection. Results southeast of Drumright, Oklahoma represent an excellent example of the potential of InSAR, identifying a fault bordered by an area of subduction to the west and uplift to the east. This differentiated movement along the fault may help explain the lack of any seismic activity in this area, despite the large number of wells and high volume of fluid injected.

1. Introduction
Occurrences of earthquakes in Oklahoma were rare prior to 2008 [1]. Between 1950 and 2005, approximately 1.5 annual Mw > 3.0 earthquakes were recorded [2], however, since 2011, four earthquakes greater than Magnitude 5 have occurred. The Mw 5.7 Prague earthquake in 2011 [3], and in 2016 alone, the Mw 5.1 Fairview [4], the Mw 5.8 Pawnee and Mw 5.0 Cushing earthquakes [5]. The amount of recorded Mw greater than 3.0 earthquakes between 1980 and 1989 numbered 7, however in 2015 that number rose to 903 [6,7]. The increase in seismicity in the state of Oklahoma has led to many questions as to why the sudden surge in frequency and intensity of these events occurring over a relatively small number of years. Out of the 111 years of oil and gas production in Oklahoma [8], it is only the last ten years that have seen the dramatic uptick in measurable seismic events.
The components that must fit together to cause increased seismicity within intra-plate areas are complex. Fluid-induced seismicity has increased in number in oil and gas producing areas of the United States and has reached a fever in Oklahoma where the seismic hazard rivals that of some parts of California [1]. The increased demand for oil and gas over the last decade has meant an increase in production and the employment of techniques such as horizontal drilling and hydraulic fracturing to release plays from deep, ultra-low permeability (tight) shales [1,9,10]. Different mechanisms of production range from simple pumping of the stimulated formation (which may include encountering natural salt-water intrusion from the formation itself), to using hydraulic injection to ‘float’ the oil to the top for recovery, to using high pressure hydraulic fracturing to stimulate tight plays within the formation [11]. Each one of these production techniques has pros and cons, and each one will produce various volumes of undesired fluid that must be disposed of. Most traditional drilling methods produce much larger volumes of wastewater than hydraulic fracturing operations. Some publications attribute the increase in seismicity to the practice of hydraulic fracturing, or fracking [12,13,14,15]. As the formation is stimulated post drilling, the physical process of hydraulic fracturing is localized to the pipe/formation boundary. Whereas wastewater wells involve the injection of large volumes of undesirable water into formations below production zones. In areas where conventional plays are near exhaustion, up to four barrels of wastewater are created and ultimately injected into disposal wells for every one barrel of oil recovered [1]. Wastewater can include disposals from both conventional drilling methods, disposal of unwanted formation water, and the water involved in the process of fracking stimulated formations. Between 2004 and 2008, wastewater disposal volumes have nearly doubled in central Oklahoma [3].
A number of studies have utilized ground-based seismic information and injection well volumes to show a definitive correlation between the two [3,16,17]. Research has proposed that the Meeker–Prague fault splay of the Wilzetta Fault zone, responsible for the Mw 5.7 November 2011 Prague earthquakes, was pushed to failure by the use of wastewater disposal over decades [3], and that this fault system was reactivated just prior to the failure [17].
Synthetic Aperture Radar (SAR) satellites are active remote sensing platforms that can provide all-weather, day or night imaging capabilities [18]. Multiple acquisitions over the ground surface can be processed using differential or time series analysis Interferometric Synthetic Aperture Radar (InSAR) and a history of ground surface deformation can be determined [19]. This technology can be used to identify deformation due to naturally occurring phenomenon or anthropogenic contributions [20]. Over the years, a number of algorithms have been developed in order to use Interferometry to observe displacement of the Earth’s surface over time, an analysis technique referred to as time series analysis. These algorithms include techniques such as Permanent Scatterer InSAR (PSInSAR) [21,22], Small BAseline Subset (SBAS) [23,24], SqueeSAR [25] and Stanford Method for Persistent Scatterers (StaMPS) [26].
This study utilizes the SBAS methodology. In SBAS Interferometry, distributed scatterers and single value decomposition are used to connect individual unwrapped interferograms in time [23,27]. By connecting multiple unwrapped interferograms, SBAS generates a time series analysis over the area of interest [28].
InSAR analysis has been successfully utilized to identify the coseismic deformation associated with the largest (Mw 5.8) earthquake in Oklahoma’s history occurring in Pawnee, OK in September 2016 [29,30]. The C-Band data coverage included the actual seismic event, and the authors were able to determine up to 3 cm line-of-sight displacement at the surface [29]. Additional work focusing on the Pawnee earthquake coupled InSAR and Global Positioning System (GPS) data, identifying a few decimeters of collapse in the area of largest coseismic slip [31]. The study suggested the findings may represent the migration of large volumes of fluid away from the hypocentral region, triggered by a temporary high-permeability area around the fault at the time of slip [31]. Similar success with InSAR analyses was achieved in east Texas, where C and L-Band data analysis was coupled with injection volumes and a poroelastic model to compute crustal strain and pore pressure in limestone [32].
InSAR analysis, however, has seldom been utilized to examine if ground surface deformation is occurring prior to seismic events in Oklahoma. While mechanisms of fault reactivation occur at depth, the long-term injection of wastewater fundamentally alters these subsurface stresses, increasing pore pressure and weakening elements of the fault system, potentially leading to rupture [33,34]. The proposed causality of wastewater injection wells and increased seismicity has led to an unprecedented sharing of proprietary information from members of the oil and gas industry as well as detailed tracking of injection well data by the Oklahoma Corporation Commission [35].
This study seeks to examine if any observable surface deformation is occurring regionally and within the Wilzetta Fault Zone. If surface deformation is identified, are there qualifiable correlations between the measured surface deformation, the physical location of injection wells, and the volume of injected fluid? If any correlations are detected, future work will determine if any quantifiable statistical correlations exist in the identified areas of interest. This study aims to provides analysis of InSAR-derived ground surface deformation and injection well location to provide evidence for or against the potential contribution of injection wells to increased seismicity in east-central Oklahoma. This contribution is another piece of the puzzle geoscientists can utilize as a tool in the investigation of the dramatic rise in seismicity in the state of Oklahoma.
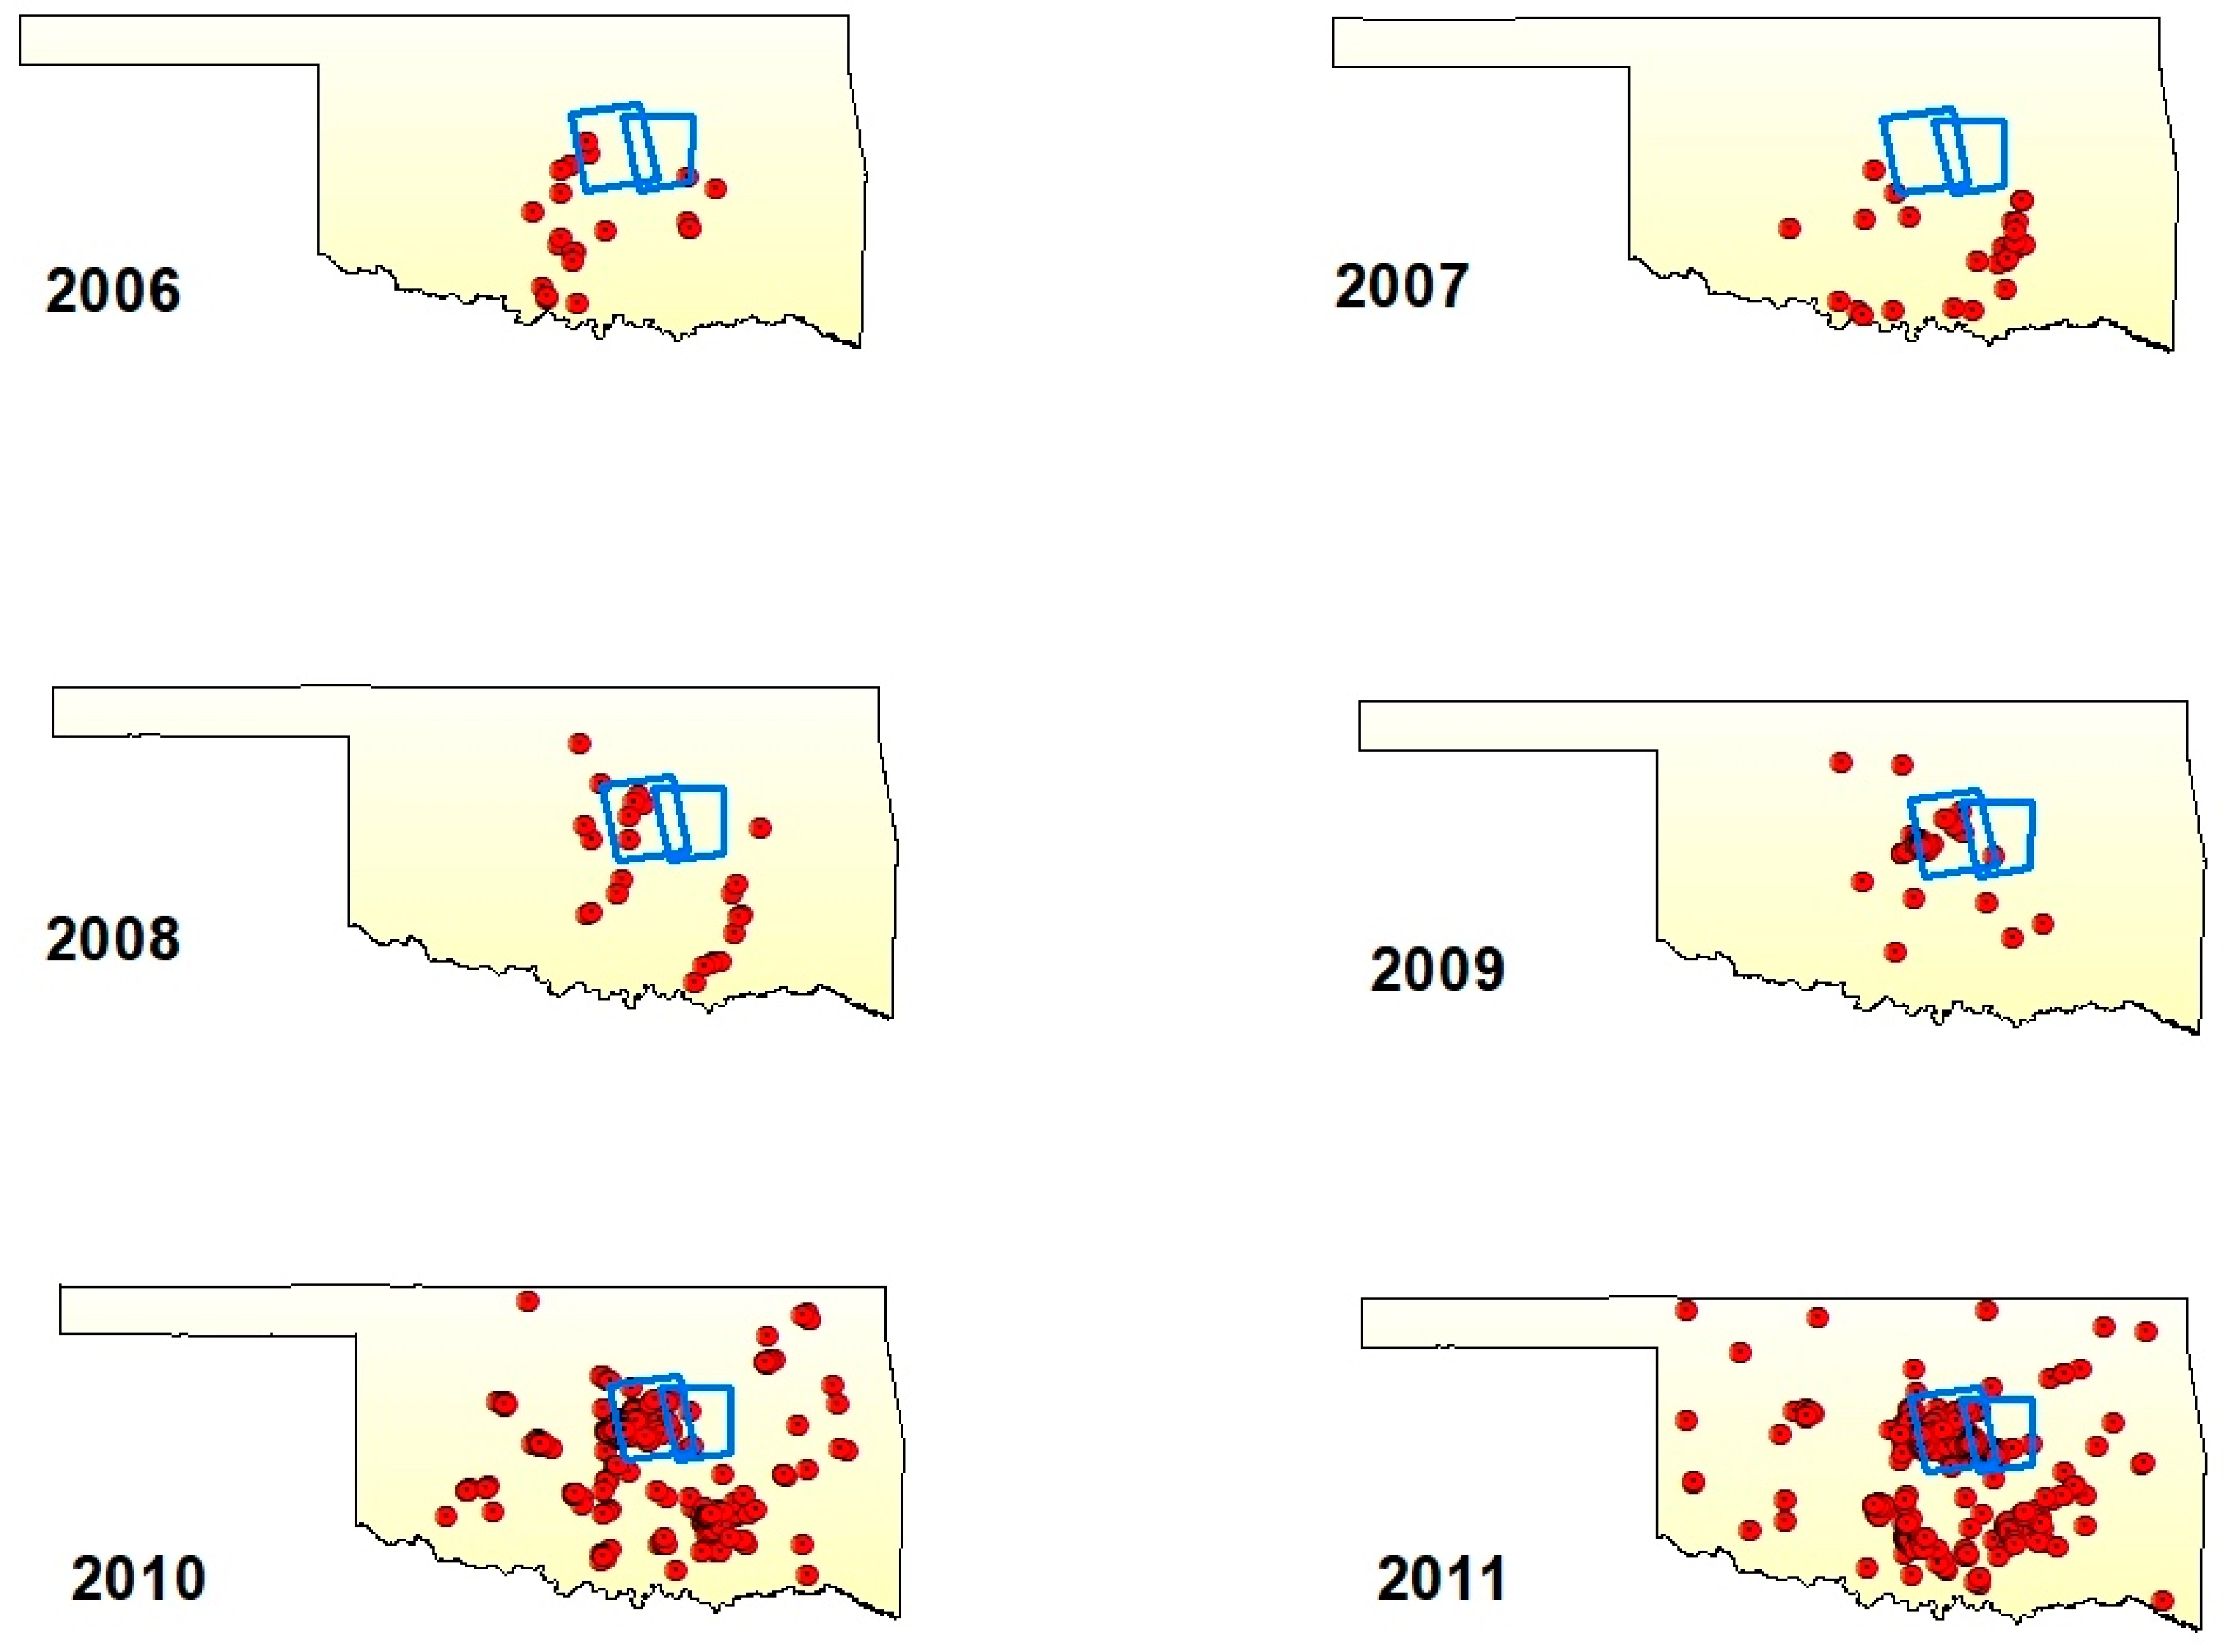
We selected two SAR acquisitions over east-central Oklahoma (Figure 1). The time period covered by our analysis includes a transition from relative seismic quietude to a significant increase in seismicity (Figure 2). Figure 3 displays seismic activity from 1990 through December 2016 and clearly shows a dramatic increase in frequency.
Our SBAS InSAR analysis shows regional deformation and the Meeker–Prague Fault splay displaying a mild correlation with injection well locations, whereas uplift identified in results for Cushing, Oklahoma has a significant impact due to the city’s importance in the oil and gas industry. Results in our final area, southeast of Drumright, Oklahoma presents some intriguing questions as to the magnitude of deformation observed, yet the lack of local seismicity in the area.
2. Materials and Methods
We processed two frames of the Phased Array L-Band SAR (PALSAR) data from the Japanese Advanced Land Observing Satellite (ALOS) “DAICHI” (Table 1) using the Small Baseline Subset (SBAS) workflow available in ENVI SARscape [36]. A majority of our primary area of interest had rural landcover, and the selection of L-Band data (23.5 cm wavelength, 1.275 GHz frequency) allows improved reduction of the noise and temporal decorrelation from vegetation. While characteristics of C-Band data possesses limited capabilities for vegetation penetration, longer wavelength data such as L-Band SAR data can penetrate vegetation and receive backscatter signal from the ground surface [37]. We used USGS National Elevation Dataset (NED) 1 arc second Digital Elevation Model (DEM) with a 30-m ground resolution for processing removal of the topographic component within the SBAS workflow.
The overall processing workflow included the following steps: creation of a connection graph, interferogram generation, Goldstein interferogram filtering, orbital refinement and reflattening, removal of atmospheric and topographic error, phase unwrapping, and phase to displacement conversion [38]. Following co-registration, interferogram generation and removal of the flat earth phase component due to the earth’s curvature, Goldstein filtering [39] was applied to remove interferogram noise. We used a predefined linear displacement model to remove phase residuals from DEM inaccuracies [23], jointly estimating the DEM error and the low pass displacement parameters [40]. Depending on the redundancy of interferogram pairs that met the coherence threshold requirement, a minimum cost flow (MCF) network [41] or Delaunay 3D (D3D) method [42] was used to unwrap the phase values. A low-pass and high-pass spatial filter on the time series images was used to screen and remove the atmospheric phase component [38]. The selection of Delaunay 3D unwrapping assists in reducing atmospheric and orbital effects by exploiting the temporal information, unwrapping the phase difference between neighboring pixels in the time domain. Those interferogram pairs severely affected by inaccurate orbits, very large baseline, and/or strong atmospheric or topographic noise, not removed within the processing workflow, were manually excluded from final displacement conversion.
InSAR estimated deformation is relative to ground control (reference) points (GCPs) used during phase to displacement conversion. Therefore, the location of the reference points largely determines the quality of the InSAR measurements. There are three approaches to creating GCPs. (1) When ground truth deformation data with accurate velocity is available (e.g., global position system or leveling), one or a few GCPs are sufficient to convert unwrapped phase to displacement assuming no systematic acquisition geometry errors exist with the data [43]. (2) Alternatively, GCPs with assumed zero deformation (motionless) can be used as reference points for SBAS processing [44] when no ground survey data are available. In this case, pixels are selected as GCPs based on the following criteria: a larger temporal coherence value (e.g., 0.75 or greater), unwrapped phase value close to zero and flat areas identified from a topographic map, located far away from the deformation zones [38,45,46]. The mean displacement values of these GCPs are then subtracted from the displacement image to produce the final displacement map. This method does not require field survey but it is most suited for smaller areas with better a priori knowledge of known subsidence zones. (3) For larger areas without known subsiding areas, a better approach is to use the average displacement value of the entire image as a reference value, which was the method used in this study. In practice, the SARScape modules of ENVI software allows for the creation of hundreds of GCPs (while a minimum 40 GCPs are recommended) [43,47] evenly distributed over the entire image, and utilizes the average of these GCPs as a reference point. The advantage of this approach is that it eliminates noisy pixels from the averaging process by selecting pixels with higher coherence values. We selected over 100 GCPs covering each frame individually. It is worth noting that we tested both methods (2) and (3) and found the absolute values of cumulative displacements were slightly different between the methods. However, overall trend and spatial patterns of subsidence are not affected.
The SARscape SBAS workflow and algorithm allows for custom-tailored analysis of each individually processed frame. We re-processed the two frames until ideal parameters were identified that yielded the most complete coverage of each frame individually. We utilized a max normal baseline of 50%, Delaunay 3D, disconnected blocks disallowed, a coherence threshold of 0.35, Goldstein max alpha of 3.5 with frame 175–700 as a max temporal baseline of 1000 day, 25-m grid size and Goldstein min alpha of 0.3, and frame 176–700 as a max temporal baseline of 1200 day, 20-m grid size and Goldstein min alpha of 0.5. Differences in the processing parameters were used to help yield the most complete processing coverage of the individual frames. The two InSAR frames were then mosaicked together for visual representation of results, blending the overlapping areas.
3. Results
Results of the InSAR SBAS analysis were first examined from a regional perspective. We then selected three separate areas of interest that were investigated from a local perspective. All deformation is in satellite Line of Sight (LOS). The direction of LOS displacement is represented by negative and positive symbols on the map legends. Negative displacement values are represented by cool colors (from dark blue to cyan) and show the areas where the ground movement is away from the satellite. Positive values (from light green through yellow and red) demonstrates the ground is moving toward the satellite for the period of observation.
3.1. Regional Deformation
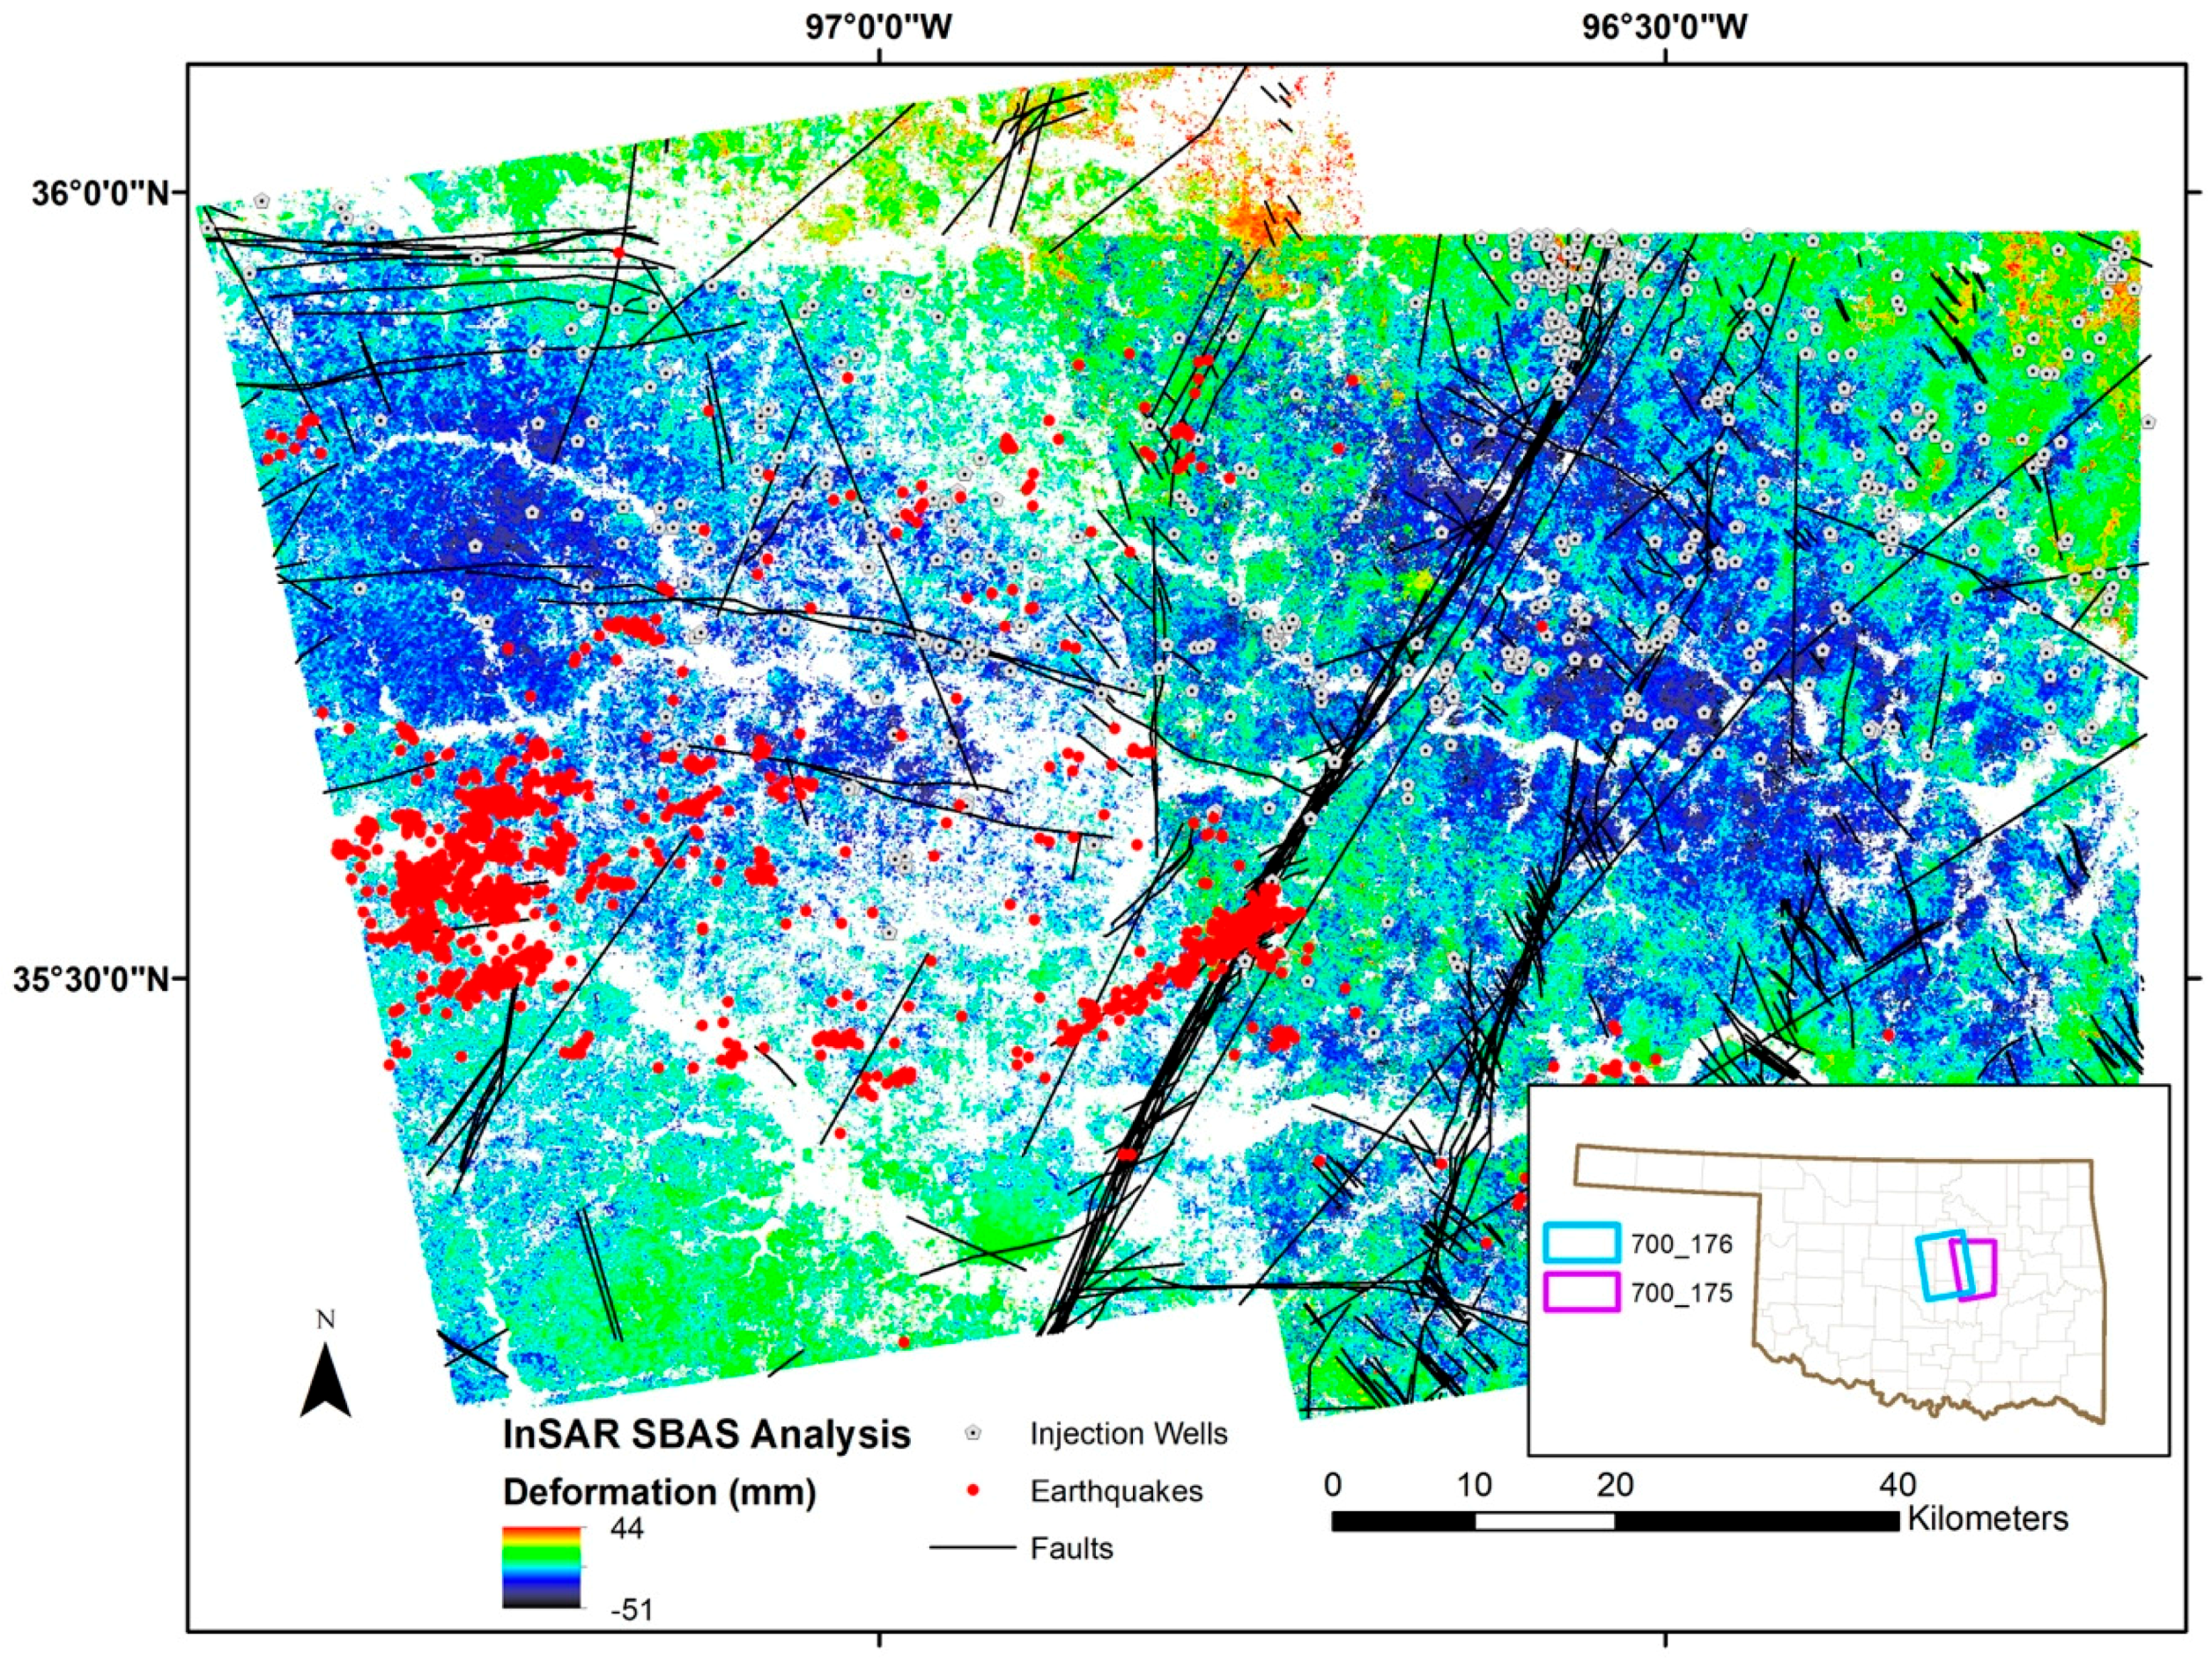
The two SBAS frames were overlaid with regional fault system, injection wells, and earthquake data to assist in identifying areas of correlation between calculated ground deformation and auxiliary data, as well as selection of further areas of interest for more detailed investigation (Figure 4). We focused primarily on the location of injection wells that were active at the conclusion of the analysis timeframe (2006–2011), in order to begin to address the potential for anthropogenic contributions to the increased level of seismicity in the area. Additional, relevant information utilized included 2.9 Mw or greater earthquake inventory for the time of SBAS analysis (2006–2011), as well as location of faults within the two frames [48].
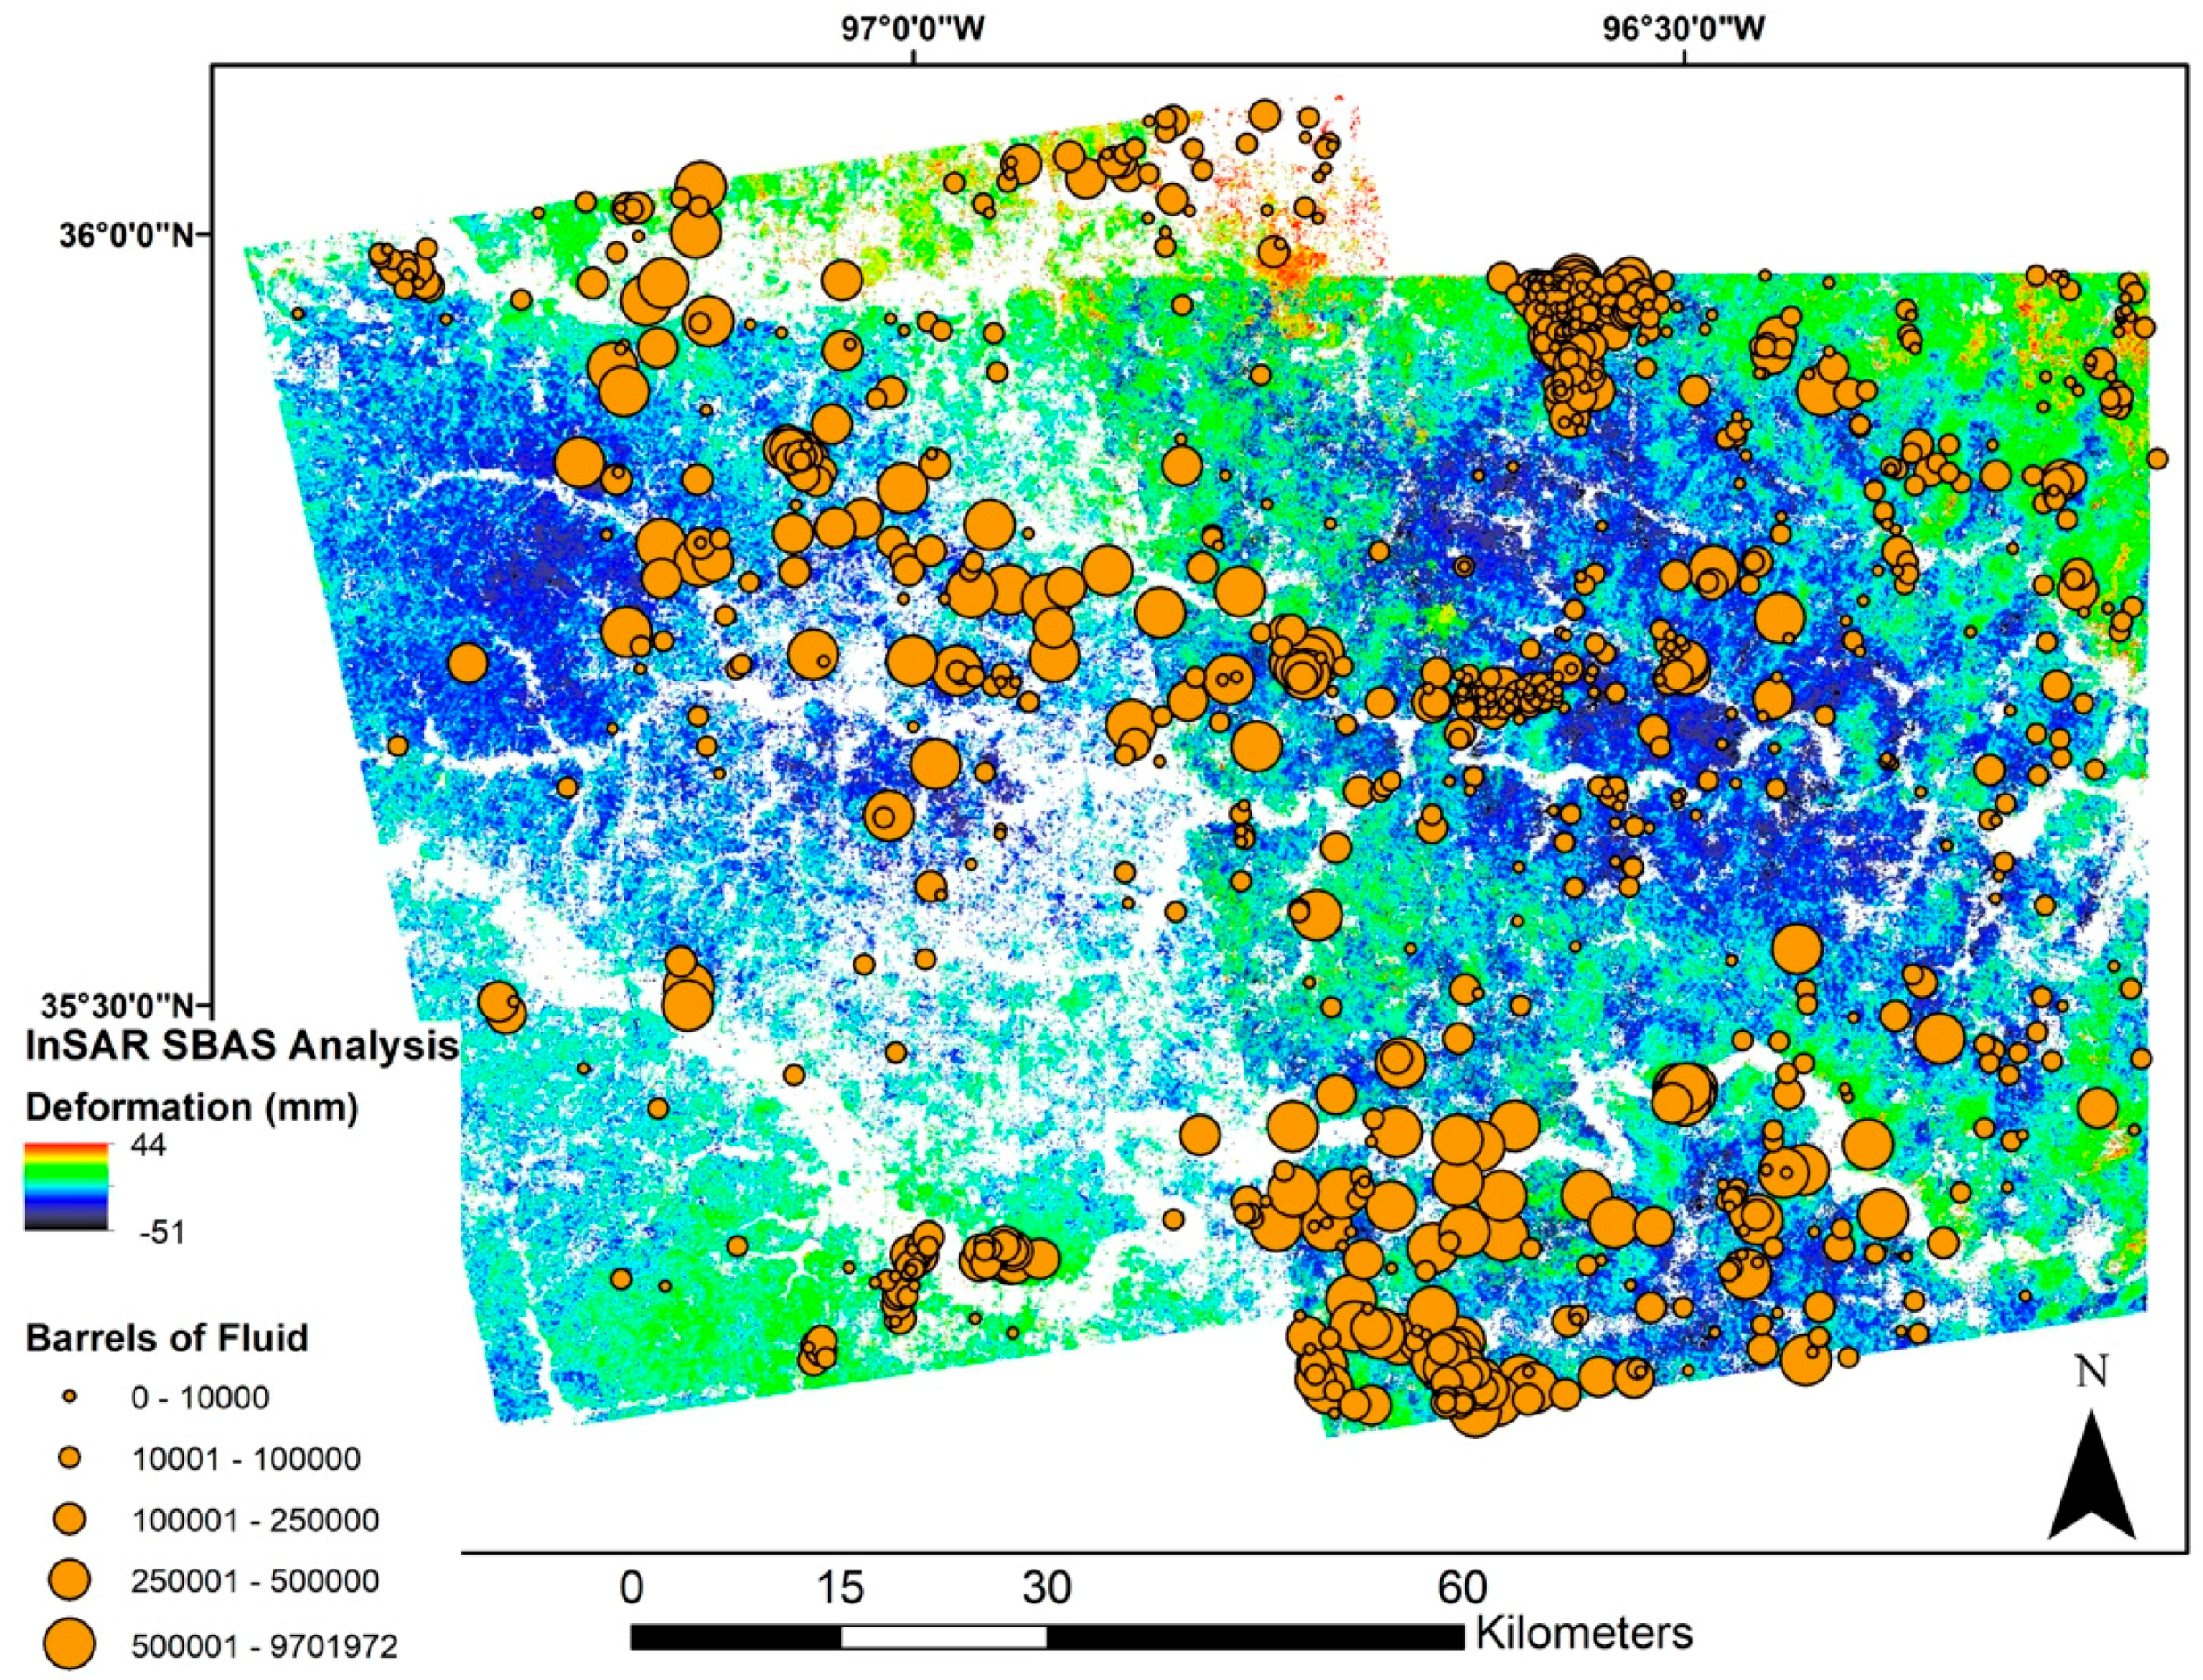
This region of Oklahoma is marked by uplift that occurred during the Pennsylvania period concurrent the development of the Rocky Mountain orogeny [49,50,51,52]. It is these regionally complex, buried high-angle normal faults [53] that have led to over a century of oil and gas development in Central Oklahoma [54]. Our InSAR analysis shows a large region of subsidence over east-central Oklahoma (Figure 4). The northern boundaries of this subsiding area are coincident with the location of the 2011 injection well inventory. Figure 5 shows regional deformation in relation to wastewater injection well volumes (in Barrels) for the end of 2011. There is a broad correlation of deformation with respect to injection well locations (Figure 4), but no clear pattern with respect to injection well volumes (Figure 5). Future work will calculate fluid balance over this region, utilizing injection well volume (addition) and production well volumes (removal) to determine the net fluid per unit grid over the InSAR analysis. Spatial statistics with respect to the calculated net fluid, location of InSAR determined deformation and Mw > 3.0 earthquakes will attempt to quantify the regional deformation observed, and examine statistically if there is any possible correlation to fluid extraction/injection.
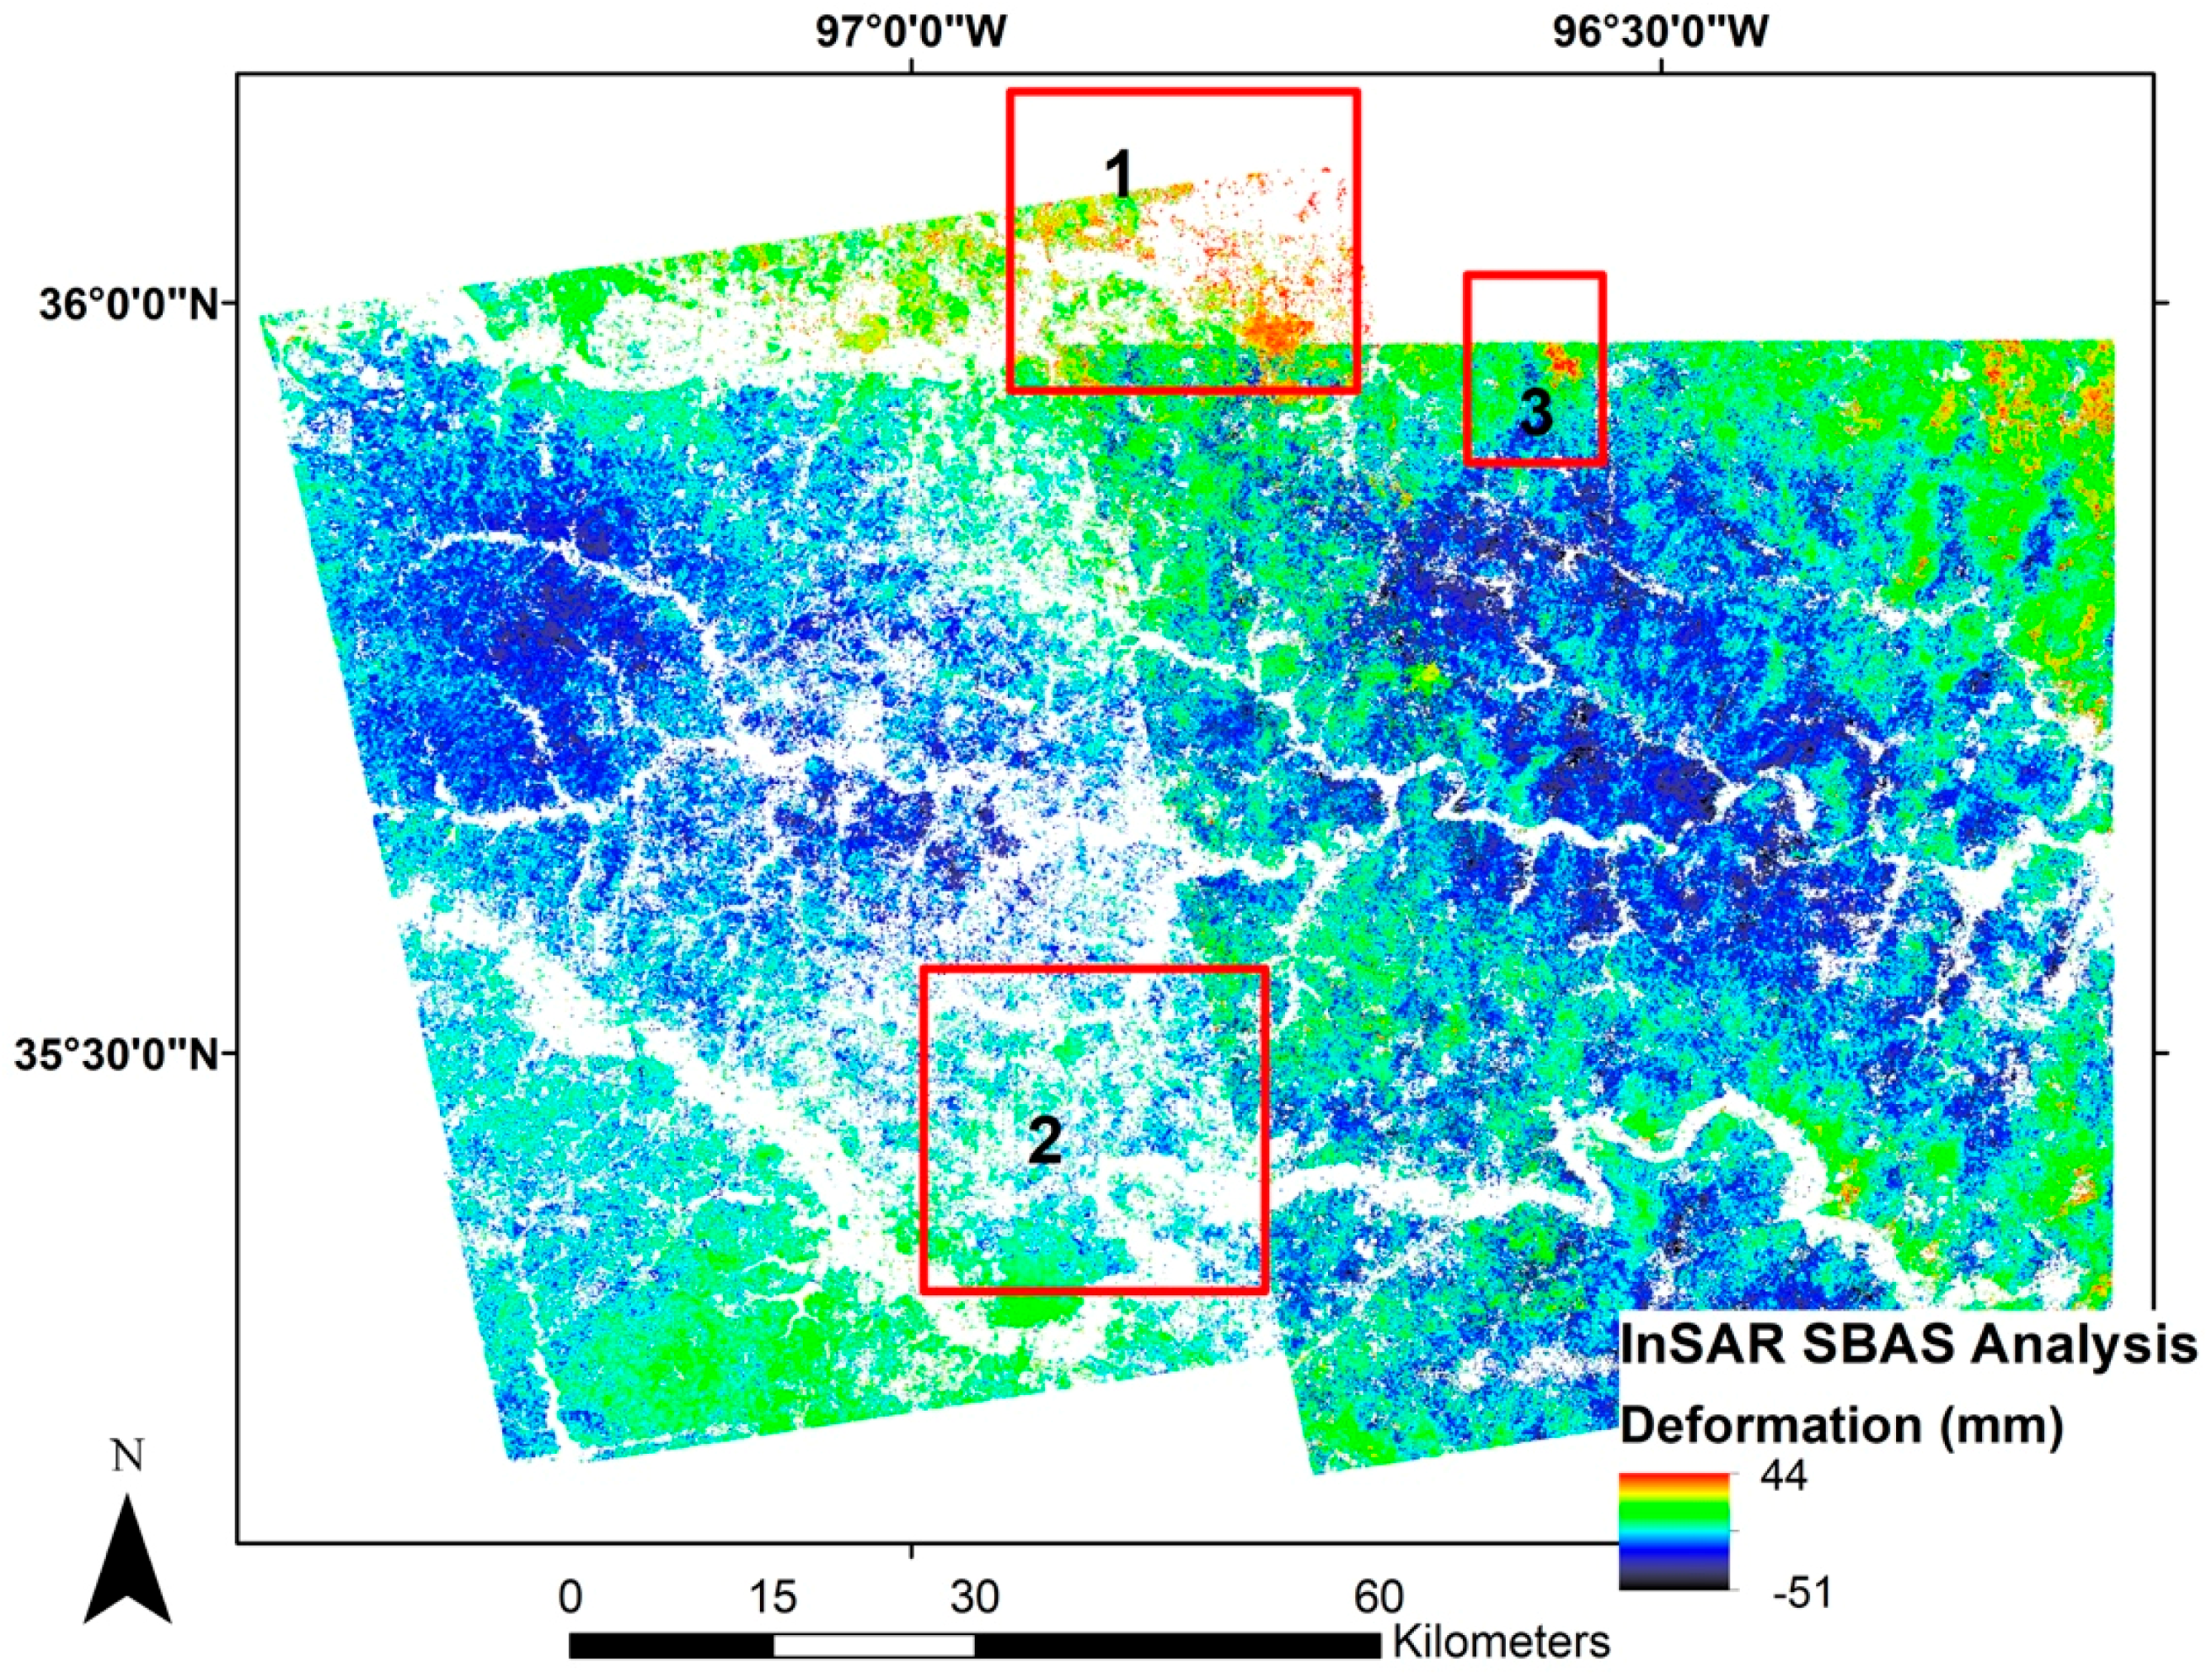
Examination of the regional SBAS results yielded the selection of three separate areas of interest in which to investigate at a local scale (Figure 6).
3.2. Area of Interest One-Cushing, Oklahoma
The city of Cushing is located in Payne county in east central Oklahoma, and the 2010 Census lists the total population at 11,784. The primary rock type in the area is the Late Pennsylvanian Vanoss Group shale [55]. Cushing is of special significance to the oil and gas industry as it is a major hub of the Keystone Pipeline, as well as the site of the largest above-ground crude oil facility in the world [56].
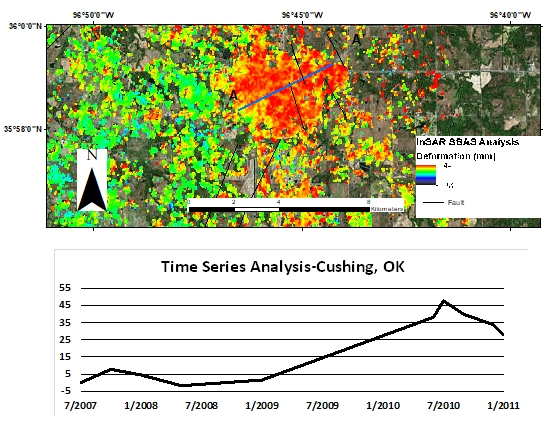
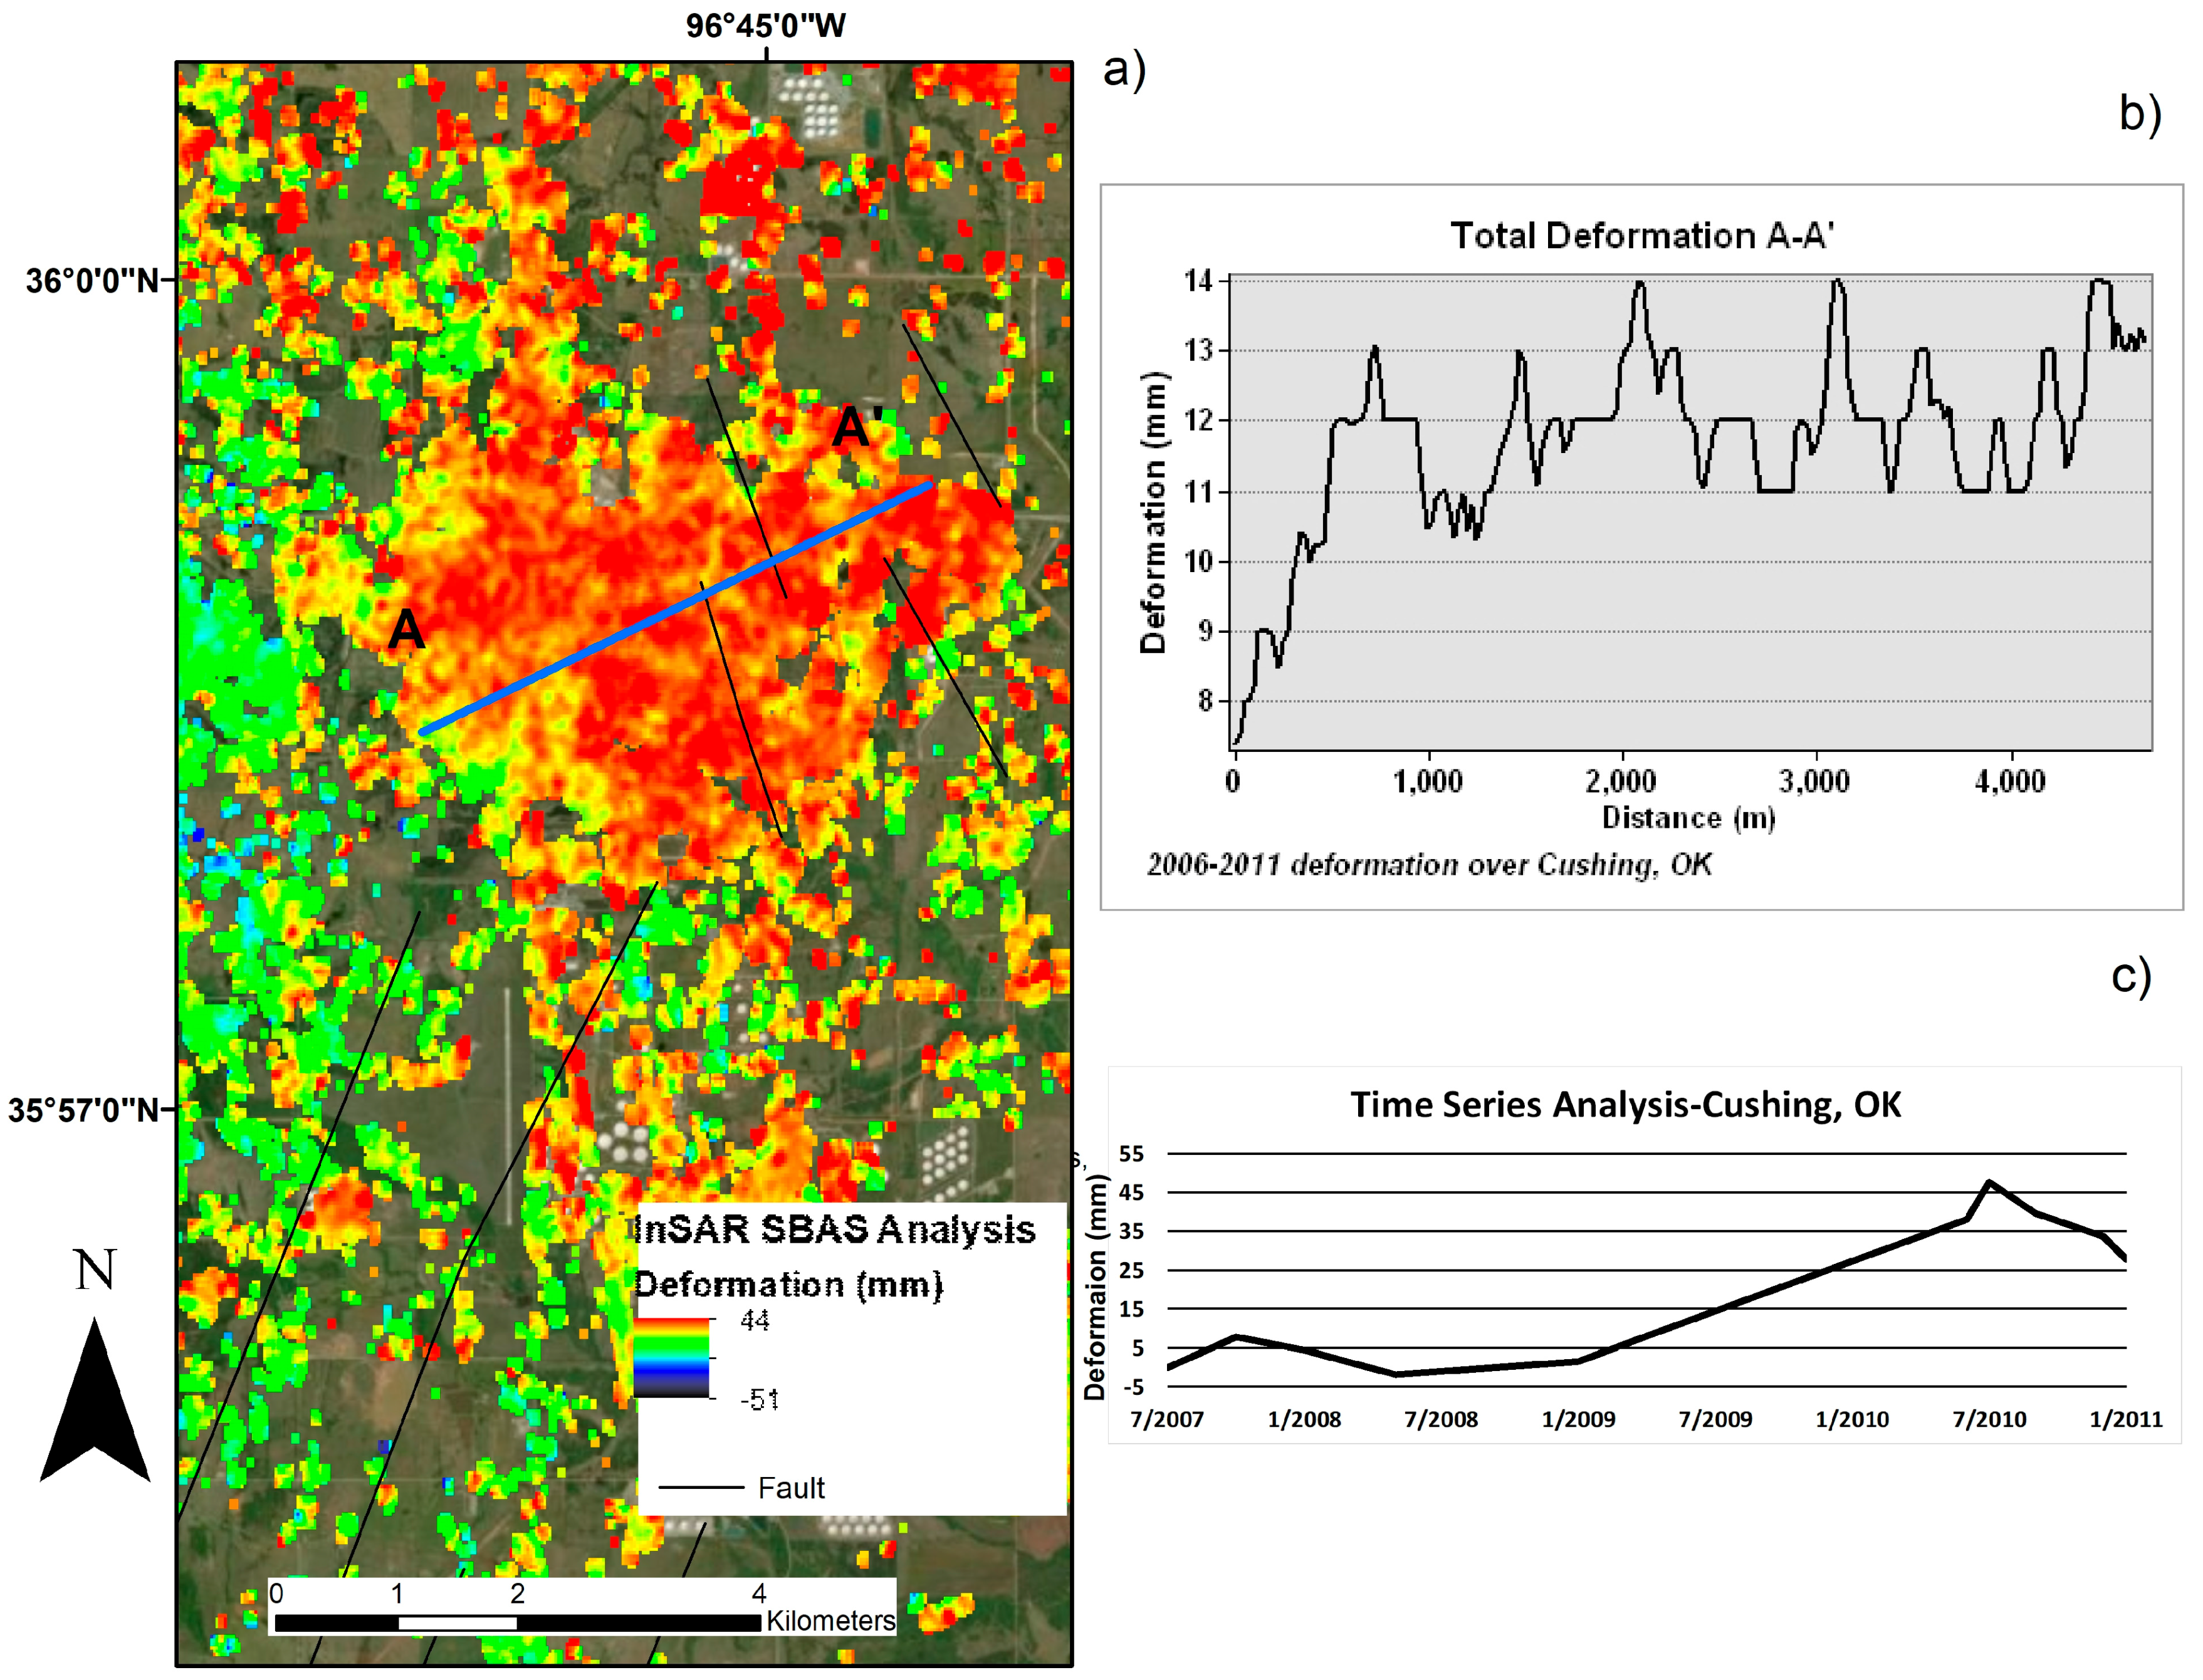
Results from our SBAS analysis show an area of uplift occurring across the city footprint, and over a portion of the above-ground storage tanks located to the south of the city of Cushing (Figure 7a). Time series analysis over the city indicate total deformation of 44 mm during the analysis time frame, with a majority of the local deformation occurring between 2008 and 2010 (Figure 7c).
3.3. Area of Interest Two-Wilzetta Fault Zone
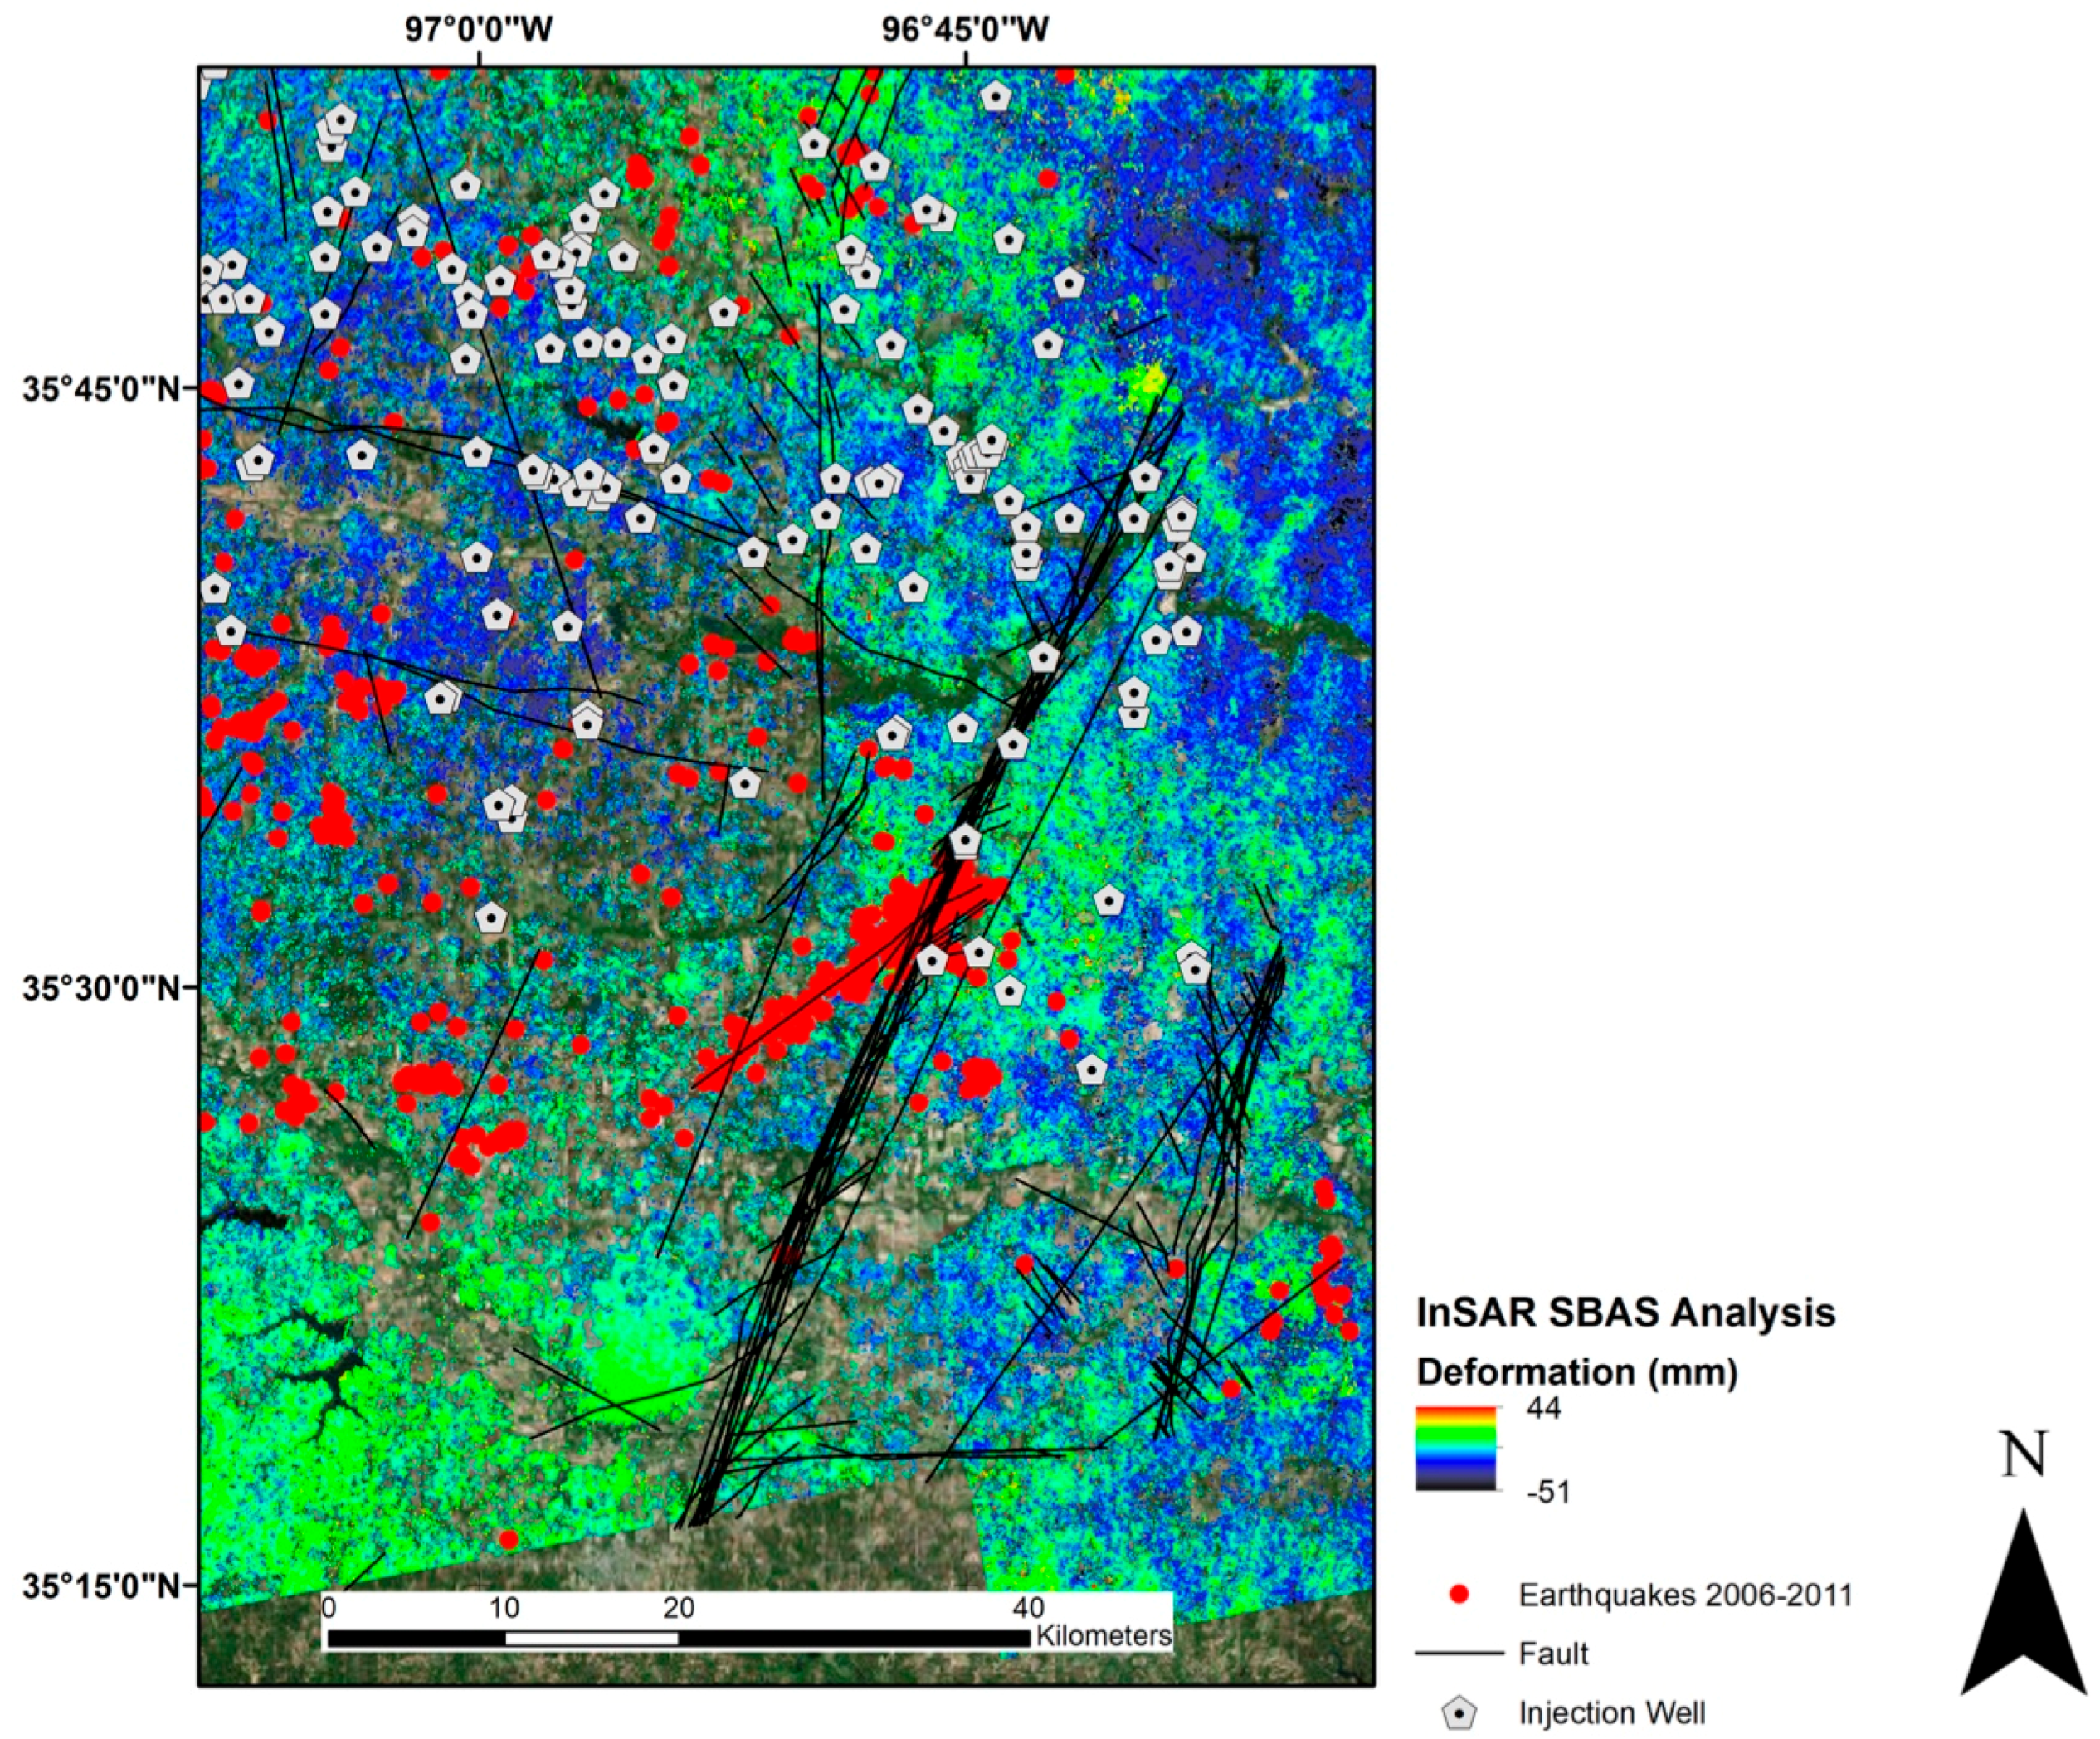
The Wilzetta Fault Zone is a large, 200 km long Pennsylvanian fault system [50,57] with a predominantly shale rock type from the Late Pennsylvanian Vanoss Group [55]. Main production of oil and gas in this area occurred in the 1950’s and 60’s [3,54], and in 1993 the area transitioned into a location for salt-water disposal wells (Type II Injection Wells) [58]. Disposal is primarily in the Hunton Limestone and the Arbuckle Group at bottom well depths of 1.3 and 2.1 km, respectively [59]. In November 2011, it was the location of the second strongest recorded earthquake in Oklahoma history [3,58]. Three earthquakes of Mw 5.0, 5.7 and 5.0 occurred within 4 days along the strike-slip Meeker–Prague fault, a 20 km splay off the main Wilzetta Fault Zone [60], approximately 4 miles east of the town of Sparks, Oklahoma. The epicenters of these events were located 180 km from the nearest known Quaternary-active faults [3]. This series of earthquakes is the largest ever correlated to wastewater injection [3]. Figure 8 shows the location of 2.9 Mw or greater earthquakes that occurred between 2006 and 2011. The cluster of earthquakes along the Meeker–Prague fault splay is easily observed.
A number of studies [3,58,60] have linked these earthquakes to nearby wastewater injection wells. Work by [3] proposed that this sequence of earthquakes was not only due to wastewater injection, but was the result of over twenty years of wastewater injection in the area, and not an immediate response to wastewater injection initiation or volume change [61].
We selected the Wilzetta Fault Zone as an area of interest due to the long duration of wastewater injection in the area, and the knowledge that shortly after the end of our analysis time-frame these large and significant earthquakes occurred. While many mechanisms of fault reactivation are occurring at depth, we wanted to identify if InSAR might have indicated any type of ground deformation in the area. Figure 8 shows the results of our analysis. Coherence in the area of the Meeker–Prague fault splay is spotty, but there is a region of relative uplift along the intersection of the fault splay. Regional deformation results (Figure 4) show widespread subsidence. The area of intersection between the Meeker–Prague splay with the main Wilzetta Fault Zone demonstrates an island of moderate uplift.
3.4. Area of Interest Three-Southeast of Drumright, Oklahoma
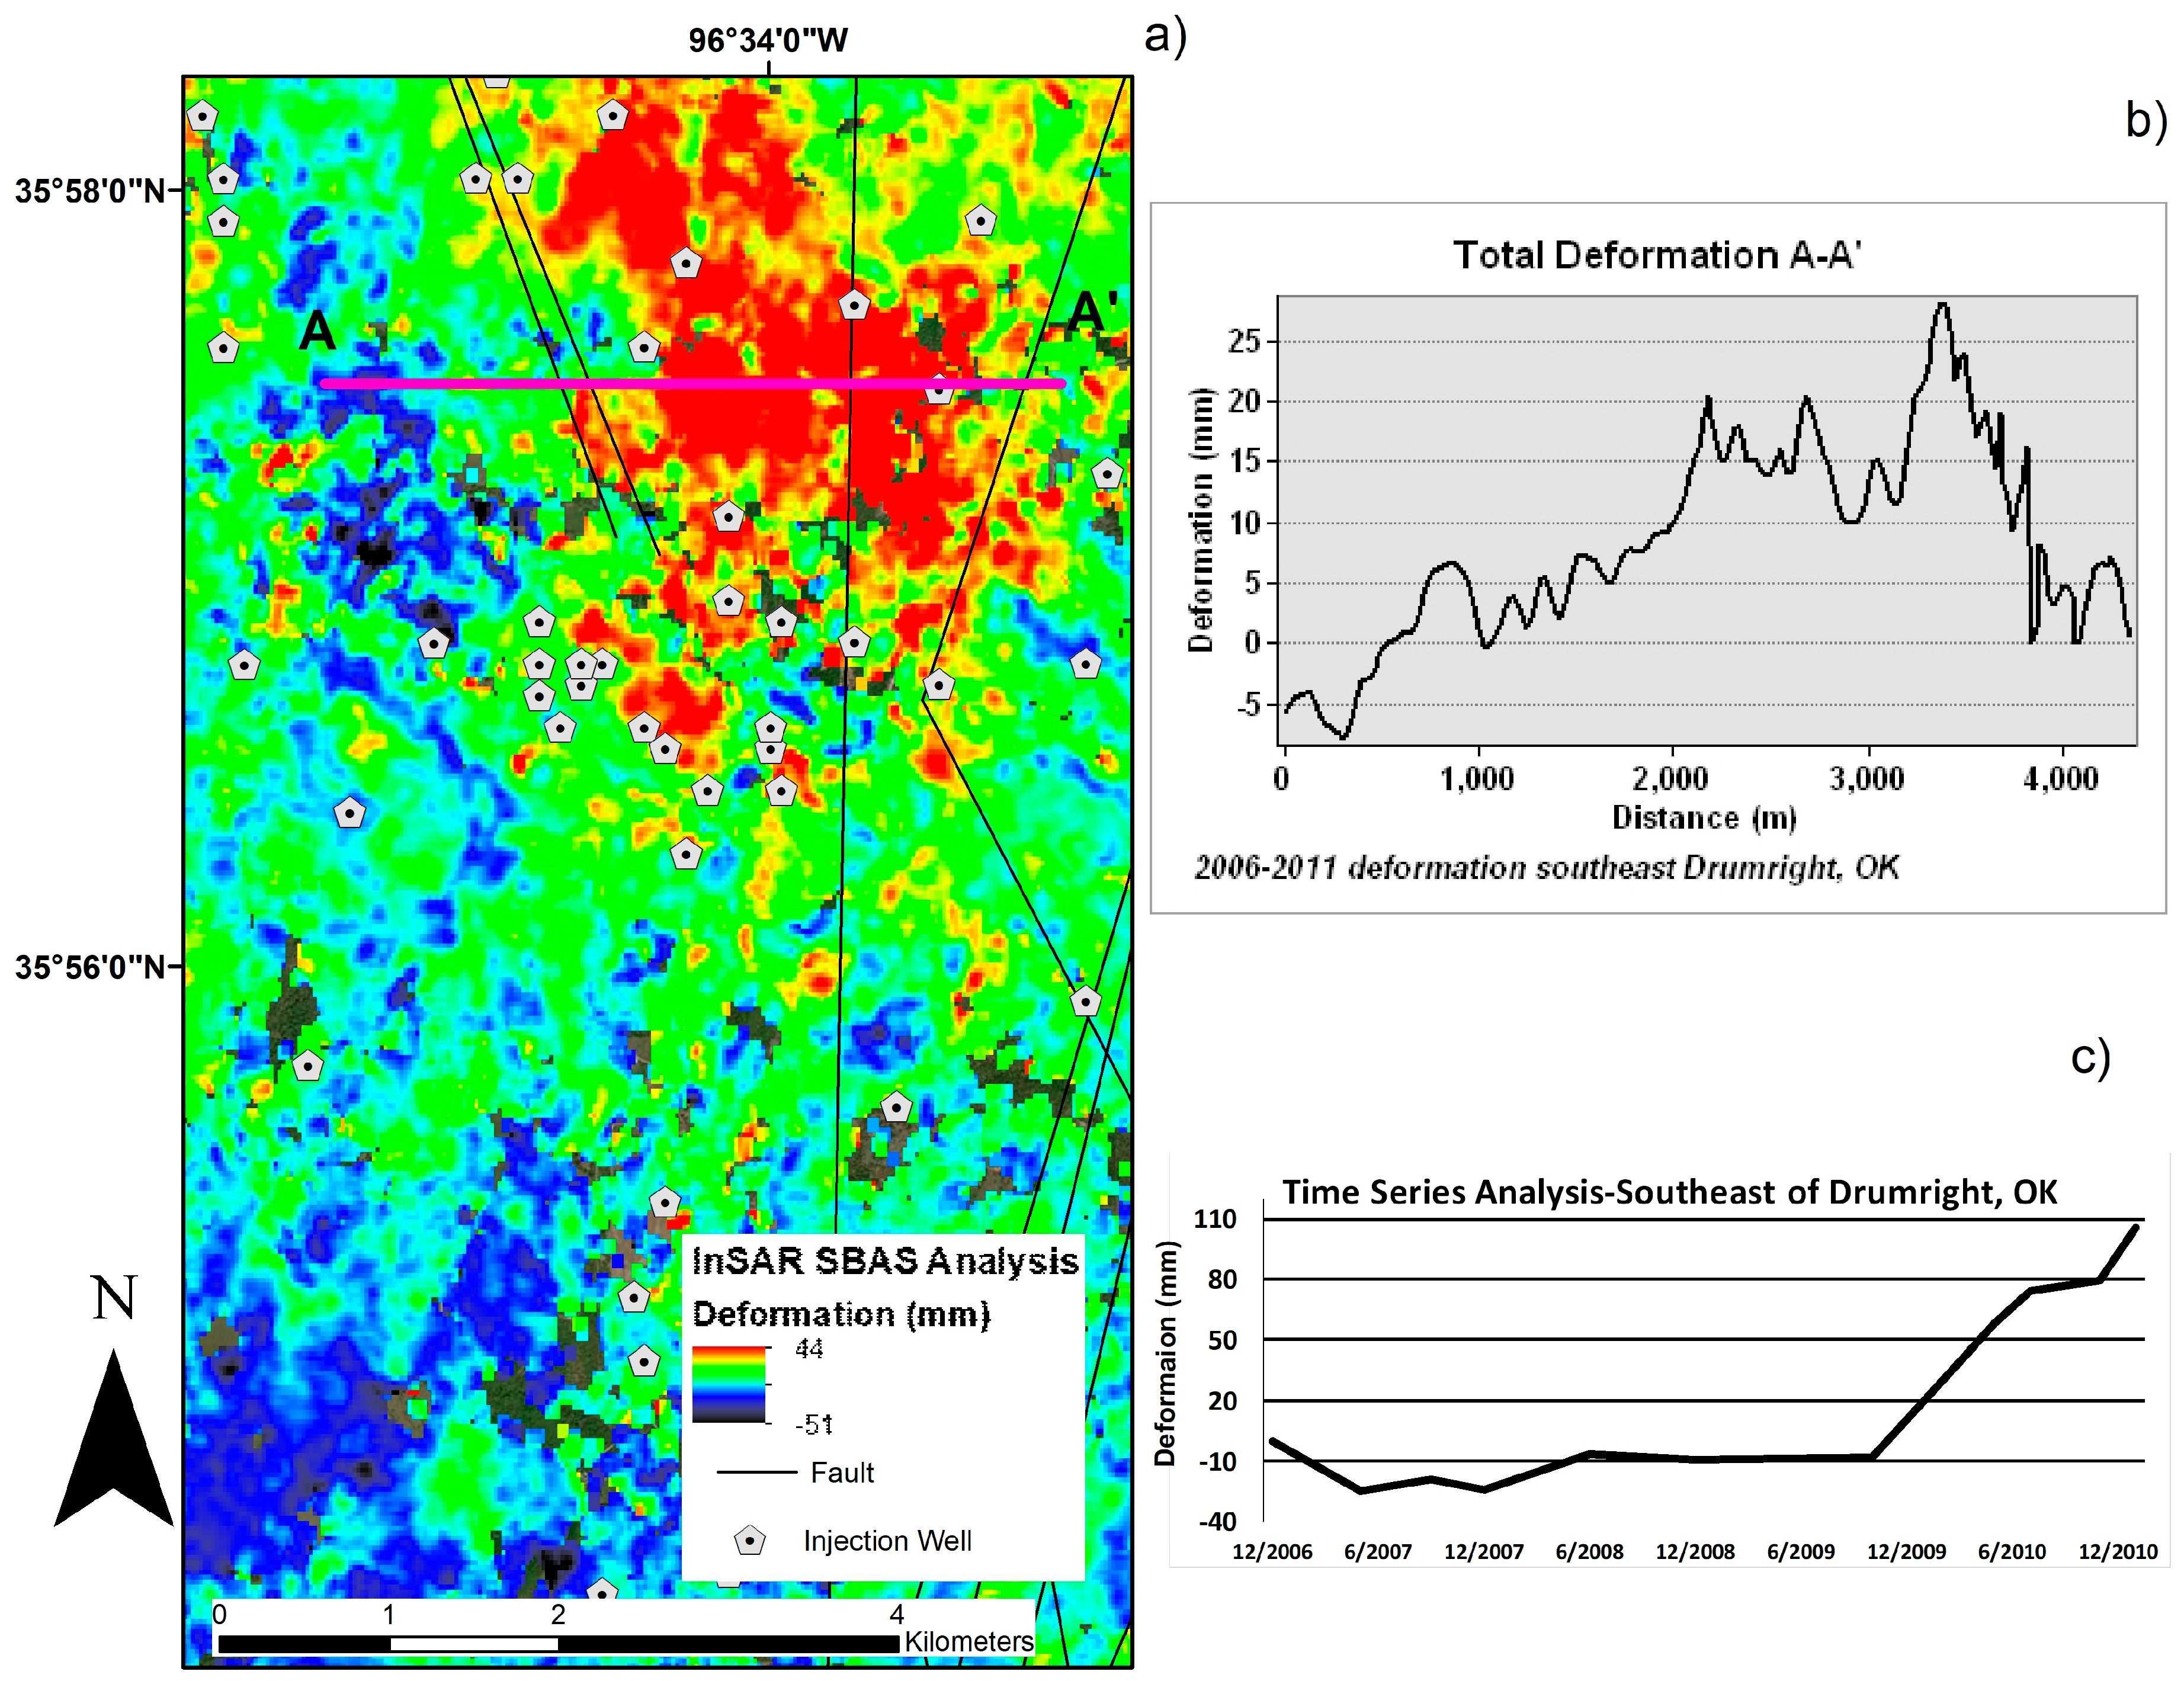
The third area of interest within our analysis is a zone of uplift noted in the northern section of the frame (Figure 9), approximately 3 km southeast of the city of Drumright, Oklahoma. The predominant rock type in this area is the Late Pennsylvanian Vamoosa Group shale [55]. This region shows a clear area of uplift bounded by faults on the western and eastern sides of deformation, with a longer central fault. A horizontal profile highlights the variation from a subsiding area to the west of the fault (−8 mm) through an area with a high amount of deformation (+27 mm) (Figure 9b). Numerous injection wells are located in the area, and Figure 5 provides some context for the total amount of injected fluid for 2011 in this zone. Time series analysis of results shows a small amount of deformation prior to the end of 2009, and then an uplift of 120 mm in less than 2 years (Figure 9c). Of note is the lack of earthquake activity in the area (Figure 4) for the analysis period, despite the significant uplift in this area.
4. Discussion
We wanted to address if the use of InSAR analysis could highlight areas of ground deformation around active injection wells in east-central Oklahoma. This paper is the first in a sequence of work that seeks to answer if anthropogenic activities are contributing to the observed increased seismicity in Oklahoma. While a number of studies have also sought to answer this question [3,16,17,62], we applied a different approach utilizing remote sensing tools versus on the ground tools (seismometers, differential GPS).
The processed area was selected due to the dramatic increase in seismicity that has occurred over the analysis time frame along the Wilzetta Fault Zone, with a particular interest to the section that includes the Meeker–Prague Fault Splay (Figure 8). The regional results show large-scale subsidence in the area. Oil and gas production in this area has been ongoing for decades, and the use of hydraulic fracturing has been incorporated over the last decade to release tight plays from end of life wells [10]. Wastewater injection wells have concurrently been in use in the area, and the interplay of these two processes has dramatically changed the fundamental subsurface stresses over time. While it would have been optimal for the oil and gas industry to attempt to balance out these subsurface stresses by ‘replacing’ production with wastewater in a static balance, that has not been the case and the increase in seismicity in the area is one key clue that anthropogenic activities are likely causing irreparable damage. Our future work will take the results of this regional deformation and perform fluid balance calculations and spatial statistics in an attempt to quantify these activities.
The results from Area of Interest-1, City of Cushing, Oklahoma are of great impact. The region of uplift includes the city and the above ground crude oil facility located south of the town (Figure 7). This time series analysis shows that the area experienced uplift for a period of 2 years before undergoing subsidence. In October of 2014, two earthquakes (Mw 4.0 and 4.3) occurred just south of the area, below the crude oil facility [63]. The strong shaking felt during the earthquake [7] prompted the Oklahoma Corporation Commission to temporarily shut down three wastewater injection wells in the area [35]. Work by [63] determined that this earthquake sequence was the result of the reactivation of an unmapped left-lateral strike slip fault (which they named the Cushing fault) conjugate to the main branch of the Wilzetta-Whitetail fault zone. Conjugate strike slip or ‘cross fault’ ruptures are capable of triggering a rupture on a main fault [64]. This previously unmapped fault is conjugate to the Wilzetta-Whitetail fault zone, which is located at the northern section of the Wilzetta Fault Zone, a zone that includes Area of Interest-2. In November of 2016, a Mw 5.0 earthquake occurred 3 km west of the City of Cushing [7].
Area of Interest-2, the Wilzetta Fault Zone focuses mainly on the Meeker–Prague Fault Splay (Figure 8). As detailed above with respect to Area of Interest-1, conjugate faults can cause ruptures on main faults. The Meeker–Prague Fault splay is also a conjugate fault. There have been a number of studies that have linked the increased seismicity along the Meeker–Prague Fault to wastewater injection wells [3,58,60]. Calculated Coulomb failure stress changes along the Cushing Fault were compared to data from the November 2011 Prague earthquake along the Meeker–Prague fault [63]. They determined that the Cushing fault (Area of Interest-1) was capable of producing a large damaging earthquake comparable to the 2011 Prague event (Mw 5.7). An event that large could be detrimental to not only the above ground crude oil tanks, but also to the sections of the Keystone pipeline in the area. These two Areas of Interest have distinct results from the SBAS analysis, but the background and occurrence of earthquakes after the conclusion of our analysis highlights the interplay of deformation, complex fault systems and wastewater injection. As events along conjugate faults can affect the main fault, conclusive evidence of wastewater injection causing seismicity along the conjugate faults can warn of future seismicity along the main fault.
The final Area of Interest-3, located southeast of Drumright, Oklahoma, is unique to our other results. This rural area is peppered with well locations (Figure 9a). Results shown in Figure 9 indicate that an area of uplift is bounded by faults on either side, with a fault in the central section. Of particular interest is the subduction seen to the west of the western bounding fault. All three Areas of Interest were located in geologic formations primarily consisting of shale, containing faults and injection wells. Examination of the earthquake history for the three Areas of Interest showed significant events occurring in Area of Interest One, Cushing, Oklahoma and in Area of Interest Two, the Wilzetta Fault Zone, but as of 2017 no seismicity has occurred in Area of Interest Three, southeast of Drumright, Oklahoma. One possible explanation utilizing our InSAR results is that there is some kind of stress release occurring on one side of the western fault that relieves built-up stresses from the volume of the injection well fluid. Figure 5 shows that injection well volumes in this area are significant. Our future fluid balance work will also include this Area of Interest, but at a finer scale than the regional deformation fluid balance analysis.
5. Conclusions
We performed an InSAR SBAS analysis over east central Oklahoma to identify ground surface deformation with respect to the location of wastewater injection wells to answer if anthropogenic activities are contributing to the observed increased seismicity. Our conclusions are as follows:
- (1)
- Spatially, regional deformation and injection wells showed correlations to some degree. There is broad subsidence coincident with densely located injection wells.
- (2)
- From December 2006 to January 2011, over 44 mm of uplift was observed over Cushing, Oklahoma, which has significant implications for the oil and gas industry. This is due to the fact that Cushing is a major hub of the Keystone Pipeline, as well as the site of the largest above-ground crude oil facility in the world. Time series analysis for the city of Cushing, Oklahoma demonstrates a growing stress accumulation indicating the potential for induced seismicity.
- (3)
- The area southeast of Drumright, Oklahoma presents some intriguing questions as to the magnitude of deformation observed, yet the lack of seismicity in the area. This region shows a clear area of uplift bounded by faults on the western and eastern sides of deformation, with a longer central fault. A horizontal profile highlights the variation from a subsiding area to the west of the fault (−8 mm) through an area with a high amount of deformation (+27 mm).
Acknowledgments
The PALSAR data source is JAXA, METI. The level 1.0 data were processed by the Alaska Satellite Facility SAR Data Center, one of NASA’s Distributed Active Archive Centers. PALSAR FBS/FBD Level 1.0 data were processed in the Remote Sensing Lab at Saint Louis University using ENVI SARscape Modules from Harris Geospatial Solutions. Authors thank anonymous reviewers for their constructive comments and critiques.
Data Sources
SAR Imagery was obtained from the Alaskan Data Facility https://www.asf.alaska.edu/. Injection Well Inventory data from ArcGIS REST services, http://services.arcgis.com/jDGuO8tYggdCCnUJ/ArcGIS/rest/services/Oklahoma_Class_II_Injection_Wells/FeatureServer with data from the Oklahoma Corporation Commission http://www.occeweb.com/index.html. Fault data and earthquake catalogues compiled by the Oklahoma Geological Survey at the University of Oklahoma http://www.ou.edu/content/ogs.html. USGS NED datasets available at https://nationalmap.gov/elevation.html.
Author Contributions
Elizabeth Loesch conceived the idea and wrote the first draft of the paper; Elizabeth Loesch and Vasit Sagan performed the experiments, analyzed the data; Vasit Sagan provided feedback, and revised the first draft of the manuscript. Elizabeth Loesch revised the final draft.
Conflicts of Interest
The authors declare no conflict of interest. The founding sponsors had no role in the design of the study; in the collection, analyses, or interpretation of data; in the writing of the manuscript, and in the decision to publish the results.
References and Notes
- Elsworth, D.; Spiers, C.J.; Niemeijer, A.R. Understanding Induced Seismicity. Science 2016, 354, 1380–1381. [Google Scholar] [CrossRef] [PubMed]
- Peterson, M.D.; Mueller, C.S.; Moschetti, M.P.; Hoover, S.M.; Llenos, A.L.; Ellsworth, W.L.; Michael, A.J.; Rubinstein, J.L.; McGarr, A.F.; Rukstales, K.S. 2016 One-Year Seismic Hazard Forecast for the Central and Eastern United States from Induced and Natural Earthquakes; U.S. Geological Survey: Reston, VA, USA, 2016; p. 52.
- Keranen, K.M.; Savage, H.M.; Abbers, G.A.; Cochran, E.S. Potentially induced earthquakes in Oklahoma, USA: Links between wastewater injection and the 2011 Mw 5.7 earthquake sequence. Geology 2013, 41, 699–702. [Google Scholar] [CrossRef]
- Yeck, W.L.; Hayes, G.P.; McNamara, D.E.; Rubinstein, J.L.; Barnhart, W.D.; Earle, P.S.; Benz, H.M. Oklahoma experiences largest earthquake during ongoing regional wastewater injection hazard mitigation efforts. Geophys. Res. Lett. 2017, 44, 711–717. [Google Scholar] [CrossRef]
- National Earthquake Information Center. Available online: https://earthquake.usgs.gov/contactus/golden/neic.php (accessed on 17 November 2017).
- Vasylkivska, V.S.; Huerta, N.J. Spatiotemporal distribution of Oklahoma earthquakes: Exploring relationships using a nearest-neighbor approach. J. Geophys. Res. Solid Earth 2017, 122, 5395–5416. [Google Scholar] [CrossRef]
- Oklahoma Geological Survey. Available online: http://www.ou.edu/content/ogs.html (accessed on 17 November 2017).
- Murray, K.E.; Holland, A.A. Subsurface Fluid Injection in Oil and Gas Reservoirs and Wastewater Disposal Zones of the Midcontinent. In Proceedings of the AAPG 2014 Annual Convention and Exhibition, Houston, TX, USA, 6–9 April 2014. [Google Scholar]
- McGarr, A. Maximum magnitude earthquakes induced by fluid injection. J. Geophys. Res. Solid Earth 2014, 119, 1008–1019. [Google Scholar] [CrossRef]
- Van der Baan, M.; Calixto, F.J. Human-induced seismicity and large-scale hydrocarbon production in the USA and Canada. Geochem. Geophys. Geosyst. 2017, 18, 2467–2485. [Google Scholar] [CrossRef]
- Murray, K. State-Scale Perspective on Water Use and Production Associated with Oil and Gas Operations, Oklahoma, U.S. Environ. Sci. Technol. 2013, 47, 4918–4925. [Google Scholar] [CrossRef] [PubMed]
- Bao, X.; Eaton, D.W. Fault activation by hydraulic fracturing in western Canada. Science 2016, 354, 1406–1409. [Google Scholar] [CrossRef] [PubMed]
- Wilson, M.P.; Foulger, G.R.; Gluyas, J.G.; Davies, R.J.; Julian, B.R. HiQuake: The Human-Induced Earthquake Database. Seismol. Res. Lett. 2017, 88, 1560–1565. [Google Scholar] [CrossRef]
- Gambolati, G.; Teatini, P. Geomechanics of subsurface water withdrawal and injection. Water Resour. Res. 2015, 51, 3922–3955. [Google Scholar] [CrossRef]
- Holland, A. Earthquakes Triggered by Hydraulic Fracturing in South-Central Oklahoma. Bull. Seismol. Soc. Am. 2013, 103, 1784–1792. [Google Scholar] [CrossRef]
- Chen, X.; Nakata, N.; Pennington, C.; Haffener, J.; Chang, J.C.; He, X.; Zhan, Z.; Ni, S.; Walter, J.I. The Pawnee earthquake as a result of the interplay among injection, faults and foreshocks. Sci. Rep. 2017, 7, 4945. [Google Scholar] [CrossRef] [PubMed]
- Van der Elst, N.J.; Savage, H.M.; Keranen, K.M.; Abers, G.A. Enhanced Remote Earthquake Triggering at Fluid-Injection Sites in the Midwestern United States. Science 2013, 341, 164–167. [Google Scholar] [CrossRef] [PubMed]
- Bamler, R.; Harti, P. Synthetic Aperture Radar Interferometry. Inverse Probl. 1998, 14, R1–R54. [Google Scholar] [CrossRef]
- Massonnet, D.; Feigl, K. Radar interferometry and its application to changes in the Earth’s surface. Rev. Geophys. 1998, 36, 441–500. [Google Scholar] [CrossRef]
- Pepe, A.; Calo, F. A Review of Interferometric Synthetic Aperture RADAR (InSAR) Multi-Track Approaches for the Retrieval of Earth’s Surface Displacements. Appl. Sci. 2017, 7, 1264. [Google Scholar] [CrossRef]
- Ferretti, A.; Prati, C.; Rocca, F. Nonlinear Subsidence Rate Estimation Using Permanent Scatterers in Differential SAR Interferometry. IEEE Trans. Geosci. Remote Sens. 2000, 38, 2202–2212. [Google Scholar] [CrossRef]
- Ferretti, A.; Prati, C.; Rocca, F. Permanent Scatterers in SAR Interferometry. IEEE Trans. Geosci. Remote Sens. 2001, 39, 8–20. [Google Scholar] [CrossRef]
- Berardino, P.; Fornaro, G.; Lanari, R.; Sansosti, E. A New Algorithm for Surface Deformation Monitoring Based on Small Baseline Differential SAR Interferograms. IEEE Trans. Geosci. Remote Sens. 2002, 40, 2375–2383. [Google Scholar] [CrossRef]
- Lanari, R.; Casu, F.; Manzo, M.; Zeni, G.; Berardino, P.; Manunta, M.; Pepe, A. An overview of the small baseline subset algorithm: A DInSAR technique for surface deformation analysis. Pure Appl. Geophys. 2007, 164, 637–661. [Google Scholar] [CrossRef]
- Ferretti, A.; Fumagalli, A.; Novali, F.; Prati, C.; Rocca, F.; Rucci, A. A New Algorithm for Processing Interferometric Data-Stacks: SqueeSAR. IEEE Trans. Geosci. Remote Sens. 2011, 49, 3460–3470. [Google Scholar] [CrossRef]
- Hooper, A. A multi-temporal InSAR method incorporating both persistent scatterer and small baseline approaches. Geophys. Res. Lett. 2008, 35, 1–5. [Google Scholar] [CrossRef]
- Lanari, R.; Mora, O.; Manunta, M.; Mallorqui, J.J.; Berardino, P.; Sansosti, E. A small-baseline approach for investigating deformations on full resolution differential SAR interferograms. IEEE Trans. Geosci. Remote Sens. 2004, 42, 1377–1386. [Google Scholar] [CrossRef]
- Osmanoglu, B.; Sunar, F.; Wdowinski, S.; Cabral-Cano, E. Time series analysis of InSAR data: Methods and trends. ISPRS J. Photogramm. Remote Sens. 2016, 115, 90–102. [Google Scholar] [CrossRef]
- Grandin, R.; Vallee, M.; Lacassin, R. Rupture process of the Oklahoma Mw5.7 Pawnee earthquake from Sentinel-1 InSAR and seismological data. Seismol. Res. Lett. 2017, 88, 994–1004. [Google Scholar] [CrossRef]
- Fielding, E.J.; Sangha, S.S.; Bekaert, D.P.S.; Samsonov, S.V.; Chang, J.C. Surface Deformation of North-Central Oklahoma Related to the 2016 Mw 5.8 Pawnee Earthquake from SAR Interferometry Time Series. Seismol. Res. Lett. 2017, 88, 971–982. [Google Scholar] [CrossRef]
- Pollitz, F.F.; Wicks, C.; Schoenball, M.; Ellsworth, W.; Murray, M. Geodetic Slip Model of the 3 September 2016 Mw 5.8 Pawnee, Oklahoma, Earthquake: Evidence for Fault-Zone Collapse. Seismol. Res. Lett. 2017, 88, 983–993. [Google Scholar] [CrossRef]
- Shirzaei, M.; Ellsworth, W.L.; Tiampo, K.F.; Gonzalez, P.J.; Manga, M. Surface uplift and time-dependent seismic hazard due to fluid injection in eastern Texas. Science 2016, 353, 1416–1419. [Google Scholar] [CrossRef] [PubMed]
- Healy, J.T.; Rubey, W.W.; Griggs, D.T.; Raleigh, C.B. The Denver earthquakes. Science 1968, 161, 1301–1310. [Google Scholar] [CrossRef] [PubMed]
- Talwani, P.L.; Chen, L.; Gahalaut, K. Seismogenic Permeability, ks. J. Geophys. Res. Solid Earth 2007, 112. [Google Scholar] [CrossRef]
- Oklahoma Corporation Commission. Available online: http://www.occeweb.com/index.html (accessed on 5 October 2017).
- Solutions, Harris Geospatial ENVI SARScape, 5.4; Broomfield, CO, USA.
- Ghulam, A.; Porton, I.; Freeman, K. Detecting subcanopy invasive plant species in tropical rainforest by integrating optical and microwave (InSAR/PolInSAR) remote sensing data, and a decision tree algorithm. ISPRS J. Photogramm. Remote Sens. 2014, 88, 174–192. [Google Scholar] [CrossRef]
- Ghulam, A.; Grzovic, M.; Maimaitijiang, M.; Sawut, M. InSAR Monitoring of Land Subsidence for Sustainable Urban Planning; CRC Press: Boca Raton, FL, USA, 2015. [Google Scholar]
- Goldstein, R.M.; Werner, C.L. Radar interferogram filtering for geophysical applications. Geophys. Res. Lett. 1998, 25, 4035–4038. [Google Scholar] [CrossRef]
- Lauknes, T.R.; Shanker, P.A.; Dehls, J.F.; Zebker, H.A.; Henderson, I.H.C.; Larsen, Y. Detailed rockslide mapping in northern Norway with small baseline and persistent scatterer interferometric SAR time series methods. Remote Sens. Environ. 2010, 114, 2097–2109. [Google Scholar] [CrossRef]
- Costantini, M.; Falco, S.; Malvarosa, F.; Minati, F. A New Method for Identification and Analysis of Persistent Scatterers in Series of SAR Images. In Proceedings of the IEEE International Geoscience and Remote Sensing Symposium, Boston, MA, USA, 7–11 July 2008; p. 2. [Google Scholar] [CrossRef]
- Hooper, A.; Zebker, H.A. Phase unwrapping in three dimensions with application to InSAR time series. J. Opt. Soc. Am. A 2007, 24, 2737–2747. [Google Scholar] [CrossRef]
- SARMAP GCP Manual. Available online: http://www.sarmap.ch/tutorials/GCP_Manual.pdf (accessed on 4 August 2017).
- Grzovic, M.; Ghulam, A. Monitoring residual land subsidence due to underground coal mining using TimeSAR (SBAS and PSI) in Springfiled, Illinois, USA. Nat. Hazards 2015, 79, 1739–1751. [Google Scholar] [CrossRef]
- Abir, I.A.; Khan, S.D.; Ghulam, A.; Tariq, S.; Shah, M.T. Active tectonics ofwestern Potwar Plateau–Salt Range, northern Pakistan from InSAR observations and seismic imaging. Remote Sens. Environ. 2015, 168, 265–275. [Google Scholar] [CrossRef]
- Abliz, A.; Tiyip, T.; Ghulam, A.; Ding, J.-L.; Halik, Ü.; Sawut, M.; Fei, Z.; Nurmemet, I.; Abliz, A. Effects of shallow groundwater table and salinity on soil salt dynamics in the Keriya Oasis, Northwestern China. Environ. Earth Sci. 2016, 75, 260. [Google Scholar] [CrossRef]
- SARMAP SBAS Tutorial. Available online: http://www.sarmap.ch/tutorials/sbas_tutorial_V_2_0.pdf (accessed on 4 August 2017).
- Holland, A.A. Preliminary Fault Map of Oklahoma; Oklahoma Geological Survey: Norman, OK, USA, 2015. [Google Scholar]
- McNamara, D.E.; Benz, H.M.; Herrmann, R.B.; Bergman, E.A.; Earle, P.; Holland, A.; Baldwin, R.; Gassner, A. Earthquake hypocenters and focal mechanisms in central Oklahoma reveal a complex system of reactivated subsurface strike-slip faulting. Geophys. Res. Lett. 2015, 42, 2742–2749. [Google Scholar] [CrossRef]
- Joseph, L. Subsurface analysis, “Cherokee” Group (Des Monesian), portions of Lincoln, Pot-tawatomie, Seminole, and Okfuskee Counties, Oklahoma. Shale Shaker 1987, 12, 44–69. [Google Scholar]
- Luza, K.V.; Lawson, J.E.J. Seismicity and Tectonic Relationships of the Nemaha Uplift in Oklahoma, Part IV; Oklahoma Geological Survey: Norman, OK, USA, 1982; Volume 82-1, p. 52. [Google Scholar]
- Bennison, A. The Cushing Field, Creek County, Oklahoma; Tulsa Geological Society Digest: Tulsa, OK, USA, 1964; p. 158. [Google Scholar]
- Northcutt, R.A.; Campbell, J.A. Geological Provinces of Oklahoma; Survey, O.G., Ed.; Springer: Dordrecht, The Netherlands, 1995; Volume OF5-85. [Google Scholar]
- Dolton, G.L.; Finn, T.M. Petroleum Geology of the Nemaha Uplift-Central Midcontinent; U.S. Geological Survey: Reston, VA, USA, 1989; p. 39.
- Stoeser, D.B.; Green, G.N.; Morath, L.C.; Heran, W.D.; Wilson, A.B.; Moore, D.W.; Van Gosen, B.S. Preliminary Integrated Geologic Map Databases for the United States Central States: Montana, Wyoming, Colorado, New Mexico, Kansas, Oklahoma, Texas, Missouri, Arkansas, and Louisiana; Open File Report 2005-1351; U.S. Geological Survey: Reston, VA, USA, 2005.
- McNamara, D.E.; Rubinstein, J.L.; Myers, E.; Smoczyk, G.; Benz, H.M.; Williams, R.A.; Hayes, G.; Wilson, D.; Herrmann, R.; McMahon, N.D.; et al. Efforts to monitor and characterize the recent increasing seismicity in central Oklahoma. Lead. Edge 2015, 34, 628–639. [Google Scholar] [CrossRef]
- Way, H.S.K. Structural Study of the Hunton Lime of the Wilzetta Field, T12–13N, R5E, Lincoln County, Oklahoma, Pertaining to the Exploration for Hydrocarbons; Oklahoma State University: Stillwater, OK, USA, 1983. [Google Scholar]
- Sumy, D.F.; Cochran, E.S.; Keranen, K.M.; Wei, M.; Abers, G.A. Observations of static Coulomb stress triggering of the November 2011 M5.7 Oklahoma earthquake sequence. J. Geophys. Res. Solid Earth 2014, 119, 1904–1923. [Google Scholar] [CrossRef]
- Oklahoma Corporation Commission Well Data System. Available online: http://www.occpermit.com/wellbrowse/ (accessed on 17 November 2017).
- McMahon, N.D.; Aster, R.C.; Yeck, W.L.; McNamara, D.E.; Benz, H.M. Spatiotemporal evolution of the 2011 Prague, Oklahoma, aftershock sequence revealed using subspace detection and relocation. Geophys. Res. Lett. 2017, 44, 7149–7158. [Google Scholar] [CrossRef]
- Davis, S.D.; Frohlich, C. Did (or will) Fluid Injection Cause Earthquakes?-Criteria for a Rational Assessment. Seismol. Res. Lett. 1993, 64, 207–224. [Google Scholar]
- Sumy, D.F.; Neighbors, C.J.; Cochran, E.S.; Keranen, K.M. Low stress drops observed for aftershocks of the 2011 Mw 5.7 Prague, Oklahoma, earthquake. J. Geophys. Res. Solid Earth 2017, 122, 3813–3834. [Google Scholar] [CrossRef]
- McNamara, D.E.; Hayes, G.P.; Benz, H.M.; Williams, R.A.; McMahon, N.D.; Aster, R.C.; Holland, A.; Sickbert, T.; Herrmann, R.; Briggs, R.; et al. Reactivated faulting near Cushing Oklahoma: Increased potential for a triggered earthquake in an area of United States strategic infrastructure. Geophys. Res. Lett. 2015, 42, 17. [Google Scholar] [CrossRef]
- Hudnut, K.W.; Seeber, L.; Pacheco, J. Cross-fault triggering in the November 1987 Superstition Hills earthquake sequence, Southern California. Geophys. Res. Lett. 1989, 16, 199–202. [Google Scholar] [CrossRef]
Figure 1.
Study Location. Synthetic Aperture Radar Interferometry (InSAR) processed frames shown in blue and purple.
Figure 1.
Study Location. Synthetic Aperture Radar Interferometry (InSAR) processed frames shown in blue and purple.
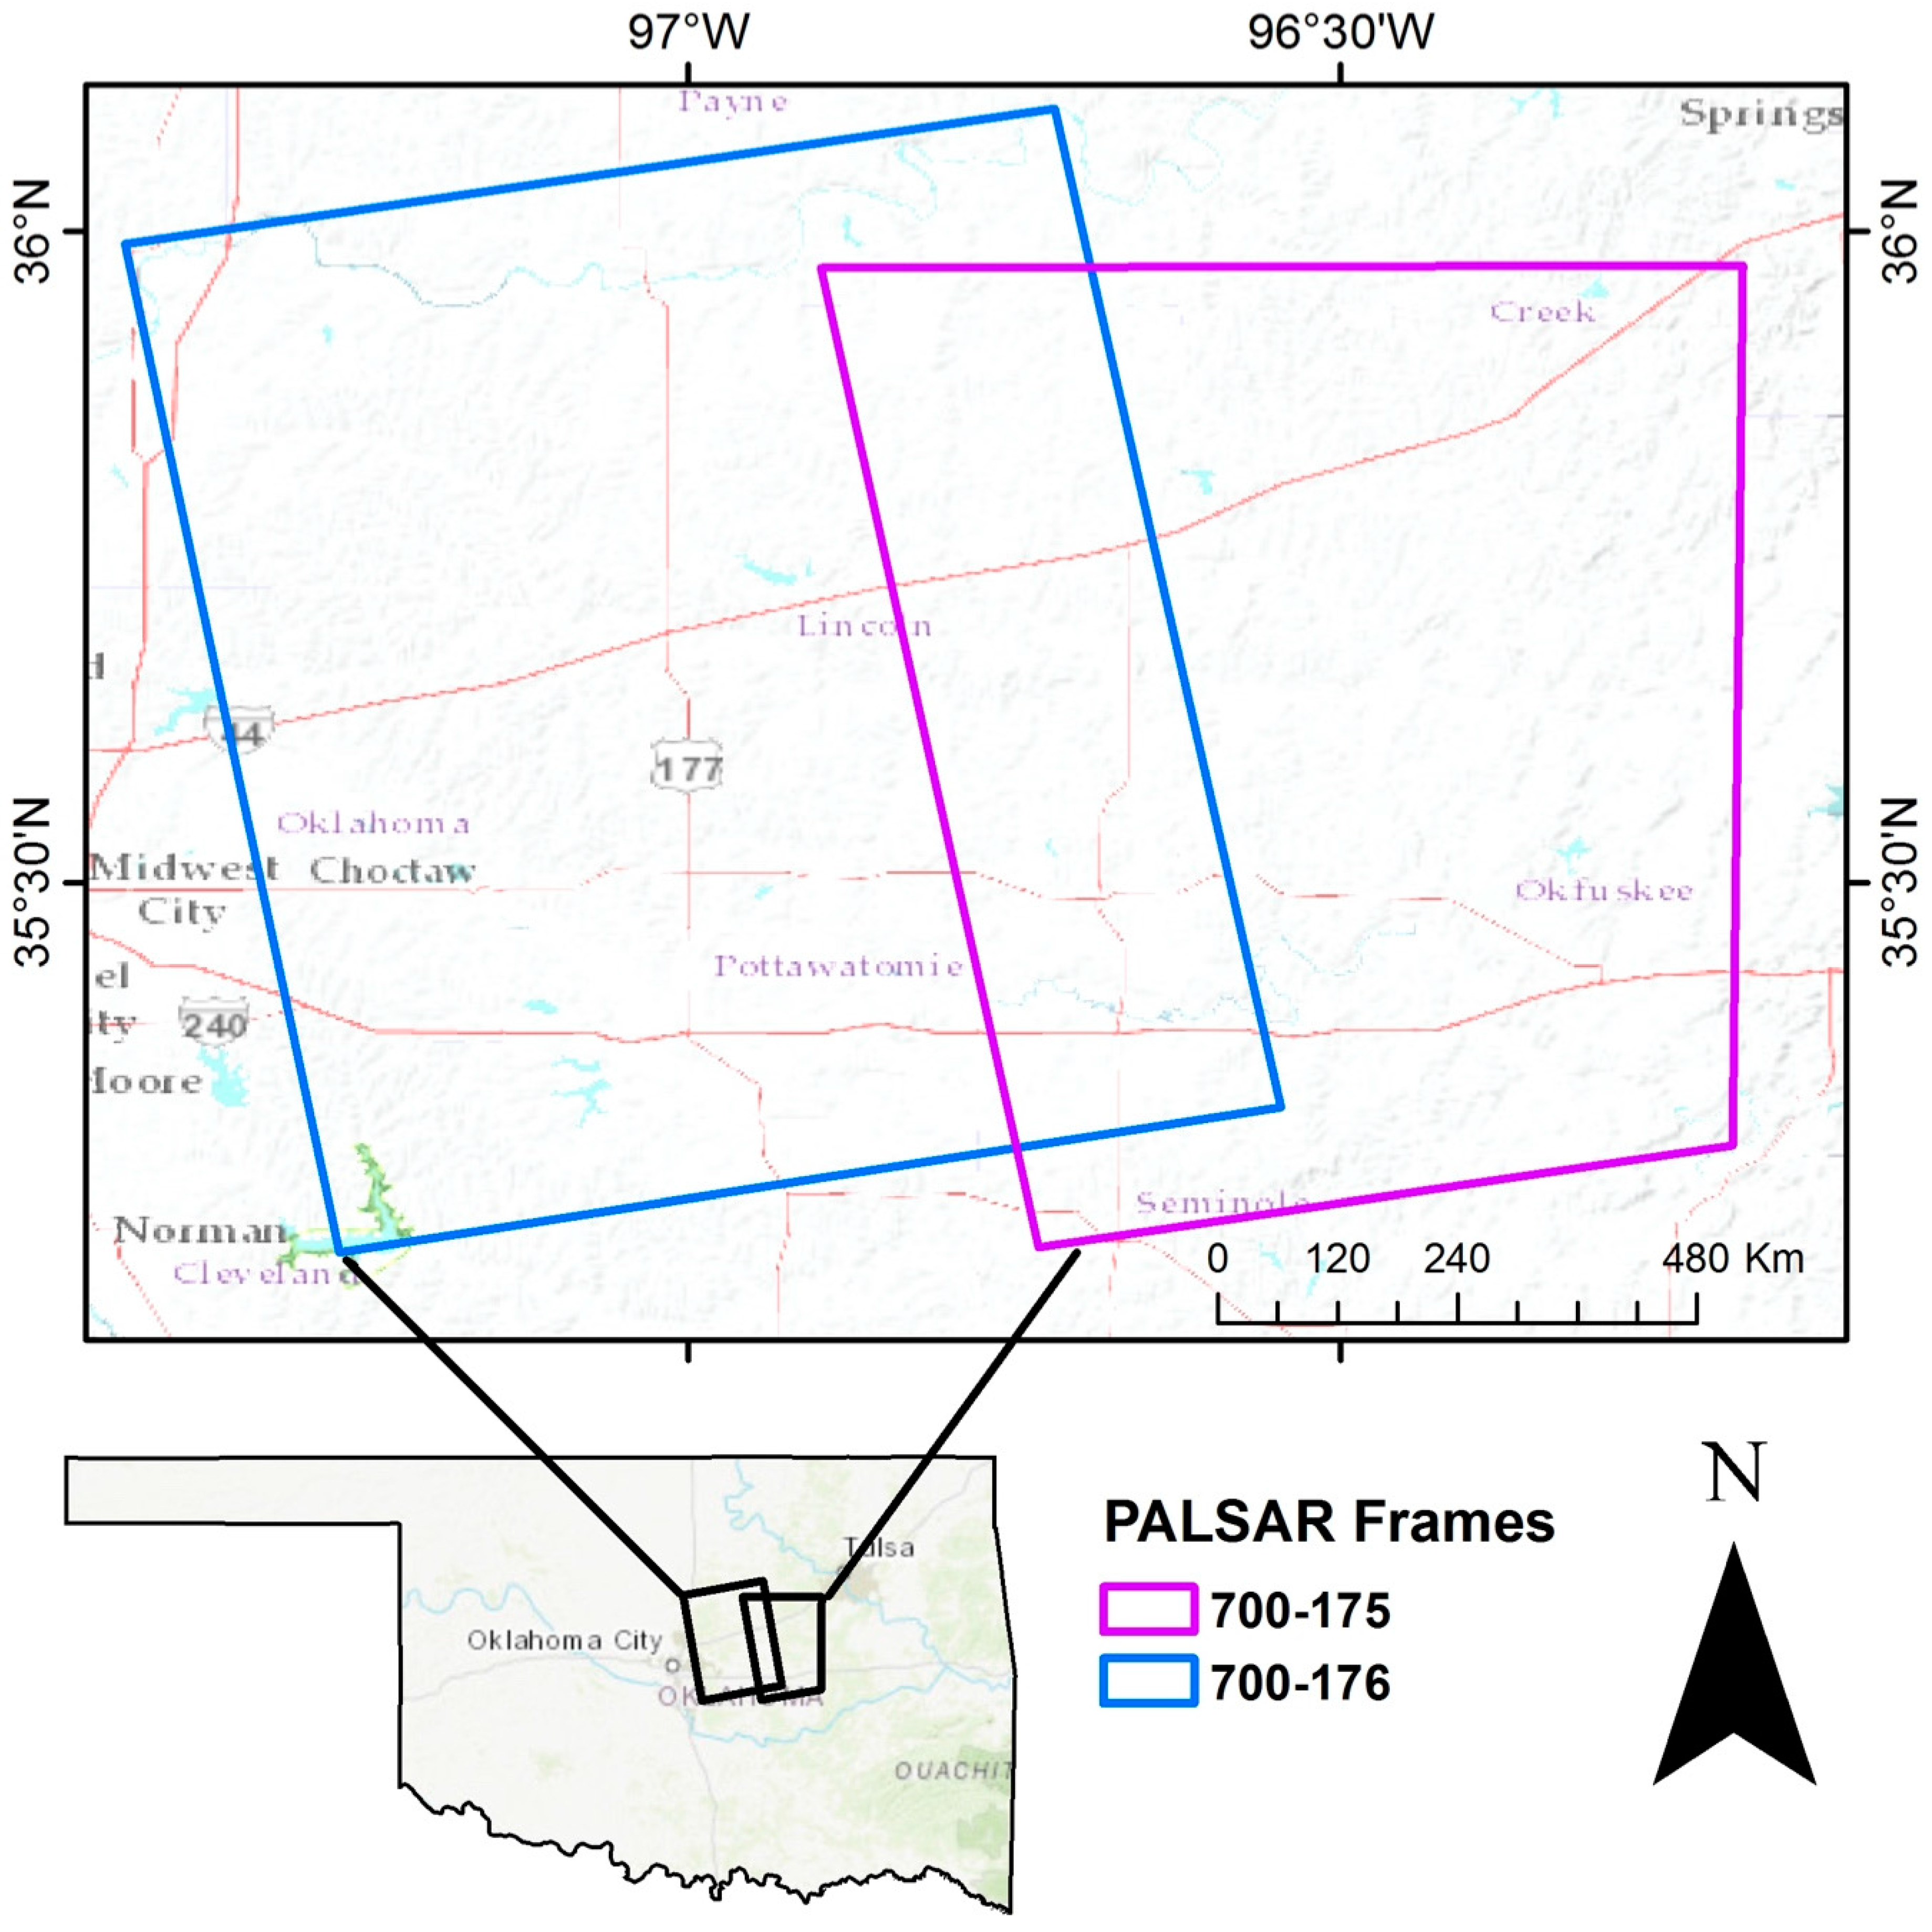
Figure 2.
Earthquakes 2.9 Mw or larger shown by year for the time period of InSAR analysis. Processed InSAR frames shown in blue. This time series analysis covers a period of relative seismic quietude (2006) up through significant increase in seismicity (2011).
Figure 2.
Earthquakes 2.9 Mw or larger shown by year for the time period of InSAR analysis. Processed InSAR frames shown in blue. This time series analysis covers a period of relative seismic quietude (2006) up through significant increase in seismicity (2011).

Figure 3.
Earthquakes in Oklahoma from 1990 to December 2016 [5].
Figure 3.
Earthquakes in Oklahoma from 1990 to December 2016 [5].

Figure 4.
Regional Deformation and auxiliary Shapefiles of 2.9 Mw or larger earthquakes for InSAR analysis time frame, faults, and 2011 injection well inventory. Insert shows location of processed InSAR frames. All deformation is measured in Line of Sight (LOS). Negative values represent movement away from the satellite, whereas positive values indicate movement towards the satellite.

Figure 5.
Regional Deformation and injection well volumes for 2011. Injection well fluid volume is shown in barrels of fluid over InSAR regional deformation. All deformation is measured in LOS. Negative values represent movement away from the satellite, whereas positive values indicate movement towards the satellite.

Figure 6.
Location of Areas of Interest with relation to regional deformation final map highlighted in red. (1) City of Cushing, Oklahoma; (2) Wilzetta Fault Zone; (3) Area southeast of Drumright, Oklahoma. All deformation is measured in LOS. Negative values represent movement away from the satellite, whereas positive values indicate movement towards the satellite.

Figure 7.
Area of Interest One-Cushing, Oklahoma: (a) Results of InSAR analysis showing total deformation for the timeframe of 2006–2011; (b) Horizontal depiction of total deformation along profile line A-A’; (c) Time series analysis for city of Cushing, Oklahoma. All deformation is measured in LOS. Negative values represent movement away from the satellite, whereas positive values indicate movement towards the satellite.

Figure 8.
Area of Interest Two- Wilzetta Fault Zone, Meeker–Prague Fault Splay. Figure shows total deformation for InSAR analysis from 2006–2011. Location of faults in black, injection well inventory in grey, and 2.9 Mw or greater earthquakes in red. Earthquake data is for the time period coincident with InSAR analysis. All deformation is measured in LOS. Negative values represent movement away from the satellite, whereas positive values indicate movement towards the satellite.

Figure 9.
Area of Interest Three-Southeast of Drumright, Oklahoma. (a) Results of InSAR analysis showing total deformation for the timeframe of 2006–2011; (b) Horizontal depiction of total deformation along profile line A-A’; (c) Time series analysis for the area southeast of Drumright, OK. All deformation is measured in LOS. Negative values represent movement away from the satellite, whereas positive values indicate movement towards the satellite.


Table 1.
Advanced Land Observing Satellite/ Phased Array L-Band SAR (ALOS/PALSAR) Acquisitions.
| Path | Frame 1 | Acquisition Date |
|---|---|---|
| 175 | 700 | 26 December 2006 |
| 175 | 700 | 11 May 2007 |
| 175 | 700 | 26 September 2007 |
| 175 | 700 | 27 December 2007 |
| 175 | 700 | 28 June 2008 |
| 175 | 700 | 29 December 2008 |
| 175 | 700 | 1 October 2009 |
| 175 | 700 | 19 May 2010 |
| 175 | 700 | 4 July 2010 |
| 175 | 700 | 19 November 2010 |
| 175 | 700 | 4 January 2011 |
| 176 | 700 | 13 July 2007 |
| 176 | 700 | 13 October 2007 |
| 176 | 700 | 13 January 2008 |
| 176 | 700 | 30 May 2008 |
| 176 | 700 | 15 January 2009 |
| 176 | 700 | 5 June 2010 |
| 176 | 700 | 21 July 2010 |
| 176 | 700 | 5 September 2010 |
| 176 | 700 | 6 December 2010 |
| 176 | 700 | 21 January 2011 |
1 All acquisitions in Ascending Mode.
© 2018 by the authors. Licensee MDPI, Basel, Switzerland. This article is an open access article distributed under the terms and conditions of the Creative Commons Attribution (CC BY) license (http://creativecommons.org/licenses/by/4.0/).
Share and Cite
MDPI and ACS Style
Loesch, E.; Sagan, V. SBAS Analysis of Induced Ground Surface Deformation from Wastewater Injection in East Central Oklahoma, USA. Remote Sens. 2018, 10, 283. https://doi.org/10.3390/rs10020283
AMA Style
Loesch E, Sagan V. SBAS Analysis of Induced Ground Surface Deformation from Wastewater Injection in East Central Oklahoma, USA. Remote Sensing. 2018; 10(2):283. https://doi.org/10.3390/rs10020283
Chicago/Turabian StyleLoesch, Elizabeth, and Vasit Sagan. 2018. "SBAS Analysis of Induced Ground Surface Deformation from Wastewater Injection in East Central Oklahoma, USA" Remote Sensing 10, no. 2: 283. https://doi.org/10.3390/rs10020283
Note that from the first issue of 2016, this journal uses article numbers instead of page numbers. See further details here.