1. Introduction
Forest fires are a natural phenomenon that have regulated the evolution of ecosystems for millennia [
1,
2]. Many vegetation communities have developed as a response to fires, which has led to a higher abundance of species-richness in burned ecosystems [
3]. However, as humans started to change the fauna and flora of the environment, and set artificial fires, wildfires have become one of the most devastating natural hazards worldwide. They destroy environment and property, threaten lives, and contribute to global warming [
4,
5,
6,
7,
8,
9,
10,
11,
12,
13,
14]. Often, vegetation fires occur in remote areas which complicate their detection, mapping, and suppression. Hence, medium resolution satellites are currently the only solution to frequently map burnt areas and quantify the burnt biomass at regional to global scales. However, it is not only ongoing observation that is relevant; for a detailed understanding of fire ecosystems, terrestrial-atmospheric interactions, and the impact of wildfires on global change, it is of utmost importance to map historical fire events accurately, reliably, objectively, and consistently [
15]. Thus, the Advanced Very High-Resolution Radiometer (AVHRR) on board the National Oceanic and Atmospheric Administration’s (NOAA) polar orbiting satellites represents a unique data source, as satellite images are available from 1978/1980 onwards and their spatial resolution and spectral capabilities are suitable for mapping burnt areas. Since the launch of the first AVHRR sensor with TIROS-N in 1978, this sensor has been launched onboard a long series of satellites (NOAA-1 to NOAA-19, Met-OP-A).
The goal of the TIMELINE project (“Time Series Processing of Medium Resolution Earth Observation Data Assessing Long-Term Dynamics in our Natural Environment”) lies in acquiring a consistent database of burnt areas in Europe for a period of more than 30 years. These data could be important for various research fields, e.g., climate change analysis, atmospheric chemistry, forest management and ecosystem functioning, survey and wildlife management.
1.1. Issues of Burnt Area Mapping
A general problem of Earth Observation (EO) by means of optical remote sensing sensors is obscuration by clouds. AVHRR contains some weaknesses for burnt area mapping, as the sensor was originally designed primarily for weather surveillance and sea surface temperature monitoring. The wide scan angle (±55°) causes degradation in spatial resolution from 1.1 km at nadir up to 2.5 km × 7 km to the scene margins. A disadvantage of AVHRR compared to more modern EO sensors, such as Moderate Resolution Imaging Spectroradiometer (MODIS), Landsat, Sentinel-2, and Sentinel-3, is the missing Short Wave Infrared (SWIR) band, which is very well suited for burnt area mapping. Therefore, as described in
Section 2 in more detail, the AVHRR-based burnt area mapping is only based on the red and the Near Infrared (NIR) channels.
Orbital drift causes variations in AVHRR observations with respect to solar position [
16]. Channel degradation over time causes decreases in measurement precision [
17]. However, problems regarding orbital drift and channel degradation could be minimized within the TIMELINE project [
18,
19,
20].
One requirement within this project is the mapping of the spatial coverage across the whole of Europe within frequent time intervals, which is very well archived by AVHRR, exhibiting an appropriate relationship between coverage and spatial resolution. In addition, AVHRR sensors have been in orbit since 1978/1980, which provide the longest and most consistent time-series available. AVHRR is the only sensor that provides a daily coverage of the entire continent of Europe since that time. Thus, only AVHRR data enable a continuous analysis over such a long time period. Comparable data of sensors such as MODIS became available about 20 years later (the first MODIS sensor was launched on TERRA in December 1999).
1.2. Methods for Burnt Area Mapping by Means of AVHRR Imagery
The Normalized Difference Vegetation Index (NDVI) is a proxy for the site’s vegetation density and greenness [
21,
22,
23,
24] (Equation (1)). A fire event destroys the vegetation and therefore also decreases the NDVI. In the past, a series of studies were published which make use of the decrease of the NDVI for burnt area mapping. Thereby, the difference of the NDVI of a scene acquired before the fire event and of another AVHRR image acquired after the fire event is computed (cf. Equation (3)). For instance, the authors of reference [
25] computed 15-day NDVI composite differences; the authors of reference [
26] used a differencing of a 10-day NDVI maximum regression; the authors of reference [
27,
28] combined a 10-day NDVI composite differencing with active fire detection; and the authors of reference [
29] used a similar approach as Reference [
27], but they used only post event scenes for burnt area mapping.
Other authors used daily 5-km imagery analysis of reflectance, brightness temperature, and vegetation index changes for burnt scar mapping (e.g., [
30,
31]). The authors of reference [
32] combined active fire detection with a neural network classification scheme for burnt area mapping.
The authors of reference [
33] compared different indices for burnt scar detection: the aforementioned NDVI, the Soil Adjusted Vegetation Index (SAVI), the Global Environmental Monitoring Index (GEMI), and the Burnt Area Index (BAI) (Equation (4)). The latter showed the highest performance for burnt area mapping. The authors of reference [
34] combined absolute and relative radiometric thresholds with a Bayesian network classifier and neighborhood analysis for spatial fire coherence to perform a burnt area mapping in Canada for the time period of 1984 to 1999.
1.3. The TIMELINE Project
This study presents a fully automated Level 3 (L3) burnt area mapping algorithm for analysis of AVHRR imagery. L3 means that the AVHRR images are projected from the satellite’s orbit geometry into a map projection. The coordinate reference system ETRS89-LAEA Europe, used as this map projection, is very well suited for the entirety of Europe, which is the study area of the TIMELINE project. This coordinate reference system is also known in the EPSG Geodetic Parameter Dataset under the identifier EPSG:3035. The Geodetic Datum is the European Terrestrial Reference System 1989 (EPSG:6258). The Lambert Azimuthal Equal Area (LAEA) projection is centered at 10°E, 52°N. Coordinates are based on a false Easting of 4,321,000 m, and a false Northing of 3,210,000 m. The study area of the TIMELINE project is the same as the area of the European Environmental Agency (EEA) reference grid: 900,000 m East, 900,000 m North to 7,400,000 m East, 5,500,000 m North.
The developed burnt area mapping algorithm is part of the German Aerospace Center’s (DLR) TIMELINE project, which aims to develop an operational processing and data management environment to reprocess 30 years of NOAA-AVHRR raw data into L1b, L2, and L3 products on the basis of 1.1-km High-Resolution Picture Transmission (HRPT) and Local Area Coverage (LAC) data of the European continent, as well as offer these products online to a wider community using a free and open data policy. Therefore, an enhanced preprocessing by taking into account geometric distortions due to rotation and satellite clock errors, varying spectral responses of different AVHRR sensors, calibration drift, orbit drift, sensor degradation, and atmospheric correction is performed [
18,
19,
20]. The consistency of calibrated reflectance and thermal information is highly required for time series analysis as planned within TIMELINE [
35,
36]. Moreover, enhanced cloud, water, snow masks, and land use/land cover products are developed based on accurate and continuous L1b products. Currently, preprocessed (top of atmosphere reflectances) map-projected L1b AVHRR data are used as input for the burnt area mapping processor [
18,
19,
20]. However, the project is ongoing, and the preprocessing and derivation of L2 and L3 products is not yet finished. When available in the future, better preprocessed AVHRR imagery, e.g., bottom of atmosphere and BRDF (bidirectional reflectance distribution function) corrected reflectances as well as enhanced cloud and water masks will be used as input for the burnt area processor. This will improve the burnt area product. This study presents a detailed description of the current state of the L3 burnt area product.
2. Materials and Methods
2.1. Study Sites and Data
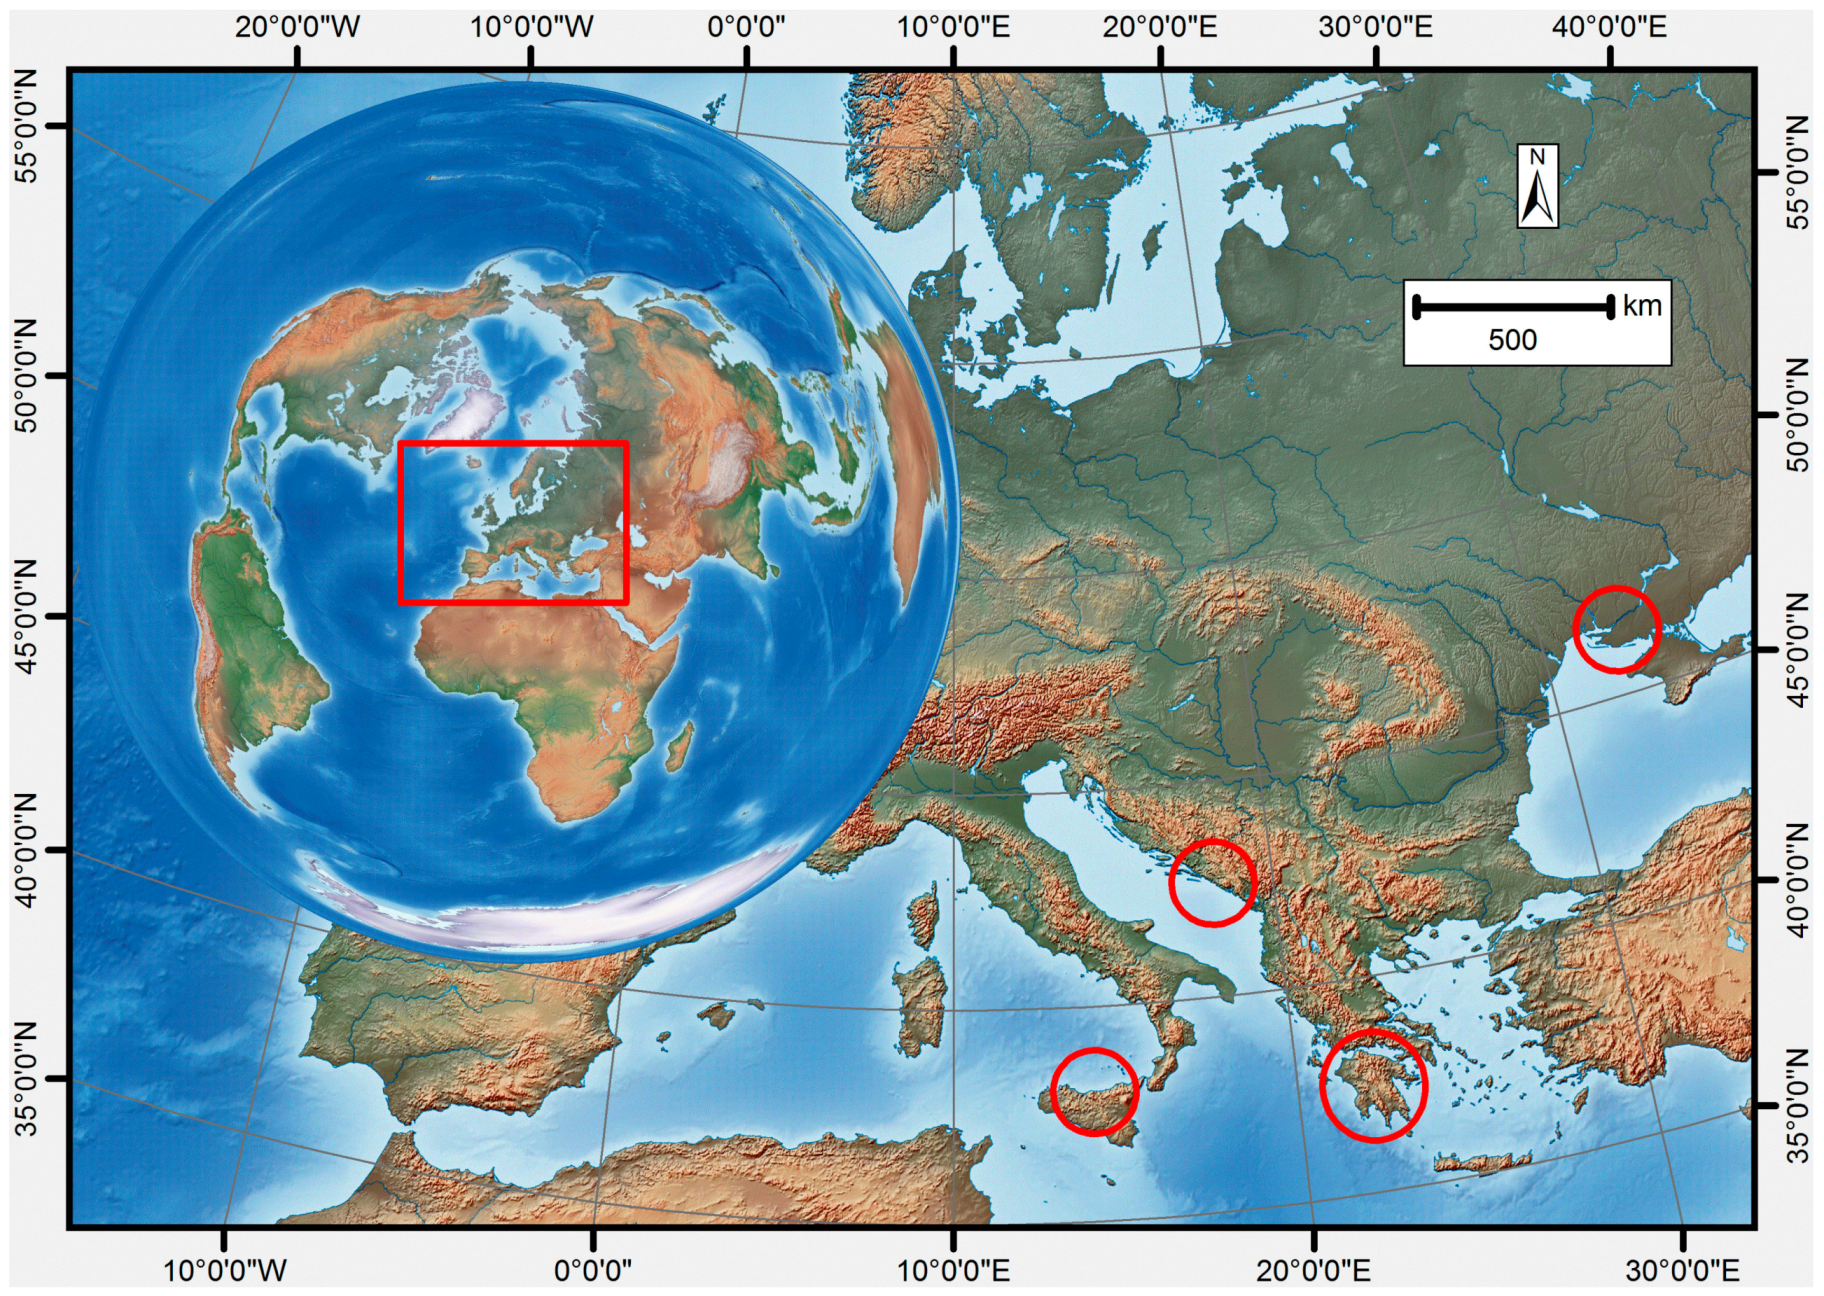
Europe offers a high diversity of ecosystems including temperate steppe, Mediterranean forest, temperate broadleaf forest, montane forest, tundra, alpine tundra, and taiga. The main natural vegetation cover is mixed forest, such as the cork oak, holm oak, kermes oak, and pine forests; the scrub forest, olive trees, conifers, and cypresses of the Mediterranean, the mixed rainforests of the Caucasus, the taiga (mixed spruce-pine-birch forest) of Scandinavia and Russia, beech and oak in central and western Europe, and mixed forest with broadleaf and coniferous trees in temperate Europe. The high biodiversity is a result of diverse climates. With the exception of the Far East coast, precipitation decreases to the north and east. Thus, whilst Eastern Europe has a drier, continental climate, Western Europe has an oceanic climate. Parts of the central European plains have a hybrid oceanic/continental climate. The Mediterranean Basin is influenced by a warm maritime climate, with wet and mild winters and dry and hot summers. These conditions make the Mediterranean prone to forest fires, primarily in the late summer months, when the vegetation suffers from water stress.
The test sites where the burnt area mapping processor was validated are located in four European regions: Sicily, Greece, Croatia, and Hungary (
Figure 1,
Table 1).
The red band (channel 1, wavelength λ: 0.58–0.68 µm) and the NIR band (channel 2: λ: 0.725–1.1 µm) are used within the proposed burnt area mapping procedure. Consequently, only AVHRR day-time acquisitions are relevant for this study.
2.2. Method
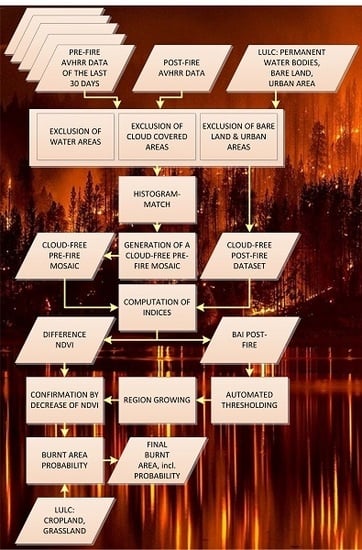
The required input parameters of the developed burnt area mapping procedure (
Figure 2) are (I) an AVHRR scene acquired during or after the fire event (post-fire), (II) a series of pre-event AVHRR acquisitions of the 30 days prior to the fire event, and (III) a land use land cover classification (LULC) [
37].
The first step of the process is the masking of clouds and water bodies based on the LULC mapping, and as given in Reference [
38].
Next, a cloud-free pre-fire mosaic based on the pre-fire AVHRR scenes of the 30 days prior to the fire event is generated. Thereby, the most recent pre-fire scene (t0) is used as a base, and step by step all cloudy areas of this scene are filled with useful (cloud-free) information from the next available AVHRR scene (t-1) that is cloud-free at the corresponding pixels. In this way, a cloud-free pre-fire mosaic is generated based on the successive replacement of the cloudy parts of the AVHRR scene t0 with values from cloud-free pixels of the AVHRR scenes t-1, t-2, t-3, …, t-n.
Prior to the generation of the pre-fire mosaic, a histogram match of all AVHRR scenes was performed to guarantee suitable values in the final generated mosaic without outliers, which could affect the change detection procedure described below.
Then, the cloud and water masks were applied to exclude these pixels from the AVHRR post-fire scene as described above.
The following indices were then calculated (Equations (1)–(4)):
with
Ch1,
Ch2 AVHRR channels 1 (red) and 2 (NIR), NDVI and
BAI. The NDVI is a proxy for the site’s vegetation density and greenness [
21,
22,
23,
24]. A fire event decreases the
NDVI. The
BAI is very well suited for the detection of fresh burn scars [
33].
One requirement of the developed processor is that it is fully automated. Therefore, an automated thresholding of the indices described above is necessary. Within an empirical testing of a series of methodologies, two thresholding techniques showed the best performance: The OTSU method, developed by Reference [
39], and the Maximum Entropy (ME) method, proposed by Reference [
40]. The BAI derived from the post-fire AVHRR scene is used as input for the automated thresholding. Because the OTSU thresholding is more conservative (underestimation of the burnt areas), the resulting OTSU burnt area pixels are then used as seed pixels to perform a region growing into neighboring pixels, which were classified as burnt area by the ME thresholding method.
Finally, the detected burnt area pixels are assigned to different probability levels according to the following criteria:
The detected burnt area pixel is within a 3 × 3 pixel neighborhood of clouds and within a 5 × 5 pixel neighborhood of water.
The burnt area is only detected by the automated thresholding based on the BAI, as described above. Furthermore, there are no clouds or water pixel within a 3 × 3 or 5 × 5 pixel neighborhood, respectively.
In addition to the criteria described in (2.), the detected burnt area is also confirmed by the decrease of the NDVI by comparing the pre-fire mosaic and the post-fire AVHRR scene (cf. Equation (3)).
In addition to the criteria described in (3.), the detected burnt area is not within the LULC class “cropland”. As agricultural land shows strong changes over time (e.g., growth of vegetation, harvest), there is a high probability of false classification of burnt area in these areas.
In addition to the criteria described in (4.), the detected burnt area is not within the LULC class “grassland”, i.e., the burnt area is detected within forest areas only.
2.3. Validation Procedure
The burnt area mapping processor was tested at four different European study sites, as described in
Section 2.1. The MODIS burnt area product MCD64 [
41] was used as a reference. Real ground truth data was not available for the sites analyzed. However, for two study sites, Greece and the Ukraine, cloud-free high spatial resolution (30 m) imagery from Landsat-7 Enhanced Thematic Mapper Plus (ETM+), acquired shortly after the fire event, were available. For the other two test sites, Sicily and Croatia, the first available cloud-free scenes of Landsat-5 or Landsat-7 were acquired several months after the fire event when the vegetation at the formerly burnt areas had already partially recovered. Consequently, a meaningful validation with Landsat-7 imagery was only possible at the Greece and Ukraine study sites. The burnt areas were derived by visual interpretation and manual digitalization from the Landsat-7 scenes. Distortions due to the failure of the Scan Line Corrector (SLC-off effect) were corrected during this manual process.
All areas that were covered by clouds in the AVHRR post-fire scene were excluded from the reference datasets, as at these areas no burn scars can be detected by the AVHRR processor. The burnt areas analyzed in this study all occurred in forest areas and all classified burnt areas fulfil the criteria for probability level 5 (cf.
Section 2.2).
Two kinds of accuracy assessments were performed. First, within an area-based approach, the area of the burn scar detected by the reference (MODIS MCD64 or Landsat-7) and the area detected by the developed AVHRR processor were compared. Second, the number of detected burn scar polygons by AVHRR were compared with the number of the reference burn scar polygons.
The area-based accuracy assessment was performed by comparing within each study site the area of the classified burn scars with the area of the reference burn scars in an error matrix. The results of this error matrix are the overall accuracy (OA), the producer’s accuracy (PA) of burnt and of unburnt area, the user’s accuracy (UA) of burnt and of unburnt area, and the Cohen’s Kappa, which is based on Reference [
42]. The PA is a measure of omission error and is computed by dividing the area of the correct classification of a class (burnt area or unburnt area) by the entire area of the corresponding reference class. The UA is a measure of commission error and is computed by dividing the area of the correct classification of a class by the entire area of the classification. The Cohen’s Kappa gives information about the difference of the classification result from a random selection.
The count-based accuracy assessment was performed by comparing for each study site the number of classified burnt area polygons, the number of the reference burnt area polygons, and the number of polygons where the classification matches the reference. Based on this, the percentage of correct classification, of overestimation, and of underestimation were computed.
3. Results
3.1. Validation with MODIS MCD64 Burnt Area Product
This section describes the validation based on the MODIS burnt area product MCD64 [
41] with a spatial resolution of 500 m.
Table 2 and
Table 3 show the results of the area-based and the count-based accuracy assessments, respectively.
For the three study sites of Greece, Sicily, and Croatia, the relatively high UA shows that there is almost no overestimation of the AVHRR classified burnt area compared to the MODIS reference. In the Ukraine, there is a much greater level of overestimation. The PA in all four cases is not very high. In the best cases, Greece and Croatia, almost half of the reference burnt area was detected by the classification. The overall accuracy values are 90% or higher. However, as we have a two-class problem, and the area of the unburnt pixels is much higher than the burnt area, the UA and PA values of the unburnt area are always very high and, consequently, so is the overall accuracy. Therefore, the overall accuracy and UA and PA of the unburnt area are not meaningful parameters.
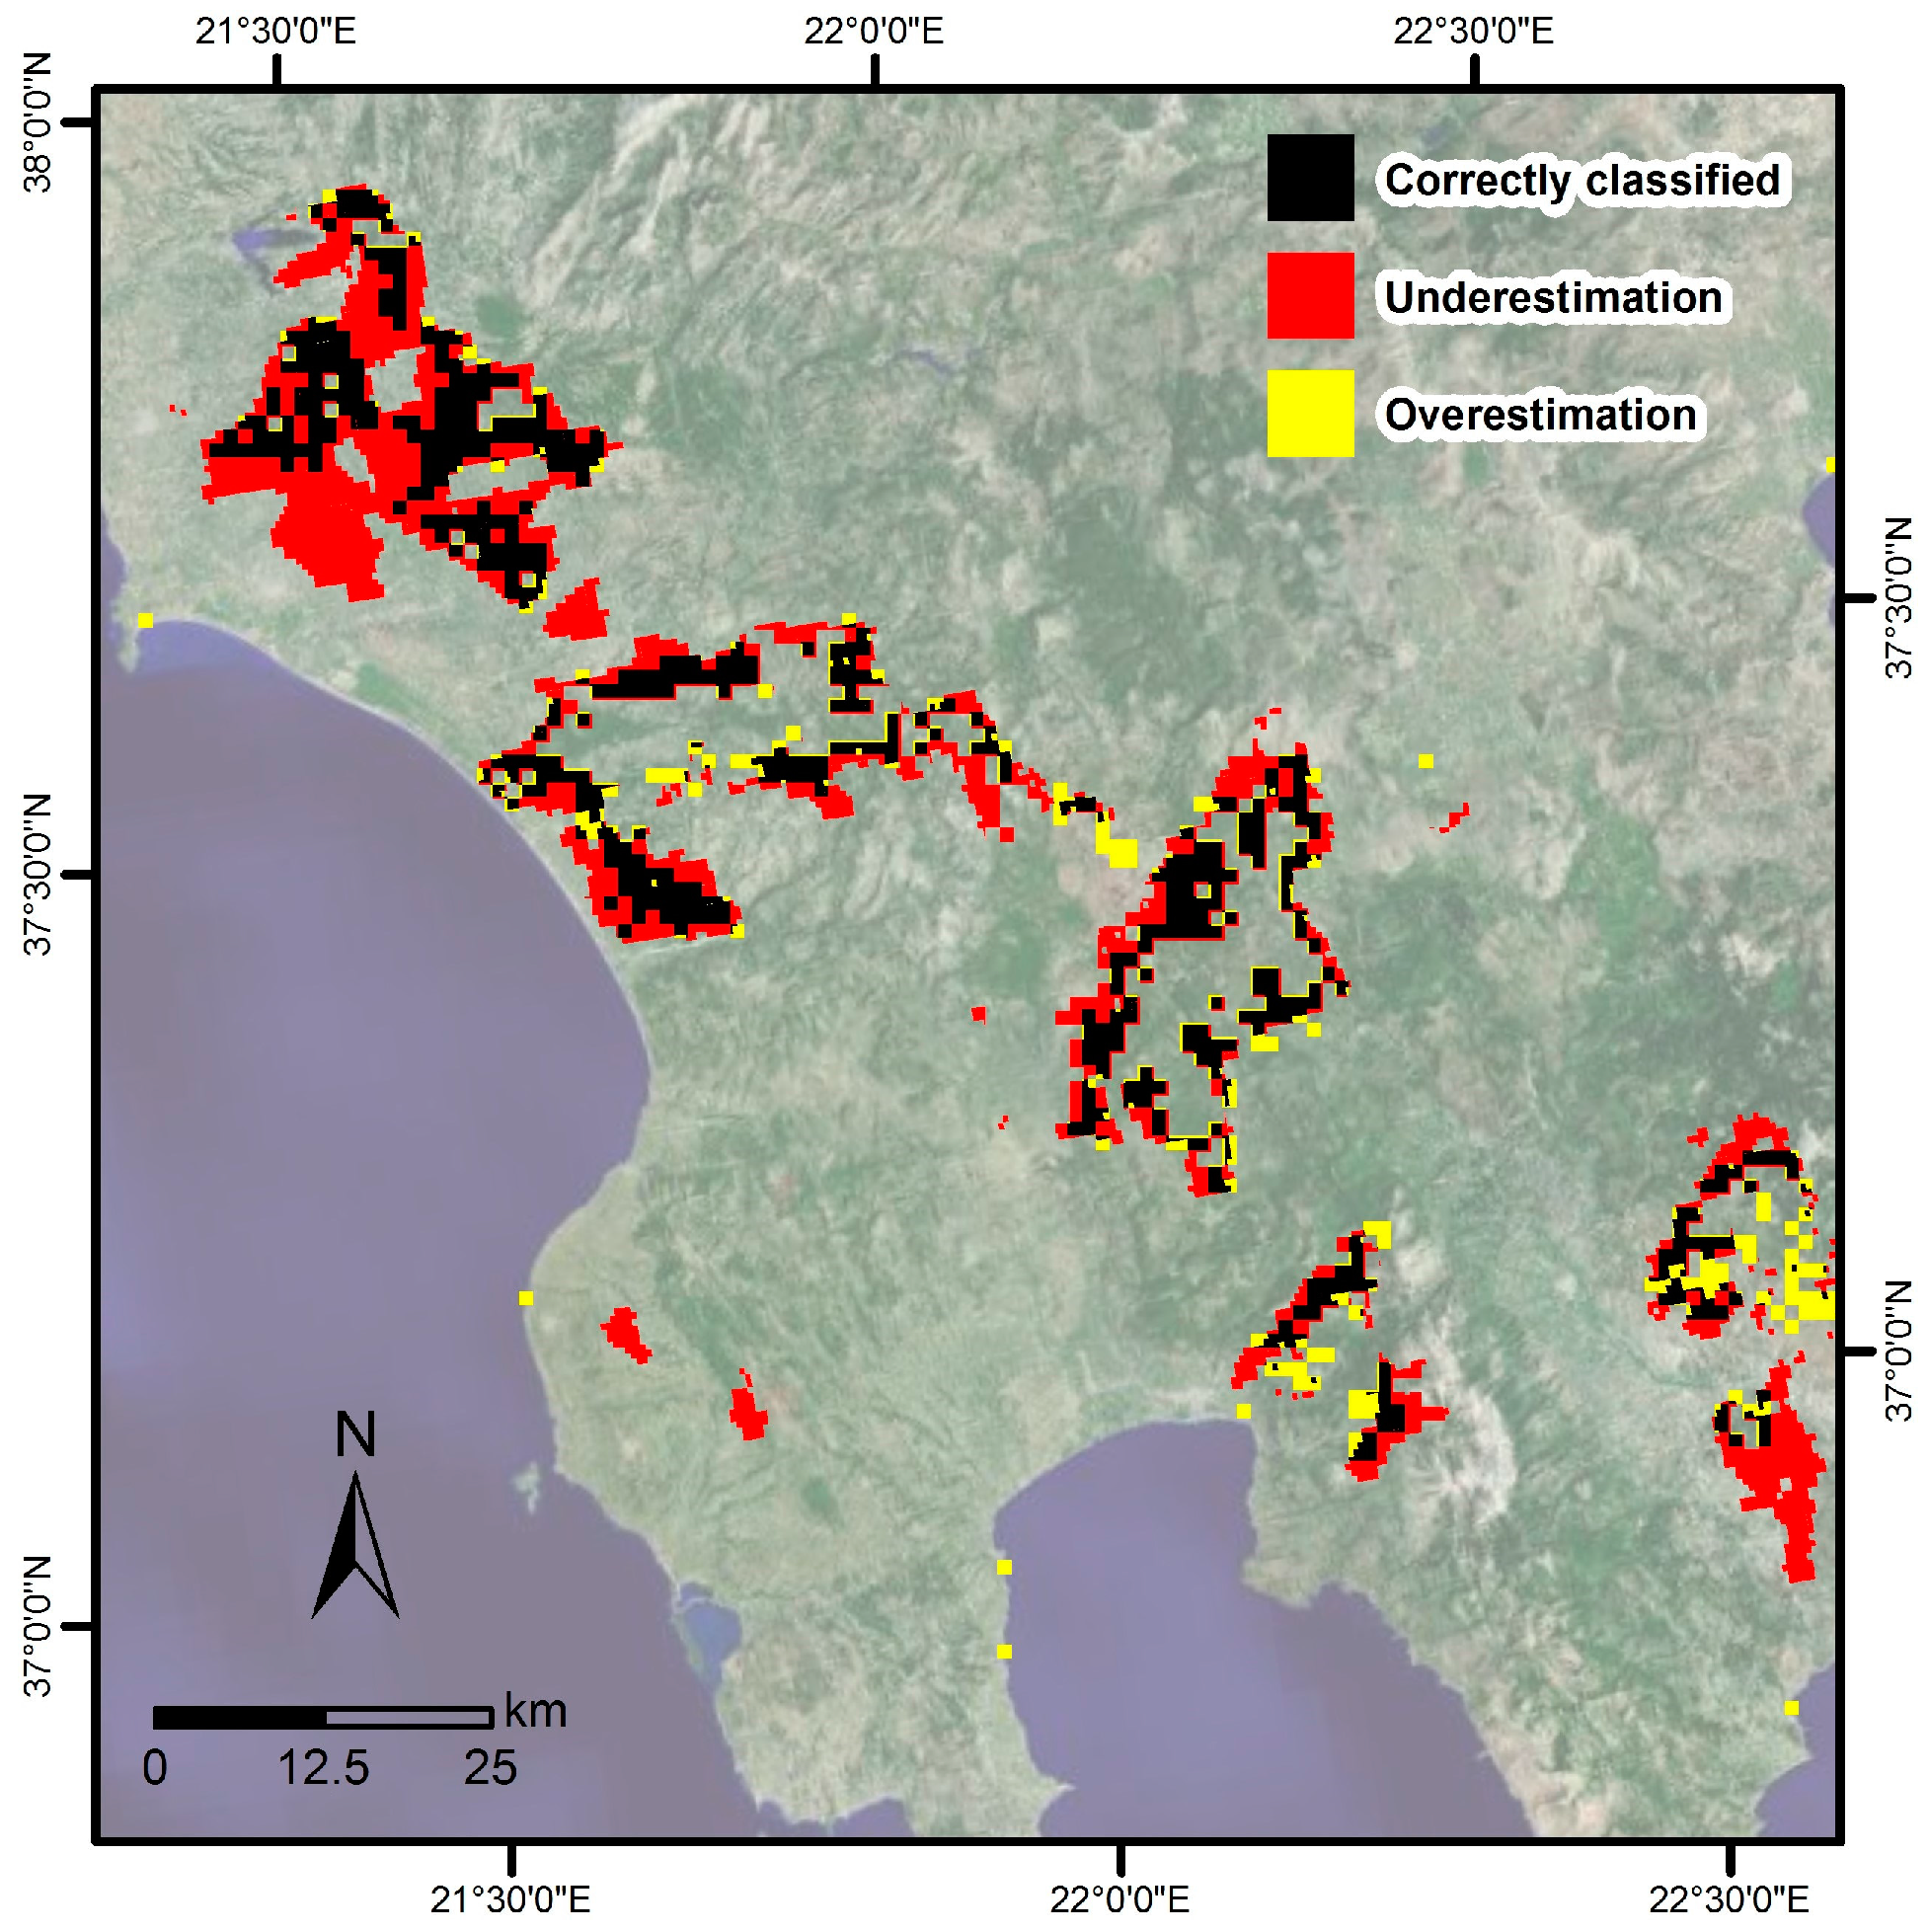
On average, 86% of the number of reference burn scar polygons were correctly detected, while the percentage of overestimation and underestimation was relatively low at 14% and 7%. At two sites, Sicily and the Ukraine, the numbers of correctly classified burn scars reached 100%. Consequently, there was also no overestimation of the number of burn scars at these two study sites. At the three test sites of Sicily, Croatia, and the Ukraine, all reference burn scar polygons were also detected by the classification, with the percentage of underestimation being 0%. In the Greece study site, 76% of the burn scar polygons were correctly detected by the classification, while 24% were overestimated and 33% were missed.
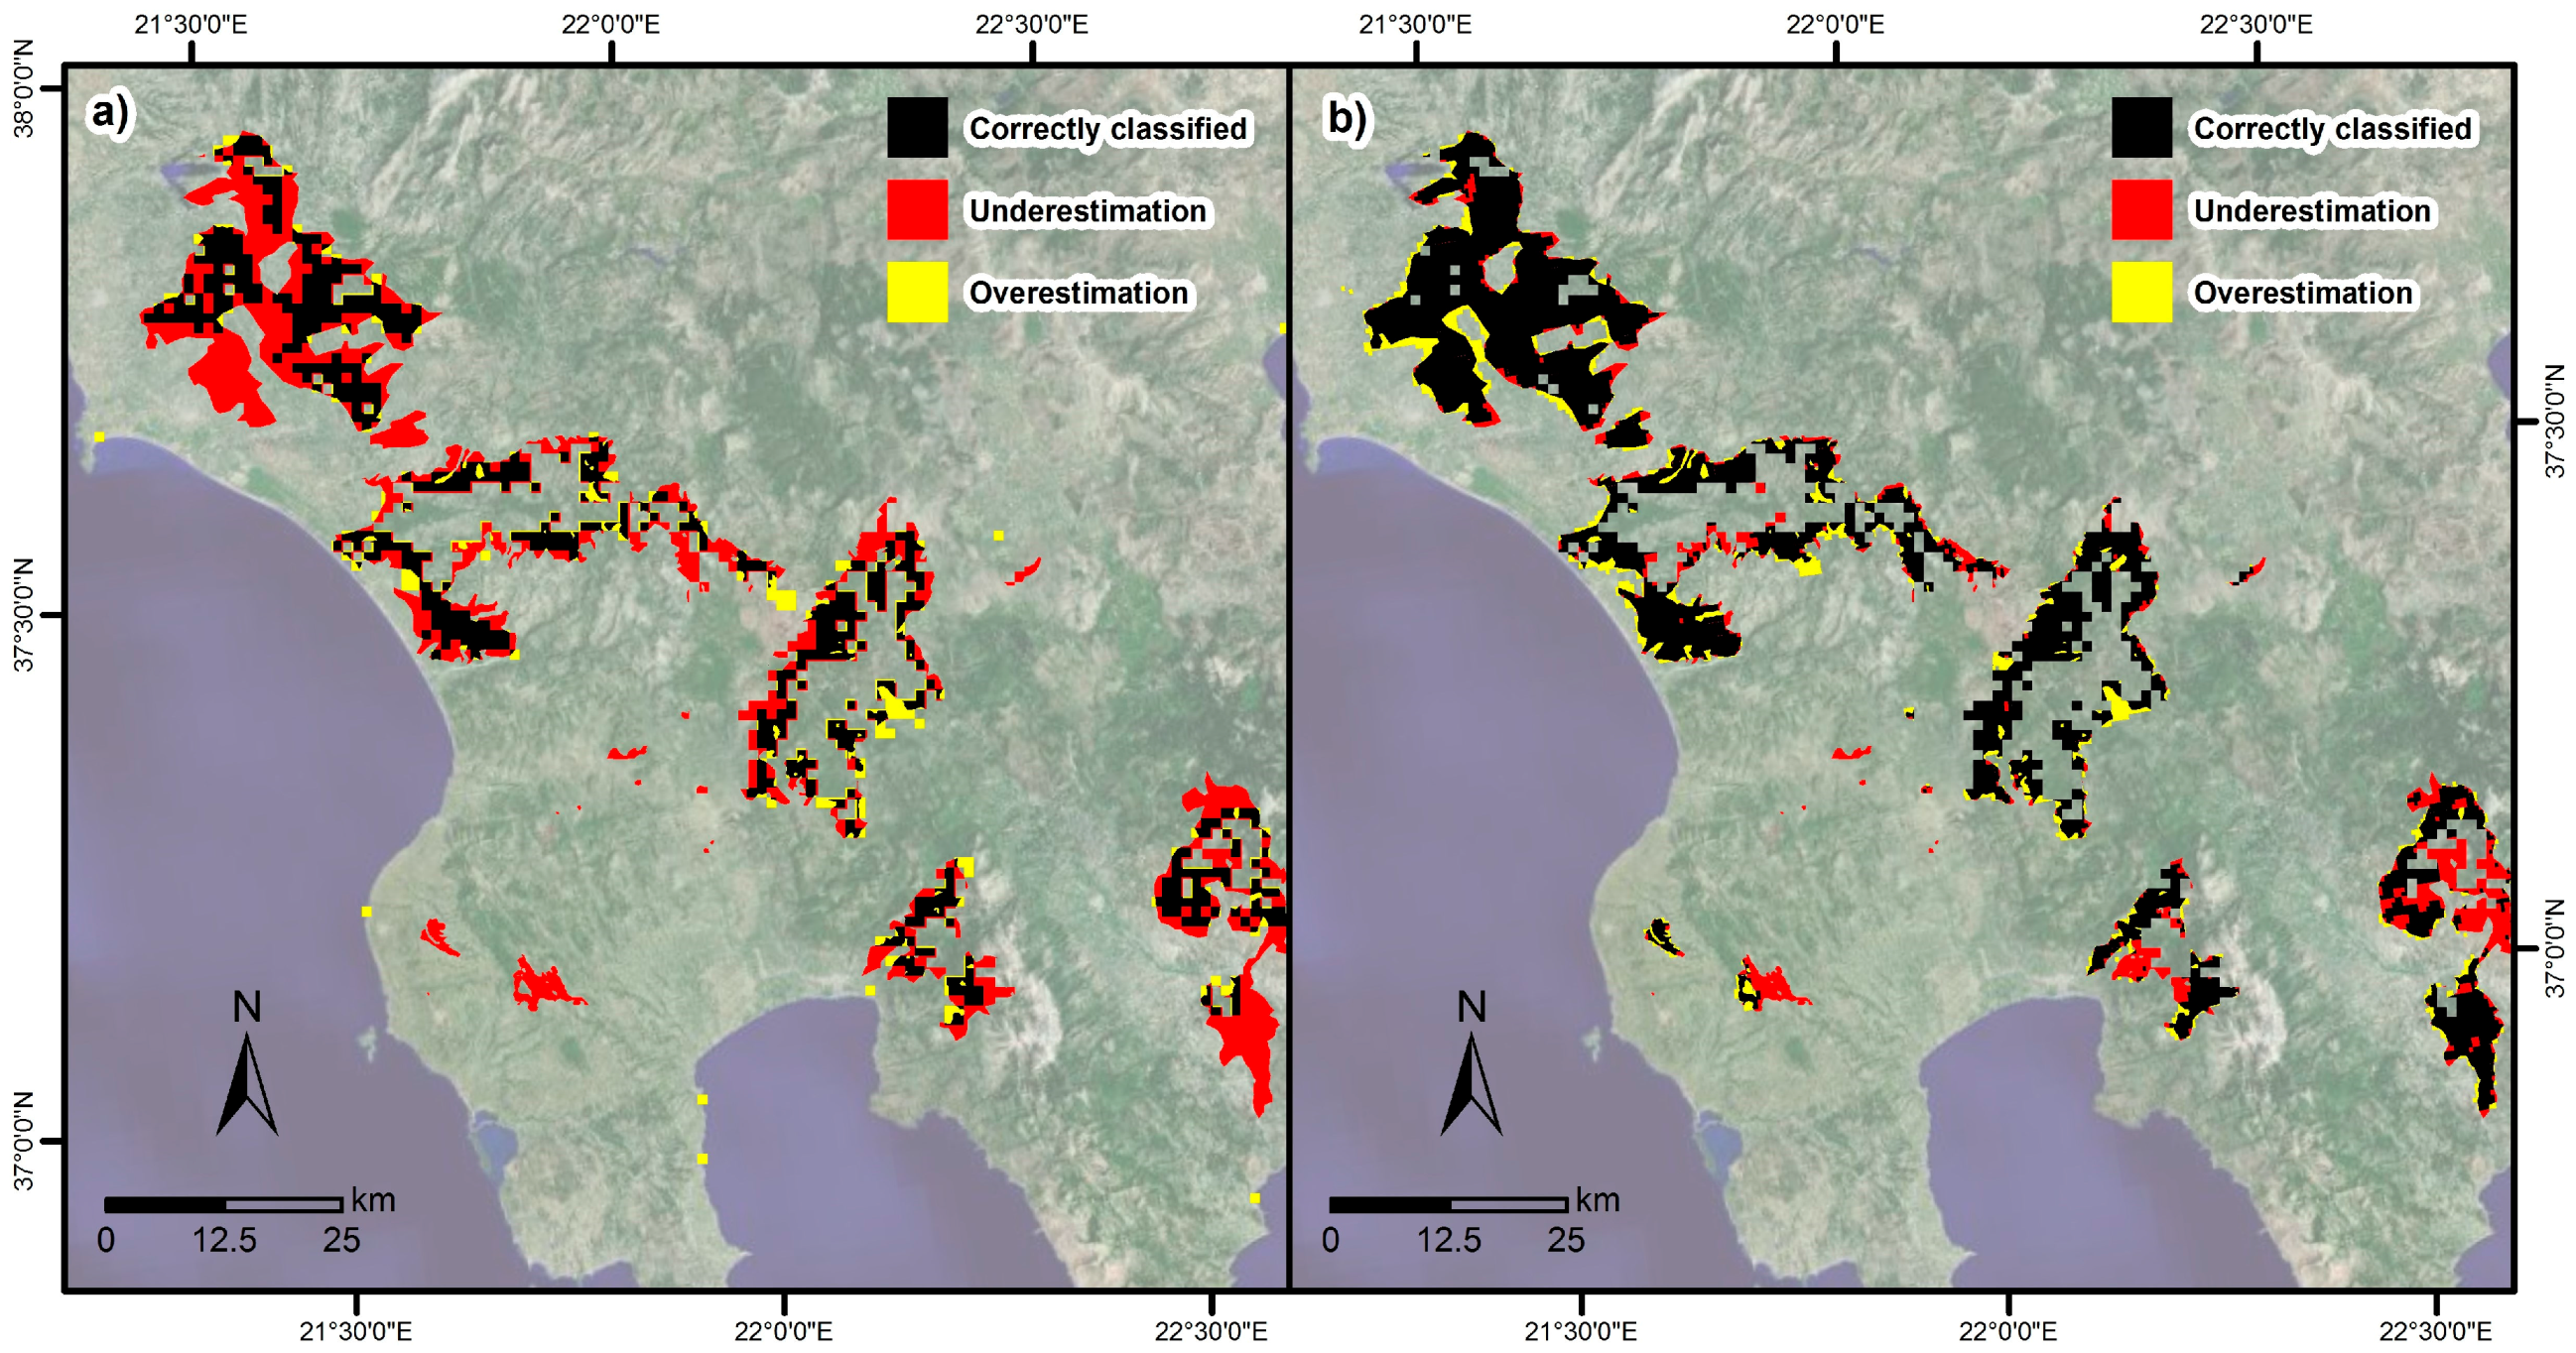
Figure 3 shows the validated classification result of the Greece study area. Besides a few smaller burn scars in the south and northwest, almost all major reference burn scars were correctly detected by the classification. However, there were two exceptions: in the northwest burn scar approximately one sixth of the reference burn scar was not classified. Moreover, only a very small percentage of the southeast reference burn scar was correctly classified.
Both reference burn scars of the Sicily test site were detected (
Figure 4). However, a large part of the reference burnt area was missed by the classification. On the other hand, there was almost no overestimation.
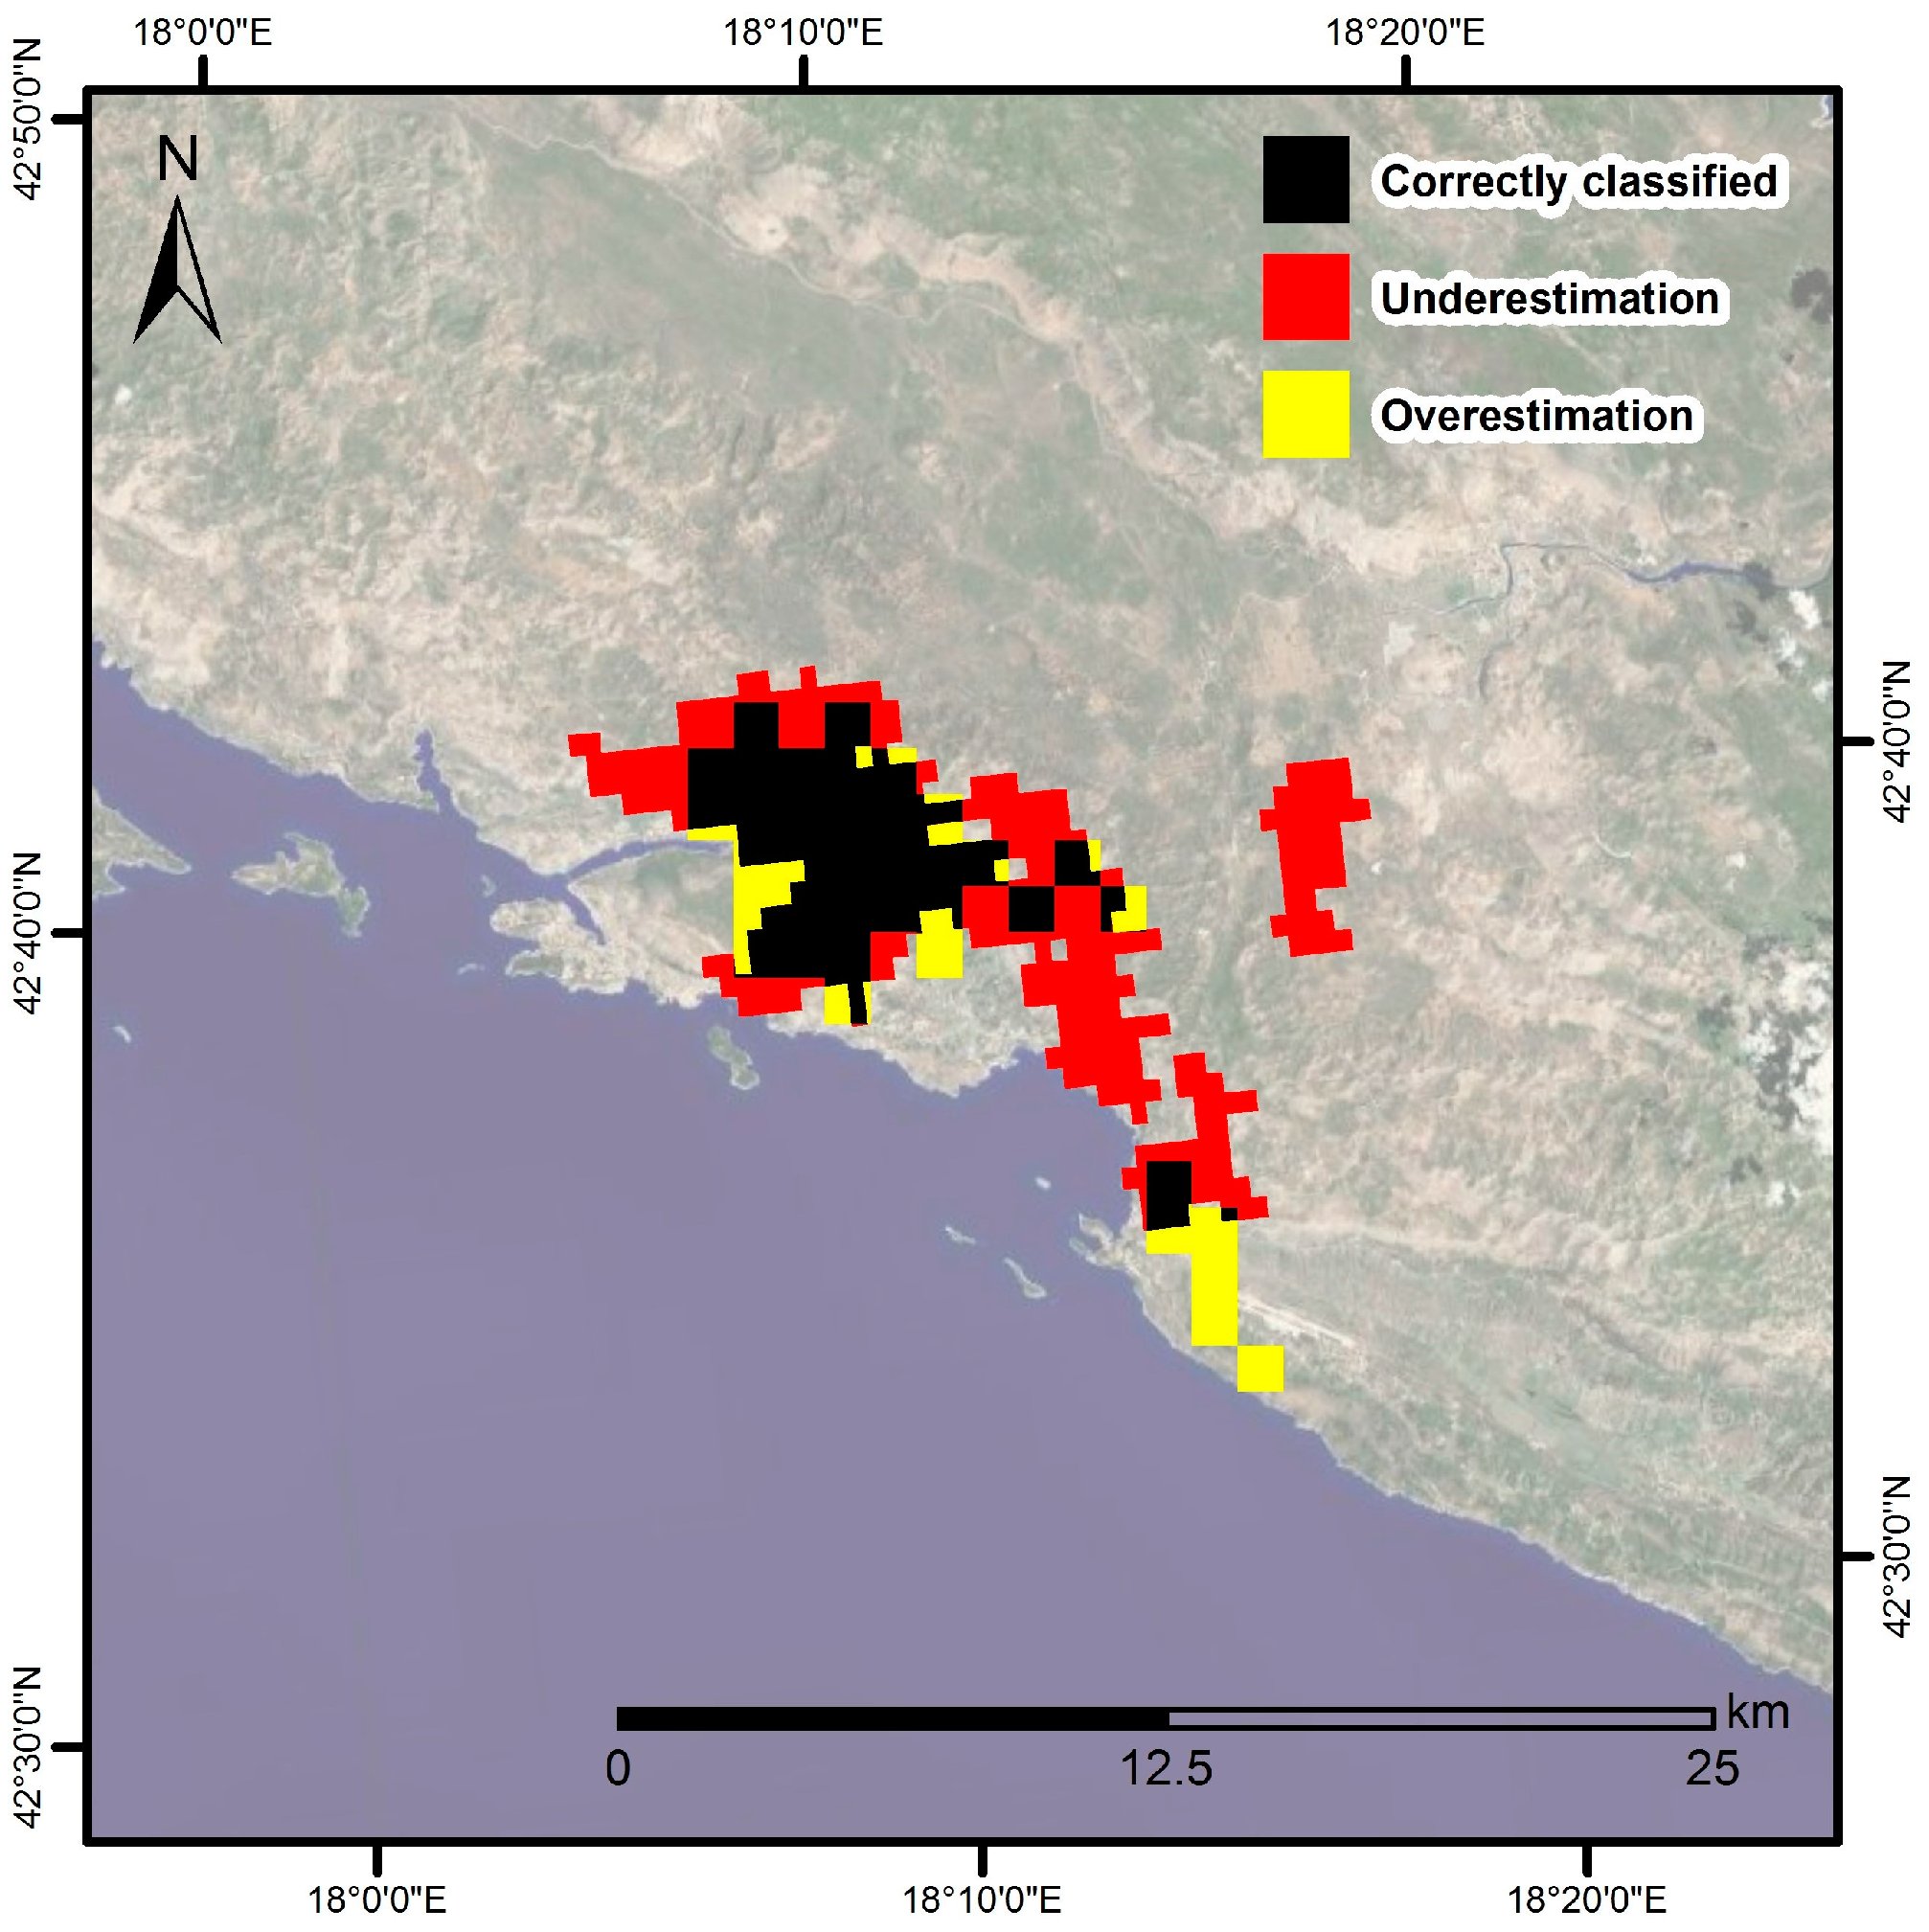
The Croatia test site shows a good detection of the large major reference burn scar (
Figure 5). However, the smaller MODIS burn scar in the east as well as parts in the south of the larger burn scar were missed by the classification.
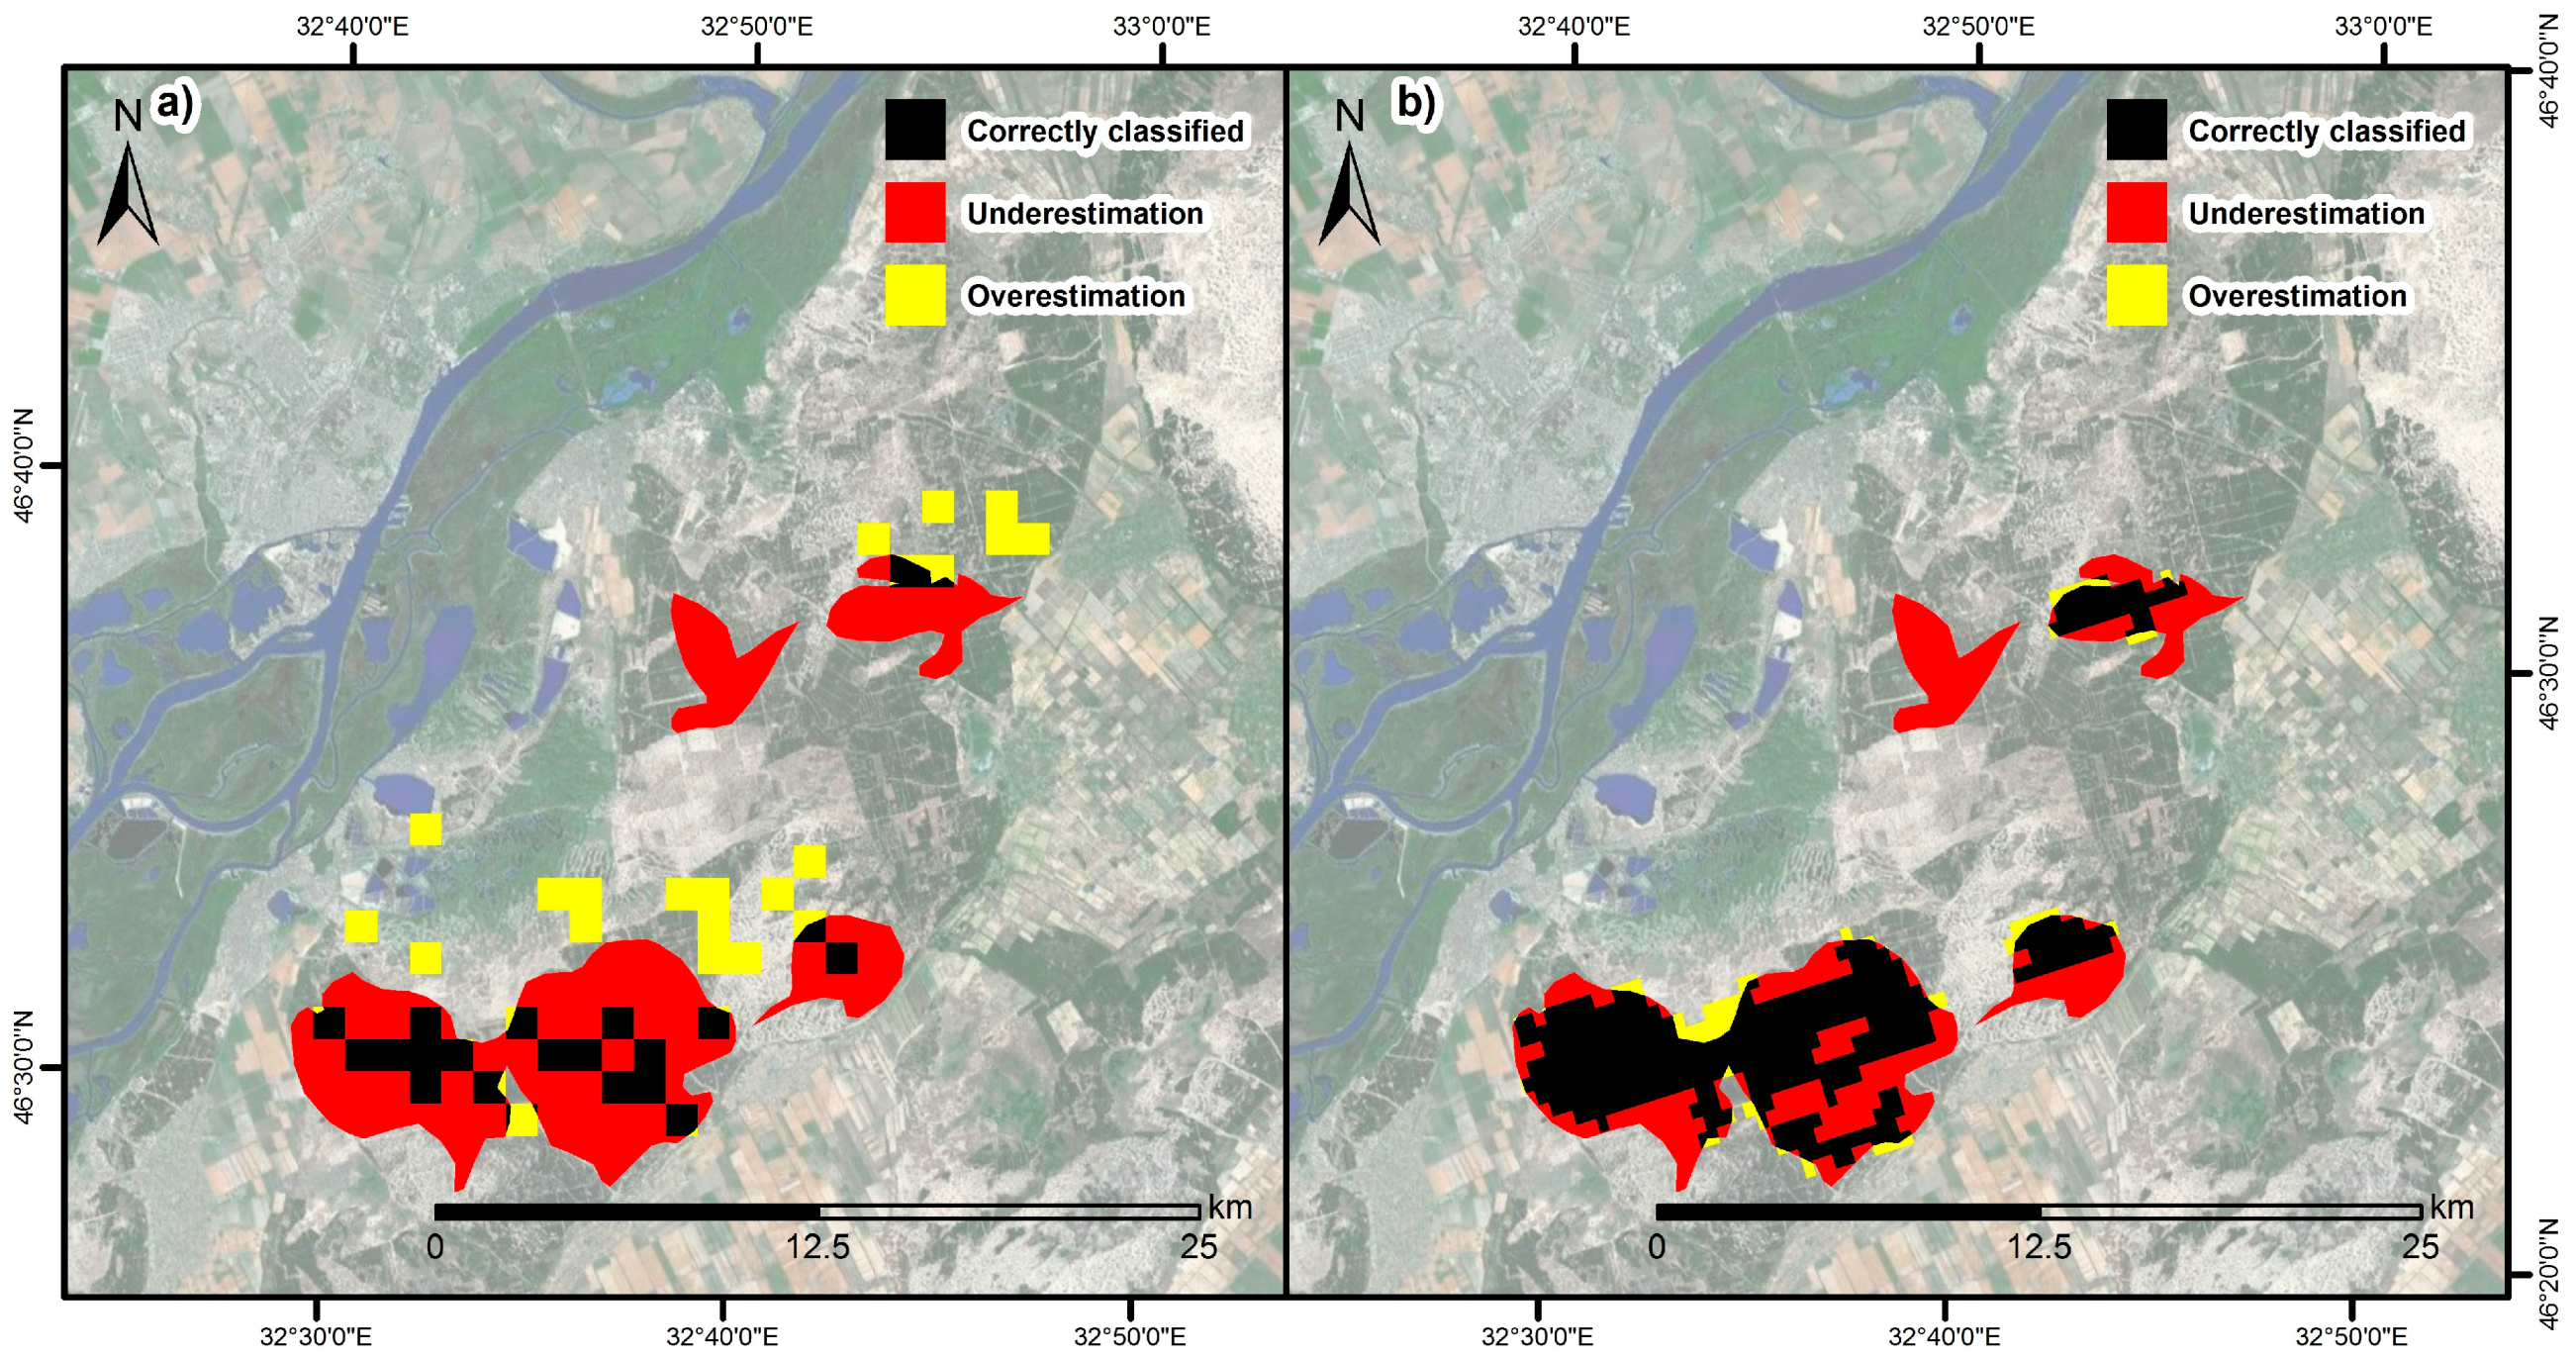
At the Ukraine site, parts of the larger reference burn scar as well as a small part of the small reference burn scar were detected by the classification. However, the finer border area of the reference was missed by the classification (
Figure 6).
3.2. Validation with Burnt Area Derived from Landsat-7
Two accuracy assessments were performed for the study sites of Greece and the Ukraine, where cloud-free Landsat-7 data, acquired shortly after the fire event, were available. (I) First, the AVHRR-based classification was compared with the Landsat-7 derived burnt areas (
Table 4). (II) Second, to get an idea about the accuracy of the MODIS MCD64 burnt area product, which was used to validate all four test sites (cf.
Table 2 and
Table 3), the MCD64 datasets were also compared with Landsat-7-derived burn scars (
Table 5).
First, we compared the accuracy assessment of the AVHRR-based classification using the Landsat-7 derived burnt area as a reference (
Table 4) instead of the MODIS MCD64 burnt area product as a reference (
Table 2). For the Greece test site, the values of the overall accuracy, the Cohen’s Kappa, and the burnt area PA were more or less stable. However, there was an increase of the burnt area UA by 10%. For the Ukraine study site, the values for the overall accuracy, the Cohen’s Kappa, and the burnt area PA slightly decreased. Again, the burnt area UA increased (also by 10%). To summarize, when using a higher spatial resolution reference layer, the overestimation decreases, while the underestimation increases slightly.
Second, we compared the two reference layers. The accuracy of the MODIS MCD64 was tested against the higher resolution Landsat-7-derived burnt area (
Table 5). The average overall accuracy was 96%. The value of the Cohen’s Kappa was relatively high. The not very high burnt area PA means that 34% of the reference burnt area was missed by the MODIS MCD64. The burnt area UA was relatively high.
Figure 7 and
Figure 8 show the accuracy assessment of the study sites of Greece and the Ukraine, respectively. The burnt area derived from Landsat-7 was used as a reference, which was compared to the AVHRR classification (cf.
Section 3.1) and to the MODIS MCD64 burnt area product.
4. Discussion
The advantages of the proposed burn scar mapping processor are (I) the combined use of different indices to improve the classification result, (II) it is fully automated, (III) the generation and usage of an up-to-date cloud-free pre-fire dataset, (IV) classification with adaptive thresholding, and (V) the assignment of probability values to the detected burnt areas (cf.
Section 2.2). In contrast to this, a series of methodologies described in the literature is based on only one index, mostly the NDVI, e.g., [
25,
26,
27]. Other studies compared different indices, e.g., [
33], but did not combine two or more indices to improve the classification result, as done in the proposed approach. Adaptive histogram-based thresholding for the classification enables the avoidance of fixed thresholds, which are for instance proposed by Reference [
33].
As not only one single pre-fire acquisition is used for the change detection, but rather a cloud-free mosaic generated from the AVHRR images acquired during the last 30 days, the burn scar detection processor is only limited by the cloud-coverage of the post-fire AVHRR scene, and not by the cloud-coverage of the AVHRR scene acquired shortly before the fire event. The up-to-date cloud-free pre-fire dataset (cf.
Section 2.2) enables the detection of only newly occurring burn scars. Older burn scars are not detected, as the pre-fire dataset is in terms of acquisition time as close to the post-fire dataset as possible (depending on the cloud coverage of the single pixels).
The accuracies, described in
Section 3, are relatively good for AVHRR. Notably, the count-based accuracy assessment showed a high average detection rate of 86%. One has to take into account that the MODIS burnt area product MCD64 has a spatial resolution of 500 m, which is four times higher in spatial resolution (with regard to the number of pixels) than AVHRR (1.1 km at nadir). Due to the coarser resolution of AVHRR, smaller and thinner burnt areas, which were well detected by MODIS, were missed in the AVHRR classification.
The difference between the two accuracy assessment approaches performed in
Section 3 is that the area-based approach strictly compares the accuracy pixel by pixel, while the count-based accuracy assessment is a rougher estimation of the accuracy of detecting a burnt patch. Therefore, although the AVHRR-derived product is able to detect the occurrence of burnt areas reasonably accurately, at this stage of the development, we are unable to accurately map the burnt area.
An advantage of the MODIS sensor is that it records, in addition to the red and NIR bands, the reflectance information of the Earth’s surface in the SWIR band. The SWIR band combined with the NIR band is better suited for burnt area mapping than the NIR band alone. Contrary to this, AVHRR only has a red and a NIR channel available. For instance, the authors of reference [
43] adopted the BAI (cf. Equation (4)) to MODIS by using its SWIR band. The resulting BAIM (BAI adopted for MODIS) and the improved IBAIM [
44] showed a much higher discrimination ability of burnt and unburnt areas than the original BAI, which does not include the SWIR channel.
As described in Reference [
45], the MODIS burnt area product generation also corrects for the bidirectional reflectance distribution. This preprocessing step is not considered in the current version of the developed AVHRR data-based burnt area mapping approach described in this article. However, within the still ongoing TIMELINE project, better preprocessed AVHRR imagery will become available in the future. This contains, amongst others, BRDF correction as well as a bottom of atmosphere correction. Moreover, enhanced cloud and water masks will become available as input for the burnt area processor. This will result in an improved burnt area product.
Despite the aforementioned advantages of MODIS compared to AVHRR, the accuracy of the MODIS MCD64 burnt area product is not at the level of 100% correct detection [
46]. In
Section 3.2, we assessed the accuracy of the MODIS MCD64 burnt area product by comparing it with a Landsat-7 (30 m)-derived map product. The UA was 89%, showing that a high percentage of the Landsat-7 burnt area was correctly detected by MODIS MCD64, and the overestimation of the MCD64 was relatively low at 11%. However, the burnt area PA of 66% shows that 34% of the reference data was not mapped by the MCD64 product. A visual comparison of the Landsat-7-derived and the MCD64 burnt areas showed that all major large burnt areas were correctly classified by the MCD64. Smaller burnt areas and thinner parts of burn scars were missed by the MCD64. Landsat-7 enables the derivation of much smaller and thinner burnt areas.
The LULC information used has the same spatial resolution as AVHRR imagery at nadir conditions (1.1 km). Agricultural land shows high variability over time due to plant growth and harvesting. Rapid changes of the vegetation could be falsely classified as burnt areas. However, due to the coarse spatial resolution of the LULC, smaller areas of agricultural land are not considered in the LULC. As these small agricultural fields cannot be excluded from the processing, some percentage of the overestimation of burnt areas shown in
Section 3 might be caused by agricultural land missing in the LULC dataset used.
The assignment of probability values to the detected burnt areas (cf.
Section 2.2) provides additional information on how likely a classified burnt area is to be a real burnt area. The user can then select the probability level suited for their application; for instance, (I) to obtain an overview of all possible burnt areas within a certain time period, or (II) to find information about classified burnt areas which have the highest probability to be real burnt areas, taking into account that the classification might have missed some real burnt areas.
5. Conclusions
This paper presented a fully automated burnt area mapping processor for the analysis of Advanced Very High-Resolution Radiometer (AVHRR) data over the European continent. The advantages of the proposed burn scar mapping processor, compared to other approaches reported in the literature, include (I) the combined use of different indices to improve the classification result, (II) the fully automated processing, (III) the generation and usage of an up-to-date cloud-free pre-fire dataset, (IV) classification with adaptive thresholding, and (V) the assignment of five different probability levels to the detected burnt areas (cf.
Section 2.2).
The validation was performed with the Moderate Resolution Imaging Spectroradiometer (MODIS) burnt area product MCD64. Fire events at four European study sites (Sicily, Greece, Croatia, and the Ukraine) were analyzed. An area-based and a count-based accuracy assessment were performed. The former showed relatively good results. The latter showed an average detection rate of 86%, with 14% overestimation and 7% underestimation.
Burnt area information derived from Landsat-7 was additionally used to assess the accuracy of (I) the AVHRR-based classification and (II) the MCD64 itself.
The burnt area mapping processor is part of the German Aerospace Center’s (DLR) TIMELINE project, which aims to develop an operational processing and data management environment to process 30 years of NOAA-AVHRR raw data into L1b, L2, and L3 products. This paper presented the current status of the L3 burnt area mapping processor. In the future, enhanced exclusion masks for water and clouds will be available within the TIMELINE project and will be used to improve the results of the burnt area mapping processor.


