1. Introduction
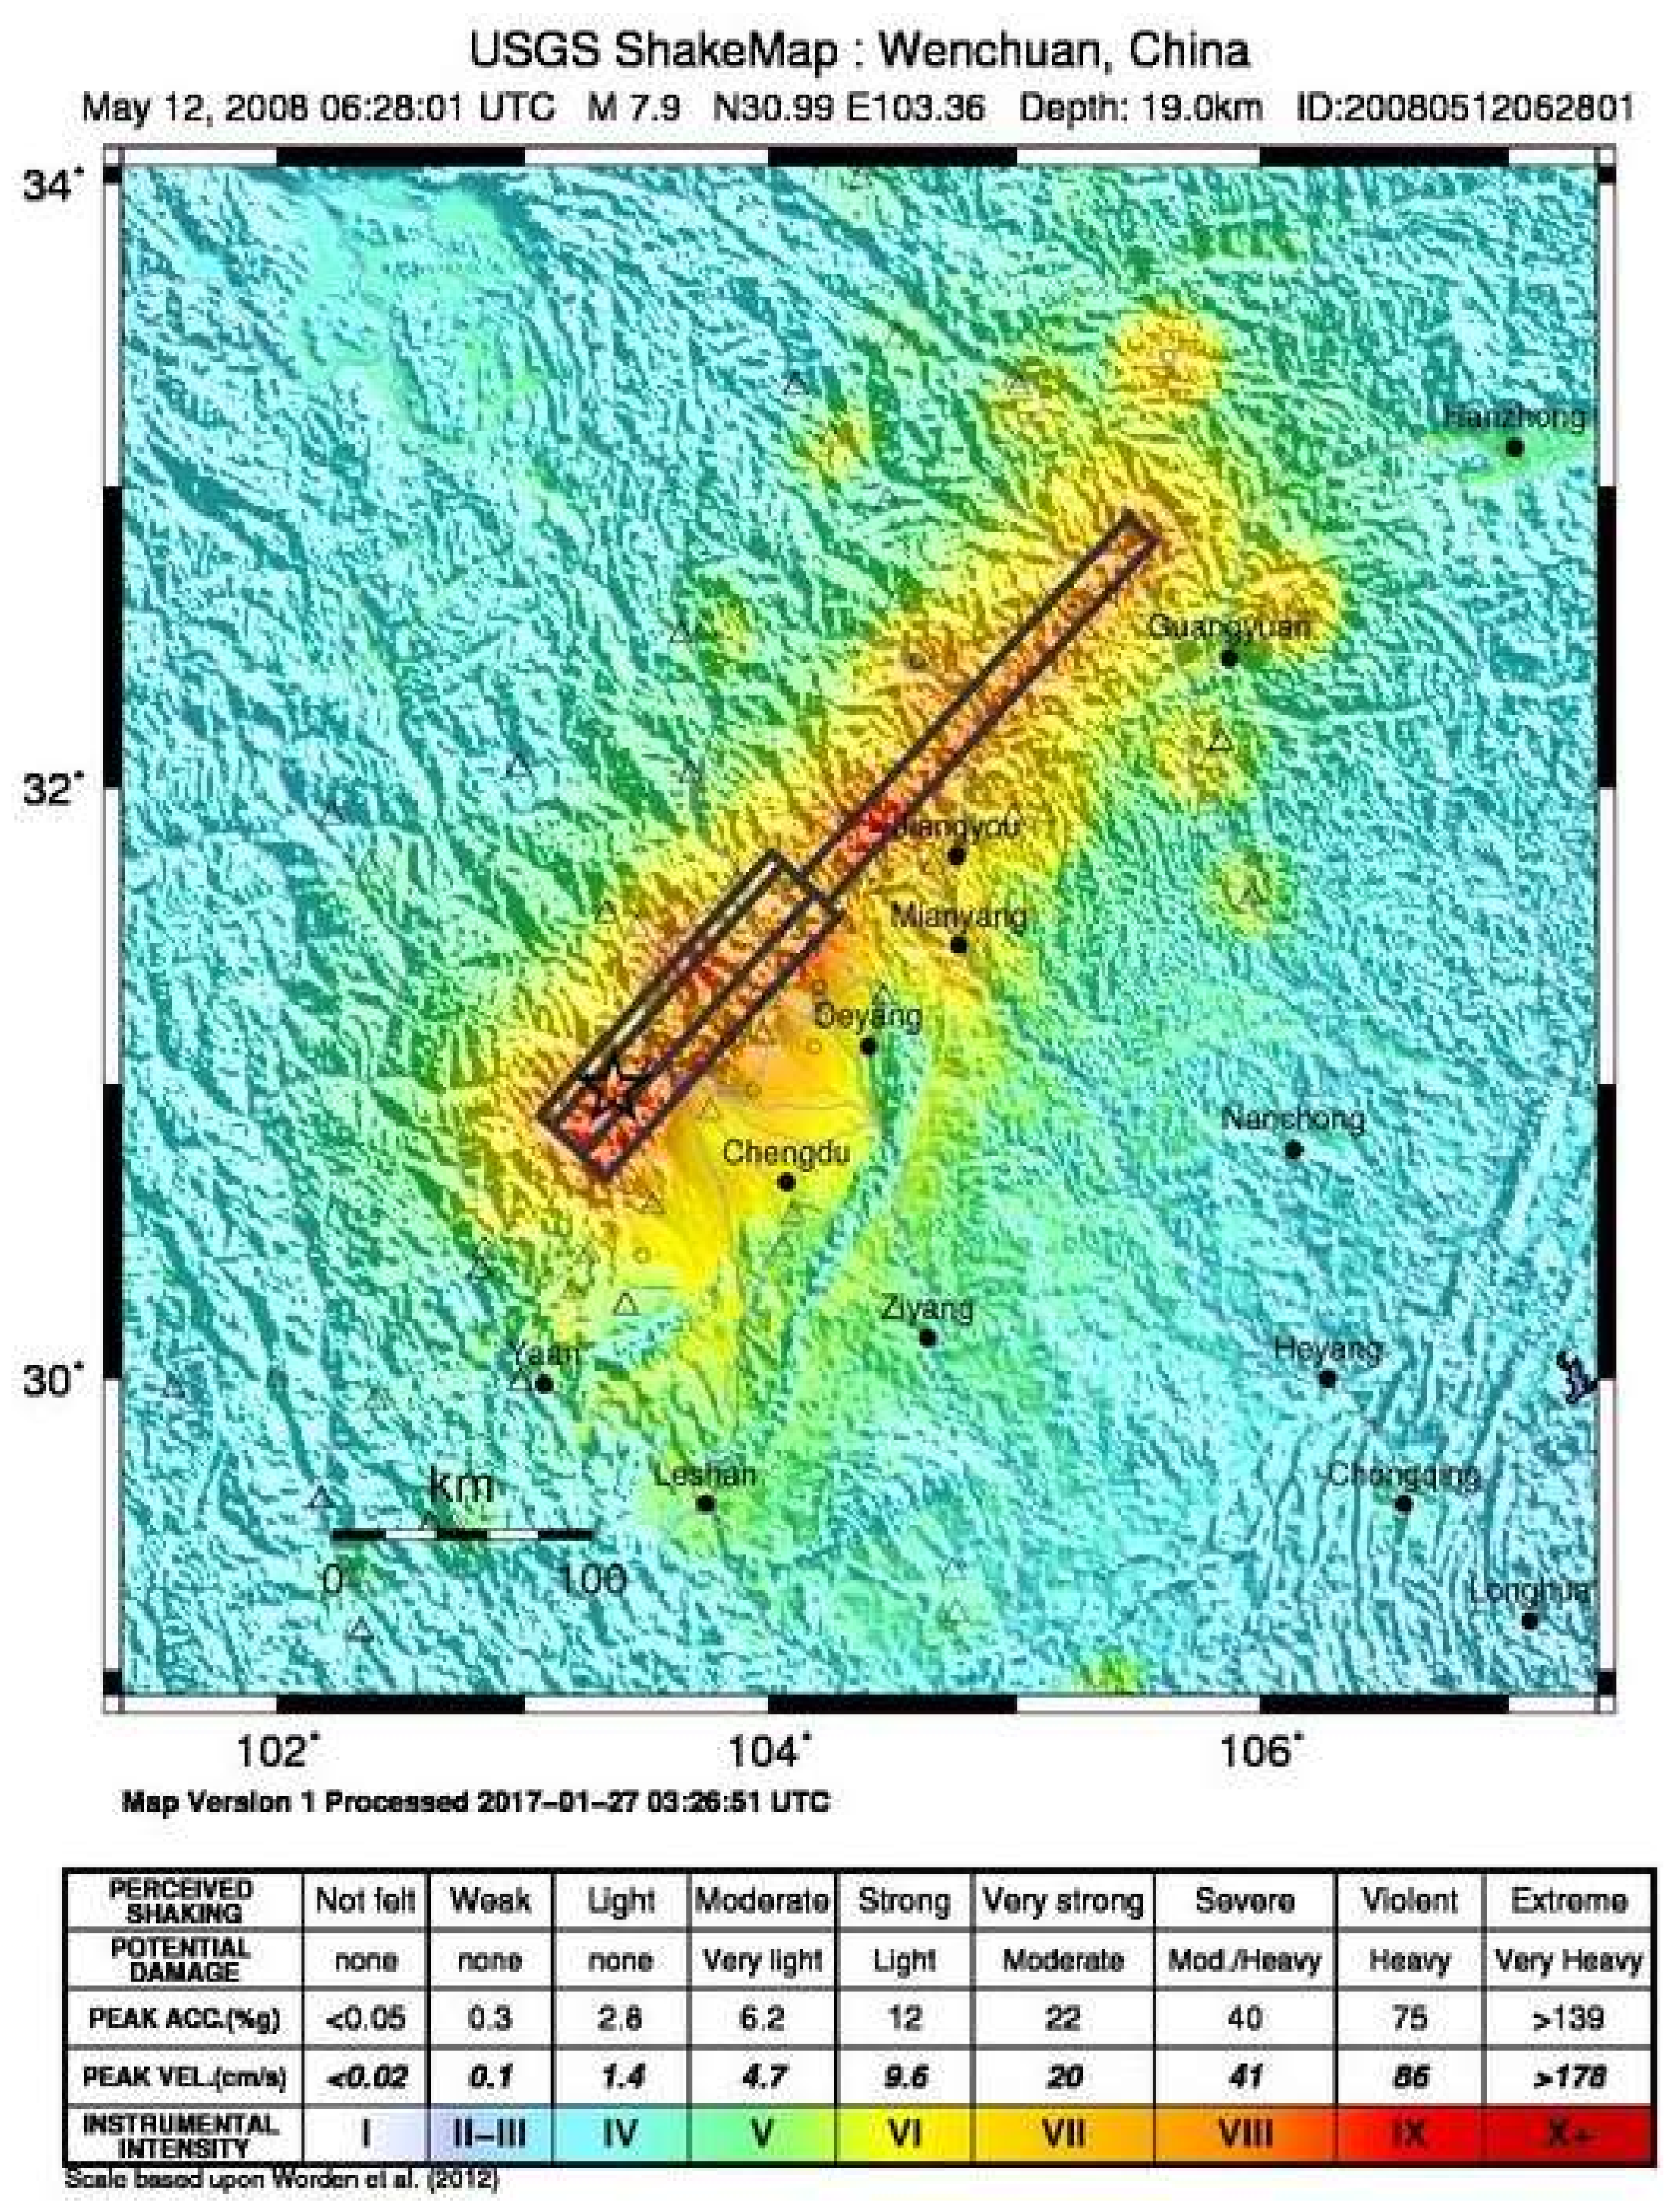
A catastrophic earthquake measuring Mw 7.9 struck Sichuan Province in Southwestern China on 12 May 2008, representing one of the country’s worst natural disasters. Approximately 87,150 people were killed or missing and another 374,643 were injured. The Wenchuan Earthquake severely struck 237 counties and cities, seriously damaging over 100,000 square kilometers of area, with the direct economic loss reaching 845.2 billion RMB [
1]. The seismic intensity at the epicenter was XI degree; more than half of China was affected, and many other Asian countries, such as Thailand, Vietnam, and Pakistan, felt the earthquake’s subsequent shock.
Remote sensing technology has played a vital role in accessing the material losses and impacts on human society and environmental landscapes caused by the Wenchuan earthquake [
2,
3]. The application of remote sensing technology in post-disaster assessment has been widely studied, such as in building damage [
4], quantitative seismic damage [
5], landslides, and other secondary disasters [
6,
7]. The impact of disasters on the ecological environment is also a hotspot of research, such as damaged croplands [
8], soil mass [
9], and ecosystems of natural reserves [
10].
Damage from an earthquake occur in a short period of time, but the impacts on humans and society will last far longer: studies have shown that natural disasters, such as large earthquakes, have long-term effects on human society [
11,
12]. Determining how to use remote sensing technology to carry out long-term, sustained, and effective monitoring of impacts to earthquake-stricken areas is of great significance for disaster recovery policy-making and research on disaster loss prevention and reduction.
Different from daytime remote sensing, nighttime light (NTL) remote sensing provides a unique perspective on human activity (HA). In addition to having wide applications in the estimation of social and economic parameters, such as gross domestic product (GDP), population and electricity, and urbanization monitoring, NTL remote sensing data is increasingly used in assessing the impact of major events, such as social unrest and natural disasters [
13]. Li made use of the defense meteorological satellite program-operational linescan system (DMSP/OLS) images and Suomi National Polar-orbiting Partnership (NPP) satellite Visible Infrared Imaging Radiometer Suite (VIIRS) sensor images to evaluate the Syrian civil war (2011 to 2014), finding a high correlation between reductions in NTL intensity and refugee movements [
14].
NTL data has played a more and more important role in earthquake damage assessment. Kohiyama assessed the city light loss or reduction after the West India earthquake in 2001 using the DMSP/OLS daily images, determining that the reduction in NTL intensity was in “good agreement” with the field investigations [
15]. In the field of recovery assessment research, Koma identified the differences among the reconstructed areas and the reconstructing areas after the Sichuan earthquake using the DMSP/OLS daily images and estimated the pace of reconstruction [
16]. Thomas quantified the fluctuation of DMSP/OLS annual images caused by the Sumatra tsunami and recovery, and revealed the significant relationships between the nighttime imagery brightness and per capita expenditures, and spending on energy and food [
17].
DMSP/OLS possesses abundant archival data and wide spatial coverage. However, DMSP/OLS has no on-board calibration mechanism. Furthermore, annual NTL data acquired by different satellites have no strict intercalibration. The lack of continuity and comparability means that these data cannot be directly used to extract time series information [
18]. Individual composites have been intercalibrated via an empirical procedure. The existing methods of intercalibration often require manual selection of invariant target areas [
19,
20,
21,
22,
23]; in turn, an automatic intercalibration method needs to satisfy the assumption that the NTL value of most pixels in two period images is stable [
24]. However, because of rapid development over the past two decades, it is difficult to find a region in China with stable NTL. Accordingly, this poses a challenge to the existing methods of intercalibration.
This study used DMSP/OLS time series NTL images to assess HA in the Wenchuan earthquake-stricken areas and to compare the changes in intensity and distribution of HA before and after the disaster. The objective of the research is to reveal the continuing impacts of the Wenchuan Earthquake and post-earthquake reconstruction on HA through the long-term remote sensing monitoring. The novelty of our research is that an automatic intercalibration method is proposed to improve the continuity and comparability of DMSP/OLS time series NTL images in the developing regions. The novel calibration method helps to unify the comparative basis of HA, and our research framework provides a reference for the study of the long-term impacts of earthquakes and other types of disasters.
2. Materials and Methods
2.1. Study Areas
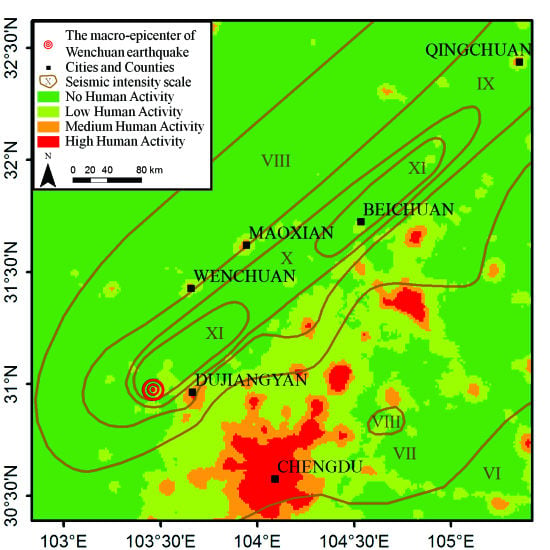
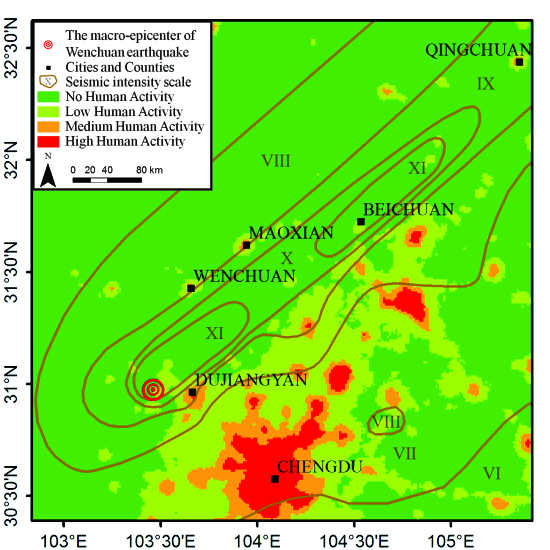
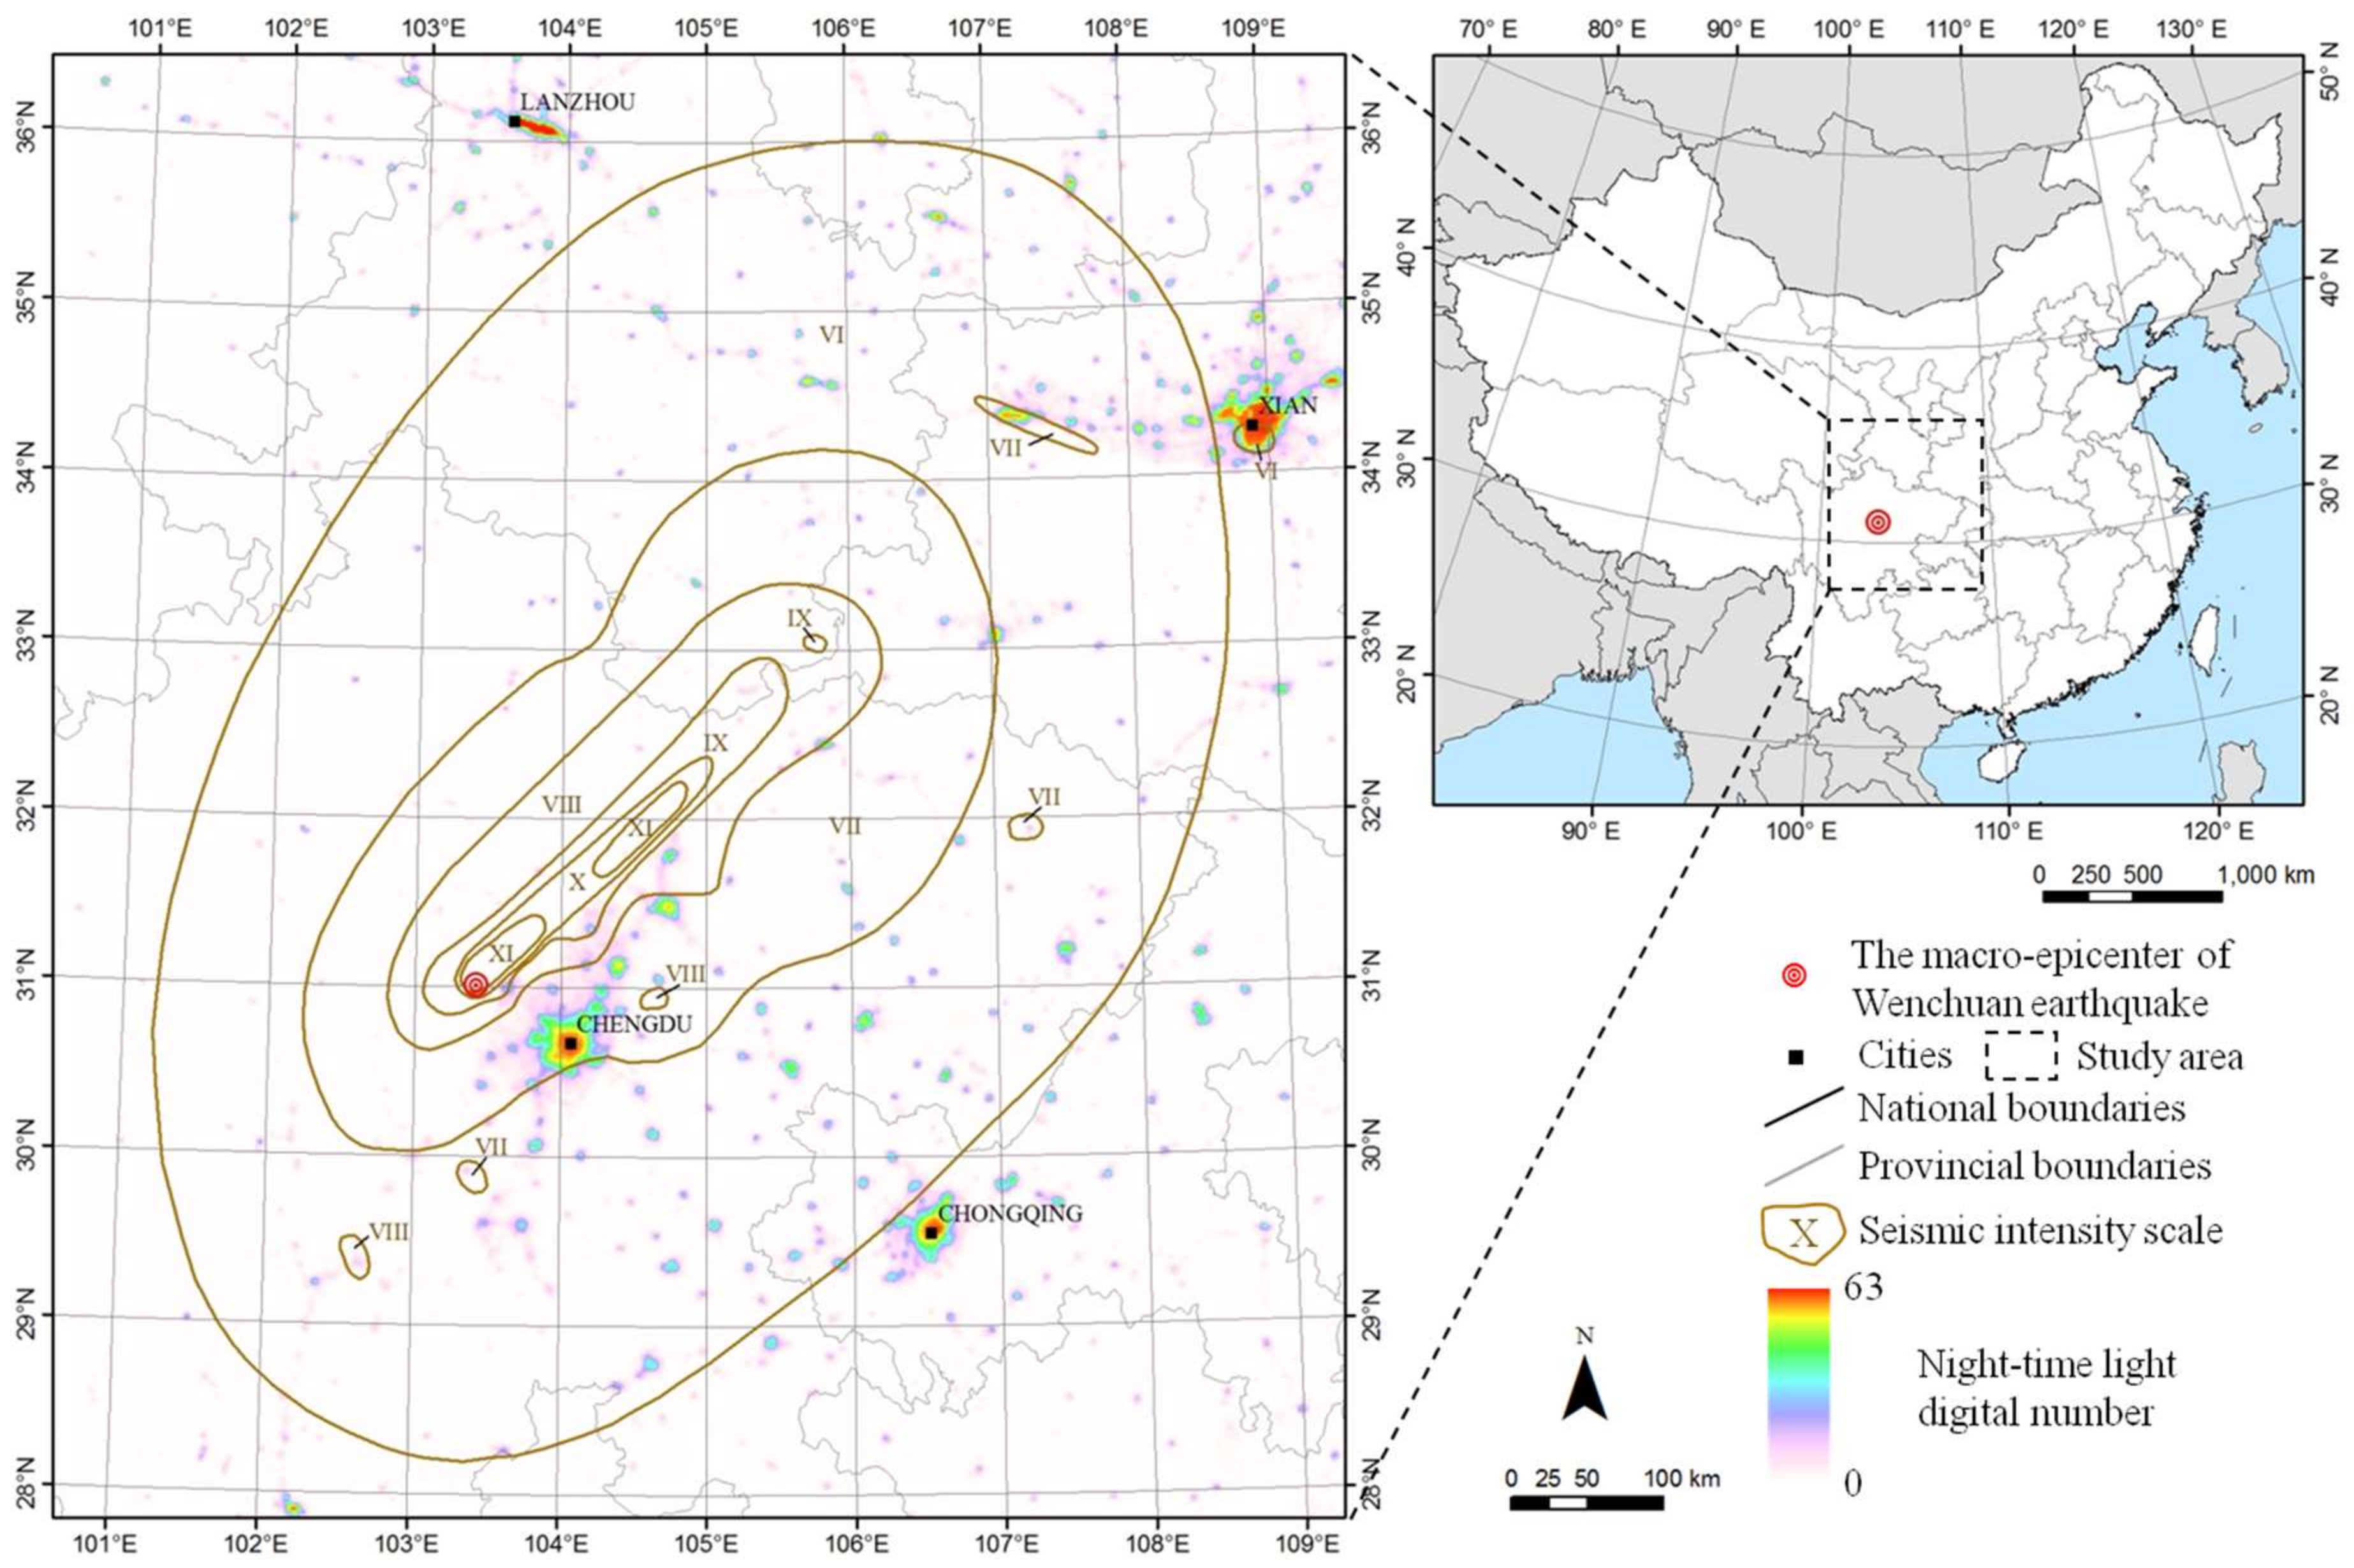
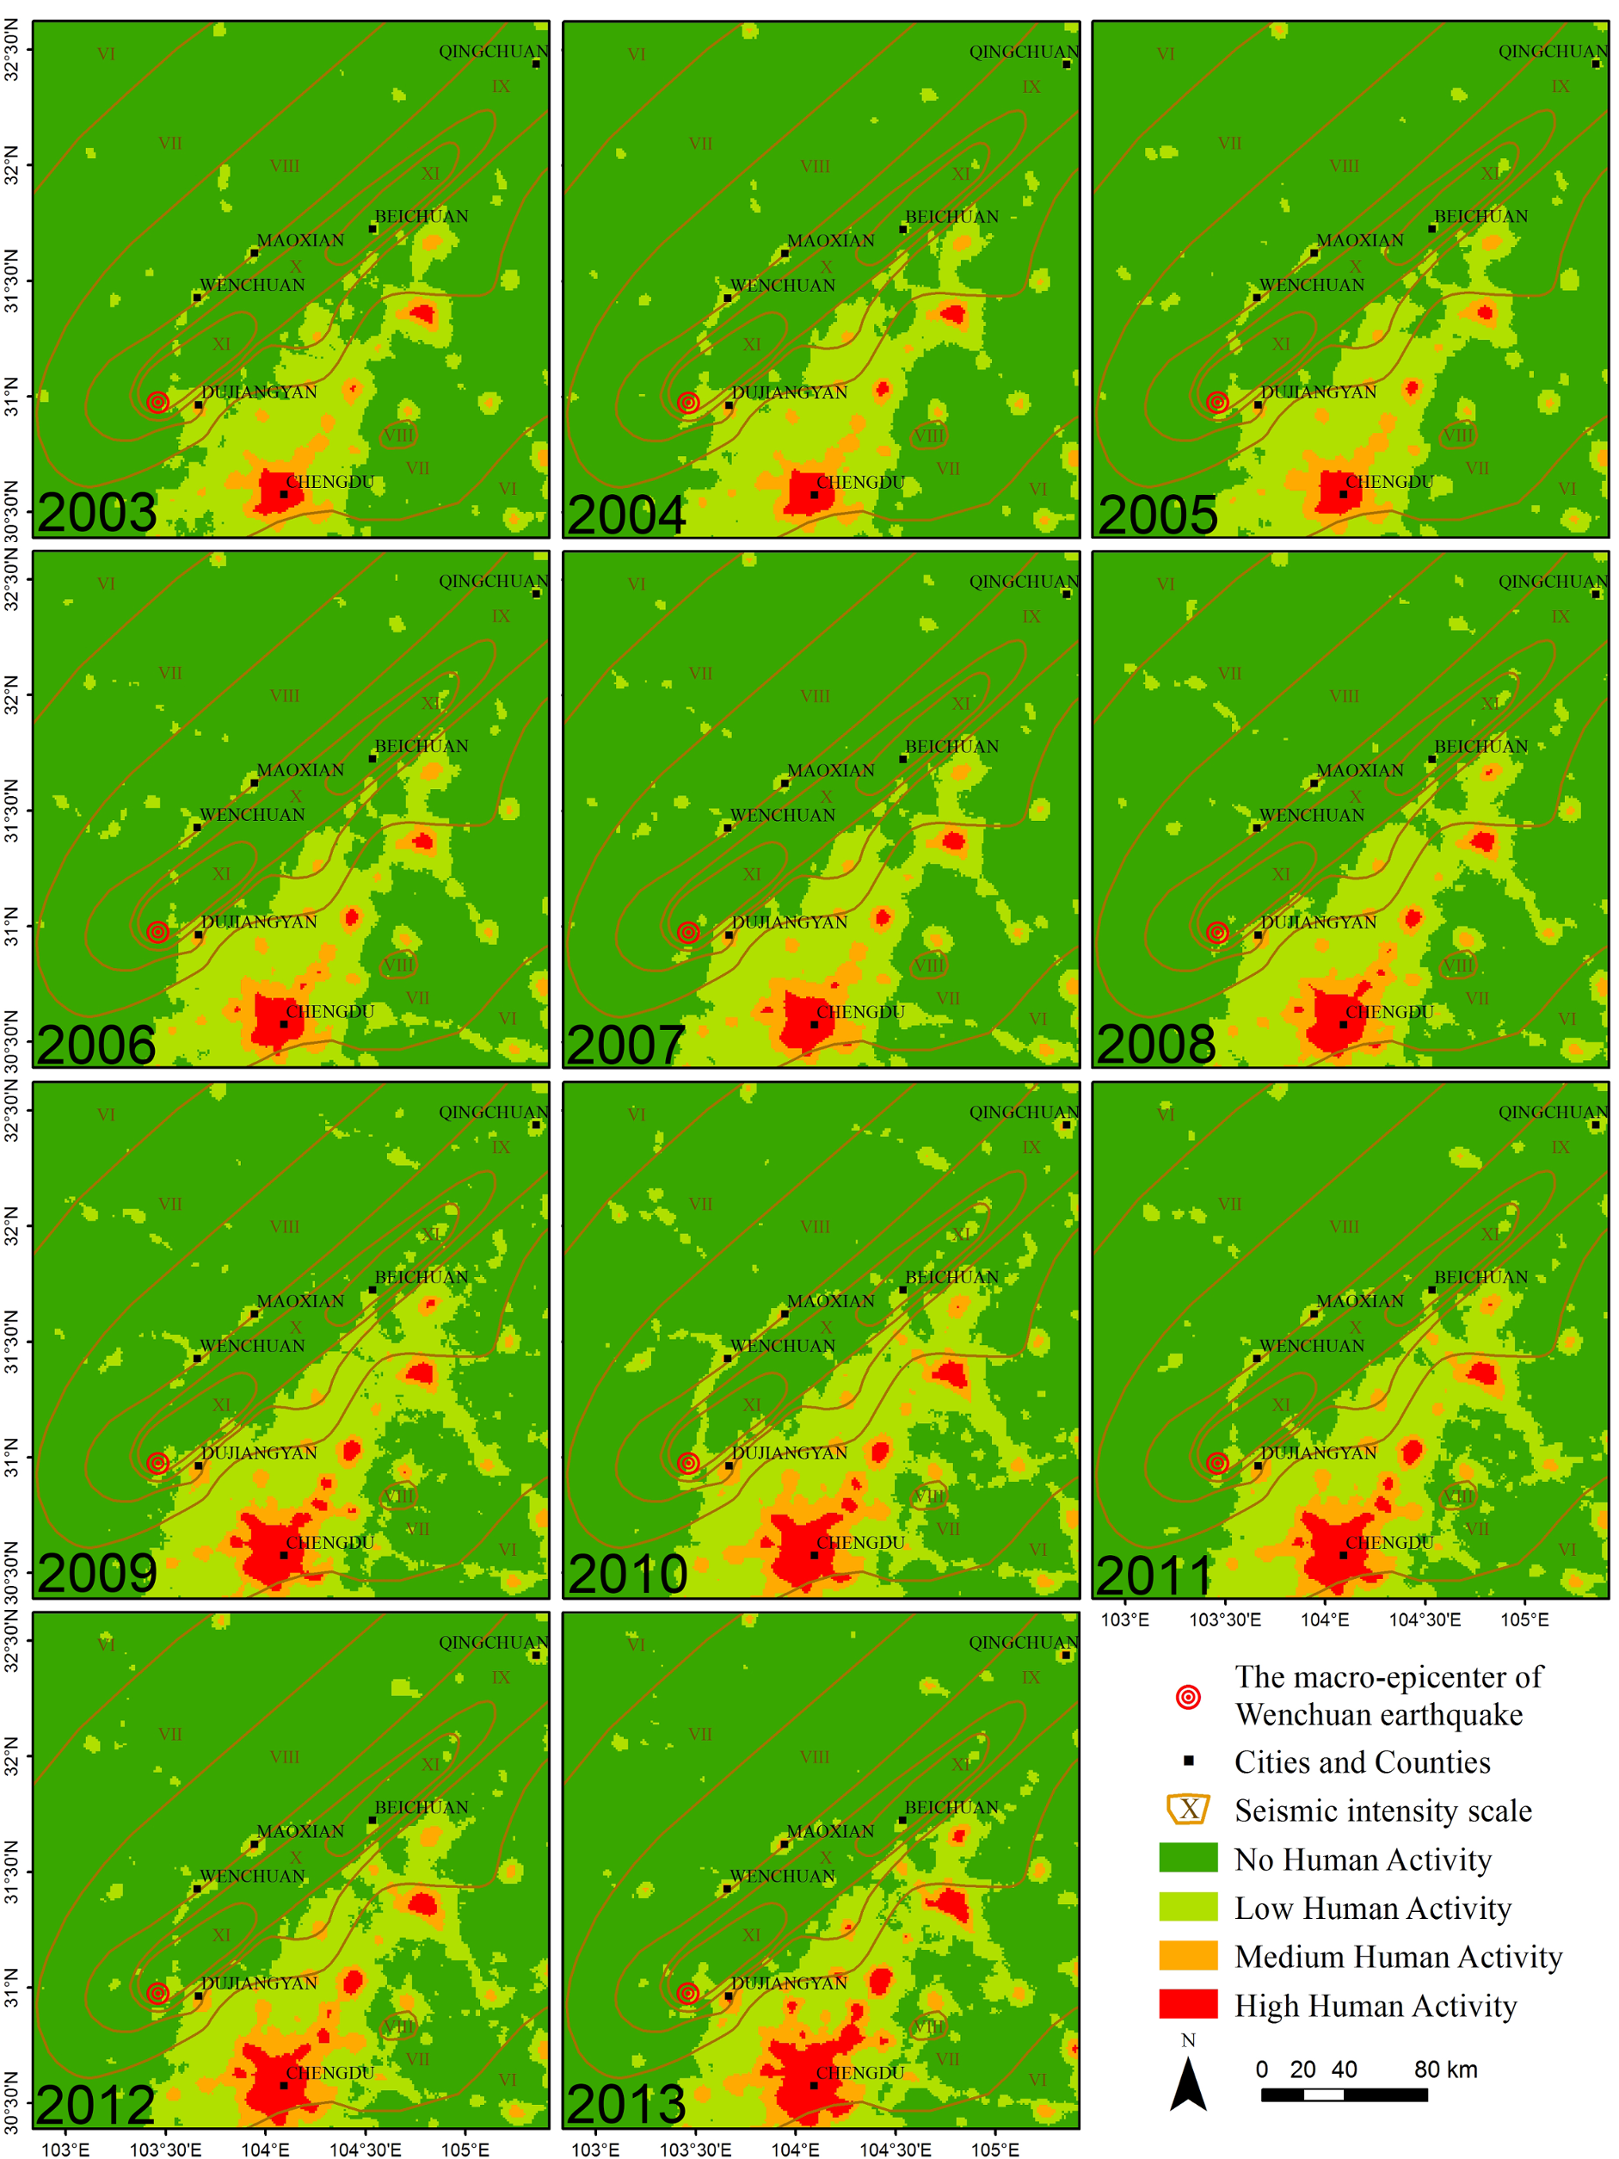
The seismic intensity distribution of Wenchuan earthquake, which was compiled by a field survey from the China Earthquake Administration, is used to select the study area (
Figure 1). In this paper, the effect of Wenchuan earthquake on the Earth’s surface is described by the levels of Chinese Seismic Intensity Scale. The relationship between Chinese Seismic Intensity Scale and Modified Mercalli Intensity Scale is shown in
Appendix A. The area of the XI level region, which has two separate centers located in Wenchuan County and Beichuan County, respectively, is approximately 2419 km
2. The distribution of the Wenchuan XI level region is along the NE–SW direction, forming a “strip” with a 66 km long axis and a 20 km short axis. The Beichuan XI level region has a similar distribution, with an 82 km long axis and a 15 km short axis. The area of X level region is approximately 3144 km
2, from southwest of Wenchuan County to northeast of Qingchuan County, with a 224 km long axis and a 28 km short axis. The shape of the IX level region is a long, narrow strip with an area of 7738 km
2, and it has a 318 km long axis and a 45 km short axis. The VIII, VII, and VI level regions are similar, irregular ellipses with areas of 27,786 km
2, 84,449 km
2, and 314,906 km
2, respectively.
2.2. Data and Preprocessing
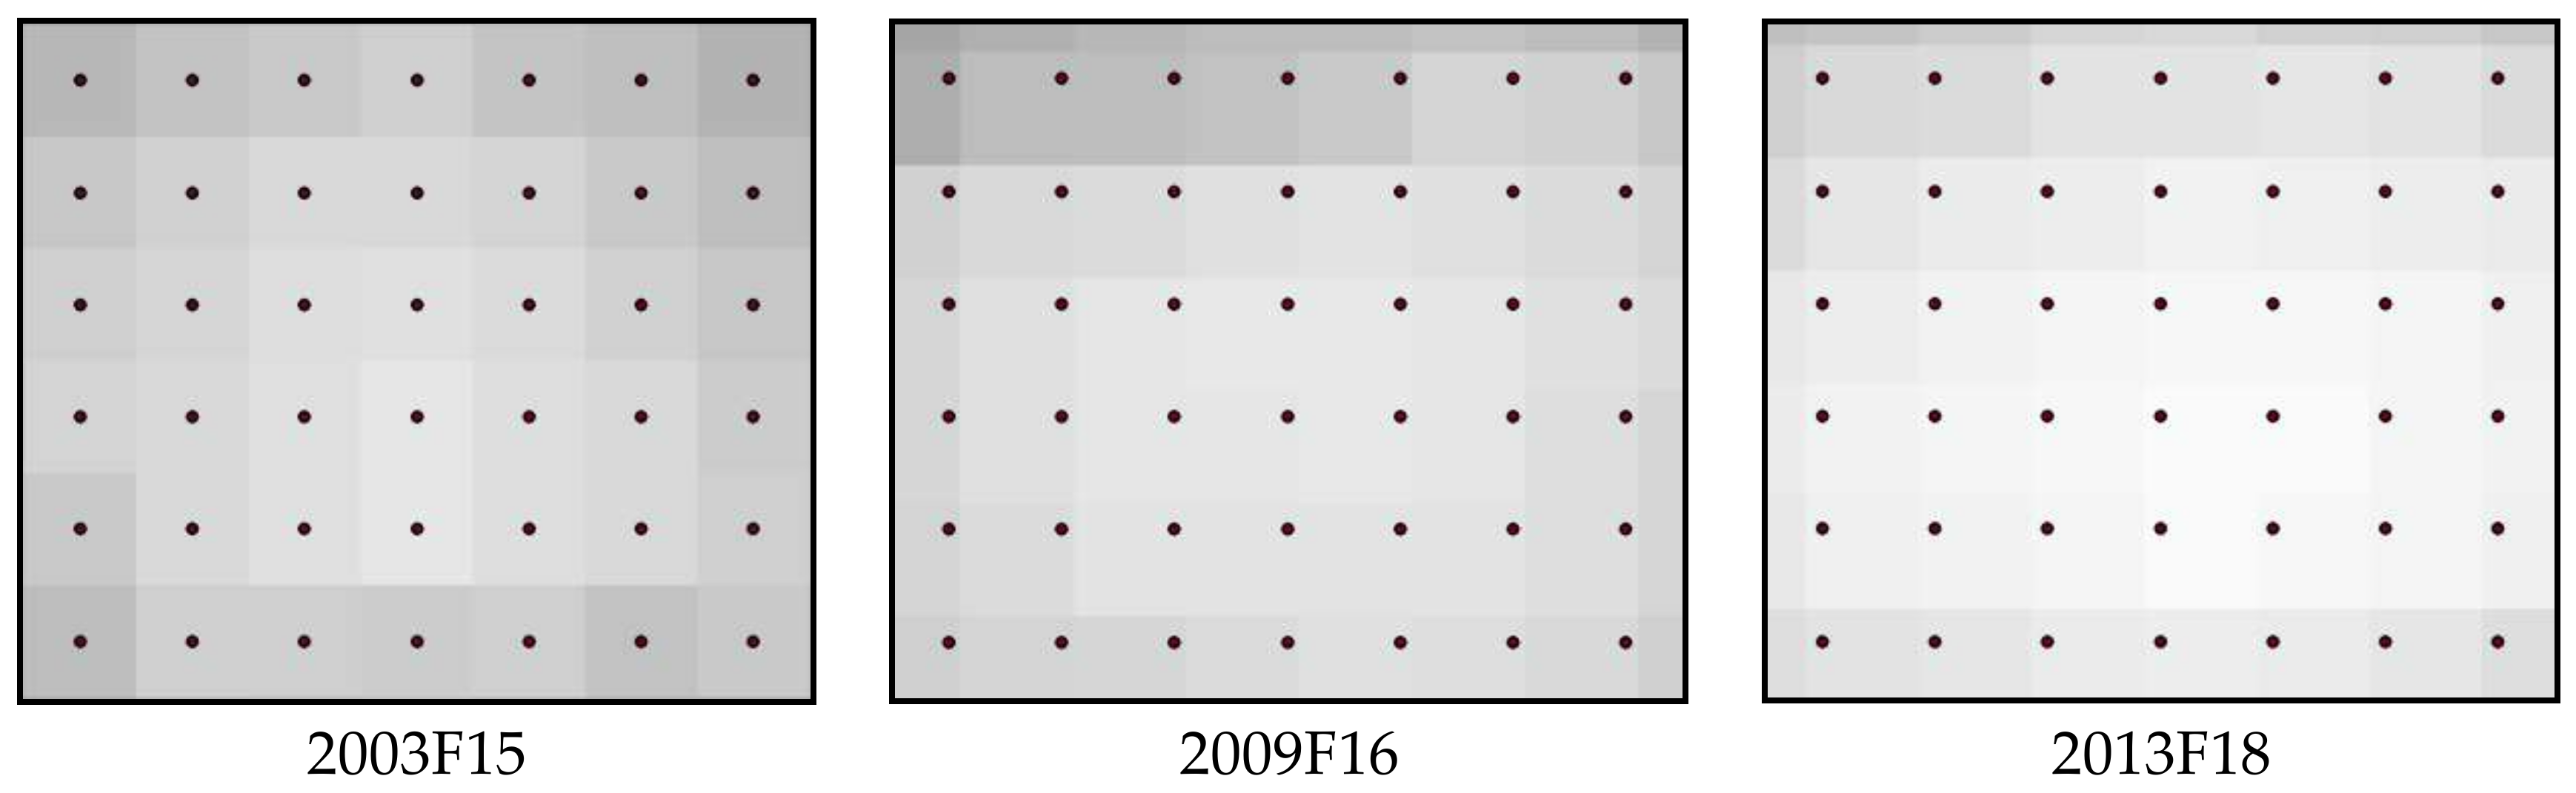
This study used DMSP/OLS NTL cloud-free annual composites images spanning over 11 years, from 2003 to 2013, from the V4DNLTS dataset. Data were obtained from the National Centers for Environment Information (NCEI, formerly NGDC) at the National Oceanic and Atmospheric Administration (NOAA) website [
25] and included data acquired by three DMSP satellites: F15, F16, and F18 (
Table 1). These data are recorded in two formats: frequency of lighting and average stable light. For this study, focused on the stable light product, which has a 6-b radiometric resolution such that the digital number (DN) values range from 0 (no lighting) to 63 (highest lighting), with a spatial resolution of 30 arc-seconds (about 1-km spatial resolution at the equator).
The original DMSP/OLS time series NTL images are not strictly registered with each other (
Figure 2). To reduce the influence caused by image registration error, the time series NTL images were uniformly reprojected onto the UTM-WGS84-49N coordinate system, and the pixel size was resampled to 1-km.
2.3. Automatic Intercalibration Method
As noted above, NTL data in the V4DNLTS dataset lack continuity and comparability and, thus, they cannot be used directly to extract the dynamics of HA in areas affected by the Wenchuan earthquake. Many scholars have proposed different intercalibration methods to correct the global or local NTL images. The most commonly used methods are shown in
Table 2. Most of the existing calibration methods follow Elvidge’s paradigm, but use different calibration sites [
18,
19,
21]. In addition, Zhang and Li have used a globally-consistent and regionally-consistent bias, respectively, to calibrate the NTL images [
22,
24].
The goals of all NTL calibration methods are similar in principle. That is to create a consistent time series so that different images are directly comparable. The calibration method presented by Elvidge requires manual selection of the unchanged region. The quality of invariant regional selection has a great impact on calibration results. When dealing with a rapidly-developing local region, this dynamic becomes a challenge. Liu and Yu use the same intercalibration method as Elvidge’s [
19,
21]. Although they all adopt a post-adjustment after intercalibration to improve the consistency of the time series NTL data, the defect that samples are selected manually is still not resolved. The precondition of Zhang’s method can only hold at the global scale, since, at local scales, the majority of the pixels might not be treated as pseudoinvariant features, such as Beijing, China, which experiences a great deal of change over a relatively short period. Li assumed that on-ground changes appear as outliers in a scatterplot generated from two NTL image pairs and that a linear equation can correct systematic biases after removing the outliers; this represents an automatic approach eliminating the need to manually choose the stable regions. However, it is difficult to distinguish between on-ground changes and systematic biases only using two-image pairs, especially when the surface changes rapidly. Furthermore, the linear regression is not always optimal.
After analyzing the above methods, it was assumed that the time-series features of NTL images should be used to minimize the effects of on-ground changes and that the artificial error in the selection of stable regions could be avoided. To overcome the shortcomings of the above methods, a novel automatic intercalibration method was proposed. The hypothesis was as follows:
If there are stable pixels on the time series NTL images, the change ranges of their NTL value should be less than other pixels. Stable pixels refer to the consistently lit pixels with little on-ground changes.
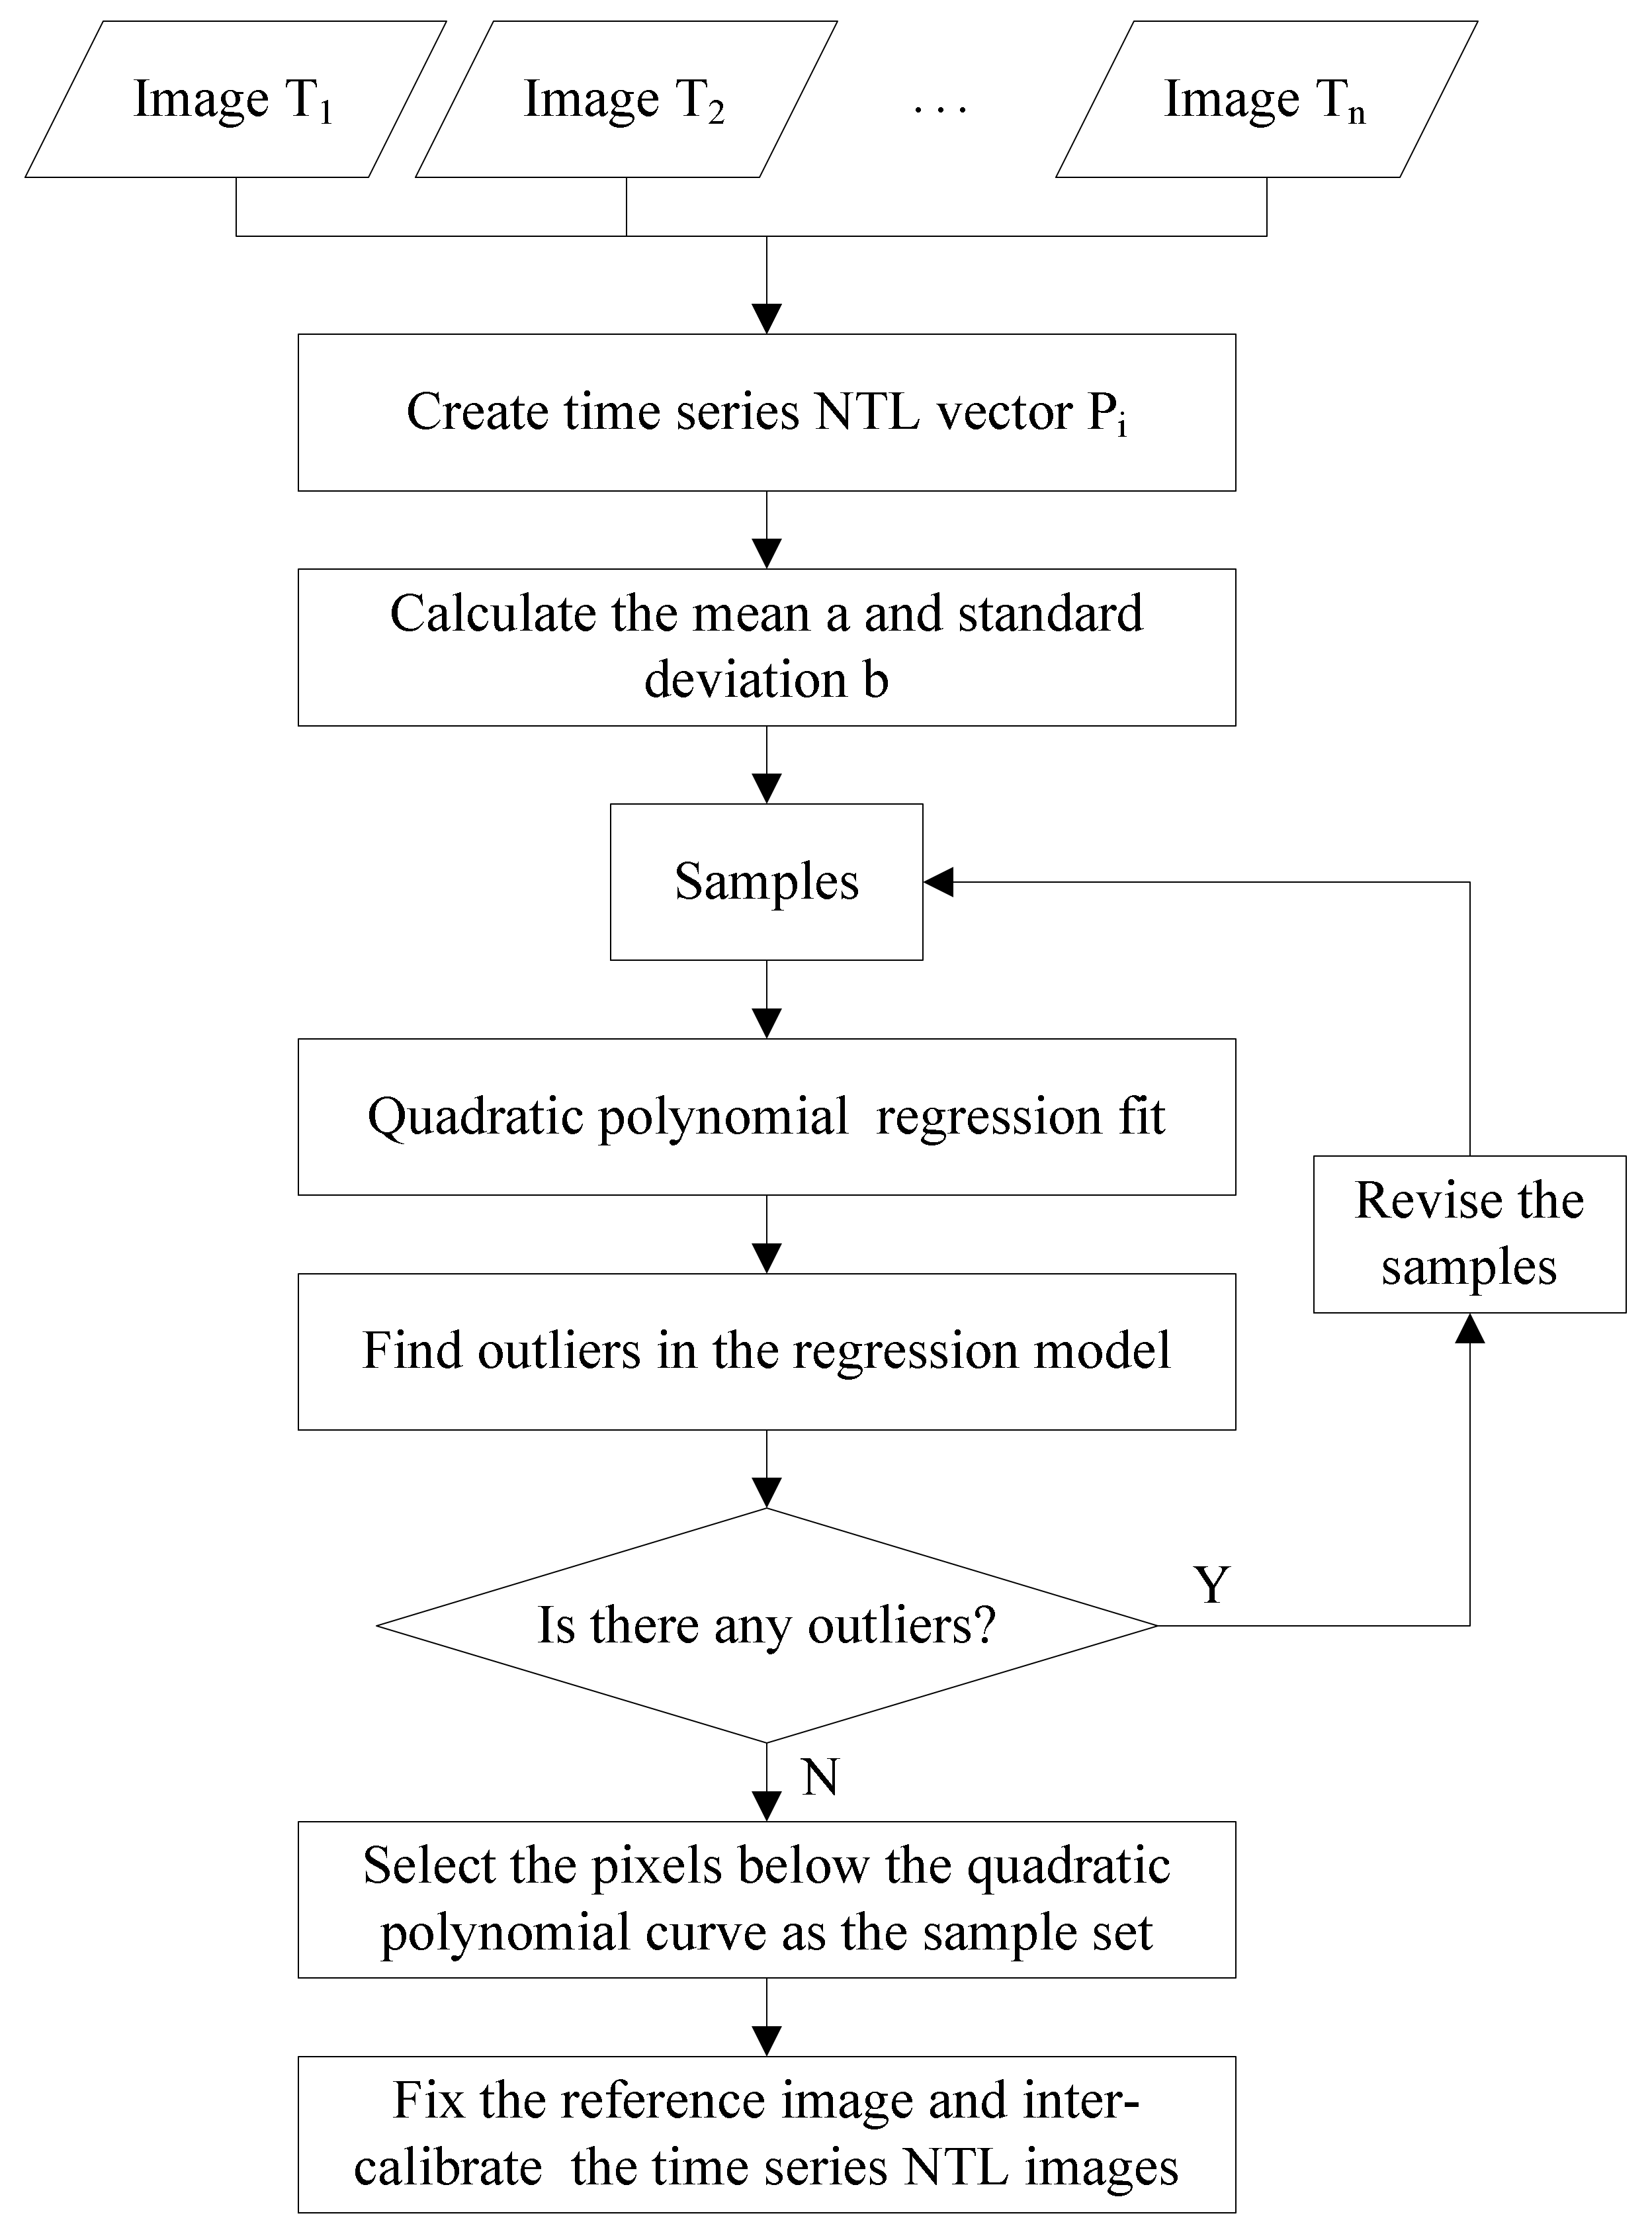
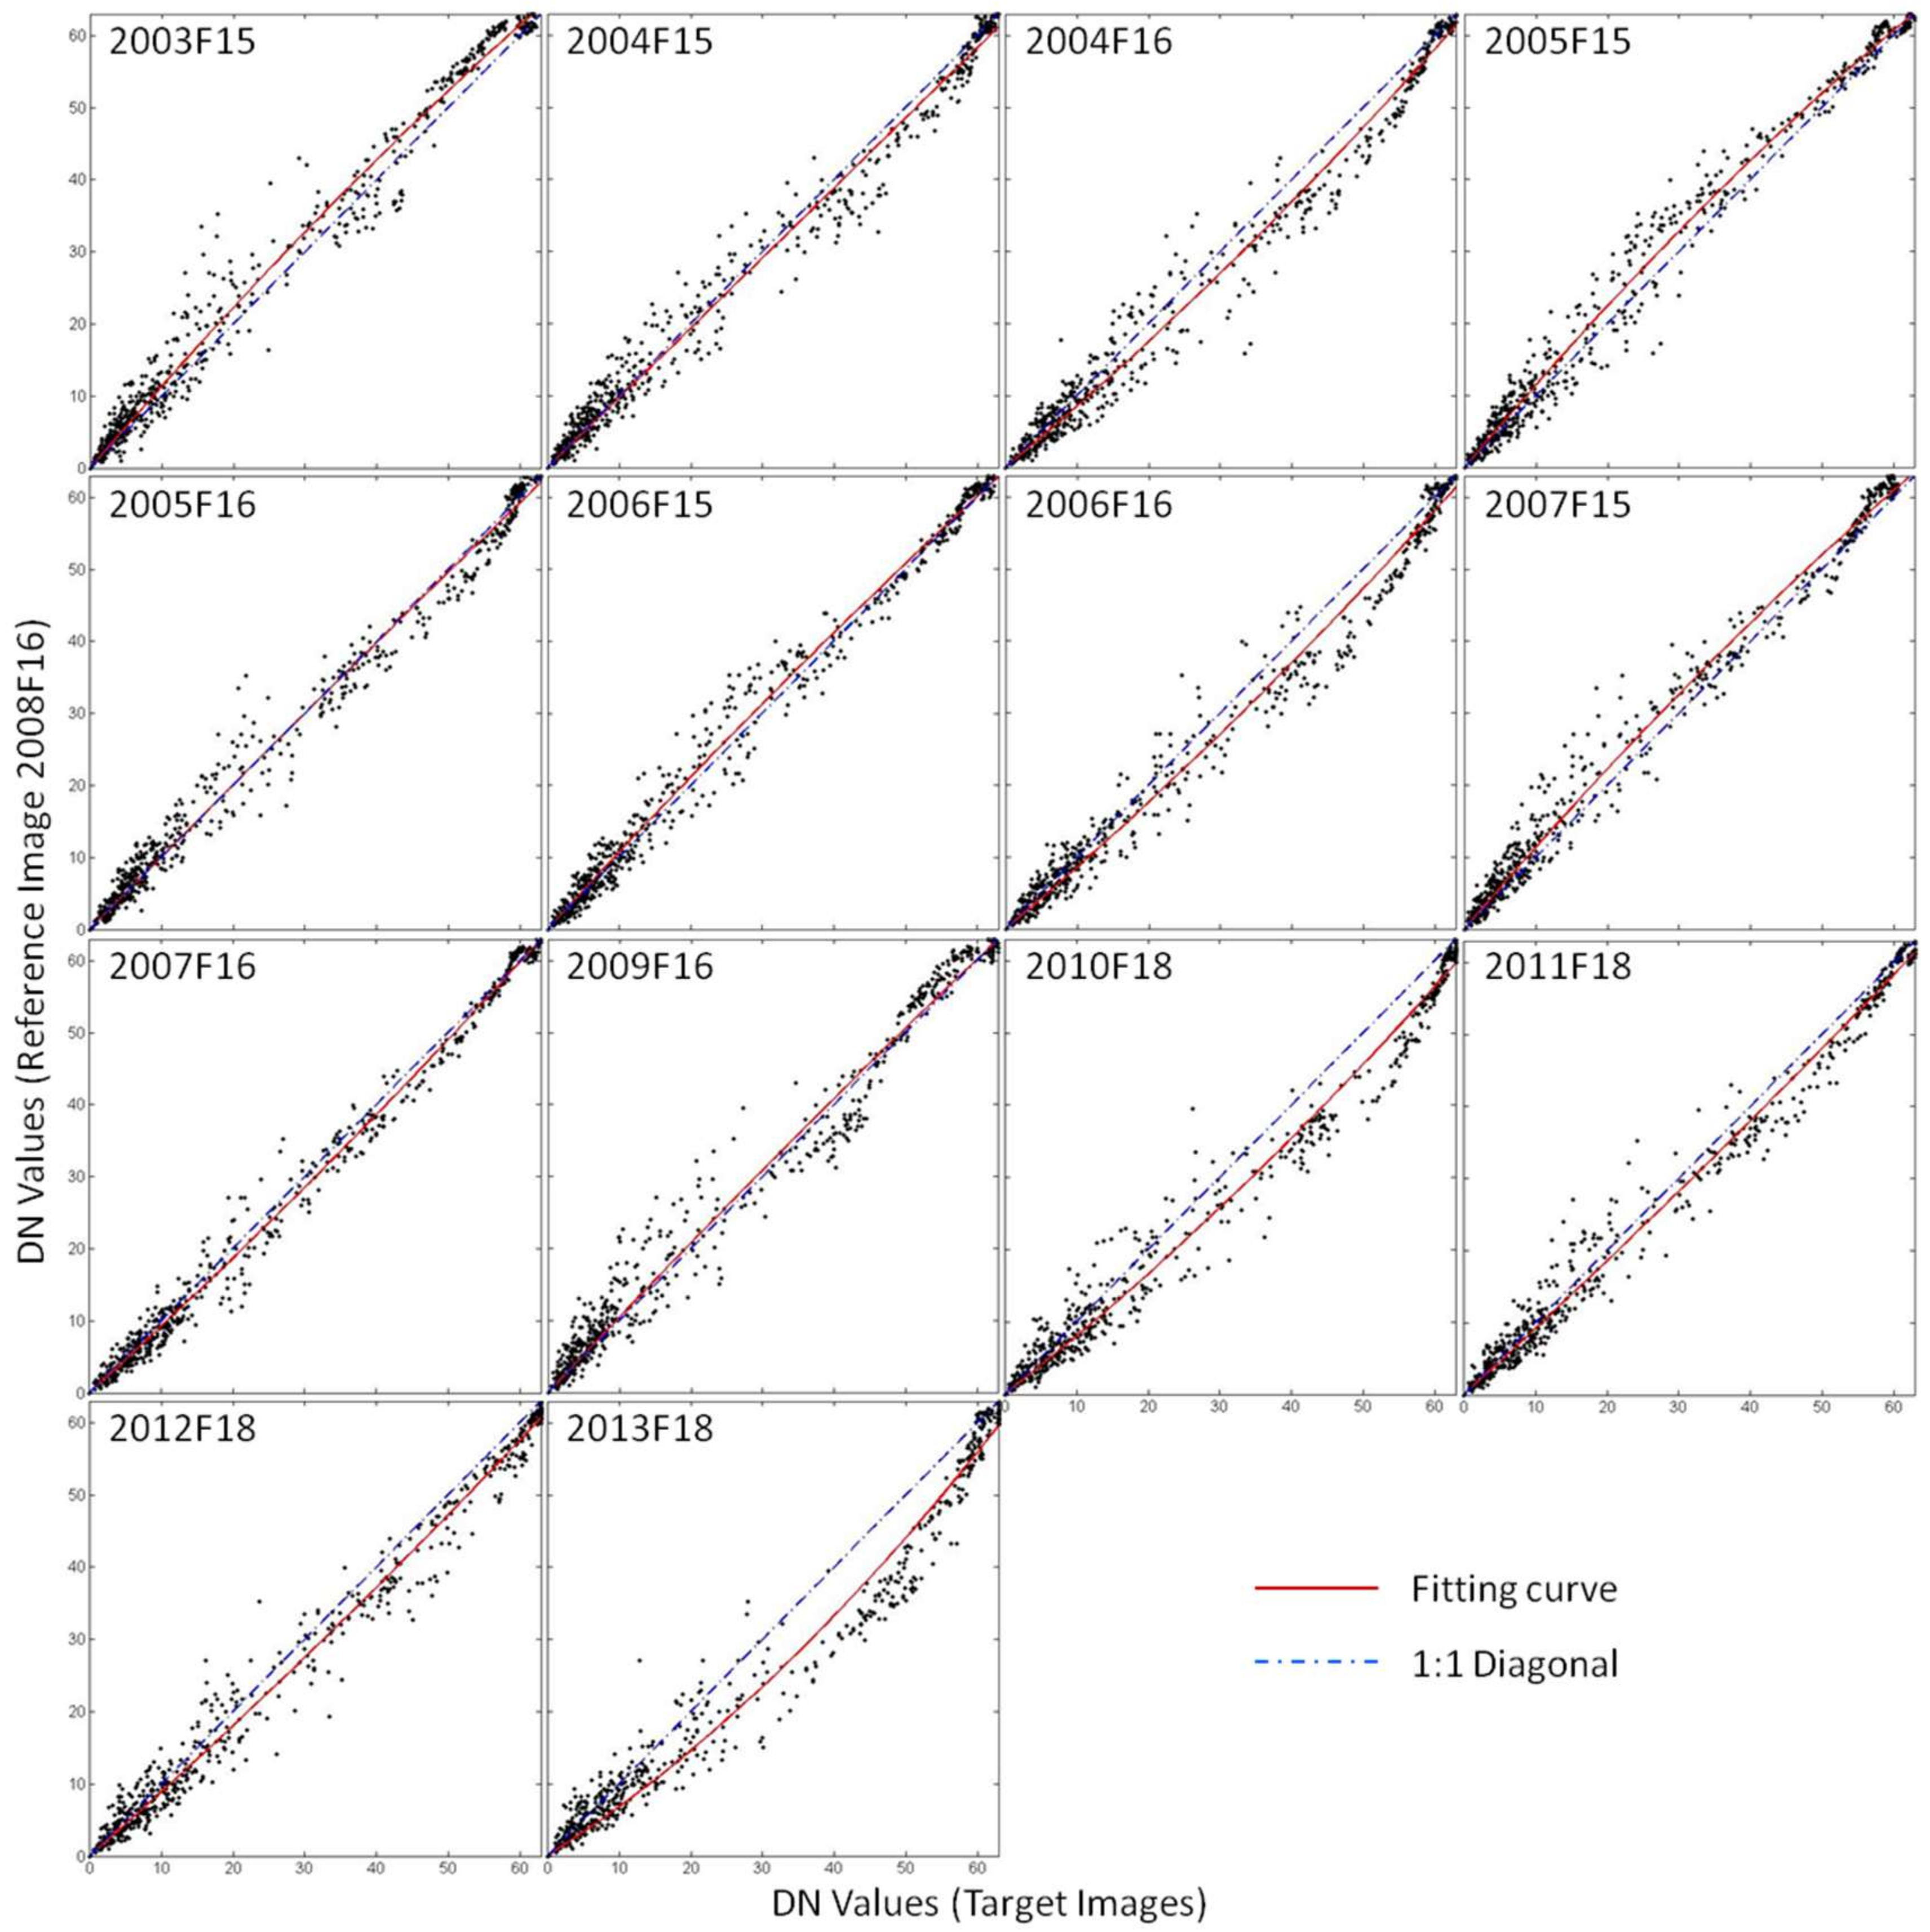
Based on the above assumptions, an automatic iteration process was used to search for the pixels with stable NTL. Then, the coefficients of intercalibration were calculated based on these pixels. The automatic intercalibration algorithm has the following steps (
Figure 3):
Let {T1, T2,…, Tn} denote the time series NTL images, which have the same size; the vector Pi denote the DN value of {T1, T2,…, Tn}, written as Pi = {DNi1, DNi2,…, DNin}, where DNi1 denotes the ith pixel value in image T1 and n denotes number of time series NTL images.
Calculate the mean and standard deviation of Pi, written as a = {a1,a2,…,am} and b = {b1,b2,…,bm}, where ai denotes the mean value of Pi, bi denotes the standard deviation value of Pi and m denotes the total number of the pixels in image T1. At first, all the pixels in time series NTL images are employed as the samples.
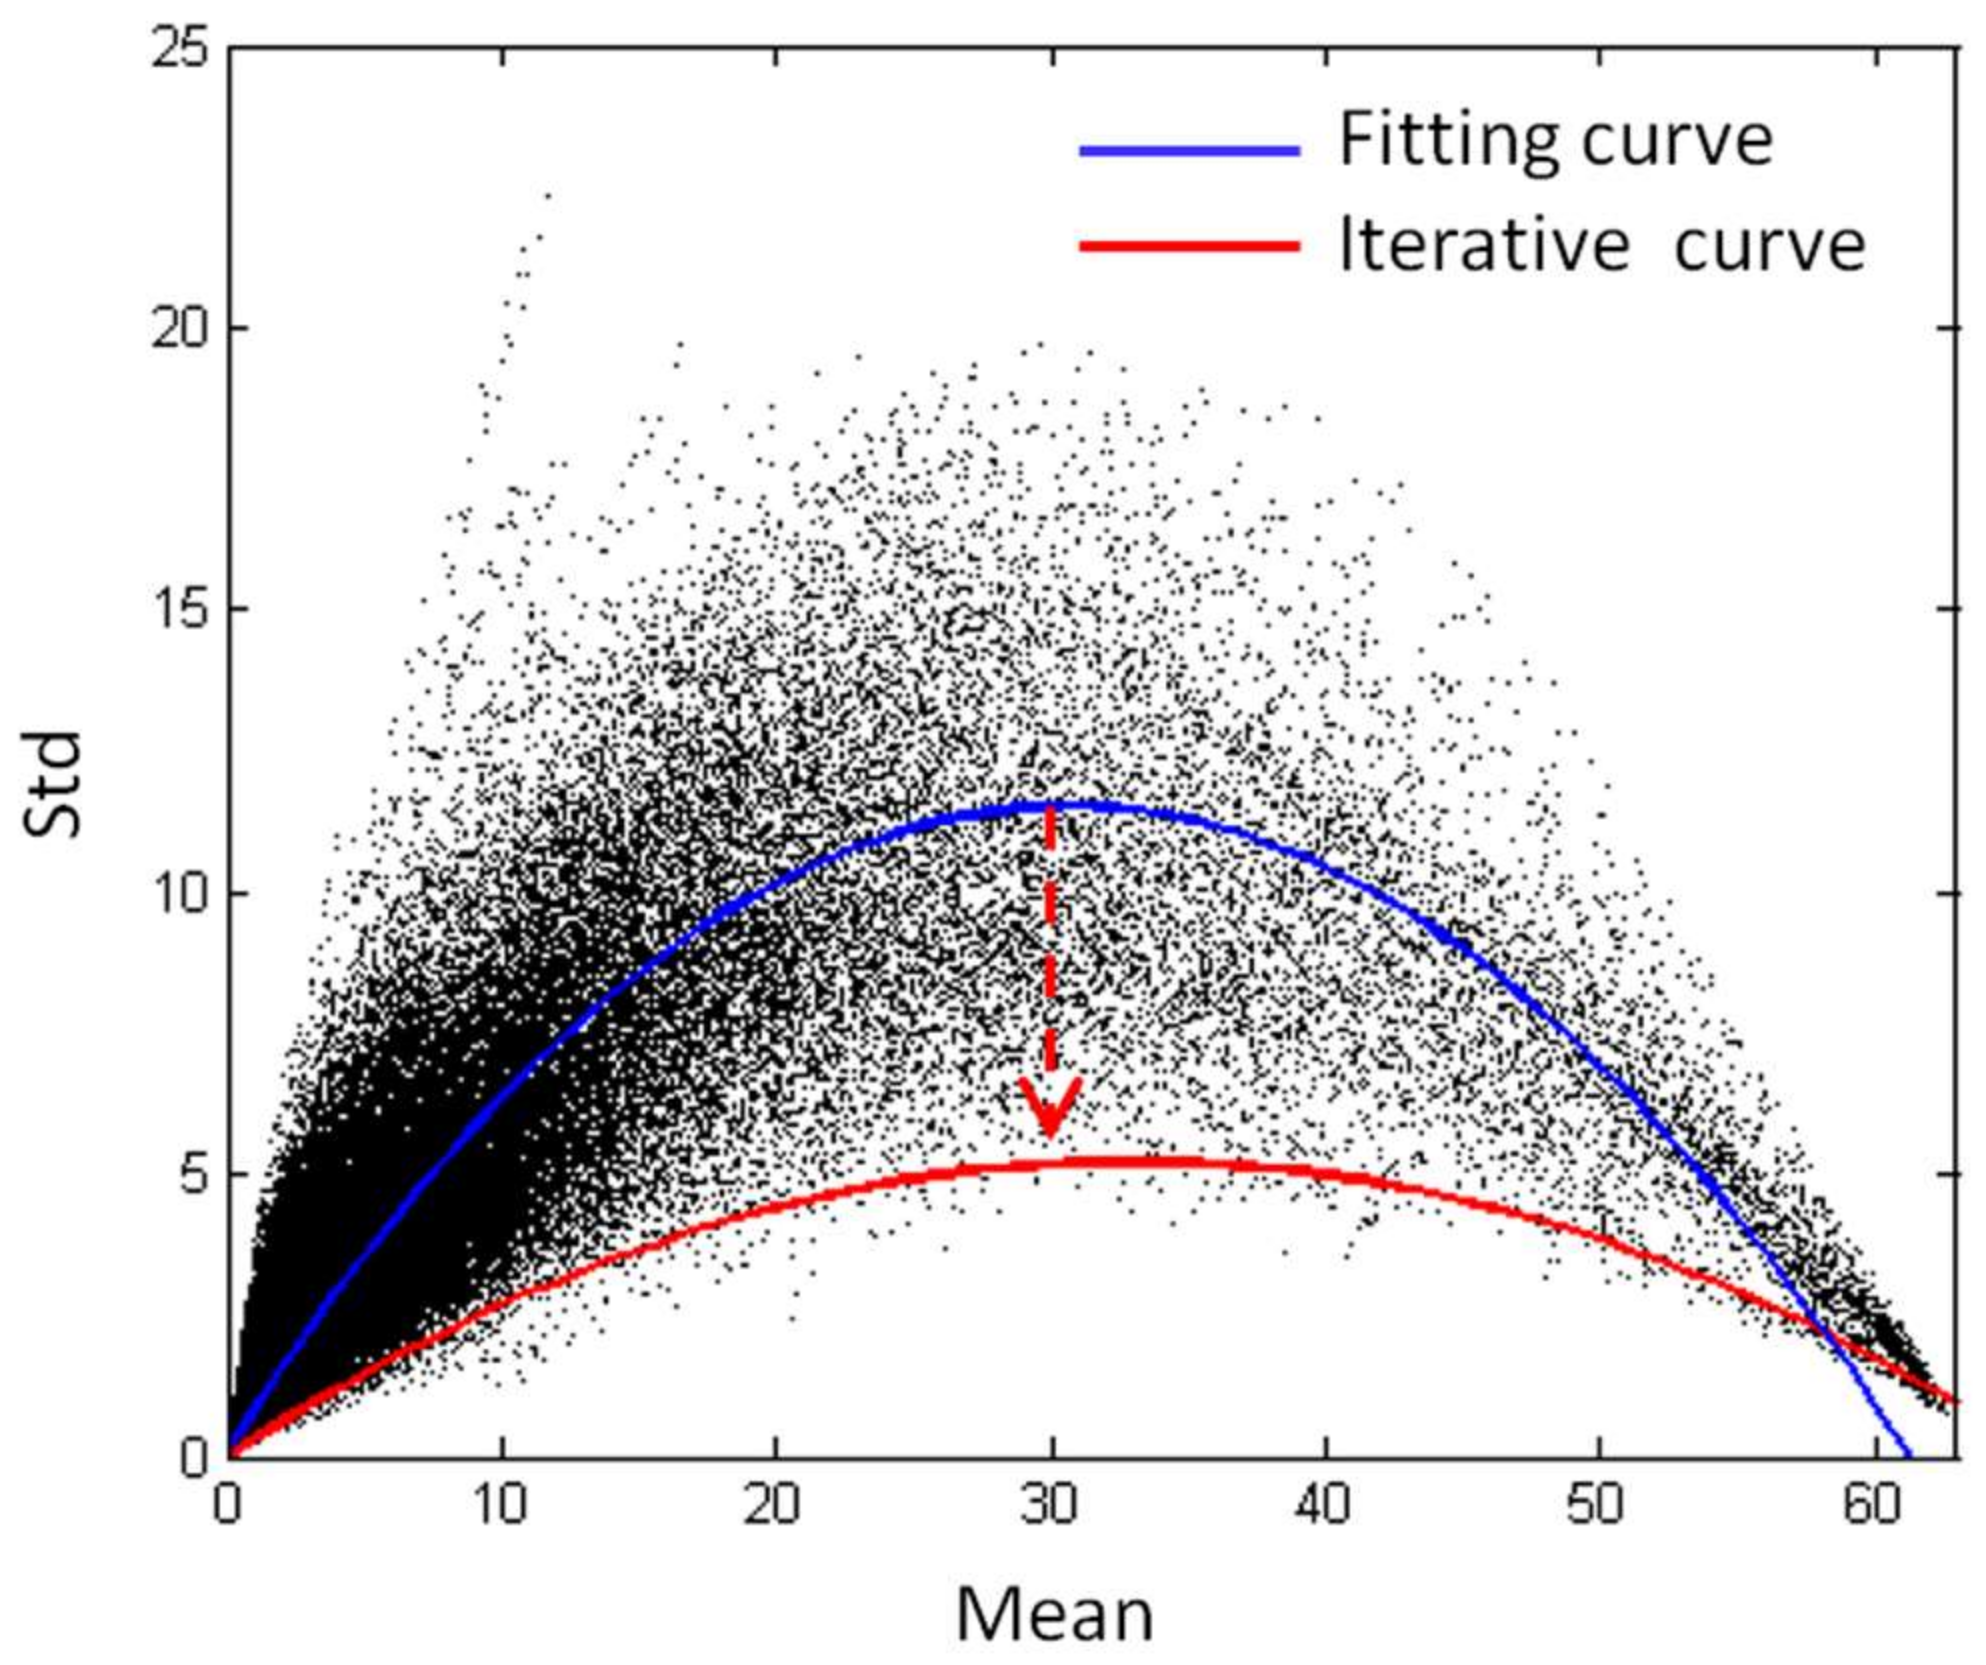
Then, a quadratic polynomial regression is used to fit the scatterplots of a and b.
The predicted values marked as b’ are derived by entering the sample a and the fitting parameters. Calculate the difference between b and b’ as Δb = b–b’ and derive the standard deviation of this difference as SΔb. Then, define the outliers as the samples {(ai,bi): Δbi < −kSΔb}, where Δbi is the ith element in the vector variable Δb and k is set to 2 in this study. If there is no outlier from the above definition, go to step 6.
Update the two groups of samples by removing the samples {(ai,bi): Δbi > kSΔb} from pixel samples a and b, and go back to step 3.
Select the pixels below the last quadratic polynomial curve as the invariant pixels. Fix a reference image and intercalibrate the time series NTL images.
2.4. Classification of Human Activity Pattern
The DN values of the NTL images are highly correlated with HA; this dynamic is independent and objective with spatiotemporal continuity. The calibrated NTL images were used to obtain the intensity of HA in the study area. To remove the intra-annual unstable lit pixels and to make full use of the information derived from the two satellites for the same year, an intra-annual composition was performed. First, we examined all lit pixels to identify whether the pixels were intra-annual unstable lit pixels. A lit pixel was defined as an intra-annual unstable lit pixel if it was detected by only one satellite. Second, in intra-annual composites, DN values of intra-annual unstable lit pixels were replaced with values of zero, and the DN value of each intra-annual stable lit pixel was replaced by the averaged DN value of two NTL images from the same year:
where
and
are DN values of the
ith lit pixel from two NTL images in the
nth year, respectively, and
is the DN value of the
ith lit pixel of intra-annual composite in the
nth year.
To facilitate the description of patterns of HA, HA are divided into these four levels: high HA, medium HA, low HA, and inactivity. High HA indicates that HA in the area is stable and well-lit, such as in cities. Medium HA indicates that HA in the area is stable, but less intense, such as in villages or settlements with smaller populations. Low HA indicates that HA in the area is temporary and unstable, such as during the construction of large projects.
Many methods are available to extract useful information from NTL imagery, including an empirical thresholding technique [
26] and an image-classification method [
27]. Of these methods, the thresholding technique with ancillary data has been widely used because of its simplicity and relatively high accuracy and reliability [
28,
29]. Therefore, we used the thresholding technique developed by Henderson [
28], along with ancillary data, to extract the HA information in study area, after first systematically correcting NTL data for the 2003–2013 period. Notably, the long time interval will affect the consistency of time series NTL data. Although the intercalibration can correct the biases, a high level of inconsistencies remain at the pixel level in the calibrated NTL time series [
22]. The ancillary data helps shorten the time intervals. This can improve the accuracy of subsequent analysis. Land cover data of International Geosphere-Biosphere Programme (IGBP) in 2005 and GLC30 data in 2010 were used as references to determine the thresholds of different HA levels and extracted the spatial extent of different HA levels during these two years (2005 and 2010) using land cover data (
Table 3). These optimal thresholds were applied to other years in the time series; thus, the threshold for 2005 was applied to the period 2003–2008, and the threshold for 2010 was applied to the period 2009–2013.
In the study of urban extent extraction, a minimum DN value is usually set to exclude systematic biases, which often focus on low values. However, pixels with low DN value are one of the research objects which cannot be discarded in the study of HA. To balance the retention of useful information and bias interference, the lower limit of low HA was empirically defined as 1.
4. Discussion
4.1. Trends of Human Activity
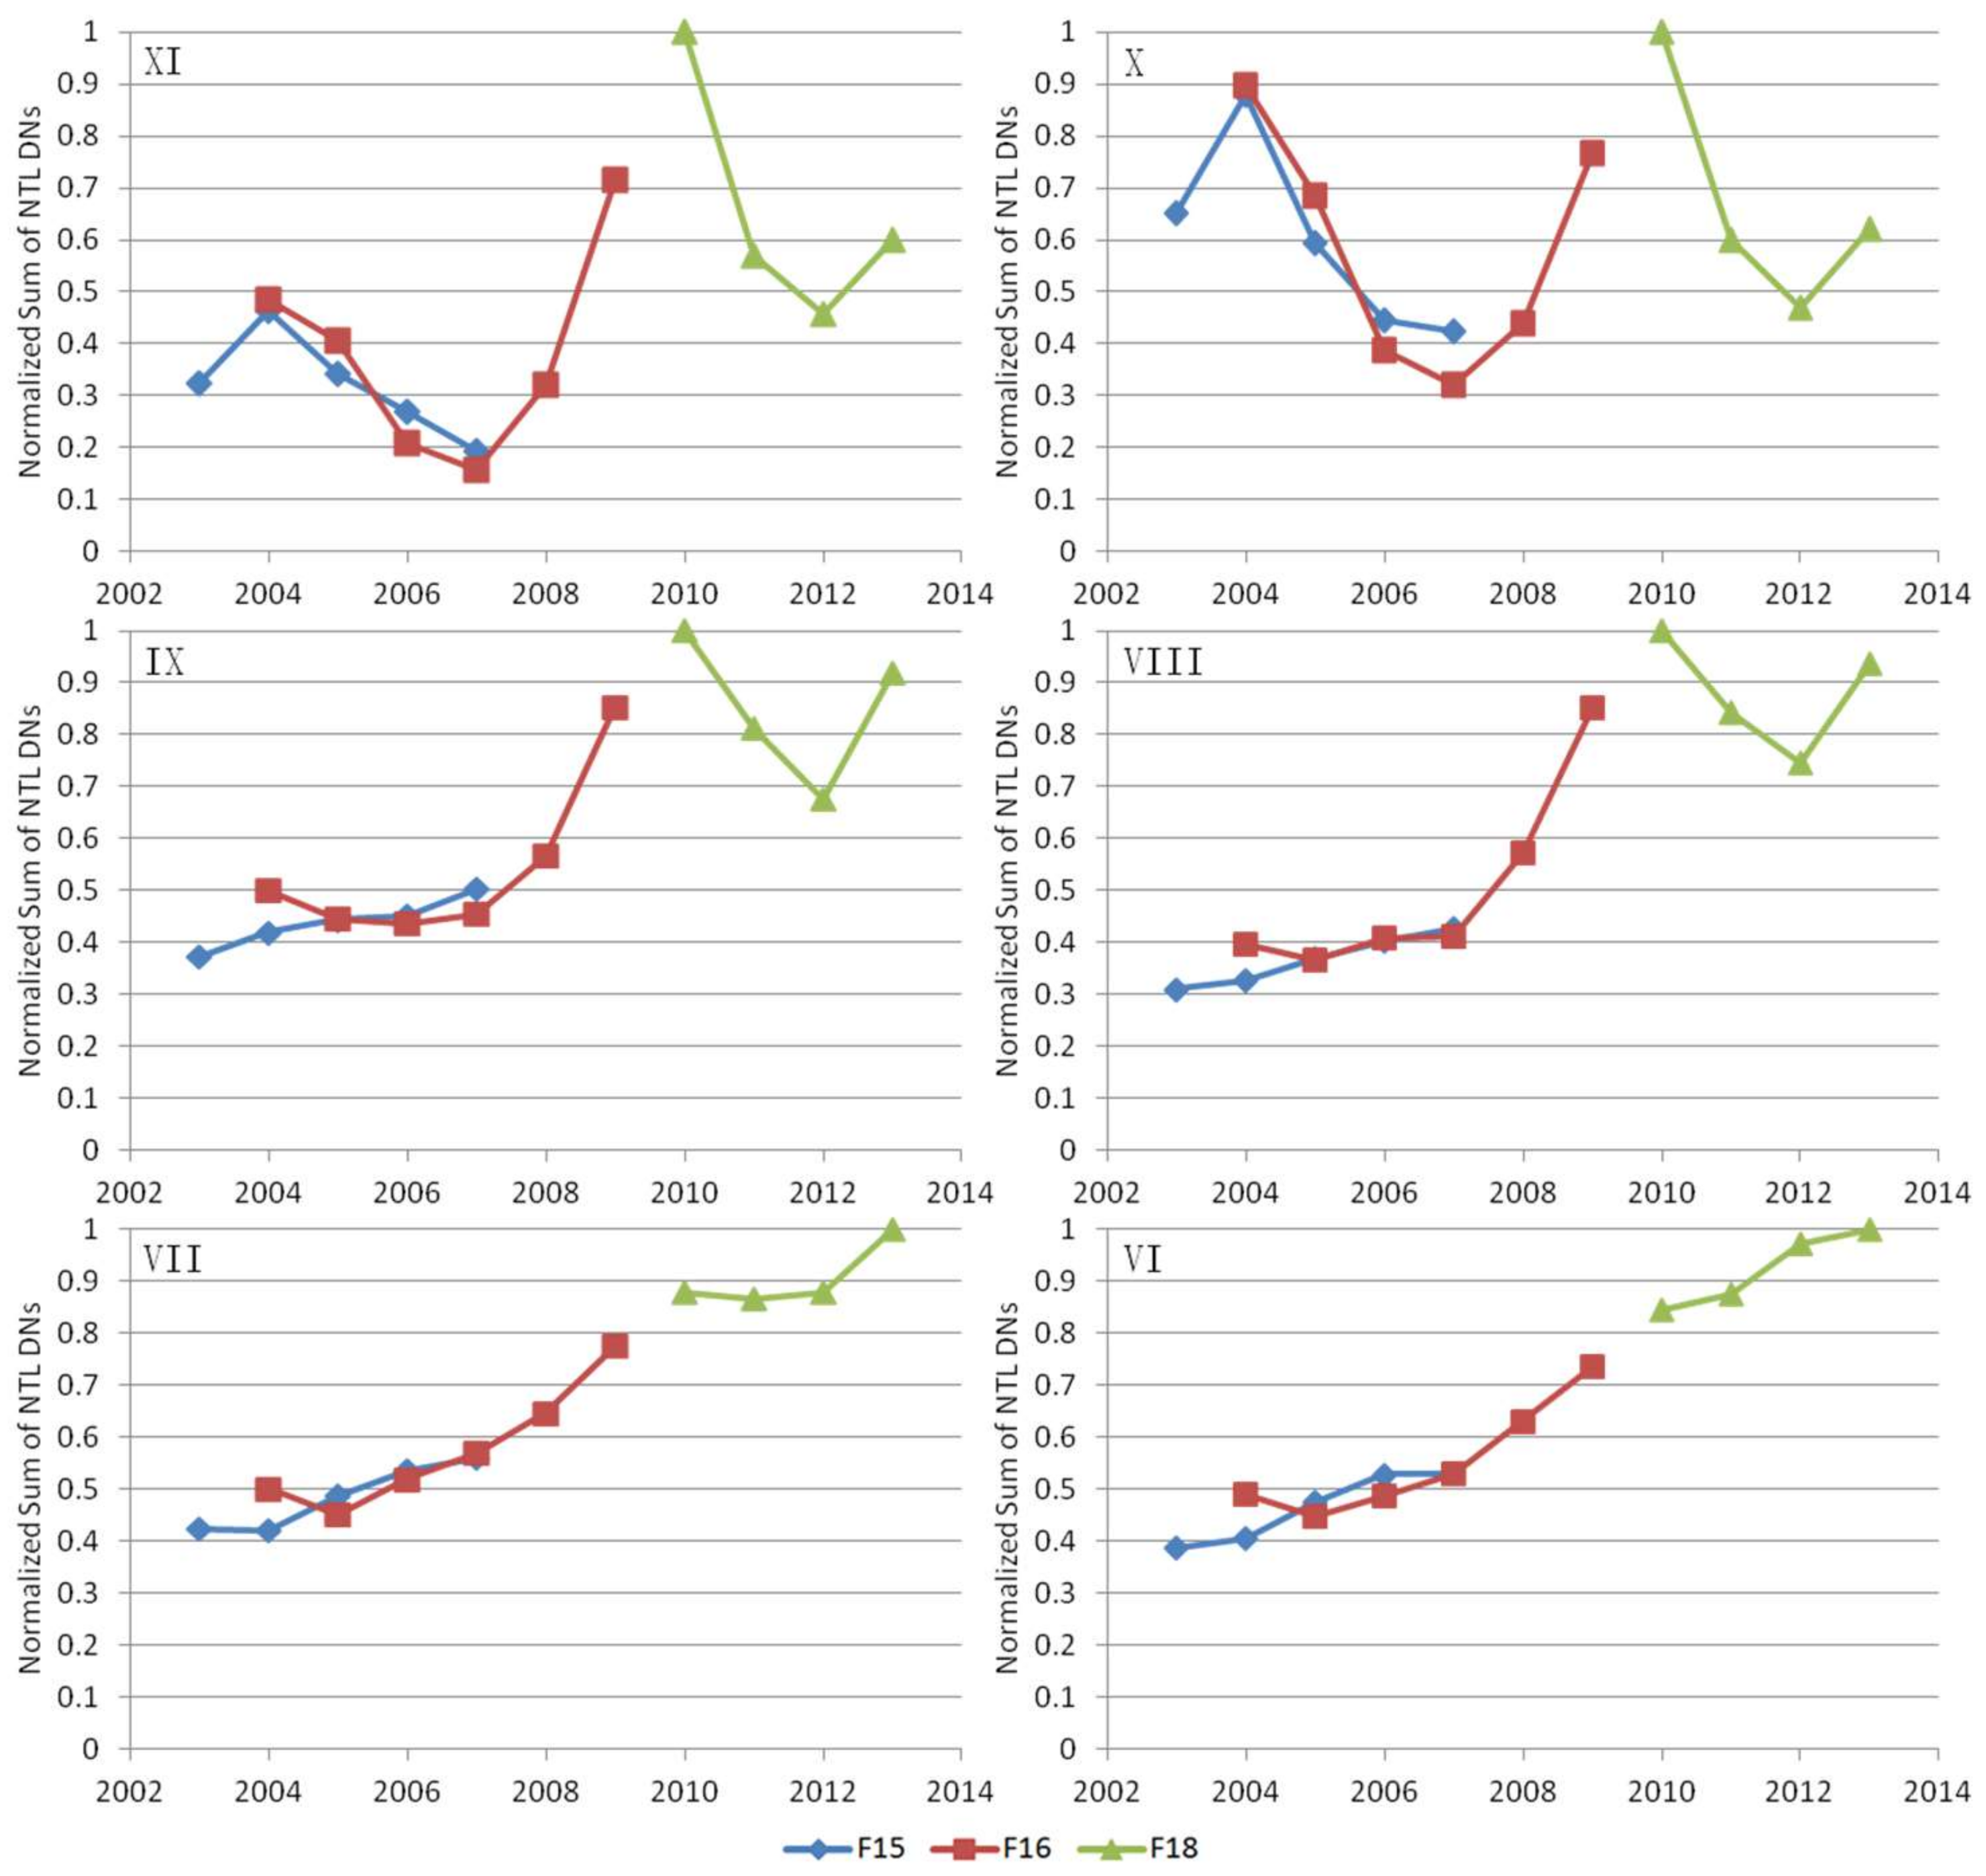
In
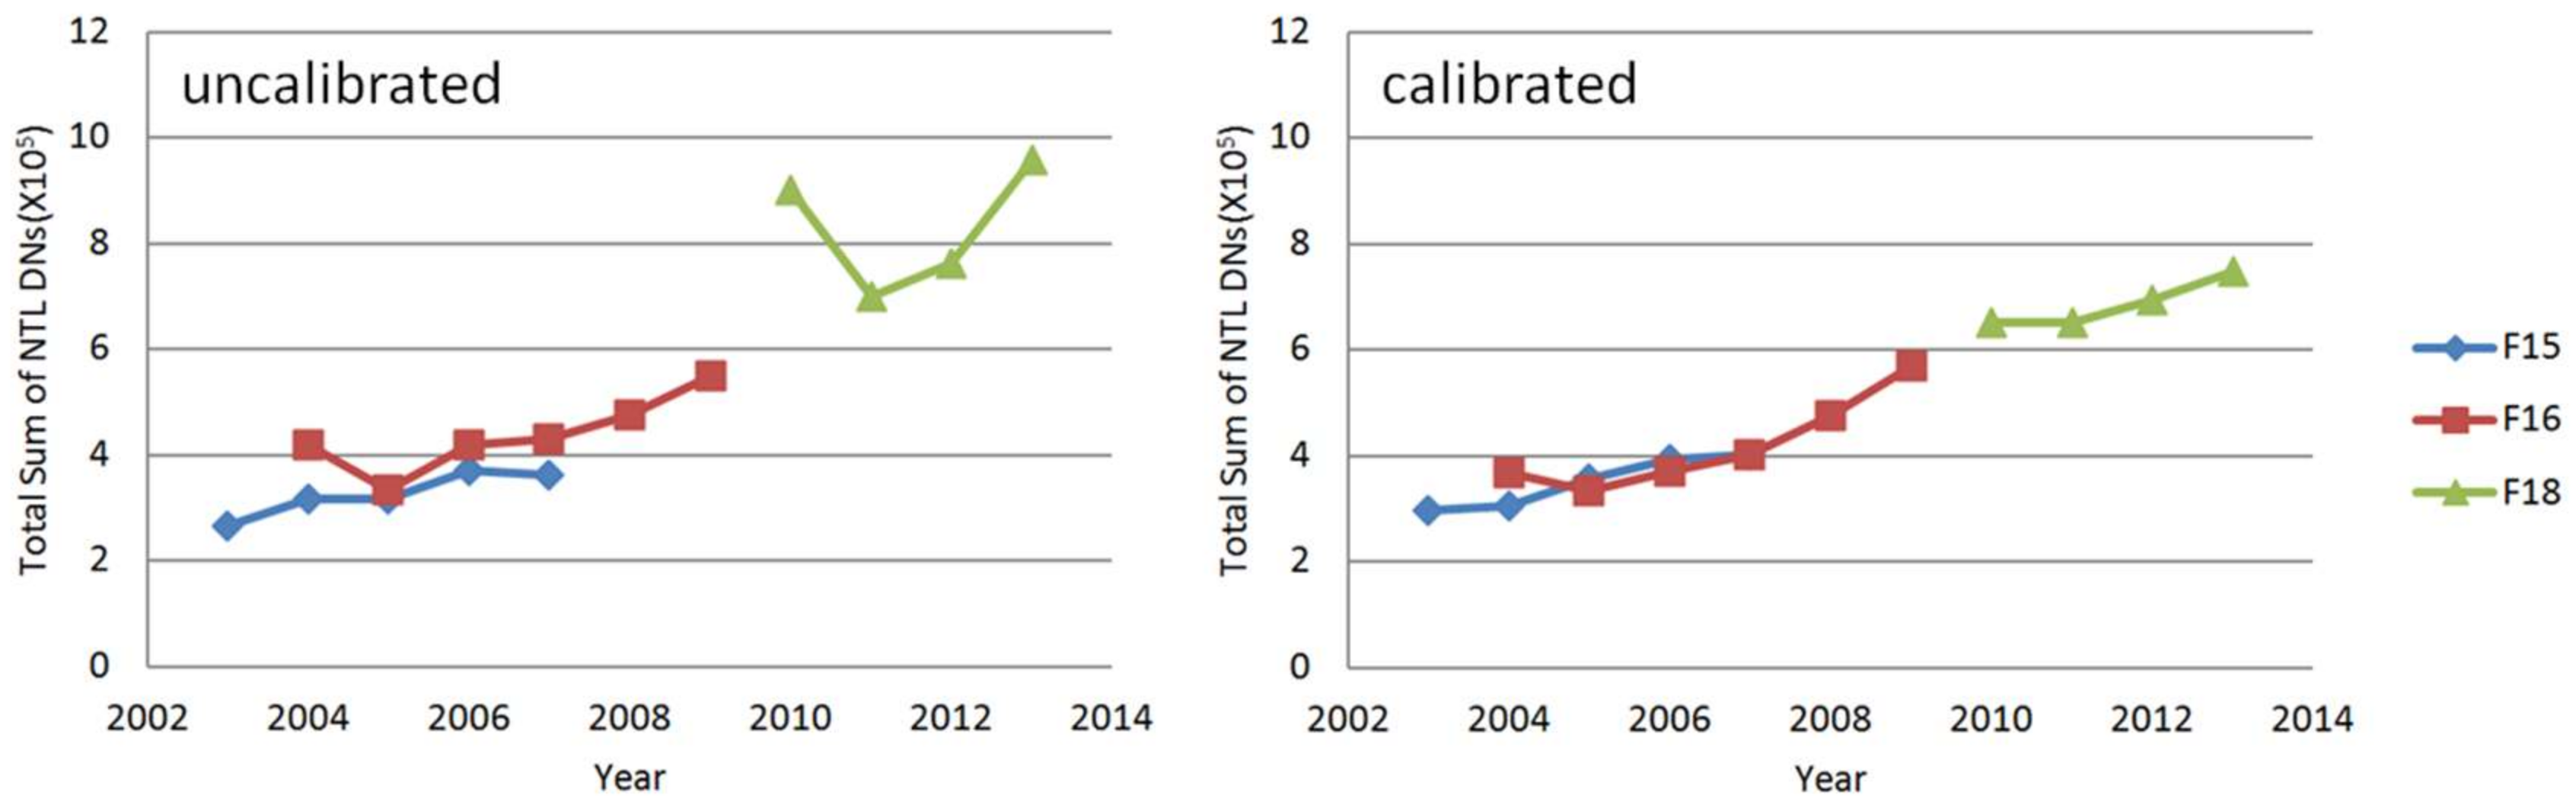
Figure 7, the peaks in 2010 are observed in XI, X, IX, and VIII regions, which is similar with the uncalibrated NTL data in
Figure 6. This phenomenon may be caused by two reasons. First, there are residual biases in the calibrated NTL data. Studies have shown that the intercalibration can correct the systematic biases, but it can be difficult to correct random noises [
19,
20]. Moreover, random noises mainly affect low NTL values. It will affect the sum of NTL when the statistical region is small and lacks enough well-lit pixels. Second, reconstruction after the Wenchuan earthquake led to development in these regions. Since the peaks in XI and X regions in 2004 are different from the uncalibrated NTL data and the areas of XI and X regions are small, the second reason is considered as the main factor. The increase in HA from 2008 to 2010 came from the implementation of various infrastructure projects, such as homes, roads, and bridges. Since 2011, major reconstruction and restoration projects have been completed in these regions, and development has gradually stabilized. Time series changes of HA levels shown in
Figure 8 illustrate that the fluctuation of HA in XI and X regions before 2008 is consistent with the construction stage of the DU-Wen highway. For the VII and VI regions, HA changes caused by the Wenchuan earthquake are not obvious. This observation demonstrates that the Wenchuan earthquake had little impact on economic development in this area and that the rate of development in the VII and VI regions remained stable.
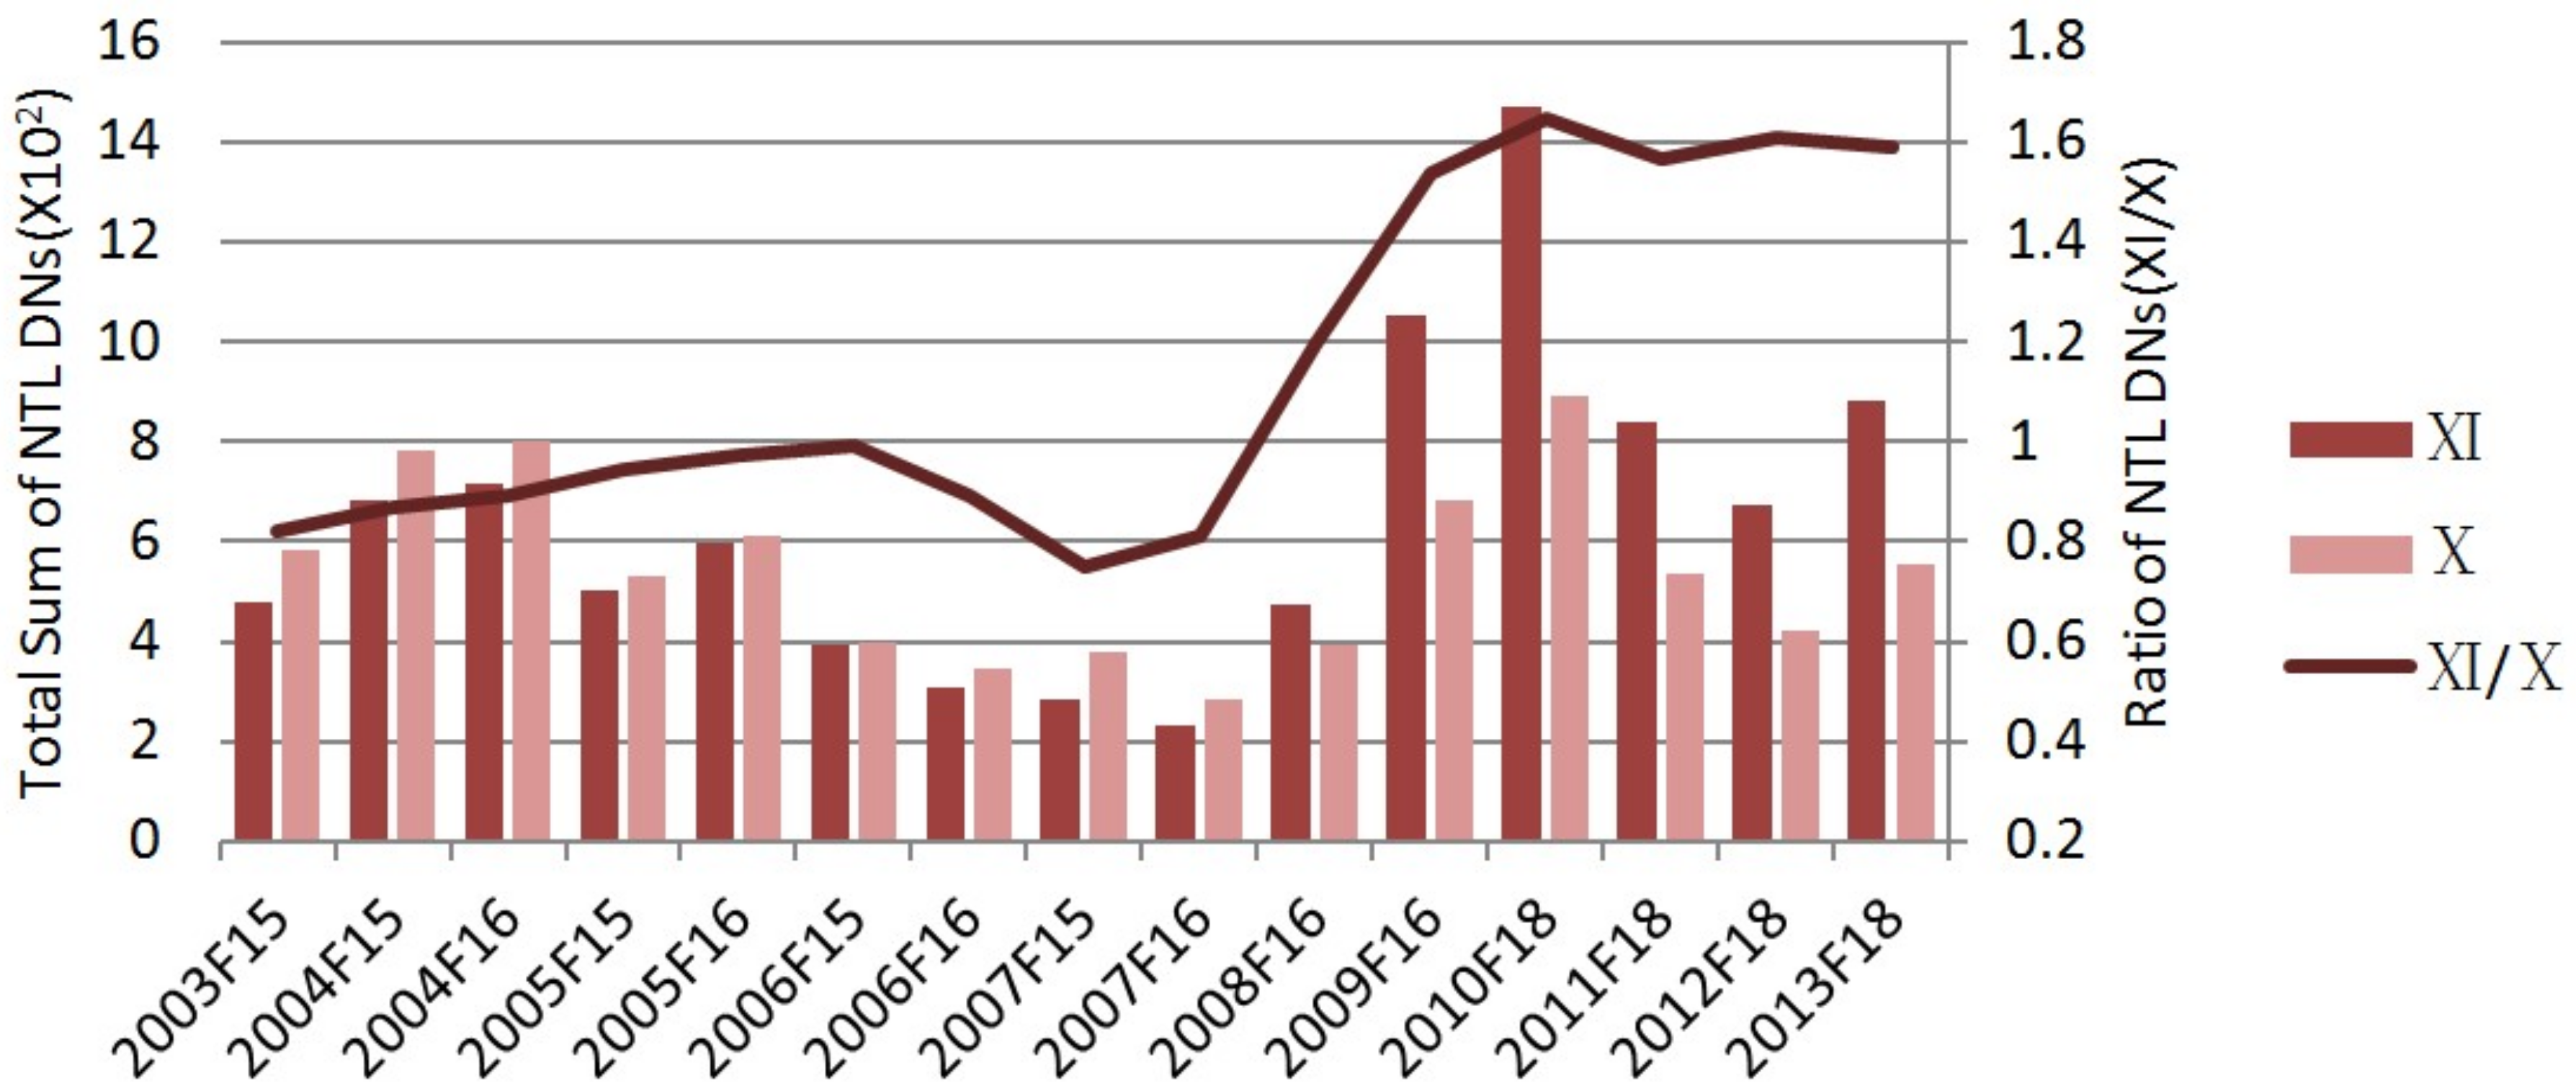
Notably, although the changing trends in the normalized sum of NTL in the XI and X regions before and after the Wenchuan earthquake are consistent, the proportion of the two changed after the earthquake. As seen in
Figure 9, from 2003 to 2007, the ratio of the total sum of NTL in the XI and X regions remained between 0.8 and 1.0, while the total sum of NTL in the XI region never exceeded the quantity in the X region before 2008. After the Wenchuan earthquake, the total sum of NTL in the XI region exceeded that in the X region for the first time. The proportion increased annually and stabilized at 1.6 after 2010. This suggests that patterns of HA in the XI and X regions were greatly changed by the reconstruction and recovery. The rise ratio of the total sum of NTL in the XI and X regions can be explained thusly: the damage in the XI region was more serious than the damage in the X region, and the XI region received more reconstruction and restoration attention, which led to greater HA in the XI region. This change not only occurred during the reconstruction period, but continued during the stabilization period. It seems that the earthquake destroyed this area, but the reconstruction made it better than before. We conclude that, with the post-earthquake reconstruction, the social and economic environment in the XI region has been restored and, indeed, surpassed the prior benchmark, which is the main reason for its rise in HA as compared to the X region.
4.2. Spatiotemporal Patterns of Human Activity
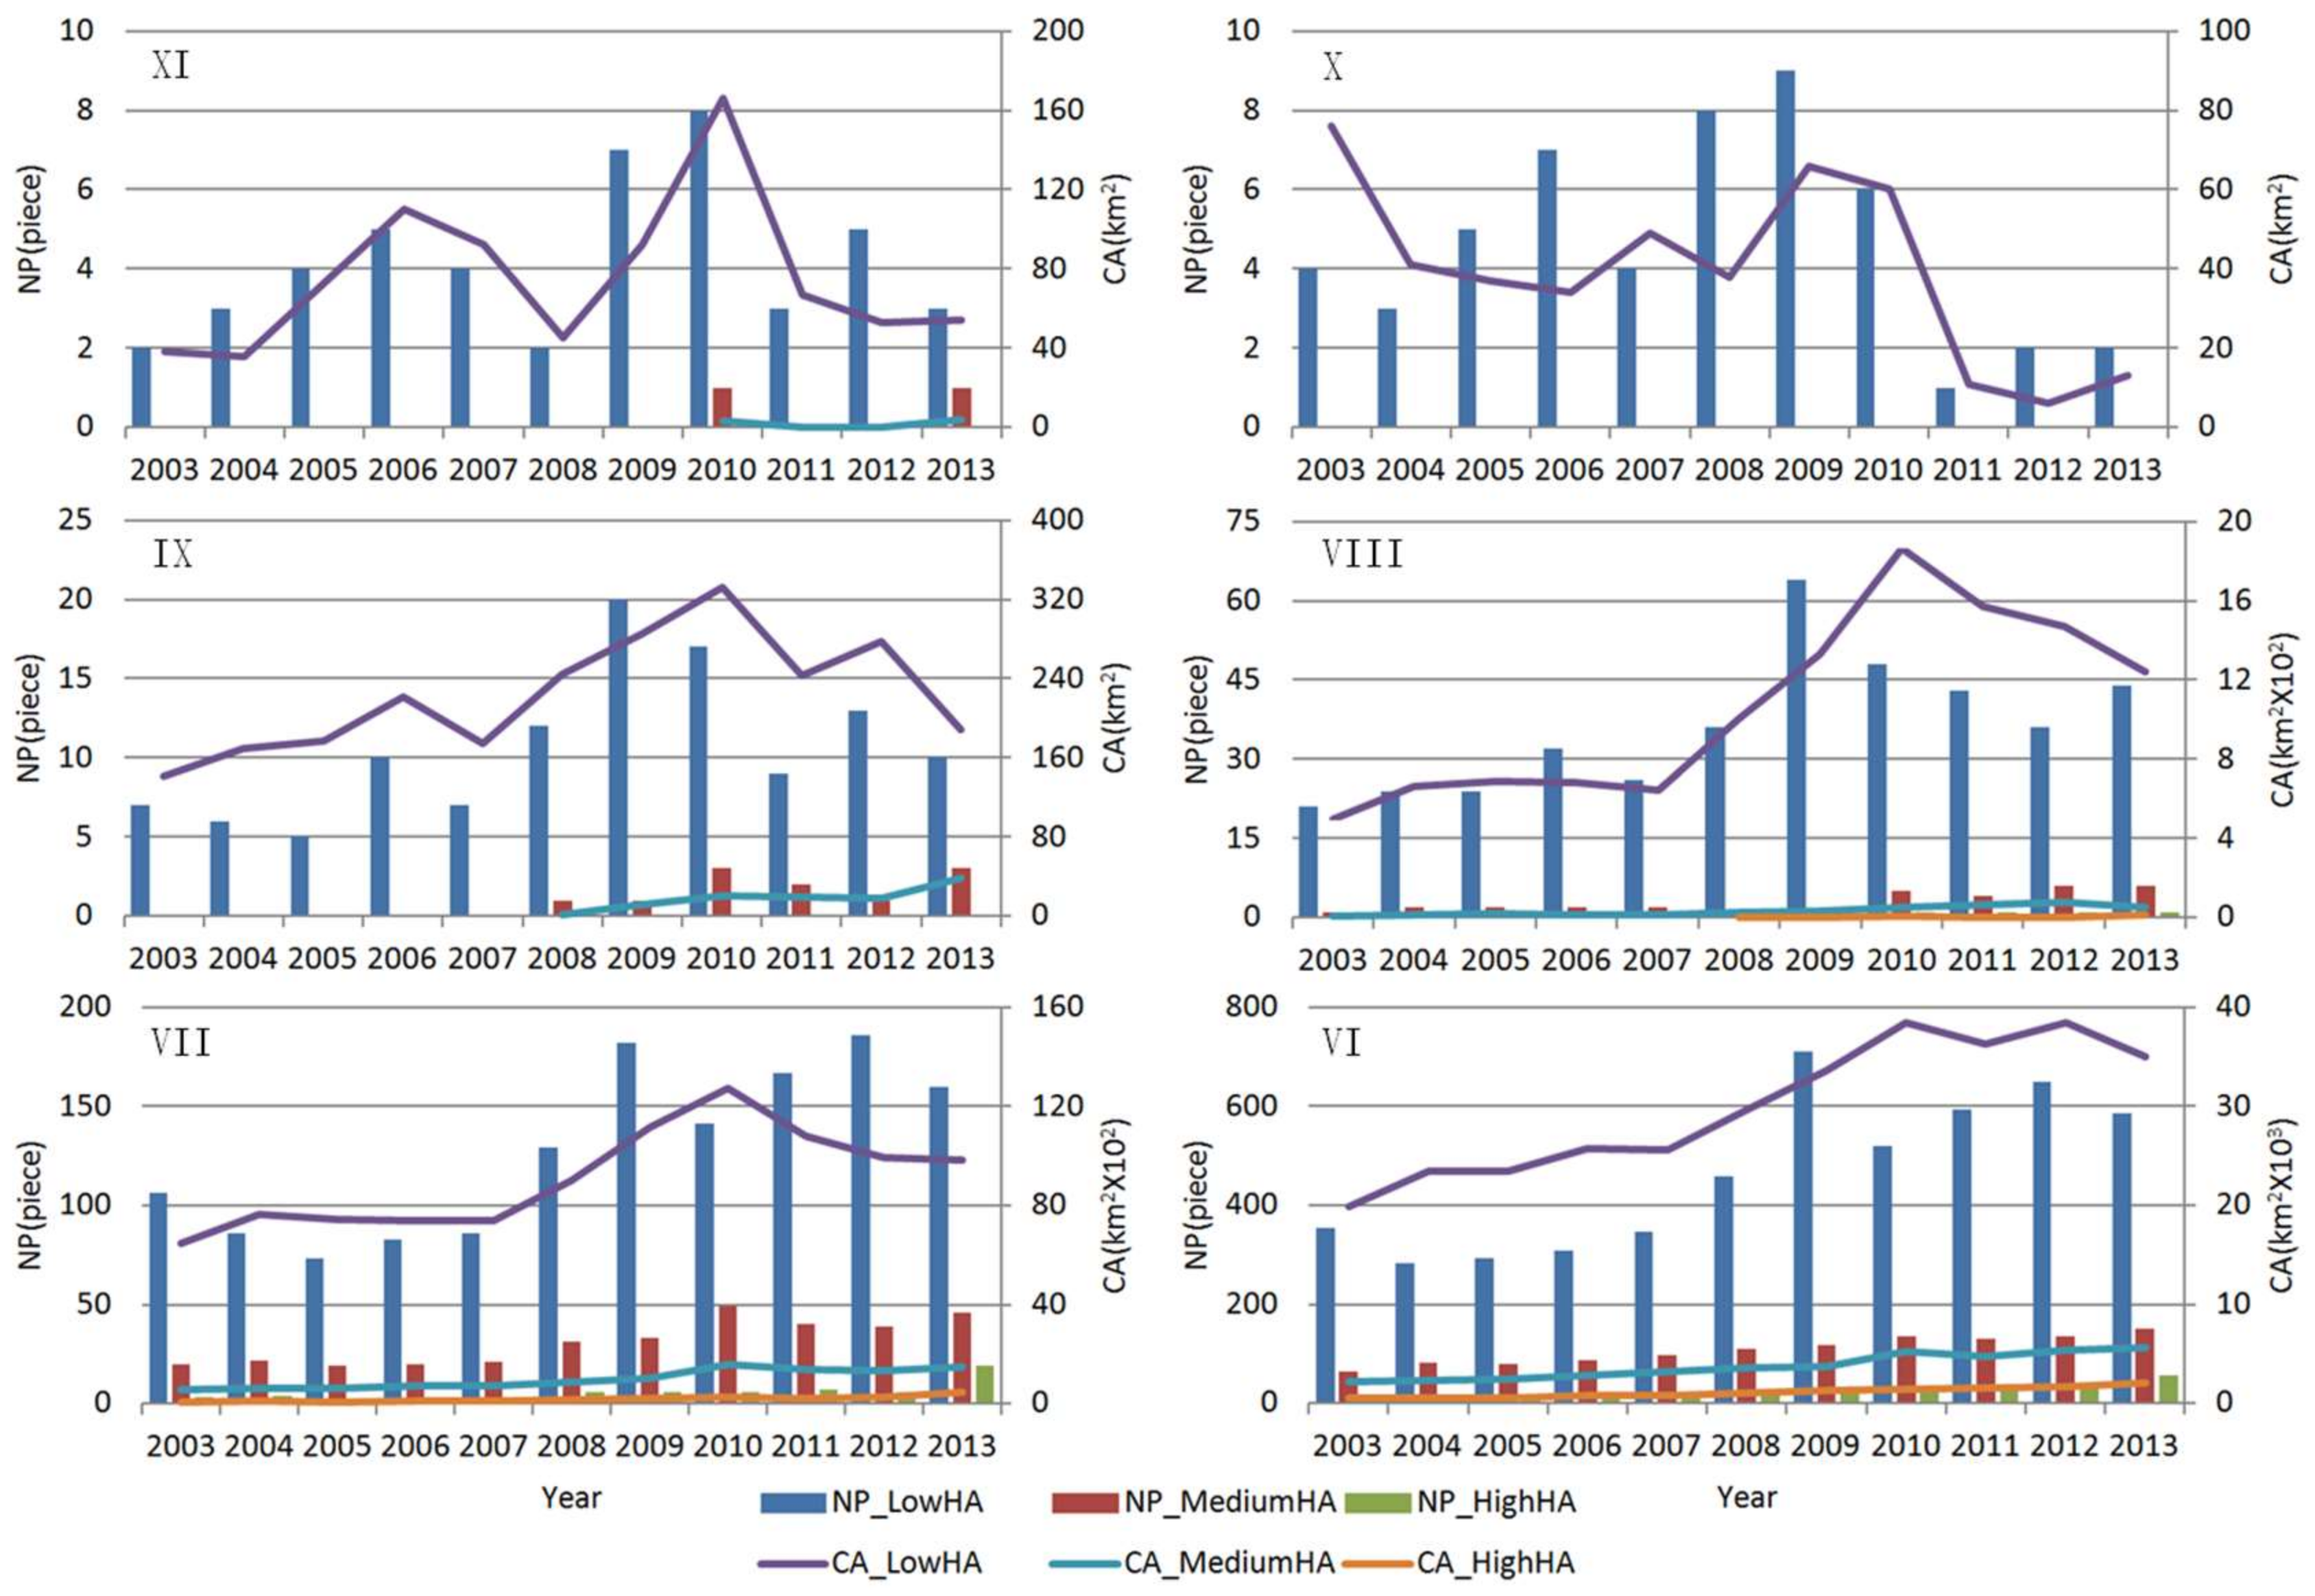
To measure changes in patterns of HA, we created a statistic of the total number of patches (NP) and the total class area (CA) of a particular HA level (
Figure 10). Obviously, after the Wenchuan Earthquake, the patterns of low HA in different seismic intensity regions changed. In the XI region, there was a pattern of increase, first, and then a decrease before 2008; following this there was a remarkable increase after 2008 and a decrease after 2010. However, in the X region, the pattern of low HA was relatively stable before 2008; after a slight increase from 2008 to 2010, there was a drop to a lower, pre-earthquake level. The pattern change of low HA in other seismic intensity regions were similar; that is, stable before the earthquake and showing a different magnitude of increase between 2008 and 2010, followed by a steady or slight decline. It is noted that, in some years, the increased ratio of NP was larger than that of CA. This indicates that the low HA in these regions were more dispersed in these years.
Medium HA was continuous in VIII, VII, and VI regions from 2003 to 2013. It tended to show a slow increase. Moreover, the increased rates between 2009 and 2010 were slightly larger than in other years. In the IX region, the stable medium HA appeared after 2008, while there was no stable medium HA appeared before and after the earthquake in XI and X regions. The spatiotemporal distribution of high HA is similar to medium HA, but the variation of high HA is smaller.
In conclusion, the reconstruction and recovery of the Wenchuan earthquake affected the spatiotemporal distribution of low HA in each seismic intensity region. Low HA in most regions after reconstruction are more active than before 2008, except that in the X region. This may be caused by the lack of stable settlements in the X region. Medium HA seems to be less affected by the earthquake and recovery, while the changes in high HA do not seem to be affected by the restoration of the Wenchuan earthquake.
4.3. Future Research
The intercalibration method for DMSP/OLS images is the basis of this study. The automatic intercalibration method proposed in this paper can be used not only for the assessment of the impact of natural disasters, but also for the spatial and temporal dynamics of settlement, demographics, and socioeconomic parameters. Although the automatic intercalibration method successfully calibrates the DMSP/OLS time series NTL images of the Wenchuan earthquake, it still has two main limitations. First, the method is only applied locally. It will face more challenges when applied in global scale. Second, the assumption that there are stable pixels on the time series NTL images can be at risk when the time interval of time series get larger. In addition, although the annual NTL data were used to study the long-term impacts of the Wenchuan earthquake, monthly and daily NTL data are considered to be able to show more details of reconstruction and recovery. Finally, the DN value of NTL images is only an approximation of HA. Anomalies in the NTL, such as ice reflection, cloud reflection, and natural flame, can affect the results of HA analysis. The lack of effective methods for extracting HA from NTL images limits further research. All above problems need to be studied and solved in the future.
5. Conclusions
The long-term impact of earthquakes’ destruction and restoration is a pivotal issue. In this paper, time series DMSP/OLS NTL images were used to evaluate changes in HA in Wenchuan earthquake-stricken areas, from 2003 to 2013. To improve the continuity and comparability of NTL data in the V4DNLTS dataset, this study developed an automatic intercalibration method to systematically correct NTL data. Based on the calibrated NTL images, the changes of intensity and the spatiotemporal pattern of HA in different seismic intensity regions were analyzed.
The results revealed that the sum of NTL in the XI and X regions fluctuated before and after the Wenchuan earthquake. While, in the IX and VIII regions, the sum of NTL remained stable before 2008 and began to rise from 2008 to 2010, then fell after 2010. However, the sum of NTL in the IX and VIII regions after 2010 was still higher than before 2008. The sum of NTL in the VII and VI regions maintained a steady growth, and did not show an obvious impact from the earthquake. Comparing the sum of NTL in the XI and X regions, we found that, before 2008, the sum of NTL in the XI region was always less than that in the X region, but after 2008, the ratio of the sum of NTL in these two regions increased rapidly and stabilized at 1.6 after 2010. This finding illustrated that the post-earthquake reconstruction efforts in the XI region should have been far greater than in the X region.
A classification of HA was used to analyze the pattern changes in different seismic intensity regions. The study found that the low HA in the vicinity of the Wenchuan earthquake epicenter was closely related to the construction of roads, such as the Du-Wen Highway and the 213 State Road, which also explained the fluctuation in the sum of NTL in the XI and X regions. We also found the correlation between post-earthquake reconstruction and changes in HA, with low HA in different seismic intensity regions significantly increased from 2008 to 2010. Medium HA in the VIII, VII, and VI regions slightly increased since 2008, and the high HA maintained steady growth and, thus, were not notably impacted by the reconstruction and recovery projects of the Wenchuan earthquake.


