Article

Satellite-Based Evaluation of the Post-Fire Recovery Process from the Worst Forest Fire Case in South Korea

1
Department of Applied Plant Science, Chonnam National University, 77 Yongbong-ro, Gwangju 61186, Korea
2
Department of Spatial Information Engineering, Pukyong National University, 45 Yongsoro, Namgu, Busan 48513, Korea
3
Department of Environment, Energy, and Geoinfomatics, Sejong University, 209 Neungdong-ro, Gwangjin-gu, Seoul 05006, Korea
4
Department of Geoinformatic Engineering, Inha University, 100 Inha-ro, Nam-gu, Incheon 22212, Korea
*
Author to whom correspondence should be addressed.
Remote Sens. 2018, 10(6), 918; https://doi.org/10.3390/rs10060918
Submission received: 22 April 2018 / Revised: 5 June 2018 / Accepted: 7 June 2018 / Published: 10 June 2018
(This article belongs to the Special Issue Advances in Remote Sensing-based Disaster Monitoring and Assessment)

Abstract

:
The worst forest fire in South Korea occurred in April 2000 on the eastern coast. Forest recovery works were conducted until 2005, and the forest has been monitored since the fire. Remote sensing techniques have been used to detect the burned areas and to evaluate the recovery-time point of the post-fire processes during the past 18 years. We used three indices, Normalized Burn Ratio (NBR), Normalized Difference Vegetation Index (NDVI), and Gross Primary Production (GPP), to temporally monitor a burned area in terms of its moisture condition, vegetation biomass, and photosynthetic activity, respectively. The change of those three indices by forest recovery processes was relatively analyzed using an unburned reference area. The selected unburned area had similar characteristics to the burned area prior to the forest fire. The temporal patterns of NBR and NDVI, not only showed the forest recovery process as a result of forest management, but also statistically distinguished the recovery periods at the regions of low, moderate, and high fire severity. The NBR2.1 for all areas, calculated using 2.1 μm wavelengths, reached the unburned state in 2008. The NDVI for areas with low and moderate fire severity levels became significantly equal to the unburned state in 2009 (p > 0.05), but areas with high severity levels did not reach the unburned state until 2017. This indicated that the surface and vegetation moisture conditions recovered to the unburned state about 8 years after the fire event, while vegetation biomass and health required a longer time to recover, particularly for high severity regions. In the case of GPP, it rapidly recovered after about 3 years. Then, the steady increase in GPP surpassed the GPP of the reference area in 2015 because of the rapid growth and high photosynthetic activity of young forests. Therefore, the concluding scientific message is that, because the recovery-time point for each component of the forest ecosystem is different, using only one satellite-based indicator will not be suitable to understand the post-fire recovery process. NBR, NDVI, and GPP can be combined. Further studies will require more approaches using various terms of indices.

Graphical Abstract

1. Introduction

A forest fire is one of the major disturbances in the ecological diversity, forest succession, the carbon cycle, and hydrological processes of a forest’s ecosystem [1,2,3,4]. Habitats are altered [5], carbon is released to the atmosphere [6], and runoff and erosion are increased due to the loss of forest from severe forest fires [7,8]. After a forest fire, the evaluation of the damage severity, implications, and spatial patterns is important for forest recovery planning, which plays a critical role in the sustainability of the forest ecosystem and carbon cycle [1,9,10,11]. It is also necessary to analyze the growth patterns and responses to forest fire disturbance using time series data [12,13]. Thus, the process of forest recovery and the ecological and physiological functions of the burned forest area should be continuously monitored.
The attributes of forest fires, such as fire severity and total area burned, have been conventionally investigated by field observation. The severity of damage to vegetation and soil is generally classified into three levels of low, moderate, and high severity [1,14,15]. However, the field survey has limitations due to frequency of forest fire, assessment difficulty, and the large size of burned areas. For continuous monitoring, field investigators must visit the site multiple times.
Remote sensing techniques, such as satellite imaging, can be useful to regularly observe the burned area and damage severity in real time [16]. The burned area can be measured by the combination of the reflectance values of the visible and infrared channels. Many satellite sensors, such as those of Landsat, Aqua, Terra, Envisat, and SNPP, are capable of identifying forest fires and measuring damage severity in burned areas [17,18,19,20]. For example, forest fires can be detected by the brightness temperature of infrared (IR) radiation [21]. In particular, the mid-infrared (MIR) and thermal-infrared (TIR) band are effective to detect forest fire [22]. The burned area and damage severity can be measured using reflectance of near infrared (NIR) and short-wave infrared (SWIR) radiation [23] because the reflectance from living plants and burnt wood are noticeably different. Furthermore, the burned area was extracted from both NIR and the detected forest fire data [19].
The Normalized Burn Ratio (NBR), which uses both NIR and SWIR bands, is widely used to detect burned areas [24]. The Normalized Difference Vegetation Index (NDVI), which uses both red and NIR bands, can identify unhealthy vegetation in burned areas, and has been used to monitor post-fire recovery of forests [25,26,27]. Thus, these vegetation and burn indices are suitable not only to detect forest fire regions and measure damage severity, but also to evaluate the forest’s recovery progress. Van Leeuwen [28] showed that forest fire recovery could be evaluated using moderate-resolution satellite imagery to measure the difference in the NDVI between the burned area and the unburned area every year. Caccamo [29] used the NDVI, Enhanced Vegetation Index (EVI), and Normalized Difference Infrared Index (NDII) to analyze post-fire vegetation recovery. Storey [16] evaluated the sensitivity of vegetation and burn indices to the post-fire recovery of shrubland using seven indices including NBR and NDVI, which were used to evaluate forest recovery.
Previous studies that investigated forest fires using remote sensing indices focused on ecological changes, but the physiological states of plants are also important for understanding the newly established forest ecosystem. Generally, the physiological state of a forest can be obtained by examining the carbon dynamics linked to photosynthesis [11]. For example, gross primary production (GPP) can be useful to interpret the physiological state in a forest post-fire because it is strongly related to photosynthetic activities [30,31].
In this study, we use satellite-based remote sensing data to evaluate forest recovery processes and physiological activity. The worst forest fire in South Korea from 7–15 April 2000 was selected as a case study, and satellite-based vegetation and burn indices and GPP data were used to diagnose both the damage severity and the ecological and physiological recovery levels, depending on the severity level of the forest fire. Further analysis was conducted to minimize the annual variation of meteorological effects. The restoration process was evaluated by comparing the affected areas with an unburned reference area.

2. Materials and Methods

2.1. Satellite Data

Satellite-based NBR and NDVI were used to detect the area affected by forest fire and evaluate post-fire recovery [32]. The NBR was calculated using the reflectance of the NIR and SWIR wavelengths (ρ) as shown in Equation (1):
NBR = ρ NIR ρ SWIR ρ NIR + ρ SWIR
The NIR band is an effective spectral band for vegetation monitoring, and the SWIR spectral band effectively represents moisture in soil and vegetation. Sudden changes can occur in the NBR of burned areas because of alterations to the canopy structure and moisture content by forest fires [33], while NBR change is close to zero for unburned areas [32]. Thus, areas affected by the forest fire were identified using the difference between pre-fire and post-fire NBR:
dNBR = NBR pre fire NBR post fire
The NBR was computed using Terra/MODIS (Moderate Resolution Imaging Spectroradiometer) surface reflectance data (MOD09 collection 6). The spatial and temporal resolution for MODIS NBR indices was 500 m and 1 day, respectively. MODIS Band 2 (NIR, 0.86 μm) and Band 7 (SWIR, 2.1 μm) were used to calculate the NBR (NBR2.1), and Band 6 (SWIR, 1.6 μm) and Band 2 were also used to calculate another NBR that was defined as NBR1.6. In other research fields, NBR1.6 is called the Normalized Difference Water Index (NDWI) or NDII [29,34]. NBR2.1 is similar to the NBR originally used by Garcia and Caselles [35]. Although 1.6 μm is not commonly used to estimate NBR, this study compared NBR1.6 with NBR2.1 for monitoring the post-fire forest.
Vegetation health can be represented by the NDVI, a widely used vegetation index [36,37]. The NDVI was computed using NIR and red wavelengths as follows:
NDVI = ρ NIR ρ Red ρ NIR + ρ Red
Reflectance of red wavelengths is low when vegetation is healthy and has vital chlorophyll elements [38]. Contrarily, reflectance of NIR wavelengths is higher under such vegetative conditions. The NDVI was calculated from the MOD13A3 data collected by Terra/MODIS from 2000 to 2017. The Terra/MODIS NDVI data’s spatial (temporal) resolution was 1 km (1 month). However, there was no Terra/MODIS data available for 1999 to represent the vegetative conditions before the forest fire damage in 2000. Thus, SPOT/Vegetation data from 1999 was used to estimate the NDVI. SPOT/Vegetation NDVI is known be in good agreement with Terra/MODIS NDVI [39]. Weekly SPOT/Vegetation NDVI data was collected in July–August of 1999, with a spatial resolution of 1 km.
To understand the photosynthetic activity of the post-fire forest, the data obtained from Terra/MODIS GPP (MOD17A2H collection 6) was used. Spatial and temporal resolutions were 500 m and 8 days, respectively. MODIS GPP is useful for explaining seasonal vegetation patterns, but it exhibits a slight overestimation when compared with the GPP of flux sites in South Korea [40]. Jung et al. [41] showed that the correlation coefficient of MODIS GPP of three flux sites with forests and croplands was 0.55–0.60.
RGB composite images was calculated using Landsat-5 TM (Thematic Mapper) and Landsat-8/OLI (Operational Land Imager) surface reflectance data. Landsat-5 Band 1 (Blue, 0.49 μm), Band 2 (Green, 0.56 μm), Band 3 (Red, 0.66 μm), and Landsat-8/OLI Band 2 (Blue, 0.48 μm), Band 3 (Green, 0.56 μm), Band 4 (Red, 0.65 μm) were used to compute RGB composite images. The spatial and temporal resolution of the index was 30 m and 8 days.
Forest pixels were extracted from the MODIS Land Cover product. Forest, crop, city, and other land types were divided according to the IGBP (International Geosphere-Biosphere Program) land cover classification scheme (Figure 1c).
To match the Terra/MODIS data at a 500 m resolution with the Spot/Vegetation data and MOD13A3, the Terra/MODIS NBR2.1, NBR1.6, and GPP data were unified to 1 km spatial resolution, and a geometric projection was used. The July and August data were averaged for each year because that is the most active vegetation growth period in South Korea (Table 1).

2.2. Forest Fires in South Korea and the Study Area

Based on data from 2010, approximately 63% of the land area in South Korea was forest [42]. 59% of forest fires occurred in spring (March–May), and the area damaged by forest fires during spring accounted for approximately 83% of the total area burned that year. Gangwon Province in South Korea often has a dry spring because the air crossing a mountain often changes into dry conditions according to the Föhn phenomenon. Thus, many forest fires have occurred in this area. On 7–15 April 2000, the worst forest fire in South Korean history occurred in this area (the East Coast fire). The forest fire occurred in seven different places and the damaged area covered approximately 23,448 ha. Strong wind speeds (maximum 26.8 m/s) and low relative humidity (minimum 7%) accelerated the spread of the forest fire during this period [15]. After the East Coast fire, the Korea Forest Service (KFS) conducted forest management activities, such as tree planting and artificial regeneration, to aid forest recovery until 2005 [43].
To monitor the post-fire state of the forest, the three severely burned areas (12,697 ha; 4054 ha; and 2244 ha) were investigated. The biggest forest fire happened near the coastline, and the smallest forest fire was in the upper area of our study (Figure 2). The burned areas consisted mainly of forests, but croplands and cities on the coastline were also included. The study area was set from 36.99°N to 37.6°N, and 128.75°E to 129.50°E (Figure 1a,b). Meteorological information in this study is as follows. The average annual air temperature is 12.6 °C, and annual cumulative precipitation is 1278.9 mm, based on 2016 data collected by a meteorological station located in Donghae city. The maximum air temperature is 37.1 °C and the minimum air temperature is −14.0 °C, since May 1992. It rains heavily from July to September.
Before the forest fire, the forest was dominated by pine (Pinus densiflora) [43,44], which covered approximately 69.5% of the study area. Pine-hardwood and hardwood covered approximately 27.6% and 3% of the study area, respectively [1]. Further, before the forest fire, 20–30 and 30–40 year old trees were spread across 54.44% and 22.62% of the study area, respectively [1].

2.3. Extraction of the Burned Area

The area of forest burned by the East Coast fire was extracted using satellite-based NBR and NDVI. The process of extracting the burned area was as follows. First, Terra/MODIS data from 1999 for the pre-fire forest were unavailable. Through careful study of our preliminary vegetation index analysis output, we assumed that, according to previous studies [16], the moisture condition in the burned area would have mostly recovered after 10 years from the forest fire event and that the vegetative conditions would significantly differ from those immediately after the East Coast fire of 2000. Additionally, we considered the meteorological conditions affecting that area. Mean air temperature was 15.5 (16.3) °C and cumulative precipitation was 63.8 (38.9) mm in May 2000 (2012). Both air temperature and precipitation in 2012 were similar to those in 2000. Thus, the NBR2.1 of 2012 was selected as the pre-fire condition for the estimation of dNBR, and MODIS dNBR2.1 was calculated in the coastline over Donghae-si, Samcheok-si, and Uljin-gun. The burned area was extracted for a dNBR value greater than 0.10 and excluded for a dNDVI value less than 0.0. The extracted burned area was confirmed using previous studies, and it was consistent with reports in related literature [1,15,45]. Supplementary material shows the availability of this MODIS-derived burned area through comparison with some burned area from Landsat dNBR of more higher-resolution (Figure S1). Second, the burned area identified using MODIS dNBR2.1 was classified into three severity levels based on MODIS dNBR2.1 values: low, moderate, and high. The ranges of dNBR values for fire severity were flexible and changed according to surface conditions, season, and the interval between data used for calculating the dNBR [33,46,47,48]. We defined the MODIS dNBR ranges of 0.10–0.15, 0.15–0.20, and 0.20+ as low, moderate, and high levels of severity, respectively. In this study, high level means most of the trees killed in a pixel. Partially or seriously damaged areas in a pixel are defined as moderate level and low level, which might include burned and unburned areas in a pixel. The burned area from Terra/MODIS was expressed by serious damage to the coastline larger rather than in inland, similar to previous studies [45]. Finally, the land types in the burned areas were classified as forest and non-forest using IGBP MODIS land cover data. The non-forest areas were excluded in order to solely monitor changes in forest recovery.

2.4. Definition of the Reference Area

To critically evaluate the forest recovery process, the annually varying meteorological effects on the temporal changes in vegetation and burned indices and GPP were minimized. Meteorological events, such as drought or heavy rainfall, can influence vegetation indices related to forest recovery. Thus, a reference area was necessary to evaluate the recovery of vegetation. The reference area needed to be unburned by the East Coast fire, and the vegetative conditions needed to be similar to the burned area before the fire. In 1999, SPOT/Vegetation NDVI near the burned area was examined. The reference area was selected because the unburned pixels had similar NDVI values to the pixels in the burned area in 1999. The same number of pixels were used for the defined reference area and for the burned area for statistical analysis. An independent two-sample t-test for the burned area and reference area was conducted with IBM SPSS Statistic 23. The P-value was 0.536 at a confidence level of 0.05, indicating that a significant difference did not exist between the two areas. The dominant species in the reference area was similar to that in the burned area. Pinus densiflora was dominant in the selected reference area (http://www.forest.go.kr/images/data/down/gispdf_030201_03_5.pdf). The forest age in the reference area was 20~30 years before forest fire. This implied that the two areas had similar surface characteristics in 1999, which was one year before the East Coast fire.

3. Results

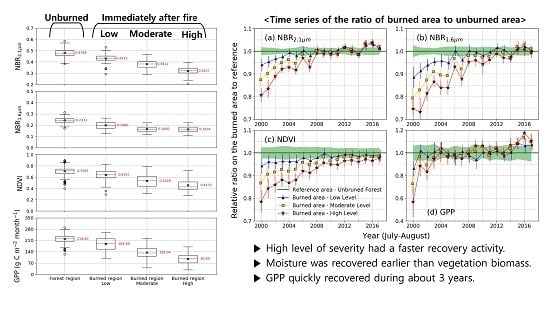
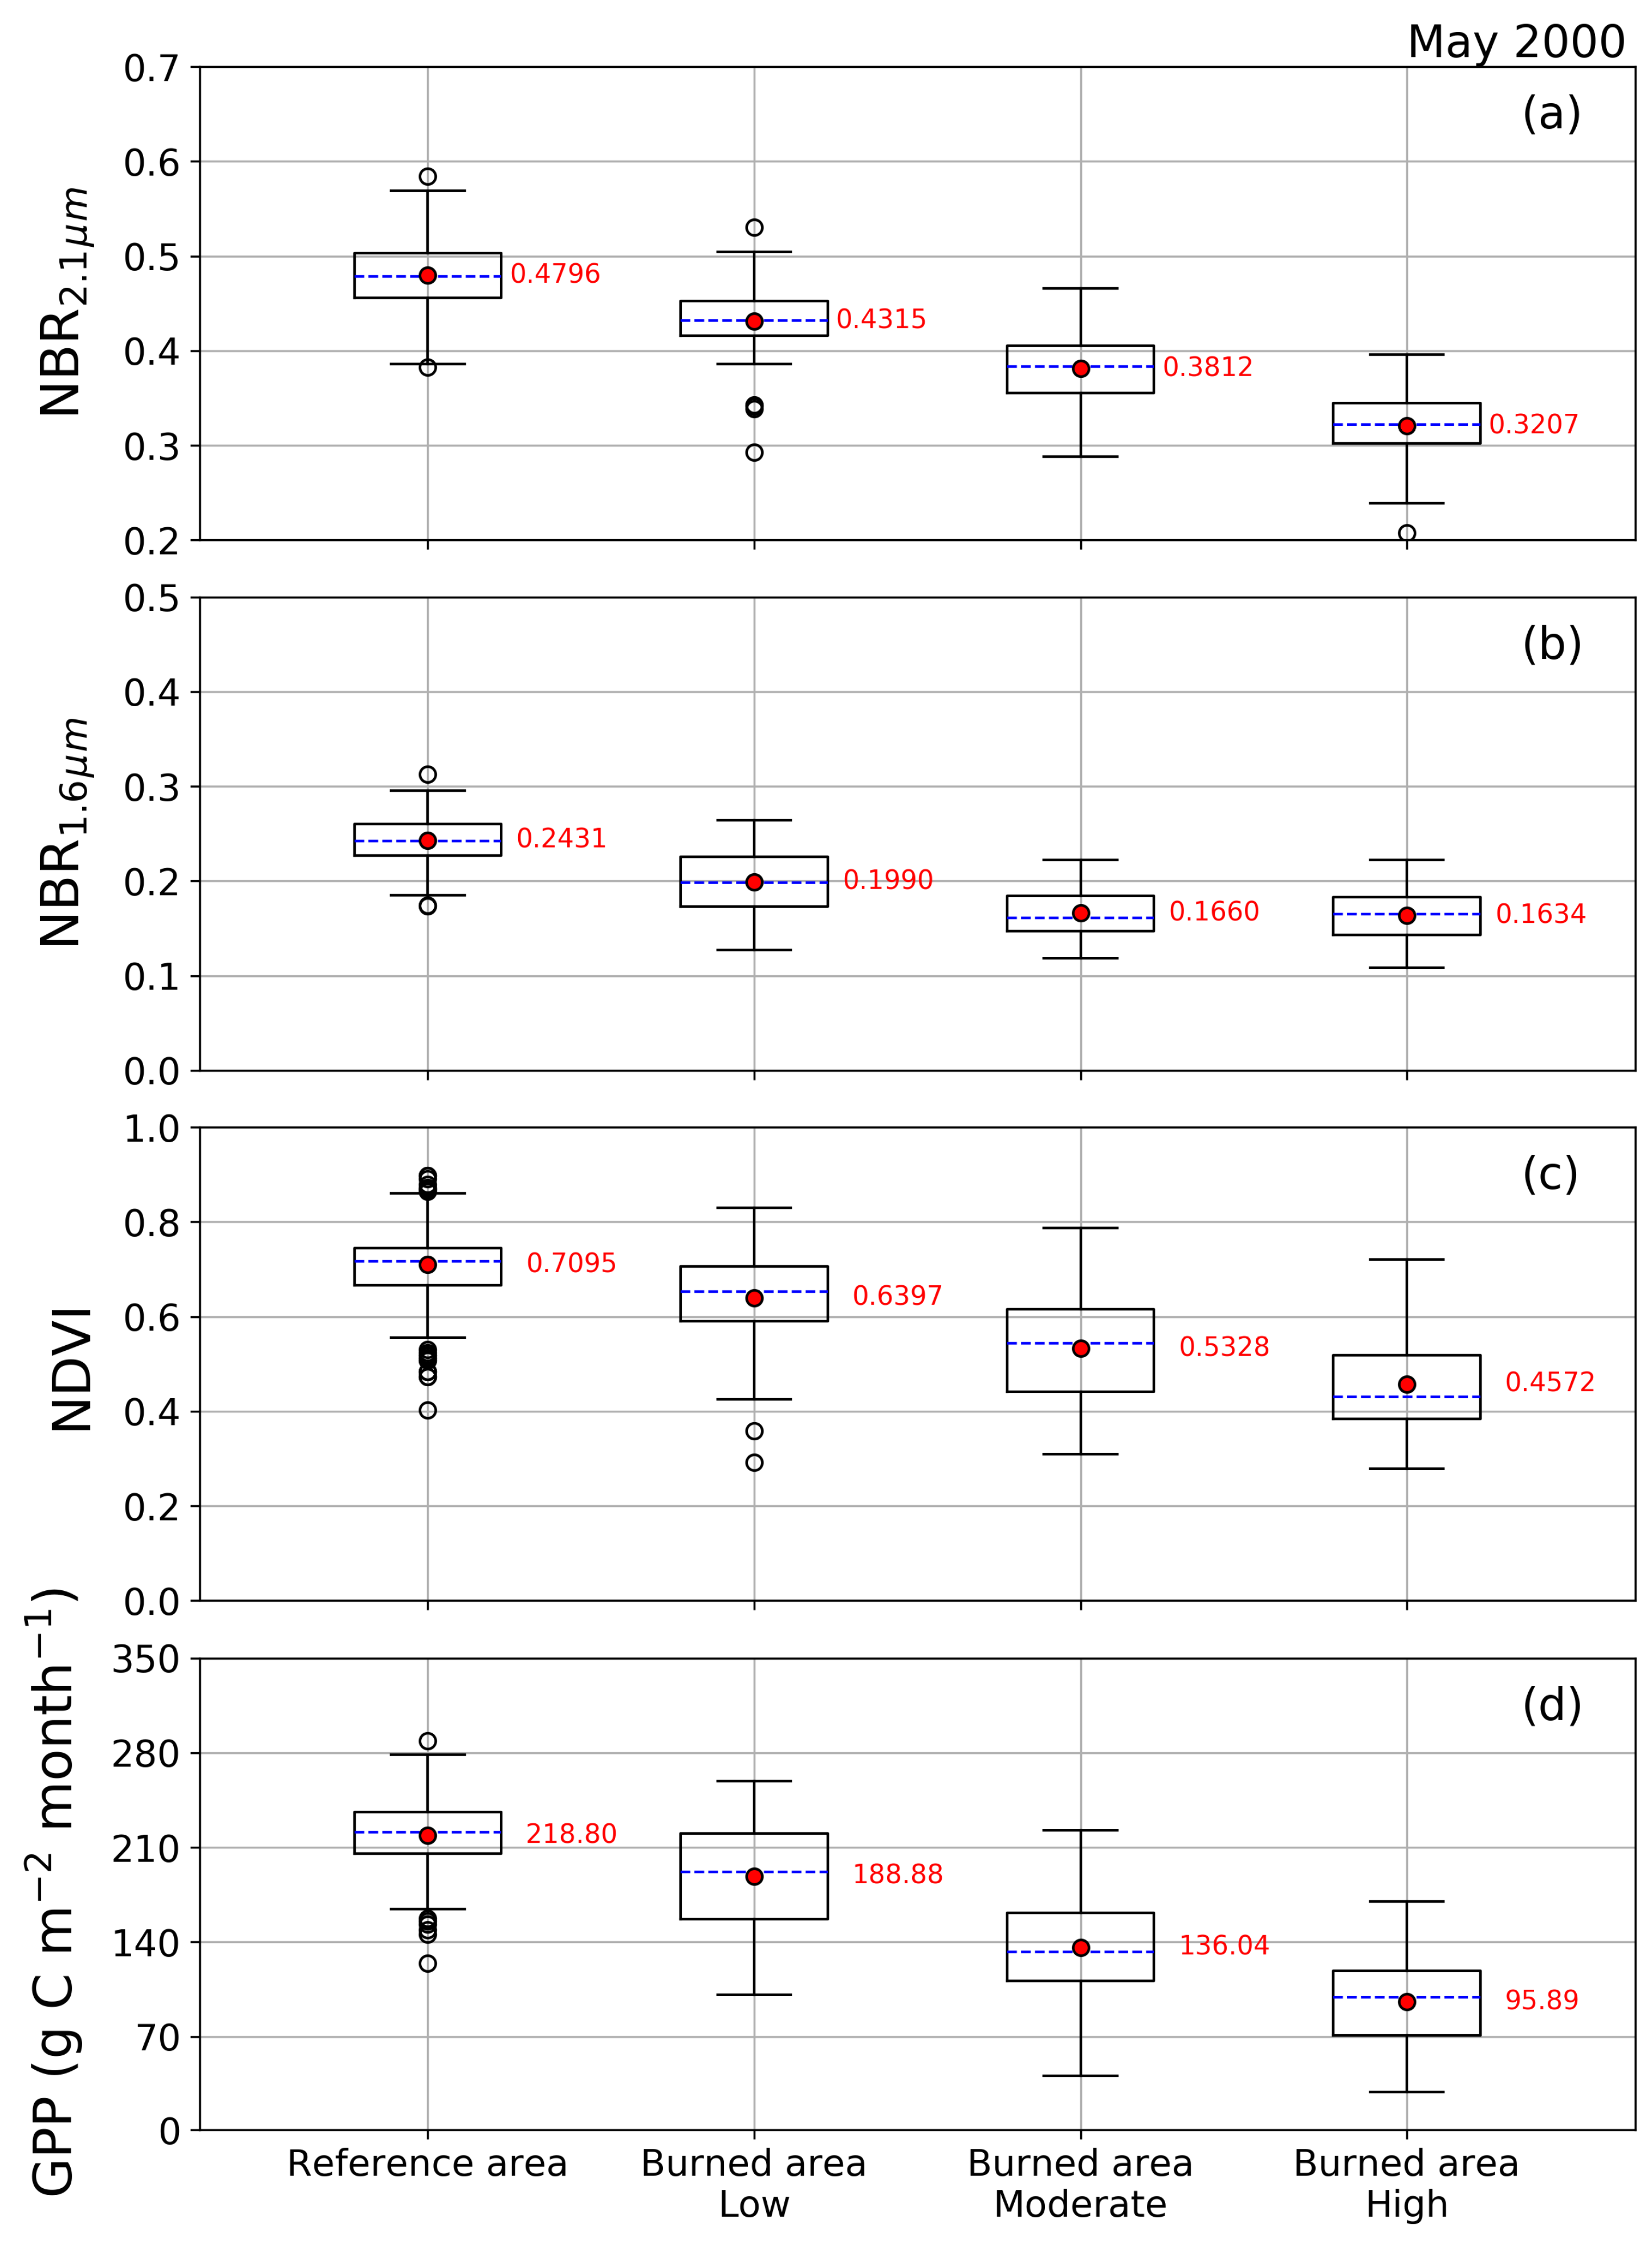
3.1. Damage Severity of the Forest Fire

NBR2.1, NBR1.6, NDVI, and GPP were analyzed to evaluate the damage severity of the East Coast fire. Figure 3 shows the results acquired in May 2000, immediately after the forest fire. The mean of NBR2.1 values was 0.480 in the reference area, and NBR2.1 values in areas with low, moderate, and high levels of fire severity gradually decreased and were 0.432, 0.381, and 0.321, respectively (Figure 3a). The values in the areas with low, moderate, and high fire severity decreased by 10.03%, 20.52%, and 33.13%, respectively, in comparison with the reference area values. The mean of NBR1.6 values was 0.243 in the reference area, which was lower than that of NBR2.1 (Figure 3b). NBR1.6 values of the burned area decreased when fire severity increased (low: 0.199; moderate: 0.166; high: 0.163); the same trend was observed for NBR2.1. NBR1.6 values were lower than those of NBR2.1, but the percentage decreases in the low, moderate, and high burned area compared to the reference area were 18.14%, 31.72%, and 32.78%, respectively. These results showed that NBR1.6 was better at detecting differences between the burned and reference areas than NBR2.1, particularly for low and moderate severity levels. However, the difference between low and high damage levels was more distinguished with NBR2.1 than with NBR1.6.
NDVI values were noticeably different depending on the damage severity of the forest fire (Figure 3c). The decreasing pattern of the NDVI with increase in damage severity was similar to that of the NBR. The mean NDVI values in the reference area was 0.710. The percentage decrease of NDVI values in the burned areas was 9.84%, 24.90%, and 35.56% in low, moderate, and high severity areas, respectively. Change in GPP due to the forest fire showed a steeper decline than the NBR2.1, NBR1.6, and NDVI (Figure 3d). The percentage decrease of GPP in areas with low severity levels (13.67%) was not noticeably different compared with other variables, but the percentage decrease in areas with high severity levels (56.17%) was the largest.

3.2. Temporal Analysis of Forest Recovery

The temporal changes in the study areas were displayed using RGB composite images from Landsat-5/TM and Landsat-8/OLI, which were created from visible red (Band 3 or Band 4), green (Band 2 or Band 3), and blue (Band 1 or Band 2) data (Figure 4). August is the month when the most active plant growth occurs in South Korea. In the 1999 image of the pre-fire forest, the RGB composite image had pixels with a similar green color in the forest areas (Figure 4a). However, brown colored pixels increased immediately after the forest fire (Figure 4b). In images from 2004, four years after the East Coast fire, there were still a large number of brown colored pixels (Figure 4c). Over time, as seen in the 2007 and 2010 images, the brown colored pixels gradually decreased, while the green colored pixels in the burned areas increased. The RGB composite image in 2016 showed that most of the burned area pixels changed from brown to green (Figure 4f).
The values of NBR2.1, NBR1.6, NDVI, and GPP immediately dropped after the forest fire. The extent of the change depended on the severity of the forest fire. However, the initial differences compared with the reference values decreased over time (Figure 5). NBR2.1 and NBR1.6 showed a similar time series patterns, but the NBR2.1 and NBR1.6 values in the areas of all damage severity reached the averaged reference value in different years (Figure 5a,b). The recovery-time points were statistically evaluated using an independent two-sample t-test (Table 2). In low (high) fire severity areas, NBR2.1 was significantly different (p < 0.05) compared with the reference area until 2003 (2007), but NBR1.6 was significantly different until 2005 (2014). Otherwise, there was significant difference (SD) between NBR2.1 and the reference area, and between NBR1.6 and the reference area, in areas with low and moderate fire severity after 2014. This was because the values of NBR2.1 and NBR1.6 in burned areas surpassed those in the reference area.
The NDVI was nearly constant in the reference area (Figure 5c). NDVI trends increased continually for 18 years in the burned area, and the rate of increase was greater in areas with high fire severity levels. SD in the NDVI between areas with low and moderate fire severity and the reference area was shown until 2009. There was also no SD between these values in 2012, 2013, 2015, 2016 (moderate), and 2017 (low). However, in areas with high fire severity levels, SD was shown until 2017.
In the first July–August period after the forest fire, the GPP differences of the areas with low, moderate, and high severity levels existed as NBR2.1, NBR1.6, and NDVI (Figure 5d). However, the SD between these values ceased earlier than for other indices. In areas with low and moderate fire severity, there was no SD (0.848, 0.134; p < 0.05) between GPP in those areas and in the reference area in 2001, which was one year after the forest fire. GPP in areas with high fire severity reached GPP levels in the reference area (0.614; p < 0.05) in 2004. Recent GPP in the burned areas was higher than GPP in the reference area, and a significant difference appeared earlier in areas with high forest fire severity.

3.3. Relative Change in Recovery of the Forest

To distinguish the effects of the meteorological conditions from the temporal changes in forest recovery, the ratios of variables (NBR2.1, NBR1.6, NDVI, and GPP) in July–August in the burned areas were compared with the reference area and investigated. These ratios can accurately express the process of forest recovery (Figure 6). Average values of indices in the unburned forest area were ideal criteria for indicating complete forest recovery. The ratios of NBR2.1 in burned areas showed an increase after the forest fire (Figure 6a). Immediately after the forest fire, ratios of NBR2.1 were 0.940, 0.875, and 0.806 in areas with low, moderate, and high fire severity, respectively. They reached the criteria level (1.0) in 2004, 2006, and 2008 in areas with low, moderate, and high fire severity, respectively (Table 3). These results were consistent with the independent two-sample t-test results. After 2008, the ratios of NBR2.1 in all areas exceeded the confidence interval of the criteria level. Ratios of NBR1.6 showed similar patterns to those of NBR2.1. For example, ratios of NBR2.1 and NBR1.6 rapidly increased during the first three years after the forest fire, although the initial values and overall temporal changes were different (Figure 6b).
NDVI ratios were 0.942, 0.867, and 0.785 in areas with low, moderate, and high fire severity in July–August 2000, respectively. The ratios increased, particularly during the first three years after the forest fire. These patterns were consistent with the ratios of NBR2.1 and NBR1.6. The NDVI ratios reached the confidence interval values of the criteria level in 2006 and 2009 for areas with low and moderate fire severity, respectively. After 2009, ratios of NDVI in areas with low and moderate severity levels remained between 0.97 and 1.0. However, in areas with high fire severity, the ratio of NDVI barely met the recovery level in 2017.
Ratios of GPP showed different patterns compared to the NBR and NDVI ratios. The GPP in burned areas reached the confidence interval values of the recovery level in 2001, 2001, and 2003 for areas with all levels of fire severity. Across the whole study period (2001 to 2017), the slope of the GPP ratio in areas with low fire severity was 0.004. However, the slopes of the GPP ratios in areas with moderate and high fire severity were 0.009 and 0.014, respectively. The GPP in these areas exceeded the criteria level (1.0) after 2015, and it, in areas with high severity levels, largely exceeded the GPP in the reference area.

4. Discussion

Forest biomass recovery began immediately after the forest fire in 2000, and gradually continued through to 2017. Although the July–August period is the most active forest growing season in South Korea, the vegetative activity in July–August 2000 is remarkable because it was so close to the time the forest fire occurred (May 2000). Indeed, in July–August 2000, vegetation increased in all damaged areas. In addition, the rate of recovery of areas with high fire severity was greater than that of areas with low fire severity. According to KFS reports and ground-survey data in the existing literature about the East Coast fire, the natural appearance of vegetation was observed in damaged areas in the first year after the forest fire [1,49]. About 80% of the recovery was caused by the re-growth of surviving sprouts [49]. Also, Lee and Chow [50] showed that there was a rapid recovery for three years after the forest fire. However, the re-growth of surviving sprouts cannot fully explain the faster re-vegetation in areas with high fire severity. Armesto and Pickett [51] concluded that when larger disturbances such as forest fires occur, abundance in certain foliage is observed during the recovery period because of the enhanced re-growth made possible by less competition. The dominant tree type changed from pine to hardwood, such as oak species, after the forest fire [1]. Indeed, pine-hardwood and hardwood trees regenerated relatively rapidly compared to pine trees. The KFS conducted recovery efforts, such as tree planting, until 2005 [42]. For example, about 2-ha pine stand was planted in June 2003 [52]. The NBR2.1, NBR1.6, NDVI, and GPP data obtained during this study represented the integration of these phenomena. The relative ratio of variables in moderate (high) burned areas increased from about 8.0% (7.3%) to about 11.6% (14.1%) during the first 3–4 months after the fire in 2000. Also, the forest recovery trends for 5 years after the forest fire showed quick changes in four variables (Figure 6). These results mean that the remote sensing based variables effectively indicate the progress of forest recovery.
The NBR can indicate conditions of water and vegetation, and the NDVI can detect the amount of vegetation biomass. GPP is a measure of the rate of photosynthetic activity in vegetation chlorophyll. Therefore, these variables are governed by meteorological conditions. The seasonal variations of vegetation activity and water conditions in a forest are greatly influenced by the annual meteorological variation; this would affect the temporal patterns of forest recovery indicated by NBR, NDVI, and GPP. For example, in the spring drought in 2001, both the NBR2.1 and NBR1.6 in summer (July–August) 2001 were lower because the water deficit from the spring drought continued into the summer (Figure 5). Oppositely, the NDVI and GPP in summer 2001 were higher, possibly because of the higher photosynthetic activity caused by the reduction of clouds during the drought period [53].
To minimize the annual variation of the meteorological effects, a comparison between the burned and reference areas was carried out (Figure 6). All values of the indicators of forest recovery (i.e., NBR2.1, NBR1.6, NDVI, and GPP), which represented the conditions of the burned area, gradually became closer to the values of the reference forest. However, the time that it took for the values of the burned area to match the reference area values was different. This means that the complete recovery-time point can be evaluated differently depending on the monitoring indicators chosen. The NBR2.1 and NBR1.6 values exceeded the levels of the reference area in 2017, but NBR2.1 reached the reference level earlier than NBR1.6. Given that the 2.1 μm wavelength is more sensitive to water at low moisture levels than the 1.6 μm wavelength [54], NBR2.1 might be able to detect the recovery of moisture conditions in a forest earlier.
On the other hand, the NDVI almost reached the reference level in 2017, but it did not exceed the level during our analysis period. Therefore, the complete recovery-time point indicated by the NBR was faster than that of the NDVI. This result is consistent with the results of previous studies [16]. Ahn [44] compared two camera images taken immediately after and six years after the East Coast fire, and a lot of the area had been recovered by vegetation, but canopy height was still low. Although surface moisture conditions are generally preserved under vegetation cover, the complete recovery of vegetation biomass and health conditions will be achieved after the recovery of the moisture conditions in the forest. Polychronaki [55] showed that the complete recovery of vegetation after a severe forest fire required more than 20 years.
Immediately after the East Coast fire, GPP was reduced to an extent dependent on the severity of the fire. This was consistent with the result of a previous study [56]. The GPP in the burned areas reached reference levels in 2004. This was the fastest recovery among NBR2.1, NBR1.6, and NDVI. Further, after 2015, the GPP in burned areas was much higher than the GPP in the reference area, particularly in areas with high fire severity. This result could have been caused by technical and ecological factors. First, the fraction of absorbed photosynthetically active radiation (fAPAR), estimated based on the relationship with NDVI, is an important parameter for calculating MODIS GPP. However, the recovery pattern shown by the NDVI was different than that of the GPP. We did not test the GPP algorithm in this study, but Bolton [11] argued that satellite-based GPP can be influenced by canopy structure. Second, the GPP of young forests after disturbances, such as forest fire, shows dramatic growth, while GPP in older forests slightly declines [57,58].

5. Conclusions

NBRs, NDVI, and GPP in terms of properties of moisture condition, vegetation biomass, and photosynthetic activity were applied to monitor the temporal patterns of forest recovery and identify the recovery-time point after the worst forest fire in South Korean history, according to three levels of fire severity. Further, the change of moisture condition was separately evaluated by two NBR types of 2.1 and 1.6 μm bands, and those NBRs were also used to detect the burned areas. These four remote-sensing variables on the forest recovery progress had similar temporal patterns representing ecological functions. However, their recovery rate was different in the region of each fire severity level. In NBR2.1 (NBR1.6), the burned area became close to the unburned reference area after 4, 6, and 8 (6, 8, and 15) years in low, moderate, and high levels (Table 3). In NDVI, 9 years were required to recover in the low and moderate levels, but the burned area in the higher level needed more time. On the other hand, the GPP in the burned area continuously increased during our whole study period, and excessed the value in the reference area after 15 years. Thus, we concluded that the application using those indices of different properties could be suitable for evaluating the progress of forest recovery from a variety of perspectives. A single remote-sensing indictor should be not necessary for decision-making in forest management.
GPP is the outcome of complex biogeochemical processes of a forest ecosystem. Thus, it is commonly considered as a useful indicator of the ecological condition of a forest. However, the ground-based GPP in the post-fire region is not well appropriately interpreted because spatio-temporal data are not rarely produced. Satellite-based GPP is useful to monitor photosynthetic activity over a large area, but it is relatively difficult to estimate, unlike the simple calculations for NBR and NDVI from the satellite sensors. A process-based biogeochemical model for GPP estimation might be one of the effective ways to understand the cause and effect of the forest recovery processes in a time series. In addition, the satellite derived NBR and NDVI observational data should contribute to the model performance. In this study, we identified the possibility of using NBR2.1, NBR1.6, NDVI, and GPP to evaluate the recovery of burned areas. In future work, an integrated approach of satellite observation and biogeochemical modeling will be necessary and further long-term monitoring will be required.

Supplementary Materials

The following are available online at https://www.mdpi.com/2072-4292/10/6/918/s1, Figure S1: Forest fire areas detected using dNBR of Landsat and MODIS.

Author Contributions

All authors contributed this paper. J.-H.R., the main author, designed the research, analyzed the remote sensing data, and wrote the manuscript; K.-S.H., S.H., N.-W.P. and Y.W.L., the co-authors, reviewed the paper and contributed to the discussion; J.C., corresponding author, designed the research and wrote the manuscript.

Acknowledgments

We are also grateful to the three anonymous reviewers for their constructive comments. This work was supported by “Development of Hydrology, wildfire, and statistical Applications” project, funded by ETRI, which is a subproject of “Development of Geostationary Meteorological Satellite Ground Segment (NMSC-2017-01)” program funded by NMSC (National Meteorological Satellite Center) of KMA (Korea Meteorological Administration).

Conflicts of Interest

The authors declare no conflict of interest.

References

  1. Choung, Y.; Lee, B.-C.; Cho, J.-H.; Lee, K.-S.; Jang, I.-S.; Kim, S.-H.; Hong, S.-K.; Jung, H.-C.; Choung, H.-L. Forest responses to the large-scale east coast fires in Korea. Ecol. Res. 2004, 19, 43–54. [Google Scholar] [CrossRef]
  2. Seedre, M.; Taylor, A.R.; Brassard, B.W.; Chen, H.Y.H.; Jõgiste, K. Recovery of Ecosystem Carbon Stocks in Young Boreal Forests: A Comparison of Harvesting and Wildfire Disturbance. Ecosystems 2014, 17, 851–863. [Google Scholar] [CrossRef]
  3. Nicholson, Á.; Prior, L.D.; Perry, G.L.W.; Bowman, D.M.J.S. High post-fire mortality of resprouting woody plants in Tasmanian Mediterranean-type vegetation. Int. J. Wildland Fire 2017, 26, 532–537. [Google Scholar] [CrossRef]
  4. Houle, G.P.; Kane, E.S.; Kasischke, E.S.; Gibson, C.M.; Turetsky, M.R. Recovery of carbon pools a decade after wildfire in black spruce forests of interior Alaska: Effects of soil texture and landscape position. Can. J. For. Res. 2018, 48, 1–10. [Google Scholar] [CrossRef]
  5. Dale, V.H.; Joyce, L.A.; McNulty, S.; Neilson, R.P.; Ayres, M.P.; Flannigan, M.D.; Hanson, P.J.; Irland, L.C.; Lugo, A.E.; Peterson, C.J.; et al. Climate change and forest disturbances: Climate change can affect forests by altering the frequency, intensity, duration, and timing of fire, drought, introduced species, insect and pathogen outbreaks, hurricanes, windstorms, ice storms, or landslides. BioScience 2001, 51, 723–734. [Google Scholar] [CrossRef]
  6. Isaev, A.S.; Korovin, G.N.; Bartalev, S.A.; Ershov, D.V.; Janetos, A.; Kasischke, E.S.; Shugart, H.H.; French, N.H.F.; Orlick, B.E.; Murphy, T.L. Using remote sensing to assess Russian forest fire carbon emissions. Clim. Chang. 2002, 55, 235–249. [Google Scholar] [CrossRef]
  7. Meyer, V.F.; Redente, E.F.; Barbarick, K.A.; Brobst, R.B.; Paschke, M.W.; Miller, A.L. Plant and Soil Responses to Biosolids Application following Forest Fire. J. Environ. Qual. 2004, 33, 873–881. [Google Scholar] [CrossRef] [PubMed]
  8. Cerdá, A.; Doerr, S.H. Influence of vegetation recovery on soil hydrology and erodibility following fire: An 11-year investigation. Int. J. Wildland Fire 2005, 14, 423–437. [Google Scholar] [CrossRef]
  9. y Silva, F.R.; González-Cabán, A. ‘SINAMI’: A tool for the economic evaluation of forest fire management programs in Mediterranean ecosystems. Int. J. Wildland Fire 2010, 19, 927–936. [Google Scholar] [CrossRef]
  10. Arnold, K.T.; Murphy, N.P.; Gibb, H. Post-fire recovery of litter detritivores is limited by distance from burn edge. Austral Ecol. 2016, 42, 94–102. [Google Scholar] [CrossRef]
  11. Bolton, D.K.; Coops, N.C.; Hermosilla, T.; Wulder, M.A.; White, J.C. Assessing variability in post-fire forest structure along gradients of productivity in the Canadian boreal using multi-source remote sensing. J. Biogeogr. 2017, 44, 1294–1305. [Google Scholar] [CrossRef]
  12. Amiro, B.D.; Chen, J.M.; Liu, J. Net primary productivity following forest fire for Canadian ecoregions. Can. J. For. Res. 2000, 30, 939–947. [Google Scholar] [CrossRef]
  13. Goetz, S.J.; Fiske, G.J.; Bunn, A.G. Using satellite time-series data sets to analyze fire disturbance and forest recovery across Canada. Remote Sens. Environ. 2006, 101, 352–365. [Google Scholar] [CrossRef]
  14. Keeley, J.E. Fire intensity, fire severity and burn severity: A brief review and suggested usage. Int. J. Wildland Fire 2009, 18, 116–126. [Google Scholar] [CrossRef]
  15. Lee, J.-M.; Lee, S.-W.; Lim, J.-H.; Won, M.-S.; Lee, H.-S. Effects of heterogeneity of pre-fire forests and vegetation burn severity on short-term post-fire vegetation density and regeneration in Samcheok, Korea. Landsc. Ecol. Eng. 2013, 10, 215–228. [Google Scholar] [CrossRef]
  16. Storey, E.A.; Stow, D.A.; O’Leary, J.F. Assessing postfire recovery of chamise chaparral using multi-temporal spectral vegetation index trajectories derived from Landsat imagery. Remote Sens. Environ. 2016, 183, 53–64. [Google Scholar] [CrossRef] [Green Version]
  17. Miller, J.D.; Thode, A.E. Quantifying burn severity in a heterogeneous landscape with a relative version of the delta Normalized Burn Ratio (dNBR). Remote Sens. Environ. 2007, 109, 66–80. [Google Scholar] [CrossRef]
  18. Lanorte, A.; Danese, M.; Lasaponara, R.; Murgante, B. Multiscale mapping of burn area and severity using multisensor satellite data and spatial autocorrelation analysis. Int. J. Appl. Earth Obs. 2013, 20, 42–51. [Google Scholar] [CrossRef]
  19. Alonso-Canas, I.; Chuvieco, E. Global burned area mapping from ENVISAT-MERIS and MODIS active fire data. Remote Sens. Environ. 2015, 163, 140–152. [Google Scholar] [CrossRef]
  20. Nioti, F.; Xystrakis, F.; Koutsias, N.; Dimopoulos, P. A Remote Sensing and GIS Approach to Study the Long-Term Vegetation Recovery of a Fire-Affected Pine Forest in Southern Greece. Remote Sens. 2015, 7, 7712–7731. [Google Scholar] [CrossRef] [Green Version]
  21. Giglio, L.; Descloitres, J.; Justice, C.O.; Kaufman, Y.J. An Enhanced Contextual Fire Detection Algorithm for MODIS. Remote Sens. Environ. 2003, 87, 273–282. [Google Scholar] [CrossRef]
  22. He, L.; Li, Z. Enhancement of a fire-detection algorithm by eliminating solar contamination effects and atmospheric path radiance: Application to MODIS data. Int. J. Remote Sens. 2011, 32, 6273–6293. [Google Scholar] [CrossRef]
  23. Roy, D.P.; Boschetti, L. Southern Africa Validation of the MODIS, L3JRC, and GlobCarbon Burned-Area Products. IEEE Trans. Geosci. Remote Sens. 2009, 47, 1032–1044. [Google Scholar] [CrossRef]
  24. Key, C.H.; Benson, N.C. Measuring and remote sensing of burn severity: The CBI and NBR. In Proceedings of the Joint Fire Science Conference and Workshop, Boise, ID, USA, 15–17 June 1999. [Google Scholar]
  25. Lentile, L.B.; Holden, Z.A.; Smith, A.M.S.; Falkowski, M.J.; Hudak, A.T.; Morgan, P.; Lewis, S.A.; Gessler, P.E.; Benson, N.C. Remote sensing techniques to assess active fire characteristics and post-fire effects. Int. J. Wildland Fire 2006, 15, 319–345. [Google Scholar] [CrossRef]
  26. Hope, A.; Tague, C.; Clark, R. Characterizing post-fire vegetation recovery of California chaparral using TM/ETM+ time-series data. Int. J. Remote Sens. 2007, 28, 1339–1354. [Google Scholar] [CrossRef]
  27. Meng, R.; Dennison, P.E.; Huang, C.; Moritz, M.A.; D’Antonio, C. Effects of fire severity and post-fire climate on short-term vegetation recovery of mixed-conifer and red fir forests in the Sierra Nevada Mountains of California. Remote Sens. Environ. 2015, 171, 311–325. [Google Scholar] [CrossRef]
  28. Van Leeuwen, W.J.D.; Casady, G.M.; Neary, D.G.; Bautista, S.; Alloza, J.A.; Carmel, Y.; Wittenberg, L.; Malkinson, D.; Orr, B.J. Monitoring post-wildfire vegetation response with remotely sensed time-series data in Spain, USA and Israel. Int. J. Wildland Fire 2010, 19, 75–93. [Google Scholar] [CrossRef]
  29. Caccamo, G.; Bradstock, R.; Collins, L.; Penman, T.; Watson, P. Using MODIS data to analyse post-fire vegetation recovery in Australian eucalypt forests. J. Spat. Sci. 2014, 60, 341–352. [Google Scholar] [CrossRef]
  30. Padfield, D.; Lowe, C.; Buckling, A.; Ffrench-Constant, R.; Jennings, S.; Shelley, F.; Olafsson, J.S.; Yvon-Durocher, G. Metabolic compensation constrains the temperature dependence of gross primary production. Ecol. Lett. 2017, 20, 1250–1260. [Google Scholar] [CrossRef] [PubMed] [Green Version]
  31. Zhou, S.; Zhang, Y.; Ciais, P.; Xiao, X.; Luo, Y.; Caylor, K.K.; Huang, Y.; Wang, G. Dominant role of plant physiology in trend and variability of gross primary productivity in North America. Sci. Rep. 2017, 7, 41366. [Google Scholar] [CrossRef] [PubMed] [Green Version]
  32. Laneve, G.; Fusilli, L.; Marzialetti, P.; De Bonis, R.; Bernini, G.; Tampellini, L. Development and Validation of Fire Damage-Severity Indices in the Framework of the PREFER Project. IEEE J. Sel. Top. Appl. Earth Obs. Remote Sens. 2016, 9, 2806–2817. [Google Scholar] [CrossRef]
  33. Miller, J.D.; Knapp, E.E.; Key, C.H.; Skinner, C.N.; Isbell, C.J.; Creasy, R.M.; Sherlock, J.W. Calibration and validation of the relative differenced Normalized Burn Ratio (RdNBR) to three measures of fire severity in the Sierra Nevada and Klamath Mountains, California, USA. Remote Sens. Environ. 2009, 113, 645–656. [Google Scholar] [CrossRef]
  34. Chen, D.; Huang, J.; Jackson, T.J. Vegetation water content estimation for corn and soybeans using spectral indices derived from MODIS near- and short-wave infrared bands. Remote Sens. Environ. 2005, 98, 225–236. [Google Scholar] [CrossRef]
  35. García, M.J.L.; Caselles, V. Mapping burns and natural reforestation using thematic Mapper data. Geocarto Int. 1991, 6, 31–37. [Google Scholar] [CrossRef]
  36. Huete, A.; Didan, K.; Miura, T.; Rodriguez, E.P.; Gao, X.; Ferreira, L.G. Overview of the radiometric and biophysical performance of the MODIS vegetation indices. Remote Sens. Environ. 2002, 83, 195–213. [Google Scholar] [CrossRef]
  37. Kogan, F.; Gitelson, A.; Zakarin, E.; Spivak, L.; Lebed, L. AVHRR-Based Spectral Vegetation Index for Quantitative Assessment of Vegetation State and Productivity. Photogramm. Eng. Remote Sens. 2003, 69, 899–906. [Google Scholar] [CrossRef]
  38. Serrano, L.; Filella, I.; Penuelas, J. Remote Sensing of Biomass and Yield of Winter Wheat under Different Nitrogen Supplies. Crop Sci. 2000, 40, 723–731. [Google Scholar] [CrossRef]
  39. Yin, H.; Udelhoven, T.; Fensholt, R.; Pflugmacher, D.; Hostert, P. How Normalized Difference Vegetation Index (NDVI) Trendsfrom Advanced Very High Resolution Radiometer (AVHRR) and Système Probatoire d’Observation de la Terre VEGETATION (SPOT VGT) Time Series Differ in Agricultural Areas: An Inner Mongolian Case Study. Remote Sens. 2012, 4, 3364–3389. [Google Scholar] [CrossRef] [Green Version]
  40. Shim, C.; Hong, J.; Hong, J.; Kim, Y.; Kang, M.; Malla Thakuri, B.; Kim, Y.; Chun, J. Evaluation of MODIS GPP over a complex ecosystem in East Asia: A case study at Gwangneung flux tower in Korea. Adv. Space Res. 2014, 54, 2296–2308. [Google Scholar] [CrossRef]
  41. Jung, C.G.; Lee, Y.G.; Kim, S.J.; Jang, C.H. Quantitative Study of CO2 based on Satellite Image for Carbon Budget on Flux Tower Watersheds. J. Korean Soc. Agric. Eng. 2015, 57, 109–120, (In Korean with English abstract). [Google Scholar] [CrossRef]
  42. Park, M.; Lee, H. Forest Policy and Law for Sustainability within the Korean Peninsula. Sustainability 2014, 6, 5162–5186. [Google Scholar] [CrossRef] [Green Version]
  43. Choi, C.-Y.; Lee, E.-J.; Nam, H.-Y.; Lee, W.-S.; Lim, J.-H. Temporal changes in the breeding bird community caused by post-fire treatments after the Samcheok forest fire in Korea. Landsc. Ecol. Eng. 2013, 10, 203–214. [Google Scholar] [CrossRef]
  44. Ahn, Y.S.; Ryu, S.-R.; Lim, J.; Lee, C.H.; Shin, J.H.; Choi, W.I.; Lee, B.; Jeong, J.H.; An, K.W.; Seo, J.I. Effects of forest fires on forest ecosystems in eastern coastal areas of Korea and an overview of restoration projects. Landsc. Ecol. Eng. 2013, 10, 229–237. [Google Scholar] [CrossRef]
  45. Lee, B.; Kim, S.Y.; Chung, J.; Park, P.S. Estimation of fire severity by use of Landsat TM images and its relevance to vegetation and topography in the 2000 Samcheok forest fire. J. For. Res. 2008, 13, 197–204. [Google Scholar] [CrossRef]
  46. Key, C.H.; Benson, N.C. Landscape Assessment Sampling and Analysis Methods; General Technical Report RMRS-GRT-164-CD; USDA Forest Service, Rocky Mountain Research Station: Ogden, UT, USA, 2006.
  47. Soverel, N.O.; Perrakis, D.D.B.; Coops, N.C. Estimating burn severity from Landsat dNBR and RdNBR indices across western Canada. Remote Sens. Environ. 2010, 114, 1896–1909. [Google Scholar] [CrossRef]
  48. Mallinis, G.; Mitsopoulos, I.; Chrysafi, I. Evaluating and comparing Sentinel 2A and Landsat-8 Operational Land Imager (OLI) spectral indices for estimating fire severity in a Mediterranean pine ecosystem of Greece. GISci. Remote Sens. 2017, 55, 1–18. [Google Scholar] [CrossRef]
  49. Kim, C.-G.; Shin, K.; Joo, K.Y.; Lee, K.S.; Shin, S.S.; Choung, Y. Effects of soil conservation measures in a partially vegetated area after forest fires. Sci. Total Environ. 2008, 399, 158–164. [Google Scholar] [CrossRef] [PubMed]
  50. Lee, R.J.; Chow, T.E. Post-wildfire assessment of vegetation regeneration in Bastrop, Texas, using Landsat imagery. GISci. Remote Sens. 2015, 52, 609–626. [Google Scholar] [CrossRef]
  51. Armesto, J.J.; Pickett, S.T.A. Experiments on disturbance in old-field plant communities: Impact on species richness and abundance. Ecology 1985, 66, 230–240. [Google Scholar] [CrossRef]
  52. Kim, Y.S.; Byun, J.K.; Kim, C.; Park, B.B.; Kim, Y.K.; Bae, S.W. Growth response of Pinus densiflora seedlings to different fertilizer compound ratios in a recently burned area in the eastern coast of Korea. Landsc. Ecol. Eng. 2012, 10, 241–247. [Google Scholar] [CrossRef]
  53. Korea Meteorological Administration. Available online: https://data.kma.go.kr (accessed on 13 May 2018).
  54. Wang, L.; Qu, J.J.; Hao, X.; Zhu, Q. Sensitivity studies of the moisture effects on MODIS SWIR reflectance and vegetation water indices. Int. J. Remote Sens. 2008, 29, 7065–7075. [Google Scholar] [CrossRef]
  55. Polychronaki, A.; Gitas, I.Z.; Minchella, A. Monitoring post-fire vegetation recovery in the Mediterranean using SPOT and ERS imagery. Int. J. Wildland Fire 2014, 23, 631–642. [Google Scholar] [CrossRef]
  56. Dore, S.; Kolb, T.E.; Montes-Helu, M.; Sullivan, B.W.; Winslow, W.D.; Hart, S.C.; Kaye, J.P.; Koch, G.W.; Hungate, B.A. Long-term impact of a stand-replacing fire on ecosystem CO2 exchange of a ponderosa pine forest. Glob. Chang. Biol. 2008, 14, 1801–1820. [Google Scholar] [CrossRef]
  57. Brown, S.; Lugo, A.E.; Chapman, J. Biomass of tropical tree plantations and its implications for the global carbon budget. Can. J. For. Res. 1986, 16, 390–394. [Google Scholar] [CrossRef]
  58. Quintero-Méndez, M.; Jerez-Rico, M. Heuristic forest planning model for optimizing timber production and carbon sequestration in teak plantations. iForest 2017, 10, 430–439. [Google Scholar] [CrossRef] [Green Version]
Figure 1. (a) Study area; (b) Three-band composite image of Landsat-5 consisting of Band 7 (short-wave infrared (SWIR)), Band 4 (near infrared (NIR)), and Band 3 (Red) in 13 August 2000; (c) Land type according to the International Geosphere-Biosphere Program (IGBP) land cover classification scheme of MODIS Land Cover.
Remotesensing 10 00918 g001
Figure 2. Forest fire areas detected using dNBR of Terra/MODIS. Yellow-Orange-Red pixels indicate forest fire severity divided into three groups using MODIS-based dNBR. Green pixels indicate reference area. Non-forest areas, indicated by grey pixels, were eliminated.
Remotesensing 10 00918 g002
Figure 3. Vegetation indices and gross primary production (GPP) based on forest fire severity. Red circles indicate average values, and blue dash lines indicate median values: (a) NBR2.1; (b) NBR1.6; (c) NDVI; and (d) GPP.
Remotesensing 10 00918 g003
Figure 4. The RGB composite images of Landsat-5 and Landsat-8: (a) 8 August 1999; (b) 13 August 2000; (c) 8 August 2004; (d) 17 August 2007; (e) 9 August 2010; (f) 25 August 2016.
Remotesensing 10 00918 g004
Figure 5. Forest restoration indicated by the time series of the vegetation indices and GPP. Green circles and shadings indicate average and standard deviation values in the unburned reference area, respectively. Blue triangles, yellow squares, and red stars indicate average values in the low, moderate, and high severity burned areas, respectively: (a) NBR2.1; (b) NBR1.6; (c) NDVI; and (d) GPP.
Remotesensing 10 00918 g005
Figure 6. Relative change in vegetation indices and GPP in the burned area compared with the reference area. Green lines indicate average value and green shadings indicate confidence intervals in the unburned forest area. Lines and error bar for blue triangles, yellow squares, and red stars indicate average values and confidence intervals in the low, moderate, and high severity burned areas, respectively: (a) NBR2.1; (b) NBR1.6; (c) NDVI; and (d) GPP.
Remotesensing 10 00918 g006
Table 1. Satellite data.
SatelliteSensorBand/ProductSpatial ResolutionPeriod
TerraMODISNIR (Band 2)
SWIR1.64 µm (Band 6)
SWIR2.13 µm (Band 7)
NDVI (MOD13A3)
GPP (MOD17A2H)
1 kmMay 2000
May 2012
July–August, 2000–2017
SPOTVegetationNDVI1 kmJuly–August, 1999
LandsatTM
OLI
Blue (Band 1 or 2)
Green (Band 2 or 3)
Red (Band 3 or 4)
30 mAugust 1999
August 2000
August 2004
August 2007
August 2010
August 2016
Terra & AquaMODISLand Cover1 km2013
Table 2. Statistically significant differences between the reference area and the burned area calculated using an independent two-sample t-test. L, M, and H indicate the low, moderate, and high severity burned areas, respectively. First ‘ns’ for each variable indicates the year where the reference area values were reached.
YearNBR2.1NBR1.6NDVIGPP
LMHLMHLMHLMH
2000************************************
2001***************************nsns**
2002***********************************
2003***************************nsns*
2004ns*************************nsns
2005***************************nsnsns
2006nsns***ns***************nsns
2007***************************nsns**
2008nsnsnsnsns************nsns
2009nsns*ns*****nsns****nsns
2010nsnsns**************ns***
2011nsns**ns************nsnsns
2012************nsns***ns*ns
2013nsnsnsnsns***nsns****nsns
2014********************nsns*
2015************nsnsns***********
2016**************ns*ns***********
2017*****nsnsnsnsns*********
ns: Not significant at the p < 0.05 level. *, **, ***: Significant at the p < 0.05, 0.01, and 0.001 levels, respectively.
Table 3. Recovery-time point (year) indicated by four indices (i.e., NBR2.1, NBR1.6, NDVI, and GPP) in regions of three fire severity levels during 18 years. L, M, and H represent the low, moderate, and high severity burned areas, respectively.
IndicesMeaning of MonitoringRecovery-Time Point (Year)
LMH
NBR2.1Moisture condition200420062008
NBR1.6Moisture condition200620082015
NDVIVegetation biomass20092009
GPPphotosynthetic activity200120012004

