Monitoring the Agung (Indonesia) Ash Plume of November 2017 by Means of Infrared Himawari 8 Data


1
National Research Council, Institute of Methodologies for Environmental Analysis, C. da S. Loja, 85050 Tito Scalo (Pz), Italy
2
School of Engineering, University of Basilicata, Via dell’Ateneo Lucano, 10, 85100 Potenza, Italy
*
Author to whom correspondence should be addressed.
Remote Sens. 2018, 10(6), 919; https://doi.org/10.3390/rs10060919
Submission received: 2 May 2018
/
Revised: 1 June 2018
/
Accepted: 8 June 2018
/
Published: 10 June 2018
Abstract
:The Agung volcano (Bali; Indonesia) erupted in later November 2017 after several years of quiescence. Because of ash emissions, hundreds of flights were cancelled, causing an important air traffic disruption in Indonesia. We investigate those ash emissions from space by applying the RSTASH algorithm for the first time to Himawari-8 data and using an ad hoc implementation scheme to reduce the time of the elaboration processes. Himawari-8 is a new generation Japanese geostationary meteorological satellite, whose AHI (Advanced Himawari Imager) sensor offers improved features, in terms of spectral, spatial and temporal resolution, in comparison with the previous imagers of the MTSAT (Multi-Functional Transport Satellite) series. Those features should guarantee further improvements in monitoring rapidly evolving weather/environmental phenomena. Results of this work show that RSTASH was capable of successfully detecting and tracking the Agung ash plume, despite some limitations (e.g., underestimation of ash coverage under certain conditions; generation of residual artefacts). Moreover, estimates of ash cloud-top height indicate that the monitored plume extended up to an altitude of about 9.3 km above sea level during the period 25 November at 21:10 UTC–26 November at 00:50 UTC. The study demonstrates that RSTASH may give a useful contribution for the operational monitoring of ash clouds over East Asia and the Western Pacific region, well exploiting the 10 min temporal resolution and the spectral features of the Himawari-8 data.
1. Introduction
The Gunung Agung is a stratovolcano located on the island of Bali (Indonesia; see Figure 1) which erupted in late November 2017, after more than 50 years of quiescence (the eruptive event of 1963–1964 was the largest of the twentieth century in Indonesia causing significant damages and many fatalities [1,2,3]). The eruption forced the evacuation of 40,000 people from villages located around the volcano and caused the cancellation of some international flights, leading to a temporary air traffic disruption [4].
In particular, after a number of earthquakes recorded since August 10 2017 the seismicity increased from the end of the same month [5], prompting the PVMBG (Pusat Vulkanologi dan Mitigasi Bencana Geologi), which is responsible for volcanic, seismic, and landslide risk mitigation in Indonesia, to raise the alert level to 2 (on a scale of 1–4). On 13 September, a sulphurous plume rose from the bottom of the crater and five days later an exclusion zone of 6 km was established; the alert level was increased to level 3 [5]. On 22 September, the PVMBG increased the alert level to level 4, expanding the exclusion zone to 9 km (about 9400 people were evacuated). At the end of the same month, a steam emission took place from a new fracture located on the crater floor [6,7], and during 8–10 October, some fumarolic plumes rose 50–200 m above the rim [8]. White plumes were observed in the following week [9] and in early November [10,11]. On 21 November, a phreatic eruption occurred, emitting an ash cloud reaching an altitude of about 700 m above the crater rim [12]. On the 25 November, the volcanic plume rose 1.5 km above the crater, and 13 international flights were cancelled [12]. Ash emissions also continued in the following days, forcing on the 26–27th of November, the closure of Bali and Lombok international airports [13].
In this work, we investigate the ash events of 25–28 November 2017 from space by implementing the well-established RSTASH algorithm [14,15,16], which was previously tested over the Asiatic region using infrared MTSAT-1R/2 (Multi-Functional Transport Satellite-1R/2) observations [17], for the first time on Himawari-8 data. In addition, we analyze the short-term temporal fluctuations of ash cloud-top height, evaluating the impact of RSTASH detections on estimates of this parameter.
2. Data
Himawari-8 was launched on 7 October, 2014 and positioned at 140.7° E [18,19,20]. The AHI (Advanced Himawari Imager) sensor, onboard the new Japanese geostationary satellite, has 16 spectral channels ranging from 0.47 µm to 13.3 µm, with a spatial resolution from 0.5–1 km (visible) to 2 km (infrared bands). The AHI performs full disk measurements every 10 min; however, some target areas (e.g., Japan) can be observed with a higher temporal sampling of 2.5 min [20]. The improved features of the AHI instrument, in terms of spectral, spatial and temporal resolution, should guarantee a more efficient monitoring of rapidly changing weather/environmental phenomena in comparison with imagers of the previous MTSAT series [18]. In particular, the AHI infrared bands 7 (3.74–3.96 µm), 11 (8.44–8.76 µm) 13 (10.3–10.6 µm), 14 (11.1–11.3 µm), 15 (12.2–12.5 µm) and 16 (13.2–13.4 µm), appear as the most suited to identify, study and characterize volcanic ash clouds.
Although a number of studies up to now have been performed exploiting Himawari-8 observations (e.g., [21,22,23,24]), only a few of them focused on volcanic ash (e.g., [25,26]). Some authors have used, for instance, a qualitative ash RGB product designed by the JMA (Japan Meteorological Agency) [27] to discriminate ash and SO2 plumes from meteorological clouds, emphasizing the advantages of using data from Himawari-8 for monitoring those features in a timely manner [25].
3. Methods
Algorithms developed to detect ash clouds from space, using sensors like MODIS (Moderate Resolution Imaging Spectroradiometer), generally exploit the reverse absorption effect of silicate particles in the TIR (Thermal Infrared) band at around 11 µm and 12 μm, in comparison with water droplets and ice [28]. The split window technique identifies airborne ash by means of a fixed threshold test applied to difference of Brightness Temperatures (BT) measured at the aforementioned wavelengths, i.e., [29]. Advanced detection methods, minimizing the impact of atmospheric water vapor on the above-mentioned brightness temperature difference (BTD) or analyzing signals measured in other spectral bands such as MIR (Medium Infrared) and/or VIS (Visible) ones, have shown a higher efficiency in identifying ash clouds (e.g., [30,31,32,33,34,35,36,37,38]). RSTASH [16] is an ash detection method, based on the Robust Satellite Technique (RST) multi-temporal approach [39], running on both polar [14,15,40] and geostationary [17] satellite data. This algorithm, which does not use fixed and empirical thresholds, has been tested with success in different geographic areas (e.g., [16,41]).
3.1. RSTASH Algorithm
The RSTASH algorithm identifies airborne ash by means of two local variation indices defined as:
In Equation (1), Δ when Himawari-8 data are used; and are the brightness temperatures respectively measured in bands 13 and 14 of AHI sensor (see Section 2), while and are the temporal mean and standard deviation computed, for the same location , processing plurennial time series of cloud-free homogeneous (i.e., same calendar month, same overpass time, same spectral channel/s) satellite records. Although bands 13 and 15 of AHI have their central wavelengths close to infrared channel 1 (10.4–1.3 µm) and channel 2 (11.5–12.5 µm) of the MTSAT-2 imager [20], several tests performed on different BTD signals have suggested us to analyze the above-mentioned spectral difference, instead of , to detect ash.
In Equation (2), is the difference of the MIR (Medium Infrared) and TIR signals respectively measured at 3.9 µm and 10.4 µm wavelengths (i.e., AHI bands 7 and 13), whereas and have the same meaning as above.
We expect negative values of the index in the presence of ash/dust clouds with particles having a diameter lower than 10 µm [16,42]. The index, which is generally positive in both nighttime and daylight conditions, is used in combination with the previous one to reduce false positives [16].
RSTASH is capable of guaranteeing performance comparable to water vapor-corrected BTD procedures [43], without requiring ancillary data, despite some limitations widely described in previous works (e.g., [44,45]). Since the algorithm is tunable, we can use different cutting levels of its local variation indices for mapping ash-affected areas. We have used the following algorithm configuration to identify ash pixels regardless of illumination conditions:
Moreover, a spatial noise-reduction filter has been implemented within the RSTASH process (in detection phase) to remove sparsely distributed pixels which are generally not ascribable to ash, based on that previously performed using MSG-SEVIRI (Meteosat Second Generation—Spinning Enhanced Visible and InfraRed Imager) data [41].
RSTASH Implementation on Himawari-8 Data
To run the RSTASH algorithm, a setup activity devoted to generate the library of spectral reference fields (i.e., temporal mean and standard deviation images), has to be performed. Here only three years of Himawari-8 data, provided by the Center for Environmental Remote Sensing (CEReS) of the Chiba University (Japan), were available for this purpose.
In more detail, after selecting satellite imagery according to the aforementioned homogeneity criteria, an automated procedure was used to: (i) calibrate data; (ii) extract a Region of Interest (ROI) centered over Indonesia from the full Himawari-8 disk; and (iii) remove cloudy pixels from the scenes. Concerning the last step of this procedure, we used the OCA (One Channel Cloud Detection Approach) method [46] to filter out cloudy pixels from the scenes, before generating the spectral reference fields for some nighttime (i.e., 15:00 UTC) and daytime slots (i.e., 22:00 UTC; 23:00 UTC; 00:00 UTC). OCA is a RST-based cloud detection scheme that identifies cloudy radiances based on signal divergence from the unperturbed “clear-sky” conditions; in daytime, signals measured both in the VIS (at 0.6 µm) and TIR (at 10.4 µm) bands are analyzed for this purpose. This cloud screening procedure generally performs well regardless of illumination conditions; i.e., even in nighttime when only the TIR band is used. However, in areas characterized by an almost persistent cloud coverage it may be less effective in filtering meteorological clouds [41,47]. In Figure 2, we show an example of temporal mean and standard deviation images which were generated for the month of interest and for the time slot of 00:00 UTC (i.e., 09:00 JST; Japan Standard Time).
It is worth mentioning that about 100 Gbyte of data were analyzed to perform the setup activity detailed above. Thus, an extensive data archive is required for a full processing of Himawari-8 data (144 time slots in total). In addition, the multi-temporal analysis of satellite records could be time demanding, because of elaboration processes, if proper computational resources are not available. To reduce the amount of Himawari-8 data to be processed, we have used the same spectral reference fields to run RSTASH on contiguous time slots. Table 1 shows, for instance, that the temporal mean and standard deviation images shown in Figure 2 have been used to run RSTASH also at the time slots of 23:40–23:50 UTC and of 00:10–00:50 UTC; i.e., considering a maximum temporal gap (∆t) of 50 min (see third column). We show and discuss results arising from the use of this implementation scheme, which is for the first time applied to geostationary satellite data, in the following sections.
4. Results
4.1. Ash Cloud Detection and Tracking
In Figure 3, we show two RSTASH maps generated from Himawari-8 data of 26 and 28 November 2017, by using the ash detection scheme previously described in Section 3.1. Maps display ash pixels in three different colors based on different confidence level of detection (i.e., yellow: low; orange: mid; red: high; see Section 3.1), providing qualitative information about the areas affected by ash.
In detail, Figure 3a shows the RSTASH product of 26 November at 00:00 UTC (09:00 JST), revealing the presence of an ash plume within the area marked in black and magnified on the top right side of the figure. The plume, moving from Mt. Agung (indicated in purple) towards SE direction, dispersed over both land and sea areas slightly affecting the coasts of Lombok Island (East of Bali; see Figure 1). By the spatial distribution of ash pixels within the plume, we can infer the different intensity of ash BTD signature. In particular, the latter was weaker where yellow/orange pixels were prevalent, i.e., especially in the distal plume region (which was presumably optically thinner) and on its borders. Figure 3b displays the RSTASH map of 28 November at 15:00 UTC (00:00 JST), providing information about plume shape and direction about two days after the previously analyzed satellite observation. As can be seen from the figure, although Mt. Agung was still emitting ash [48] the resulting plume was much smaller and less extended than that of Figure 3a, dispersing only over the Bali Island and moving in a SW direction. It is worth noting that RSTASH flagged a number of ash pixels even outside the magnified region on both panels of Figure 3 (e.g., see yellow pixels located at the NW corner of the maps). Those pixels, which were mostly associated to a low confidence level of detection for their location (they were not in spatial contiguity with the plume), presumably represented artefacts.
Information provided by Figure 3 is compatible with that reported by volcanological bulletins (e.g., continuous ash emission drifting WSW were observed during 28–29 November [48]), as well as with independent satellite-based observations of the same phenomenon corroborating the presence of ash over the ROI during the investigated period (see GOME-2 and TROPOMI absorbing aerosol index maps reported in [49,50]). However, to assess the ash-affected areas in a more accurate way, we performed a manual inspection of Himawari-8 imagery. In Figure 4, we show an example of this investigation, reporting the RGB (Red = 0.86 µm; Green = 0.51 µm; Blue = 0.47 µm) product at 1 km spatial resolution, of 26 November at 00:00 UTC; yellow polygons represent the borders of RSTASH detections of Figure 3a which have been overlapped to the false color composite image. The figure shows that an ash plume, appearing brown, affected the same area (marked in blue) magnified on RSTASH map of Figure 3a.
The plume, which may be well discriminated from both land (in red) and sea surfaces (in dark blue), as well as from meteorological clouds (in grey/white), had the same shape and direction of that flagged by RSTASH (see yellow polygon magnified at the top right side of the image). Nevertheless, it was more dispersed over Bali and Lombok Islands (e.g., see brown pixels close to the eruptive center), indicating that the used algorithm was slightly less effective in detecting ash both in the proximal and distal region of the plume. This limitation, which was already observed in previous studies analyzing ash clouds from different volcanoes (e.g., Eyjafjallajökull; Mt. Shinmoedake), may be ascribed to plume features (e.g., high optical thickness) and/or to observational conditions (e.g., low temperature contrast between the cloud-top and the underlying land surface) (e.g., [44,45]). Those factors presumably affected also the RSTASH map of Figure 3b, although cloud coverage had the major impact on ash detection results masking a significant portion of the plume (as for analyzed satellite data of 27 November, which are not shown here). Regarding ash pixels flagged by RSTASH outside the region marked in black, Figure 4 shows that those features mostly occurred in correspondence to some cloudy areas, confirming the generation of artefacts. The latter affected only a small portion of the entire analyzed satellite scene and did not prevent them from the correct identification of the ash plume.
To assess the RSTASH potential in monitoring the Agung ash cloud in real time, by exploiting the high temporal sampling of Himawari-8 data, we show in Figure 5 a time sequence (at 10 min) of ash maps referring to period 25 November at 21:10 UTC–26 November at 00:50 UTC (26 November at 06:10–09:50 JST). The figure shows the progressive displacement of airborne ash from the eruptive center (in purple) towards the Lombok Island, revealing also changes in both plume shape and direction. In detail, during the initial monitoring phase (i.e., on 25 November at 21:10–21:40 UTC) the ash plume, moving towards east and covering an area estimated around 100–200 km2, appeared very small because of aforementioned detection issues (see few ash pixels flagged over the Bali Island). Between 21:50–22:00 UTC, the plume direction changed from E to SE. In the following time intervals (i.e., since 22:10 UTC), the number of ash pixels increased revealing the continuity of ash emissions (e.g., see pixels flagged close to the eruptive center). Specifically, the strong increment of red pixels (i.e., those associated to low values of the index) seems to indicate that a possible change in the ash plume features occurred (e.g., in terms of ash content and/or particle size). Afterwards, the monitored ash phenomenon did not show any significant variation. During the last monitoring phase (i.e., 26 November at 00:10 UTC–00:50 UTC), i.e., when the plume shape slightly changed, the number of ash pixels flagged over the Bali Island showed a small reduction, probably because of overlying meteorological clouds. Nonetheless, we recorded a general increase of ash coverage whose maximum value, around 900 km2, was retrieved from Himawari-8 data of 26 November at 00:50 UTC (when we can speculate that the amount of emitted ash was larger).
Therefore, even if RSTASH was less effective in detecting ash when eruption was probably at the early stage and the plume was presumably nearly opaque (i.e., during the initial monitoring phase), it was capable of providing reliable information about the space-time evolution of the monitored ash phenomenon. Indeed, despite the slight increase of artefacts characterizing some panels in Figure 5 (e.g., see those of 26 November at 00:00–00:50 UTC), RSTASH showed similar performance regardless of analyzed time slots and of considered ∆t. It should be stressed, however, that when cloud coverage was particularly significant affecting a large portion of the ROI (e.g., during 28 November at 14:20–15:40 UTC), the ash plume was more difficult to be identified and tracked by satellite. Hence, meteorological clouds, partially or completely obscuring the underlying ash layers, may still represent a major issue for operational monitoring of ash phenomena from space even when satellite data at high temporal resolution are used.
4.2. Estimates of Ash Cloud-Top Height
The plume height is one of key parameters used by numerical models aiming at forecasting ash dispersion in the atmosphere (e.g., [51]). This parameter may be retrieved from satellite observations by means of different procedures (e.g., [52,53,54,55,56,57]). Among them, the cloud-top temperature method assumes that ash clouds have an emissivity close to unity and their top is in thermodynamic equilibrium with the ambient air (e.g., [52,53,54]). The ash cloud-top height may then be estimated by satellite, comparing the minimum plume temperature measured in the TIR band (generally at around 11 µm wavelength) with the atmospheric temperature profile of ash-affected areas (e.g., [58,59,60]). This approach, like other methods, is affected by some limitations (e.g., it is better applicable to opaque clouds, whereas in the presence of optically thinner clouds or ash clouds close to the tropopause, results are generally less reliable; e.g., [60,61]). We have retrieved the plume-top height by comparing the temperature of the coldest ash pixel (in the AHI band 13) flagged by RSTASH, on each panel of Figure 5, to air temperature profiles made available by the NCEP (National Centers for Environmental Prediction) Reanalysis dataset [62]. Those profiles are provided 4-times per day at 17 different pressures levels, with a spatial sampling of 2.5 × 2.5 degrees. Figure 6 displays the temporal trend of the plume-top height (with a temporal sampling of 10 min) during the period 25 November at 21:10 UTC–26 November at 00:50 UTC (i.e., the same of Figure 5).
The green curve shows that the plume-top height fluctuated in the range of 4.8–9.3 km during the investigated period. In particular, the analyzed parameter showed small variations on 25 November until 23:10 UTC (when it was in the range 4.8–5.4 km), whereas since 23:40 UTC it progressively increased despite some fluctuations (also because of cloud coverage affecting ash detection results). A sudden increase of plume-top height (from 7.4 km to 9.1 km) was recorded on 26 November between 00:00–00:10 UTC, revealing an abrupt variation in the intensity of ash emissions. Afterwards, the analyzed parameter slightly decreased, increasing once again (up to the maximum value) at 00:50 UTC.
Figure 6 displays also values (in red) of the plume height reported by Darwin VAAC, which were independently retrieved from Himawari-8 imagery and CVGHM (Center for Volcanology and Geological Hazard Mitigation) ground reports. According to the VA (Volcanic Ash) advisors from this monitoring center (whose monitored area includes Indonesia, Papua New Guinea and part of the Philippines [63]), the ash plume was at FL200 (~6.1 km) on 25 November at 21:00 UTC, increased to FL220 (~6.7 km) at 22:20 UTC and extended up to FL260 (~7.9 km) on 26 November at 00:40 UTC [64]. Hence, although only a few independent estimates of plume height were available during the analyzed time interval, it seems that the ash plume was, in general, higher in altitude than indicated by the green curve in Figure 6. Considering that during the initial monitoring phase RSTASH was less effective in detecting ash, particularly close to the source of emissions (because of some limitations previously discussed in Section 4.1), it is realistic to suppose that the plume height was consequently underestimated (of about 28% in reference to data of 22 November at 22:20 UTC). On the other hand, estimates of this parameter became presumably more accurate when RSTASH performed better in detecting the proximal region of the ash cloud, as indicated by the good agreement with information provided by Darwin VAAC (see 26 November at 00:40 UTC).
5. Discussion
Results achieved investigating the ash plume emitted during the Mt. Agung eruptions of 25–28 November 2017 have shown that RSTASH may benefit from the improved features of the AHI sensor onboard the new Japanese geostationary satellites (including Himawari-9, which is currently on standby). Information provided by RSTASH maps (in terms of ash location, plume shape and direction) is in agreement with independent field and satellite-based observations. The usefulness of those maps is even more evident considering that the ash RGB product specifically designed for Himawari-8 (see Section 2) did not always enable the identification of airborne ash during the period of interest. An example is reported in Figure 7a, displaying the ash RGB product of 25 November at 22:00 UTC (see the RSTASH map of the same day and hour reported in Figure 5 for comparison), where Red = (−4 to 2 [K]), Green = (−4 to 5 [K]) and Blue = (208–243 [K]). The figure shows that volcanic ash, which should appear in pinkish color (see [25,27]), was difficult to be distinguished from the background (see region magnified at the top right side of the image). As can be seen from Figure 7b, modifying the Red component, i.e., analyzing the spectral difference in place of , the ash plume was more recognizable but at the expense of an increase of misleading features, which were mostly associated to meteorological clouds (e.g., see pink areas outside the region marked in black).
We have verified the RSTASH capacity in detecting airborne ash despite: (i) the absence of a highly populated dataset of satellite records and (ii) a different implementation than usual. In the first case, although we processed only three years of satellite records (i.e., 90 images for each analyzed time slot), the generated spectral reference fields allowed us to correctly run the algorithm. It is important to stress that RSTASH could be in principle used even in absence of a plurennial dataset of satellite records, by analyzing, for instance, data belonging to contiguous time slots for increasing statistics (as suggested by other works performed using the RST approach [65,66]). Regarding the algorithm implementation, the generation of the library of spectral reference fields may be time demanding, particularly when geostationary satellite imagery are analyzed because of the large amount of data to be processed. In this study, we have reduced the number of spectral reference fields to run RSTASH.
This choice had a low impact on ash detection results, as discussed in Section 4.2. Figure 8, showing the Δ and Δ images in reference to three different Δt (i.e., 10 min; 30 min; 60 min), seems to corroborate the low dependency of spectral reference fields on short-time intervals. Indeed, Figure 8a shows that the spectral differencetends to fluctuate less (despite the presence of clouds) regardless of the analyzed Δt (as indicated by the mean value around zero and standard deviation lower than one of the histograms associated to top panel images). Figure 8b shows that the signal fluctuates in a more significant way in daylight conditions owing to solar reflection effects affecting the MIR signal (see higher mean and standard deviation values of histograms associated to bottom panel images). Nonetheless, by comparing the and signals to relative spectral reference fields of t ± 30 min (i.e., the central panels in Figure 8) rather than t, only a slight reduction of RSTASH performance is expected, thanks to the joint usage of the two local variation indices described in Section 2.
The maximum time interval ∆t = 30 min could then be selected to perform a full algorithm implementation on Himawari-8 data, allowing us to analyze 48 instead of 144 time slots. This implementation scheme, which might be applied even to data provided by the next MTG-FCI (Meteosat Third Generation—Flexible Combined Imager) geostationary satellites (providing additional spectral channels and a better spatial, temporal and radiometric resolution than MSG-SEVIRI) could allow us to rapidly develop an automated RSTASH elaboration chain to detect ash clouds in real time. The traditional RSTASH implementation scheme is, however, still the suggested one, particularly when an extensive data archive and adequate computational resources are available (the algorithm runs fast once the library of spectral reference fields is generated).
Finally, the short-term temporal fluctuations of the ash plume-top height shown in Figure 6 seem to indicate that estimates of this parameter were, in general, more accurate when RSTASH performed better in detecting ash in the vicinity of the eruptive center (although also intrinsic limitations of the cloud-top temperature method probably affected the achieved results). The study confirms the main issues of RSTASH, including the generation of residual artefacts occurring in correspondence to some meteorological clouds (an optimized algorithm configuration tested with success in a previous study could be used for minimizing those features on daytime satellite scenes [46]). Those artefacts that were mostly associated to pixels with a medium-low confidence level of detection on the one side enable a better mapping of ash coverage, but on the other side may lead to an increase of false positives (this aspect should be taken into account if retrieval analyses, starting from RSTASH detections, are performed).
6. Conclusions
This paper shows that the RSTASH performance coupled to high temporal resolution of Himawari-8 data may lead to an effective identification and tracking of ash clouds over East Asia and Western Pacific region in spite of some limitations. Some investigations are currently in progress to assess if the used algorithm may benefit from the analysis of signal in the space-time domain. A specific local variation index based on this spectral difference should guarantee a further reduction of artefacts, in both daylight and nighttime conditions, if integrated within the RSTASH detection scheme. This way, RSTASH could provide an even better contribution for supporting activities devoted to mitigate the impact of strong explosive eruptions on air traffic in the framework of operational contexts.
Author Contributions
F.M., N.P. and V.T conceived the research work. F.M wrote the majority of the paper. A.F. implemented the RSTASH algorithm on Himawari-8 data and performed the tests. N.P. and V.T. contributed in writing the paper.
Funding
This research was funded by European Union’s Horizon 2020 research programme for Societal challenges—smart, green and integrated transport, Research Project EUNADICS-AV, grant number 723986.
Acknowledgments
Himawari 8/9 gridded data are distributed by Center for Environmental Remote Sensing (CEReS), Chiba University, Japan.
Conflicts of Interest
The authors declare no conflict of interest.
References
- Hägerdal, H. Candrasangkala: The Balinese Art of Dating Events; University of Växjö: Växjö, Sweden, 2006; 212p. [Google Scholar]
- Fontijn, K.; Costa, F.; Sutawidjaja, I.; Newhall, C.G.; Herrin, J.S. A 5000-year record of multiple highly explosive mafic eruptions from Gunung Agung (Bali, Indonesia): Implications for eruption frequency and volcanic hazards. Bull. Volcanol. 2015, 77, 59. [Google Scholar] [CrossRef]
- Self, S.; King, A.J. Petrology and sulfur and chlorine emissions of the 1963 eruption of Gunung Agung, Bali, Indonesia. Bull. Volcanol. 1996, 58, 263–285. [Google Scholar] [CrossRef]
- REUTERS, 2018. Available online: https://www.reuters.com/article/us-indonesia-volcano-evacuation/indonesia-says-40000-evacuated-from-bali-volcano-more-need-to-move-idUSKBN1DR0CY (accessed on 2 May 2018).
- Global Volcanism Program, 2017. Report on Agung (Indonesia). Sennert, S K (ed.), Weekly Volcanic Activity Report, 13 September–19 September 2017, Smithsonian Institution and US Geological Survey.
- Global Volcanism Program, 2017. Report on Agung (Indonesia). Sennert, S K (ed.), Weekly Volcanic Activity Report, 20 September–26 September 2017, Smithsonian Institution and US Geological Survey.
- Global Volcanism Program, 2017. Report on Agung (Indonesia). Sennert, S K (ed.), Weekly Volcanic Activity Report, September–3 October 2017, Smithsonian Institution and US Geological Survey.
- Global Volcanism Program, 2017. Report on Agung (Indonesia). Sennert, S K (ed.), Weekly Volcanic Activity Report, 4 October–10 October 2017, Smithsonian Institution and US Geological Survey.
- Global Volcanism Program, 2017. Report on Agung (Indonesia). Sennert, S K (ed.), Weekly Volcanic Activity Report, 18 October–24 October 2017, Smithsonian Institution and US Geological Survey.
- Global Volcanism Program, 2017. Report on Agung (Indonesia). Sennert, S K (ed.), Weekly Volcanic Activity Report, 1 November–7 November 2017, Smithsonian Institution and US Geological Survey.
- Global Volcanism Program, 2017. Report on Agung (Indonesia). Sennert, S K (ed.), Weekly Volcanic Activity Report, 8 November–14 November 2017, Smithsonian Institution and US Geological Survey.
- Global Volcanism Program, 2017. Report on Agung (Indonesia). Sennert, S K (ed.), Weekly Volcanic Activity Report, 15 November–21 November 2017, Smithsonian Institution and US Geological Survey.
- Global Volcanism Program, 2017. Report on Agung (Indonesia). Sennert, S K (ed.), Weekly Volcanic Activity Report, 27 December–2 January 2018, Smithsonian Institution and US Geological Survey.
- Pergola, N.; Tramutoli, V.; Marchese, F.; Scaffidi, I.; Lacava, T. Improving volcanic ash cloud detection by a robust satellite technique. Remote Sens. Environ. 2004, 90, 1–22. [Google Scholar] [CrossRef]
- Filizzola, C.; Lacava, T.; Marchese, F.; Pergola, N.; Scaffidi, I.; Tramutoli, V. Assessing RAT (Robust AVHRR Technique) performances for volcanic ash cloud detection and monitoring in near real-time: The 2002 eruption of Mt. Etna (Italy). Remote Sens. Environ. 2007, 107, 440–454. [Google Scholar] [CrossRef]
- Marchese, F.; Ciampa, M.; Filizzola, C.; Lacava, T.; Mazzeo, G.; Pergola, N.; Tramutoli, V. On the exportability of robust satellite techniques (RST) for active volcano monitoring. Remote Sens. 2010, 2, 1575–1588. [Google Scholar] [CrossRef]
- Marchese, F.; Falconieri, A.; Pergola, N.; Tramutoli, V. A retrospective analysis of the Shinmoedake (Japan) eruption of 26–27 January 2011 by means of Japanese geostationary satellite data. J. Volcanol. Geotherm. Res. 2014, 269, 1–13. [Google Scholar] [CrossRef]
- Meteorological Satellite Center (MSC) of Japan Meteorological Agency. Available online: http://www.data.jma.go.jp/mscweb/en/himawari89/space_segment/spsg_ahi.html (accessed on 2 May 2018).
- Imai, T.; Yoshida, R. Algorithm theoretical basis for Himawari-8 Cloud Mask Product. Meteorol. Satell. Center Tech. Note 2016, 61, 1–17. [Google Scholar]
- Bessho, K.; Date, K.; Hayashi, M.; Ikeda, A.; Imai, T.; Inoue, H.; Kumagai, Y.; Miyakawa, T.; Murata, H.; Ohno, T.; et al. An introduction to Himawari-8/9—Japan’s new-generation geostationary meteorological satellites. J. Meteorol. Soc. Jpn. 2016, 94, 151–183. [Google Scholar] [CrossRef]
- Na, L.; Zhang, J.; Bao, Y.; Bao, Y.; Na, R.; Tong, S.; Si, A. Himawari-8 Satellite Based Dynamic Monitoring of Grassland Fire in China-Mongolia Border Regions. Sensors 2018, 18, 276. [Google Scholar] [CrossRef] [PubMed]
- Kurihara, Y.; Murakami, H.; Kachi, M. Sea surface temperature from the new Japanese geostationary meteorological Himawari-8 satellite. Geophys. Res. Lett. 2016, 43, 1234–1240. [Google Scholar] [CrossRef] [Green Version]
- Wickramasinghe, C.H.; Jones, S.; Reinke, K.; Wallace, L. Development of a multi-spatial resolution approach to the surveillance of active fire lines using Himawari-8. Remote Sens. 2016, 8, 932. [Google Scholar] [CrossRef]
- Wang, W.; Mao, F.; Du, L.; Pan, Z.; Gong, W.; Fang, S. Deriving Hourly PM2. 5 Concentrations from Himawari-8 AODs over Beijing–Tianjin–Hebei in China. Remote Sens. 2017, 9, 858. [Google Scholar] [CrossRef]
- Shii, K.; Hayashi, Y.; Shimbori, T. Using Himawari-8, estimation of SO2 cloud altitude at Aso volcano eruption, on October 8, 2016. Earth Planets Space 2018, 70, 1–9. [Google Scholar]
- Zidikheri, M.J.; Lucas, C.; Potts, R.J. Estimation of optimal dispersion model source parameters using satellite detections of volcanic ash. J. Geophys. Res. Atmos. 2017, 122, 8207–8232. [Google Scholar] [CrossRef]
- Japan Meteorological Agency (JMA), Himawari RGB Training Library, Ash RGB—Detection of Volcanic Ash. Available online: http://www.data.jma.go.jp/mscweb/en/VRL/VLab_RGB/materials/RGB-Ash-Detection_of_Volcanic_Ash.pdf (accessed on 2 May 2018).
- Prata, A.J. Radiative transfer calculations for volcanic ash clouds. Geophys. Res. Lett. 1989, 16, 1293–1296. [Google Scholar] [CrossRef]
- Prata, A.J. Observations of volcanic ash clouds in the 10–12 µm window using AVHRR/2 data. Int. J. Remote Sens. 1989, 10, 751–761. [Google Scholar] [CrossRef]
- Yu, T.; Rose, W.I.; Prata, A.J. Atmospheric correction for satellite-based volcanic ash mapping and retrievals using “split window” IR data from GOES and AVHRR. J. Geophys. Res. Atmos. 2002, 107. [Google Scholar] [CrossRef] [Green Version]
- Corradini, S.; Spinetti, C.; Carboni, E.; Tirelli, C.; Buongiorno, M.F.; Pugnaghi, S.; Gangale, G. Mt. Etna tropospheric ash retrieval and sensitivity analysis using Moderate Resolution Imaging Spectroradiometer measurements. J. Appl. Remote Sens. 2008, 2, 023550. [Google Scholar] [CrossRef]
- Mosher, F.R. Four channel volcanic ash detection algorithm. In Proceedings of the 10th Conference on Satellite Meteorology and Oceanography, Long Beach, CA, USA, 9–14 January, 2000; pp. 457–460. [Google Scholar]
- Ellrod, G.P.; Connel, B.H.; Hillger, D.W. Improved detection of airborne volcanic ash using multi-spectral infrared satellite data. J. Geophys. Res. 2003, 108, 4356. [Google Scholar] [CrossRef]
- Pavolonis, M.J.; Wayne, F.F.; Heidinger, A.K.; Gallina, G.M. A daytime complement to the reverse absorption technique for improved automated detection of volcanic ash. J. Atmos. Ocean. Technol. 2006, 23, 1422–1444. [Google Scholar] [CrossRef]
- Pavolonis, M.J.; Sieglaff, J.; Cintineo, J. Spectrally Enhanced Cloud Objects—A generalized framework for automated detection of volcanic ash and dust clouds using passive satellite measurements: 1. Multispectral analysis. J. Geophys. Res. Atmos. 2015, 120, 7813–7841. [Google Scholar] [CrossRef]
- Francis, P.N.; Cooke, M.C.; Saunders, R.W. Retrieval of physical properties of volcanic ash using Meteosat: A case study from the 2010 Eyjafjallajökull eruption. J. Geophys. Res. Atmos. 2012, 117. [Google Scholar] [CrossRef] [Green Version]
- Naeger, A.R.; Christopher, S.A. The identification and tracking of volcanic ash using the Meteosat Second Generation (MSG) Spinning Enhanced Visible and Infrared Imager (SEVIRI). Atmos. Meas. Tech. 2014, 7, 581–597. [Google Scholar] [CrossRef] [Green Version]
- Guéhenneux, Y.; Gouhier, M.; Labazuy, P. Improved space borne detection of volcanic ash for real-time monitoring using 3-Band method. J. Volcanol. Geotherm. Res. 2015, 293, 25–45. [Google Scholar] [CrossRef]
- Tramutoli, V. Robust satellite techniques (RST) for natural and environmental hazards monitoring and mitigation: Theory and applications. In Proceedings of the 2007 International Workshop on the Analysis of Multi-temporal Remote Sensing Images, Leuven, Belgium, 18–20 July 2007. [Google Scholar] [CrossRef]
- Marchese, F.; Malvasi, G.; Ciampa, M.; Filizzola, C.; Pergola, N.; Tramutoli, V. A robust multitemporal satellite technique for volcanic activity monitoring: Possible impacts on volcanic hazard mitigation. In Proceedings of the 2007 International Workshop on the Analysis of Multi-temporal Remote Sensing Images, Leuven, Belgium, 18–20 July 2007; pp. 1–5. [Google Scholar] [CrossRef]
- Falconieri, A.; Cooke, M.C.; Filizzola, C.; Marchese, F.; Pergola, N.; Tramutoli, V. Comparing Two Independent Satellite-Based Algorithms for Detecting and Tracking Ash Clouds by Using SEVIRI Sensor. Sensors 2018, 18, 369. [Google Scholar] [CrossRef] [PubMed]
- Sannazzaro, F.; Filizzola, C.; Marchese, F.; Corrado, R.; Paciello, R.; Mazzeo, G.; Pergola, N.; Tramutoli, V. Identification of dust outbreaks on infrared MSG-SEVIRI data by using a Robust Satellite Technique (RST). Acta Astronaut. 2014, 93, 64–70. [Google Scholar] [CrossRef]
- Piscini, A.; Corradini, S.; Marchese, F.; Merucci, L.; Pergola, N.; Tramutoli, V. Volcanic ash cloud detection from space: A comparison between the RSTASH technique and the water vapour corrected BTD procedure. Geomat. Nat. Hazards Risk 2011, 2, 263–277. [Google Scholar] [CrossRef]
- Marchese, F.; Corrado, R.; Genzano, N.; Mazzeo, G.; Paciello, R.; Pergola, N.; Tramutoli, V. Assessment of the robust satellite technique (RST) for volcanic ash plume identification and tracking. In Proceedings of the Second Workshop on Use of Remote Sensing Techniques for Monitoring Volcanoes and Seismogenic Areas, Naples, Italy, 11–14 November 2008; pp. 1–5. [Google Scholar]
- Marchese, F.; Filizzola, C.; Mazzeo, G.; Pergola, N.; Sannazzaro, F.; Tramutoli, V. Assessment and validation in time domain of a Robust Satellite Technique (RSTASH) for ash cloud detection. Geomat. Nat. Hazards Risk 2011, 2, 247–262. [Google Scholar] [CrossRef]
- Cuomo, V.; Filizzola, C.; Pergola, N.; Pietrapertosa, C.; Tramutoli, V. A self sufficient approach for Gerb cloudy radiance detection. Atmos. Res. 2004, 72, 39–56. [Google Scholar] [CrossRef]
- Lacava, T.; Marchese, F.; Arcomano, G.; Coviello, I.; Falconieri, A.; Faruolo, M.; Pergola, N.; Tramutoli, V. Thermal monitoring of Eyjafjöll volcano eruptions by means of infrared MODIS data. IEEE J. Sel. Top. Appl. Earth Obs. Remote Sens. 2014, 7, 3393–3401. [Google Scholar] [CrossRef]
- Global Volcanism Program, 2017. Report on Agung (Indonesia). Sennert, S K (ed.), Weekly Volcanic Activity Report, 22 November–28 November 2017, Smithsonian Institution and US Geological Survey.
- EUNADICS-AV (European Natural Airborne Disaster Information and Coordination System for Aviation), News, Agung Eruption. Available online: http://www.eunadics.eu/agung-eruption (accessed on 2 May 2018).
- EUNADICS-AV (European Natural Airborne Disaster Information and Coordination System for Aviation), the TROPOMI Satellite: New Exciting Possibilities for Monitoring Natural Airborne Hazards. Available online: http://www.eunadics.eu/tropomi-satellite-new-exciting-possibilities-monitoring-natural-airborne-hazards (accessed on 2 May 2018).
- Mastin, L.G.; Guffanti, M.; Servranckx, R.; Webley, P.; Barsotti, S.; Dean, K.; Durant, A.; Ewert, J.W.; Neri, A.; Rose, W.I.; et al. A multidisciplinary effort to assign realistic source parameters to models of volcanic ash-cloud transport and dispersion during eruptions. J. Volcanol. Geotherm. Res. 2009, 186, 10–21. [Google Scholar] [CrossRef] [Green Version]
- Kienle, J.; Shaw, G.E. Plume dynamics, thermal energy and long distance transport of vulcanian eruption clouds from Augustine volcano, Alaska. J. Volcanol. Geotherm. Res. 1979, 6, 139–164. [Google Scholar] [CrossRef]
- Holasek, R.E.; Self, S.; Woods, A.W. Satellite observations and interpretation of the 1991 Mount Pinatubo eruption plumes. J. Geophys. Res. 1996, 100, 8469–8487. [Google Scholar] [CrossRef]
- Prata, A.J.; Turner, P.J. Cloud-top height determination using ATSR data. Remote Sens. Environ. 1997, 59, 1–13. [Google Scholar] [CrossRef]
- Richards, M.S.; Ackerman, S.A.; Pavolonis, M.J.; Feltz, W.F.; Tupper, A. Volcanic Ash Cloud Heights Using the MODIS CO2-Slicing Algorithm; CIMSS; University of Wisconsin-Madison, Department of Atmospheric and Oceanic Sciences: Madison, WI, USA, 2006. [Google Scholar]
- Zakšek, K.; Hort, M.; Zaletelj, J.; Langmann, B. Monitoring volcanic ash cloud top height through simultaneous retrieval of optical data from polar orbiting and geostationary satellites. Atmos. Chem. Phys. 2013, 13, 2589–2606. [Google Scholar] [CrossRef] [Green Version]
- Virtanen, T.H.; Kolmonen, P.; Rodríguez, E.; Sogacheva, L.; Sundström, A.M.; de Leeuw, G. Ash plume top height estimation using AATSR. Atmos. Meas. Tech. 2014, 7, 2437–2456. [Google Scholar] [CrossRef] [Green Version]
- Sawada, Y. Study on Analysis of Volcanic Eruptions Based on Eruption Cloud Image Data Obtained by the Geostationary Meteorological Satellite (GMS); Meteorology Research Institute: Tokyo, Japan, 1987; 335p. [Google Scholar]
- Glaze, L.S.; Francis, P.W.; Self, S.; Rothery, D.A. The 16th September 1986 eruption of Lascar volcano, north Chile: Satellite investigations. Bull. Volcanol. 1989, 51, 149–160. [Google Scholar] [CrossRef]
- Oppenheimer, C. Volcanological applications of meteorological satellites. Int. J. Remote Sens. 1998, 10, 2829–2864. [Google Scholar] [CrossRef]
- Prata, A.; Grant, I. Retrieval of microphysical andmorphological properties of volcanic ash plumes from satellite data: Application to Mt Ruapehu, New Zealand. Q. J. R. Meteorol. Soc. 2001, 127, 2153–2179. [Google Scholar] [CrossRef]
- Earth System Research Laboratory—Physical Sciences Division. NCEP Reanalysis. Air Temperature. Available online: https://www.esrl.noaa.gov/psd/cgi-bin/db_search/DBSearch.pl?Dataset=NCEP+Reanalysis&Variable=Air+Temperature&group=0&submit=Search (accessed on 2 May 2018).
- Darwin Volcanic Ash Advisory Centre. Available online: http://www.bom.gov.au/info/vaac/ (accessed on 2 May 2018).
- Darwin Volcanic Ash Advisory Centre. Available online: ftp://ftp.bom.gov.au/anon/gen/vaac/2017/ (accessed on 2 May 2018).
- Filizzola, C.; Corrado, R.; Marchese, F.; Mazzeo, G.; Paciello, R.; Pergola, N.; Tramutoli, V. RST-FIRES, an exportable algorithm for early-fire detection and monitoring: Description, implementation, and field validation in the case of the MSG-SEVIRI sensor. Remote Sens. Environ. 2017, 192, e2–e25. [Google Scholar] [CrossRef]
- Marchese, F.; Sannazzaro, F.; Falconieri, A.; Filizzola, C.; Pergola, N.; Tramutoli, V. An Enhanced Satellite-Based Algorithm for Detecting and Tracking Dust Outbreaks by Means of SEVIRI Data. Remote Sens. 2017, 9, 537. [Google Scholar] [CrossRef]
Figure 1.
Geographic location of Mt. Agung (Bali; Indonesia).
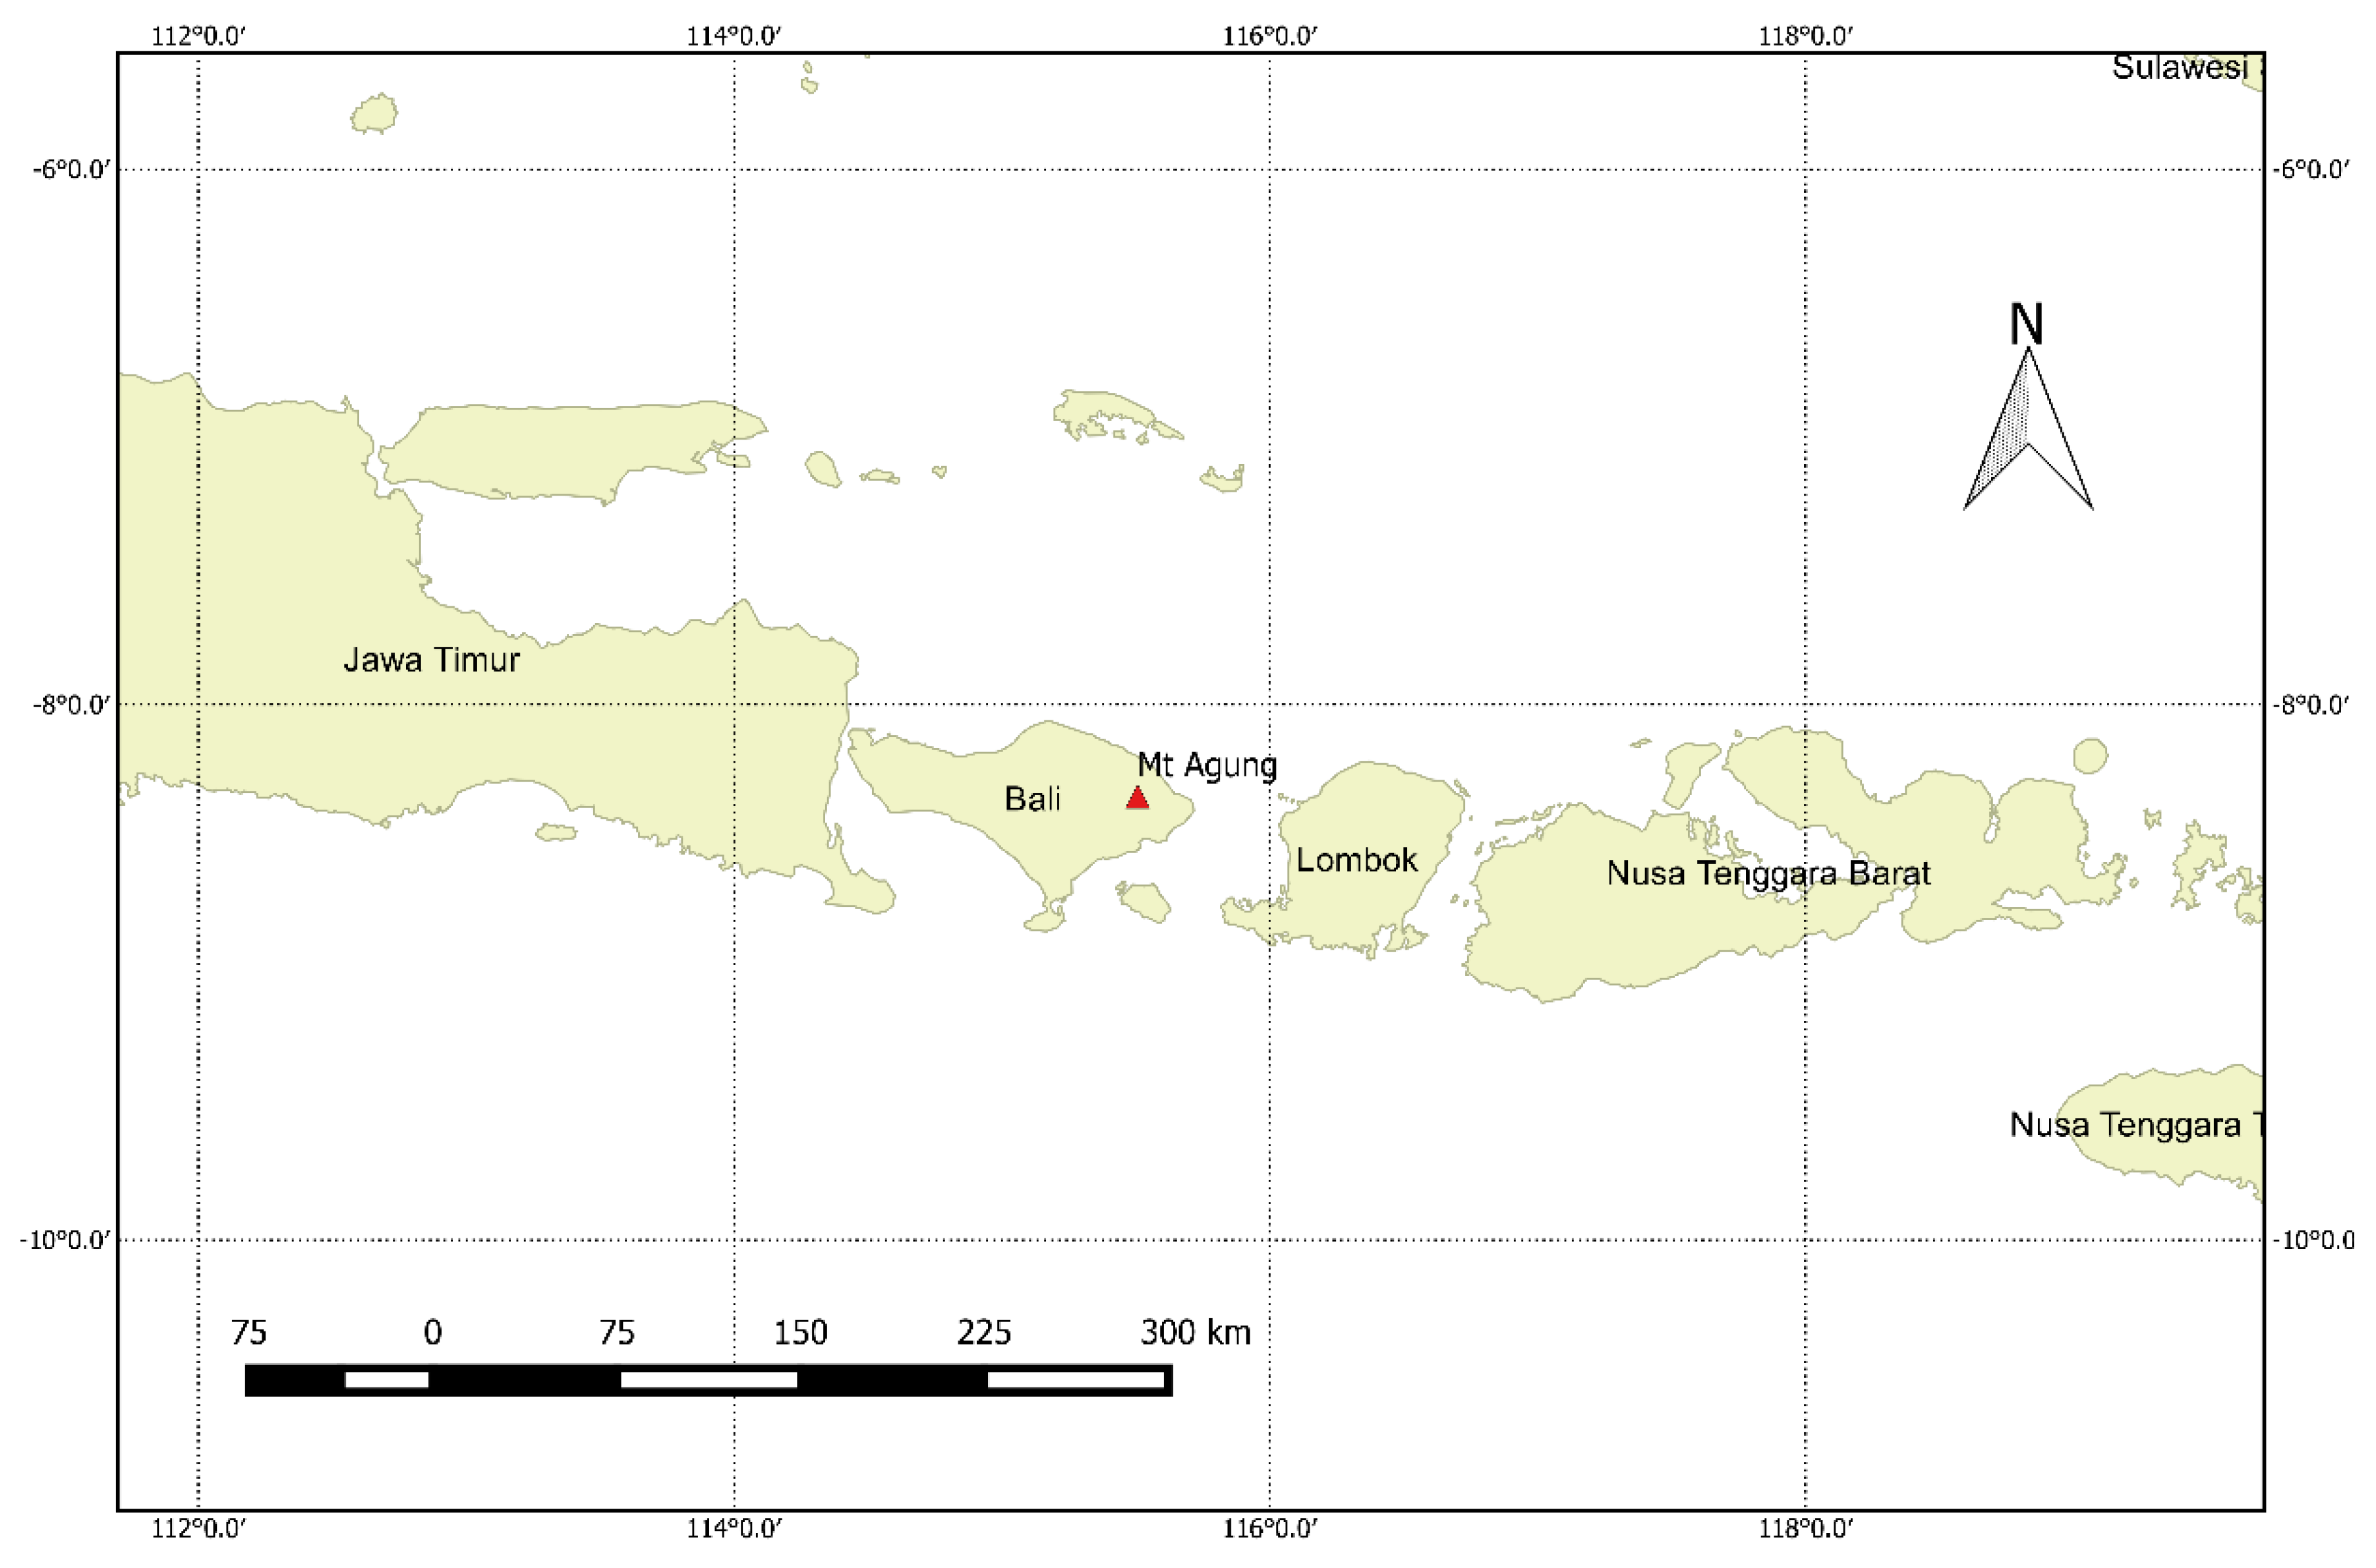
Figure 2.
Temporal mean (a) and standard deviation of (b) images of in reference to November and to the time slot of 00:00 UTC. In pink, the location of Mt. Agung; in blue, the coastlines.
Figure 2.
Temporal mean (a) and standard deviation of (b) images of in reference to November and to the time slot of 00:00 UTC. In pink, the location of Mt. Agung; in blue, the coastlines.

Figure 3.
RSTASH maps (in yellow: < −1 AND > 0; in orange: < −2 AND > 0; in red: < −3 AND > 0) generated from infrared Himawari-8 data. (a) 26 November at 00:00 UTC; (b) 28 November at 15:00 UTC.
Figure 3.
RSTASH maps (in yellow: < −1 AND > 0; in orange: < −2 AND > 0; in red: < −3 AND > 0) generated from infrared Himawari-8 data. (a) 26 November at 00:00 UTC; (b) 28 November at 15:00 UTC.

Figure 4.
Himawari-8 RGB (Red = 0.86 µm; Green = 0.51 µm; Blue = 0.47 µm) product at 1 km spatial resolution 26 November at 00:00 UTC (09:00 JST). In brown, within the magnified area (at the top right side of image), the ash plume emitted by Mt. Agung (indicated in purple). Dashed lines, in yellow, correspond to borders of RSTASH detections.

Figure 5.
RSTASH maps (at 10 min temporal resolution) generated from infrared Himawari-8 data of 25 November at 21:10 UTC–26 November at 00:50 UTC.
Figure 5.
RSTASH maps (at 10 min temporal resolution) generated from infrared Himawari-8 data of 25 November at 21:10 UTC–26 November at 00:50 UTC.

Figure 6.
In green, temporal trend of the ash plume-top height (with a 10 min temporal sampling) during 25 November at 21:10 UTC–26 November at 00:50 UTC, retrieved from ash maps of Figure 5 by using the cloud-top temperature method; in red, values of the plume height reported by VA advisory from Darwin VAAC.

Figure 7.
Ash RGB products from Himawari-8 data of 25 November at 22:00 UTC at 2 km spatial resolution; (a) Red = , Green = ; Blue = ; Gamma: 1.0; (b) Red = ; Green = ; Blue = ; Gamma: 1.0.
Figure 7.
Ash RGB products from Himawari-8 data of 25 November at 22:00 UTC at 2 km spatial resolution; (a) Red = , Green = ; Blue = ; Gamma: 1.0; (b) Red = ; Green = ; Blue = ; Gamma: 1.0.

Figure 8.
(a) ; (b) images. Histogram values, referring to time intervals of 21:20–21:10 UTC (∆t = 10 min), 21:40–21:10 UTC (∆t = 30 min), 23:00–22:00 UTC (∆t = 60 min), are reported at the bottom of each panel.
Figure 8.
(a) ; (b) images. Histogram values, referring to time intervals of 21:20–21:10 UTC (∆t = 10 min), 21:40–21:10 UTC (∆t = 30 min), 23:00–22:00 UTC (∆t = 60 min), are reported at the bottom of each panel.


Table 1.
Times of spectral reference fields and of satellite data acquisition.
| Times of Spectral Reference Fields | Times of Satellite Data Acquisition | Max ∆t |
|---|---|---|
| 15:00 UTC | 14:20–15:40 UTC | 40 min |
| 22:00 UTC | 21:10–22:30 UTC | 50 min |
| 23:00 UTC | 22:40–23:30 UTC | 30 min |
| 00:00 UTC | 23:40–00:50 UTC | 50 min |
© 2018 by the authors. Licensee MDPI, Basel, Switzerland. This article is an open access article distributed under the terms and conditions of the Creative Commons Attribution (CC BY) license (http://creativecommons.org/licenses/by/4.0/).
Share and Cite
MDPI and ACS Style
Marchese, F.; Falconieri, A.; Pergola, N.; Tramutoli, V. Monitoring the Agung (Indonesia) Ash Plume of November 2017 by Means of Infrared Himawari 8 Data. Remote Sens. 2018, 10, 919. https://doi.org/10.3390/rs10060919
AMA Style
Marchese F, Falconieri A, Pergola N, Tramutoli V. Monitoring the Agung (Indonesia) Ash Plume of November 2017 by Means of Infrared Himawari 8 Data. Remote Sensing. 2018; 10(6):919. https://doi.org/10.3390/rs10060919
Chicago/Turabian StyleMarchese, Francesco, Alfredo Falconieri, Nicola Pergola, and Valerio Tramutoli. 2018. "Monitoring the Agung (Indonesia) Ash Plume of November 2017 by Means of Infrared Himawari 8 Data" Remote Sensing 10, no. 6: 919. https://doi.org/10.3390/rs10060919
Note that from the first issue of 2016, this journal uses article numbers instead of page numbers. See further details here.