Article

In-Channel 3D Models of Riverine Environments for Hydromorphological Characterization

1
School of Water, Energy and Environment, Cranfield University, Cranfield MK43 0AL, UK
2
National Fisheries Services, Environment Agency, Threshelfords Business Park, Inworth Road, Feering, Essex CO61UD, UK
*
Author to whom correspondence should be addressed.
Remote Sens. 2018, 10(7), 1005; https://doi.org/10.3390/rs10071005
Submission received: 31 March 2018 / Revised: 10 June 2018 / Accepted: 19 June 2018 / Published: 25 June 2018
(This article belongs to the Special Issue Remote Sensing of Inland Waters and Their Catchments)

Abstract

:
Recent legislative approaches to improve the quality of rivers have resulted in the design and implementation of extensive and intensive monitoring programmes that are costly and time consuming. An important component of assessing the ecological status of a water body as required by the Water Framework Directive is characterising the hydromorphology. Recent advances in autonomous operation and the spatial coverage of monitoring systems enables more rapid 3D models of the river environment to be produced. This study presents a Structure from Motion (SfM) semi-autonomous based framework for the estimation of key reach hydromorphological measures such as water surface area, wetted water width, bank height, bank slope and bank-full width, using in-channel stereo-imagery. The framework relies on a stereo-camera that could be positioned on an autonomous boat. The proposed approach is demonstrated along three 40 m long reaches with differing hydromorphological characteristics. Results indicated that optimal stereo-camera settings need to be selected based on the river appearance. Results also indicated that the characteristics of the reach have an impact on the estimation of the hydromorphological measures; densely vegetated banks, presence of debris and sinuosity along the reach increased the overall error in hydromorphological measure estimation. The results obtained highlight a potential way forward towards the autonomous monitoring of freshwater ecosystems.

Graphical Abstract

1. Introduction

Legislative approaches have been introduced across the world with the intent of improving the quality of rivers since the second half of the 19th century [1]. Some examples include the Australian and New Zealand guidelines for fresh and marine water quality under the National Water Quality Management Strategy [2] and the U.S. Clean Water Act [3]. The most recent example of a pan-continental approach is perhaps the Water Framework Directive (WFD) [4], which aims at achieving good chemical and ecological status of both surface and groundwater bodies. An important component of WFD implementation is the development and implementation of monitoring programmes to characterise water bodies in terms of chemical, biological and morphological parameters. This includes protocols such as the River Habitat Survey (RHS) [5] for the morphological assessment of reaches, the River Invertebrate Prediction and Classification System [6] for the characterisation of water quality, and the Multimeric Macroinvertebrate Index Flanders [7] for the identification of macroinvertebrates.
The increased need for monitoring has resulted in the rapid development of autonomous and wide-area monitoring techniques and technologies. This is particularly evident with hydromorphological characterisation where both hydrology (i.e., the quantity and dynamics of water flow and connection to groundwater bodies) and morphology (i.e., reach depth, structure and substrate of the river, structure of the riparian zone and river continuity) are measured [4]. Some of the approaches developed include, amongst others, the use of Unmanned Aerial Vehicles (UAVs) for continuous river habitat mapping [8,9], radio controlled boats with embedded sensors for hydromorphological characterisation [10,11,12,13] and the development of novel statistical methods for automated river environment data analysis [9,14].
Recent developments in photogrammetry and Structure from Motion (SfM) based methodologies show particular promise in the context of hydromorphological characterisation. SfM is an automated method capable of creating 3D river environment models using imagery from cameras [15]. The low cost and flexibility of SfM based methods enable them to be used at different scales and in varying environments [16]. In general, SfM methods use imagery gathered from a single camera either mounted on an aerial platform or on a stand at ground level. For example, SfM methods applied to aerial imagery have been used for the large-scale high resolution elevation mapping of the Waimakariri River in New Zealand [17], for the quantification of topographical changes (i.e., erosion and deposition patterns) over time along a 1 km reach along the River Daan (Taiwan) [18], to model the submerged fluvial topography of shallow rivers for the River Arrow (Warwickshire, UK) and the Coledale Beck (Braithwaite, UK) [8] and to evaluate temporal changes of river bar morphology along the Browns Canyon (Arkansas River, Colorado, USA). Examples of SfM applied to ground based imagery include: the use of low oblique imagery to monitor changes in stream channel morphology at cross-section level along the Souhegan River (New Hampshire, USA) [19] and the use of stereoscopic imagery to characterise bank erosion [20] along a 60 m reach in the River Yarty (Devon, UK).
However, there are multiple limitations associated with SfM approaches used in the ways above described that curtail the implementation of wide-area fully autonomous systems for hydromorphological river characterisation. Solutions for automated wide-area hydromorphological characterisation based on aircraft imagery are generally associated with low resolution hydromorphological assessments [14] due to the compromised detail of the raw imagery captured; there is always a trade-off between image scale, spatial coverage and theoretical precision [17]. Similarly, methods based on (high/low resolution) aerial imagery (e.g., based on imagery from unmanned aerial vehicles or aircraft) may fail to capture side views of the river environment and do not enable a full hydromorphological characterisation of all relevant attributes [9] (e.g., water depth, flow velocity or bank morphometry). Photogrammetric approaches implemented with aerial imagery obtain the elevation from the vegetation top rather than the ground surface [17] and therefore provide low resolution in areas with thick vegetation [19]. Methods relying on imagery collected at ground level (i.e., from the bank) also fail to provide a full overview of the river environment and are not cost-effective; they are generally based on oblique imagery collected from the bank and require multiple camera set ups on both banks to enable a full characterisation of a selected reach. The need to set up multiple stations for data collection does not enable time-efficient wide-area applications of the proposed approaches.
A plausible solution to overcome some of the limitations described above is the use of a camera mounted on an on-water platform capable of navigating autonomously along the river. This, combined with adequate battery endurance, tailored processing algorithms and sensors, would enable the continuous wide-area characterisation of key features (e.g., river width, hydraulic units, habitat units, and water depth) along the river [21] from different angles. Previous studies [10] have successfully explored the use of stereo-cameras for autonomous vessel navigation in riverine environments via image processing analysis. The stereo-camera collects in-channel imagery for navigation purposes, and also offers the opportunity to characterise hydromorphology from multiple angles through the analysis of the imagery already captured. The use of stereo-cameras has also been recognised as a means of improving the performance of an SfM model by: (i) enabling image capture from different spatial positions; and (ii) the generation of more robust 3D models than that obtained from a single camera [22]. However, to the authors’ knowledge, the characterisation of river hydromorphology from in-channel stereo-camera imagery is unexplored. The works by Pyle et al. [23] and Chandler et al. [24] are the only documented studies where stereo-cameras have been used to monitor river hydromorphology. In [23], bank erosion was characterised along the proglacial stream of the Haut Glacier d’Arolla (Valais, Switzerland) using oblique terrestrial photogrammetry. The accuracy of the DEM was estimated to be 8 mm. In [24], close-range oblique photogrammetry was used to quantify the dynamic topographic water surface along the Blackwater river (Farnham, UK). The stereoscopic coverage of the river reach was achieved via two synchronised cameras mounted on two standard camera tripods on the bank. This study reported accuracies of 3 mm.
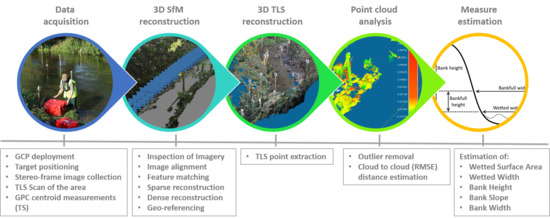
In this paper, we contribute to address this gap in knowledge by presenting a SfM based framework for the semi-automatic quantification of hydromorphological measures from 3D models of river environments using in-channel based oblique imagery captured from a stereo-camera. This was achieved through three sequential objectives: (1) to determine the optimal stereo-camera height setting for in-channel imagery collection; (2) to estimate key hydromorphological measures from the 3D model for a range of river environments; and (3) to assess the accuracy of the SfM framework developed in Objectives (1) and (2). Results obtained are used to inform plausible configurations of stereo-camera settings for on-water platforms that enable autonomous hydromorphological characterisation.

2. Methods

2.1. Study Site Selection

Three study sites (Figure 1) of differing scales were selected for the development of the SfM framework: the Chichleley Brook (Cranfield, UK), the River Ouzel (Ouzel Valley Park, UK) and the River Great Ouse (Wolverton, UK). The sites were chosen based on the presence of different environmental and hydromorphological features used by multiple methodologies for the implementation of the WFD [21]. These included water surface area (WS), water width (WW), bank height (BH), bank slope (BS) and bank width (BW) (Table 1) and informed on whether the sampled reach is anthropogenically modified. Specifically, the selection focused on: (i) an entrenched reach with high and steep banks (i.e., Chicheley Brook) characteristic of highly modified settings; and (ii) two reaches with vegetated and low gradient banks that are representative of less modified conditions (River Ouzel and River Great Ouse). Data at the three sites were collected under steady low flow conditions on a sunny day with no cloud presence and excellent visibility (Table 2).
The reach along the Chicheley Brook was approximately 2 m wide and highly entrenched (bank height ≈2 m), with the presence of overgrown vegetation along the banks and the channel. The substrate along the channel was primarily fine sediments (silt–clay) resulting from erosion-deposition processes and sewage treatment work activity further upstream. The reach had multiple structures (pipes and bridges) across both banks; the location of the reach along the brook was selected to minimise the presence of such structures within the imagery collected (Figure 1).
The reach along the River Ouzel was approximately 8 m wide with meanders, overhanging vegetation, submerged and emergent macrophites and partially exposed tree trunks along the channel. The riverbed was predominantly dominated by gravel substrate. The banks were densely vegetated and covered by grass, with sporadic tree presence. The substrate along the banks was predominantly clay, with eroded cliffs along the meanders. There was a wooden bridge across the reach (Figure 1).
The wider reach out of the three considered was located along the River Great Ouse. The reach was approximately 15 m wide and the vegetated banks had artificial structures in place to reduce erosion. The vegetation along the banks was quite disperse, with some isolated trees along the reach and some vegetated side bars along the left bank. Erosion derived from cattle activity was frequently observed along both banks. The riverbed comprised gravel and fine sediments. Within the reach, there was a sequence of pools and riffles (Figure 1).

2.2. Stereo-Camera Height Calibration

Stereo-image data capture at all sites was carried out using two Canon 550D cameras (Table 3) mounted on a fixed metallic frame. It is particularly important for the internal geometry of the cameras to be accurately determined, as it allows for the accurate creation of the object-model [24,27,28]. The intrinsic parameters (internal orientation) [29] of the cameras were determined prior to data collection independently for each of the individual cameras via the Matlab Computer Vision System Toolbox [30] (Table 4) and used in Agisoft Photoscan for the processing of the imagery. For that purpose, a checkerboard was used as a planar reference. Note that the notation used in this paper was taken from the tool used for calibration (Matlab Computer Vision Toolbox); Agisoft Photoscan uses a different notation with p1-p2 used for tangential distortion rather than k4 and k5. The k4 coefficient (i.e., additional radial distortion parameter) in Agisoft was set to zero.
The extrinsic parameters (external orientation) [29] of the cameras during data collection (i.e., the position and rotation of camera within the scene) was calculated automatically in Agisoft Photoscan. The cameras were horizontally affixed to a rigid frame, with their optical axis forming parallel lines (Figure 2). While it has been proven that mildly convergent imagery can lessen the effect of lens distortion for consumer grade digital cameras [31], the stereo-cameras in this study operate in varied environments with wide-ranging depths. A parallel solution was therefore preferred and lens distortion estimated as a part of the intrinsic parameters. The frame was kept leveled at all times, only allowing for changes in camera heading. The stereo-camera setup had a baseline (i.e., distance between optical centres) of 24 cm (Figure 2). The cameras were maintained at a constant height above the water level and simultaneously triggered using a Hongdak Remote Switch RS-60E3 (Shenzhen Xiutian Electronic Co. Ltd., Shenzhen, Guangdong, China).
A pilot study along the Chicheley Brook and the River Ouzel sites was carried out to determine the optimal height at which the cameras should be set. At each of these two sites, stereo-imagery was collected along a 10 m reach every 25 cm for a set of different camera heights. These camera heights ranged from 0.6 m to 1.6 m at intervals of 20 cm (Figure 2); both cameras were simultaneously raised 20 cm using the adjustable frame to achieve the new stereo-camera setting. An additional data set was collected with the stereo-cameras set at 0.5 m height and used as reference to estimate departures in track replicability between stereo-camera settings (Figure 3). To maximise track replicability, a metric tape with metal markers at 25 cm intervals was used to delineate the track and indicate each of the camera trigger points. The precision in track replicability was defined by the mean difference in x and y with respect to the 0.5 m stereo-camera height setting.
A total of six ground control points (GCPs) were randomly distributed along each of the 10 m reaches selected for the pilot study (i.e., Chicheley Brook and River Ouzel sites). The GCPs were 11 cm × 11 cm laminated prints of black and white circle quartiles for easy identification (Figure 1) and were pinned at random heights on both sides of wooden stakes. The stakes were 0.03 m wide, 0.03 m thick and 1.5 m tall and were vertically positioned on the ground using a mallet (Figure 1). All the GCPs were attached to the stakes ensuring they faced the travel direction of the stereo-camera. The position of each trigger point and GCP centroids was obtained with a Leica TS16 I 5” R1000 (Leica Geosystems AG, Heerbrugg, Switzerland) imaging total station (TS) with 2 mm (+ 2 ppm) accuracy at distances below 500 m [32]. An ancillary high density point cloud (and CR2 uncompressed RGB imagery) was collected using a Leica ScanStation P40 Terrestrial Laser Scanner (TLS) (Leica Geosystems AG, Heerbrugg, Switzerland). The TLS had a 3D position accuracy of 3 mm at 50 m with a range of 1.2 mm +10 ppm over full range [33].
A detailed description of the implementation of SfM is provided in Section 2.3.2. In brief, Photoscan Pro version 1.1.6 (Agisoft LLC, St. Petersburg, Russia) was used to obtain a point cloud via SfM from the imagery collected. The coordinates of the GCPs were used for translation, rotation and scaling purposes. The co-registration error was automatically derived from Photoscan Agisoft for x, y and z as follows:
R M S E = j = 1 N [ ( x j ^ x j ) 2 + ( y j ^ y j ) 2 + ( z j ^ z j ) 2 ] N
where RMSE is the Root Mean Square Error; x ^ , y ^ and z ^ are the image derived coordinates at location j; x, y and z are the associated GPS positions of the GCPs; and N is the total number of GCPs.
A set of hydromorphological measures (Table 1) were derived from the resulting point cloud. Details on the methodology used to estimate these hydromorphological measures are provided in Section 2.3.3.
The optimal stereo-camera setting was determined by the field of view of the imagery captured and the accuracy of the point cloud. Here, accuracy was defined by: (i) the root mean square error (RMSE) of distance measurements of the SfM point cloud with respect to the TLS point cloud; and (ii) the discrepancy (i.e., error) in hydromorphological measure estimation with respect to the measures obtained from the TLS point cloud. Details on the methodology used to estimate the RMSE are provided in Section 2.3.4.

2.3. SfM Framework Development

2.3.1. Data Collection

A set of stereo-images were collected along each of the three 40 m long reaches (i.e., Chicheley Brook, River Ouzel and River Great Ouse) (Figure 4) using the optimal stereo-camera setting identified as described in Section 2.2. Data collection was carried out in both the upstream and downstream directions to maximise spatial coverage. The cameras were triggered every 25 cm simulating the image capture frequency of an autonomous boat as proposed in [10,11]. At each reach, a total of 24 GCPs were distributed along the banks and within the river channel (Figure 1) based on [15,34] and following the methodology described in Section 2.2. Six GPCs were placed every 10 m to ensure a representative number of GCPs (i.e., at least six) were present within each frame. The centroids of all GCPs were measured with a Leica TS16 I 5” R1000 imaging TS (Leica Geosystems AG, Heerbrugg, Switzerland).
A high resolution, dense point cloud and associated CR2 uncompressed RGB imagery were collected along each of the 40 m reaches using a Leica ScanStation P40 TLS (Leica Geosystems AG, Heerbrugg, Switzerland). This required the deployment of multiple (up to six) TLS base stations, maximising spatial coverage and ensuring full coverage of channel, banks and riparian environments. The TLS data set was considered to be the ground truth following the methodology described by [8,16,35,36].

2.3.2. Structure from Motion

The initial step in the SfM workflow was the inspection of the acquired imagery (Figure 5). Although SfM is designed to work with images of variable quality, the resulting SfM derived geomatic products may suffer high errors as a result [37]. The stereo-imagery collected was therefore visually inspected for any images with blurring, sun flare or obstructions in front of the camera. The selected imagery was then processed using Photoscan Pro version 1.1.6 (Agisoft LLC, St. Petersburg, Russia). The software uses a modified version of the Scale-Invariant Feature Transform (SIFT) algorithm [38] to locate features within the images and is capable of producing both sparse and dense point clouds. The workflow (Figure 5) includes image alignment, feature matching, sparse reconstruction, dense reconstruction and geo-referencing. The parameters selected to run the process were “highest” accuracy with a key point limit of 100,000 and tie point limit of 6000 for the “align photo” step and “high” quality and “aggressive” depth filtering for the “build dense cloud step”. Most of these tasks are automated within the software, needing minimal input from the user. The coordinates of the GCPs were used to geo-reference (scale, translate and rotate) the imagery.

2.3.3. Hydromorphological Measure Estimation

A set of measures used in well-established hydromorphological characterisation methods [21] were estimated from the TLS and the SfM point clouds in CloudCompare v2.6.1 (GPL Software) (Table 1 and Figure 6). Prior to estimating the measures, point cloud outliers derived from imagery artefacts were identified and excluded from the analysis via the “statistical outlier removal” option in CloudCompare v2.6.1 (GPL Software).
The WS was estimated using a semi-automatic approach as the area within the wetted perimeter polygon. The polygon was defined by: (i) the extruded plane that included selected key points falling in water areas; and (ii) its intersection with the banks. A polygon containing the resulting WS was generated in CloudCompare v2.6.1 (GPL Software) using a varied range of tools available within the software (i.e., “point list picking”, “fit plane”, “cross-section” and “extract cloud sections along polylines”). The central line was automatically determined using an in-house Python script that was based on the methodology proposed in [39,40] and a combination of suitable line simplification (i.e., Ramer–Douglas–Pencker [41]) and line smoothing (i.e., iterative averaging [42]) algorithms. The Douglas–Peucker method [41] aims to simplify line segments via iterative point removal. The start and end points of a target line are always untouched. The method divides the line into vertices which have the largest perpendicular distance to the straight line defined by the start and end points of the target line. This happens iteratively for the whole segment until the distance is smaller than a user defined threshold. The points with distances below the threshold are then removed. The iterative averaging algorithm [42] smooths the resulting simplified line. First, a triangle is defined from three points of the line segment. The second point in the triangle is consequently shifted by averaging all points in the triangle. This process is repeated for a certain number of iterations specified by the user.
WW measurements were obtained at equally spaced cross-sections that were perpendicular to the central line. The cross-sections were distributed at 50 cm intervals for the 40 m reach study sites and 10 cm intervals for the stereo-camera calibration study. Visual inspection was required to exclude poor quality cross-sections where due to the configuration of the point cloud, a representative estimation of the cross-section could not be obtained (e.g., incomplete point cloud edge).
A Python script was developed to estimate the BH for any given cross-section and bank as the difference in elevation between the water edge defined by the wetted water polygon and the point at which the river spills water into the floodplain [5] (Table 1 and Figure 6). The effect of image artefacts was reduced through the estimation of BH for a 20 cm buffer strip centred on the highest bank point. Height measurements were taken at each point within the cloud falling within the buffer area and placed along the cross-section line. The average height of all the measurements within the buffer area was calculated and considered to be the BH.
BS for the left (LBS) and the right (RBS) banks for each cross-section was estimated via trigonometry using the BH and the edge of the wetted perimeter as key reference points for the calculations. BW was estimated based on the lowest BH, the projection of that point to the opposite bank and the direct estimation of the resulting distance. A Python script was developed for both BH and BW estimations. Cross-sections for which the hydromorphological measures could not be estimated due to the configuration of the point cloud were excluded from the calculations.

2.3.4. Validation

The accuracy of the SfM approach was estimated through cloud to cloud comparison of the TLS and SfM point clouds, using the M3C2 algorithm developed by Lague et al. [43] and implemented in CloudCompare v2.6.1 (GPL Software). In brief, the M3C2 algorithm calculated the difference between two clouds by first estimating the local normal for each point of a reference cloud. Then a local cylinder was projected onto the compared cloud in the direction of the normal. The position of all the points within the cylinder were obtained and averaged; the distance between the two clouds was estimated as the difference of the averaged values [43]. The roughness (i.e., the standard deviation of point distances) was calculated for both clouds as a distribution of points along the normal and used to produce local confidence intervals of point to point comparisons. Here, we estimated the difference between the two clouds and reported the resulting RMSE of distance measurements. An additional three parameters (local surface standard deviation, distance and relative precision ratio) providing relative measures of accuracy were also estimated as described in [44]. The frequency distribution of the individual distances was also characterised. The accuracy in hydromorphological measures estimation was determined as the difference between the SfM derived measures with respect to the TLS values.
The M3C2 algorithm required two initial user determined parameters (i.e., projection scale d and maximal depth m) for the estimation of the difference between the two clouds and the roughness. The projection scale (d) determined the diameter of the projected cylinder. Higher d values resulted in a larger set of points being included into the distance calculations. In this study, the value of d (d = 0.03) was selected based on recommendations from previous authors [43] suggesting that d should be a factor of the point cloud density. The maximal depth (m) corresponded with the cylinder height and was imposed to speed up the calculations. There were no set recommendations for m and as a result, the software default value of m = 0.9 was adopted.

3. Results

3.1. Stereo-Camera Calibration

Table 5 summarises the precision in path replicability along each reach for the stereo-camera height settings considered. The average deviation along the path did not exceed 7.6 cm in the x axis and 2.4 cm in the y axis at any site. The maximum absolute deviations for both sites were between 4.2 cm and 13.7 cm for x and 5.8 cm and 21.1 cm for y. The resulting co-registration errors (Table 6) never exceeded 1.6 cm in any direction, except for the x direction under the stereo-camera height setting of 0.6 m which was 29 cm.
The resulting SfM point clouds had differing configurations within and between study sites (Figure 7 and Figure 8). Results for the Chicheley Brook showed that the number of points in the cloud gradually decreased as the stereo-camera height increased, with a difference of 5.3 million points between the cloud obtained at a height of 1.6 m and that obtained at 0.5 m. For the River Ouzel, the number of points in the cloud increased as the stereo-camera height increased; a change in stereo-camera height from 0.5 m to 1.6 m resulted in an extra 8.4 million points in the cloud. The point clouds for the Chicheley Brook and the River Ouzel were approximately the same for a stereo-camera height setting of 1 m, with the discrepancy in point cloud size between the two reaches decreasing from that point onwards (Figure 8). The RMSE of distance measurements between clouds ranged between 5.0 cm and 5.8 cm for the Chicheley Brook and 9.6 cm and 24.2 cm for the River Ouzel, with the error remaining approximately constant (Chicheley Brook) or increasing (Ouzel) with stereo-camera height (Figure 8).
The stereo-setting also had an impact on the configuration of the estimated WS (Figure 8 and Figure 9); an increase in stereo-camera height from 0.5 m to 1.6 m resulted in a decrease of WS from 15.01 m2 to 10.86 m2 for the Chicheley Brook and an increase from 36.6 m2 to 75.88 m2 for the River Ouzel (Figure 9). The configuration of the WS polygon became more discontinuous as the stereo-camera height increased at the Chicheley Brook, whereas the opposite pattern was observed at the River Ouzel.
The mean error for the estimation of WW with respect to the TLS cloud increased from 32 cm to 81 cm at the Chicheley Brook site and decreases from 3.42 m to 1.34 m for the River Ouzel as the height of the stereo-camera was adjusted from its minimum to its maximum (Figure 8). The reported differences translate into 18% and 44% discrepancy in cross-section WW estimation when considering an average WW for the Chicheley Brook of 1.82 m (Table 2). Similarly, for the River Ouzel, the reported discrepancy translates into 46% and 18% of the average 7.36 m WW (Table 2). The discrepancies in mean error between both sites became less apparent for stereo-camera settings above 1 m. The results for the Chicheley Brook also showed that for stereo-camera height settings ≤ 1 m the error in WW estimation was always below 40 cm, whereas it was always above 80 cm for height settings above or equal to 1.2 m. The Standard Error (SE) remained approximately constant within each site.
For both the Chicheley Brook and the River Ouzel, the mean error and SE results for the estimation of LBH and RBH did not vary significantly between stereo-camera height settings. For the Chicheley Brook, the mean error in LBH estimation varied between 2.52 m and 2.75 m, whereas, for the RBH, the error was between 0.16 m and 0.43 m. These values represent between 84% and 92% of the 2.99 m estimated average LBH and between 8.6% and 23% of the 1.86 m estimated RBH (Table 1). For the River Ouzel, the mean error in LBH estimation varied between 4.85 m and 5.49 m, whereas the values for the RHB were between 3.33 m and 3.68 m. For the River Ouzel, the discrepancies reported represented between 80% and 91% of the average LBH (6.01 m) and between 82% and 90% of the average RBH (4.05 m) (Table 1).
The mean error when estimating BS for the Chicheley Brook ranged from 28.14° to 41.61° for LBS and from 6.94° to 9.74° for RBS. Based on the average slope cross-section values reported for the reach (Table 1), the discrepancies reported oscillated between 52% and 77% for the LBS where the average slope was 53.8° and between 9% and 13% for the RBS, where the average slope was 74.7° (Table 1). Similarly, for the River Ouzel, the values varied between 27.07° and 36.96° for LBS and between 12.74° and 30.08° for RBS. The corresponding percentages with respect to the average cross section value (Table 1) oscillate within 64–88% for the LBS, with an average LBS of 41.9°, and within 31–77% for the RBS, with an average RBS along the reach of 40.5°. The mean error and SE for both sites remain approximately constant within each site.
For the Chicheley Brook, the mean error in the estimation of the BW ranged from 0.25 m to 1.95 m between stereo-camera height settings and increased as the height setting increased. Stereo-camera height settings above 0.8 m resulted in the largest mean errors. The variations in the mean BW error estimations were not so significant at the River Ouzel site, where the error ranged between 6.37 m and 7.41 m. With respect to the average BW, the reported discrepancies ranged between 5% and 44% for the Chicheley Brook where the average BW is 4.5 m, and between 54% and 63% for the River Ouzel, with an average BW of 11.83 m (Table 1).
Based on the results obtained, a stereo-camera height of 1 m was considered appropriate for further data collection within the context of the proposed study. The selected stereo-camera height was a compromise to satisfy the best performance patterns observed in the calibration study.

3.2. Hydromorphological Measure Estimation

The co-registration errors for the 3D SfM model of the riverine environment for each of the 40 m study sites varied between 0.5 cm and 2.0 cm for the Chicheley Brook, between 4.0 cm and 5.6 cm for the River Ouzel and between 0.3 cm and 8.6 cm for the River Great Ouse (Table 7). Lower co-registration errors are encountered in y and z directions, where the values do not exceed 3.3 cm in y and 1.2 cm in z in any of the study sites. The size of the SfM derived point clouds differs between study sites, with the Chicheley Brook presenting the larger point cloud and the River Great Ouse the smallest (Table 8 and Figure 10). The RMSE of distance measurements of the SfM point cloud with respect to the TLS point cloud did not exceed 19 cm, with the River Great Ouse presenting the largest RMSE of distance measurements (Table 8). For the specific case of the River Ouzel, where hard structures (i.e., bridge) were present, the RMSE of distance measurements obtained for the points falling within the stable structure was below 7 cm.
The SfM estimated WS approximated to the values obtained for the TLS point cloud, with the WS value for the River Ouzel presenting the largest discrepancies (89 m2) and the Chicheley Brook the smallest (2 m2) (Table 1 and Table 8). The mean error for the estimation of the hydromorphological measures with respect to the TLS cloud varied with the measure and the study site. For all measures, the largest error was observed for the River Ouzel. For the Chicheley Brook, larger errors than in the Great Ouse were observed for the estimation of LBH, RBH, RBS. Whereas the mean errors at the River Great Ouse exceed those obtained for the Chicheley Brook for WW, LBS and BW.
The discrepancy between measures obtained via the SfM and TLS methods can also be expressed as a percentage with respect to the characteristics of each cross-section (Table 9); the results for the Great Ouse show the best performance for all the hydromorphological measures considered, with the average discrepancies not exceeding 8% for WW and BH, 16% for BW and 35% for BS. The worst performance was observed for the River Ouzel for all measures, except for WW (24%) and RBS (15%) where the Chicheley Brook showed the lowest performance.

4. Discussion

This paper aimed to develop a SfM based framework for the semi-automatic quantification of hydromorphological measures from 3D models of river environments using in-channel based imagery. This was achieved through three sequential objectives: (1) to determine the optimal stereo-camera height setting for in-channel imagery collection; (2) to estimate key hydromorphological measures from a 3D model for a range of river environments; and (3) to assess the accuracy of the framework developed in Objectives (1) and (2).
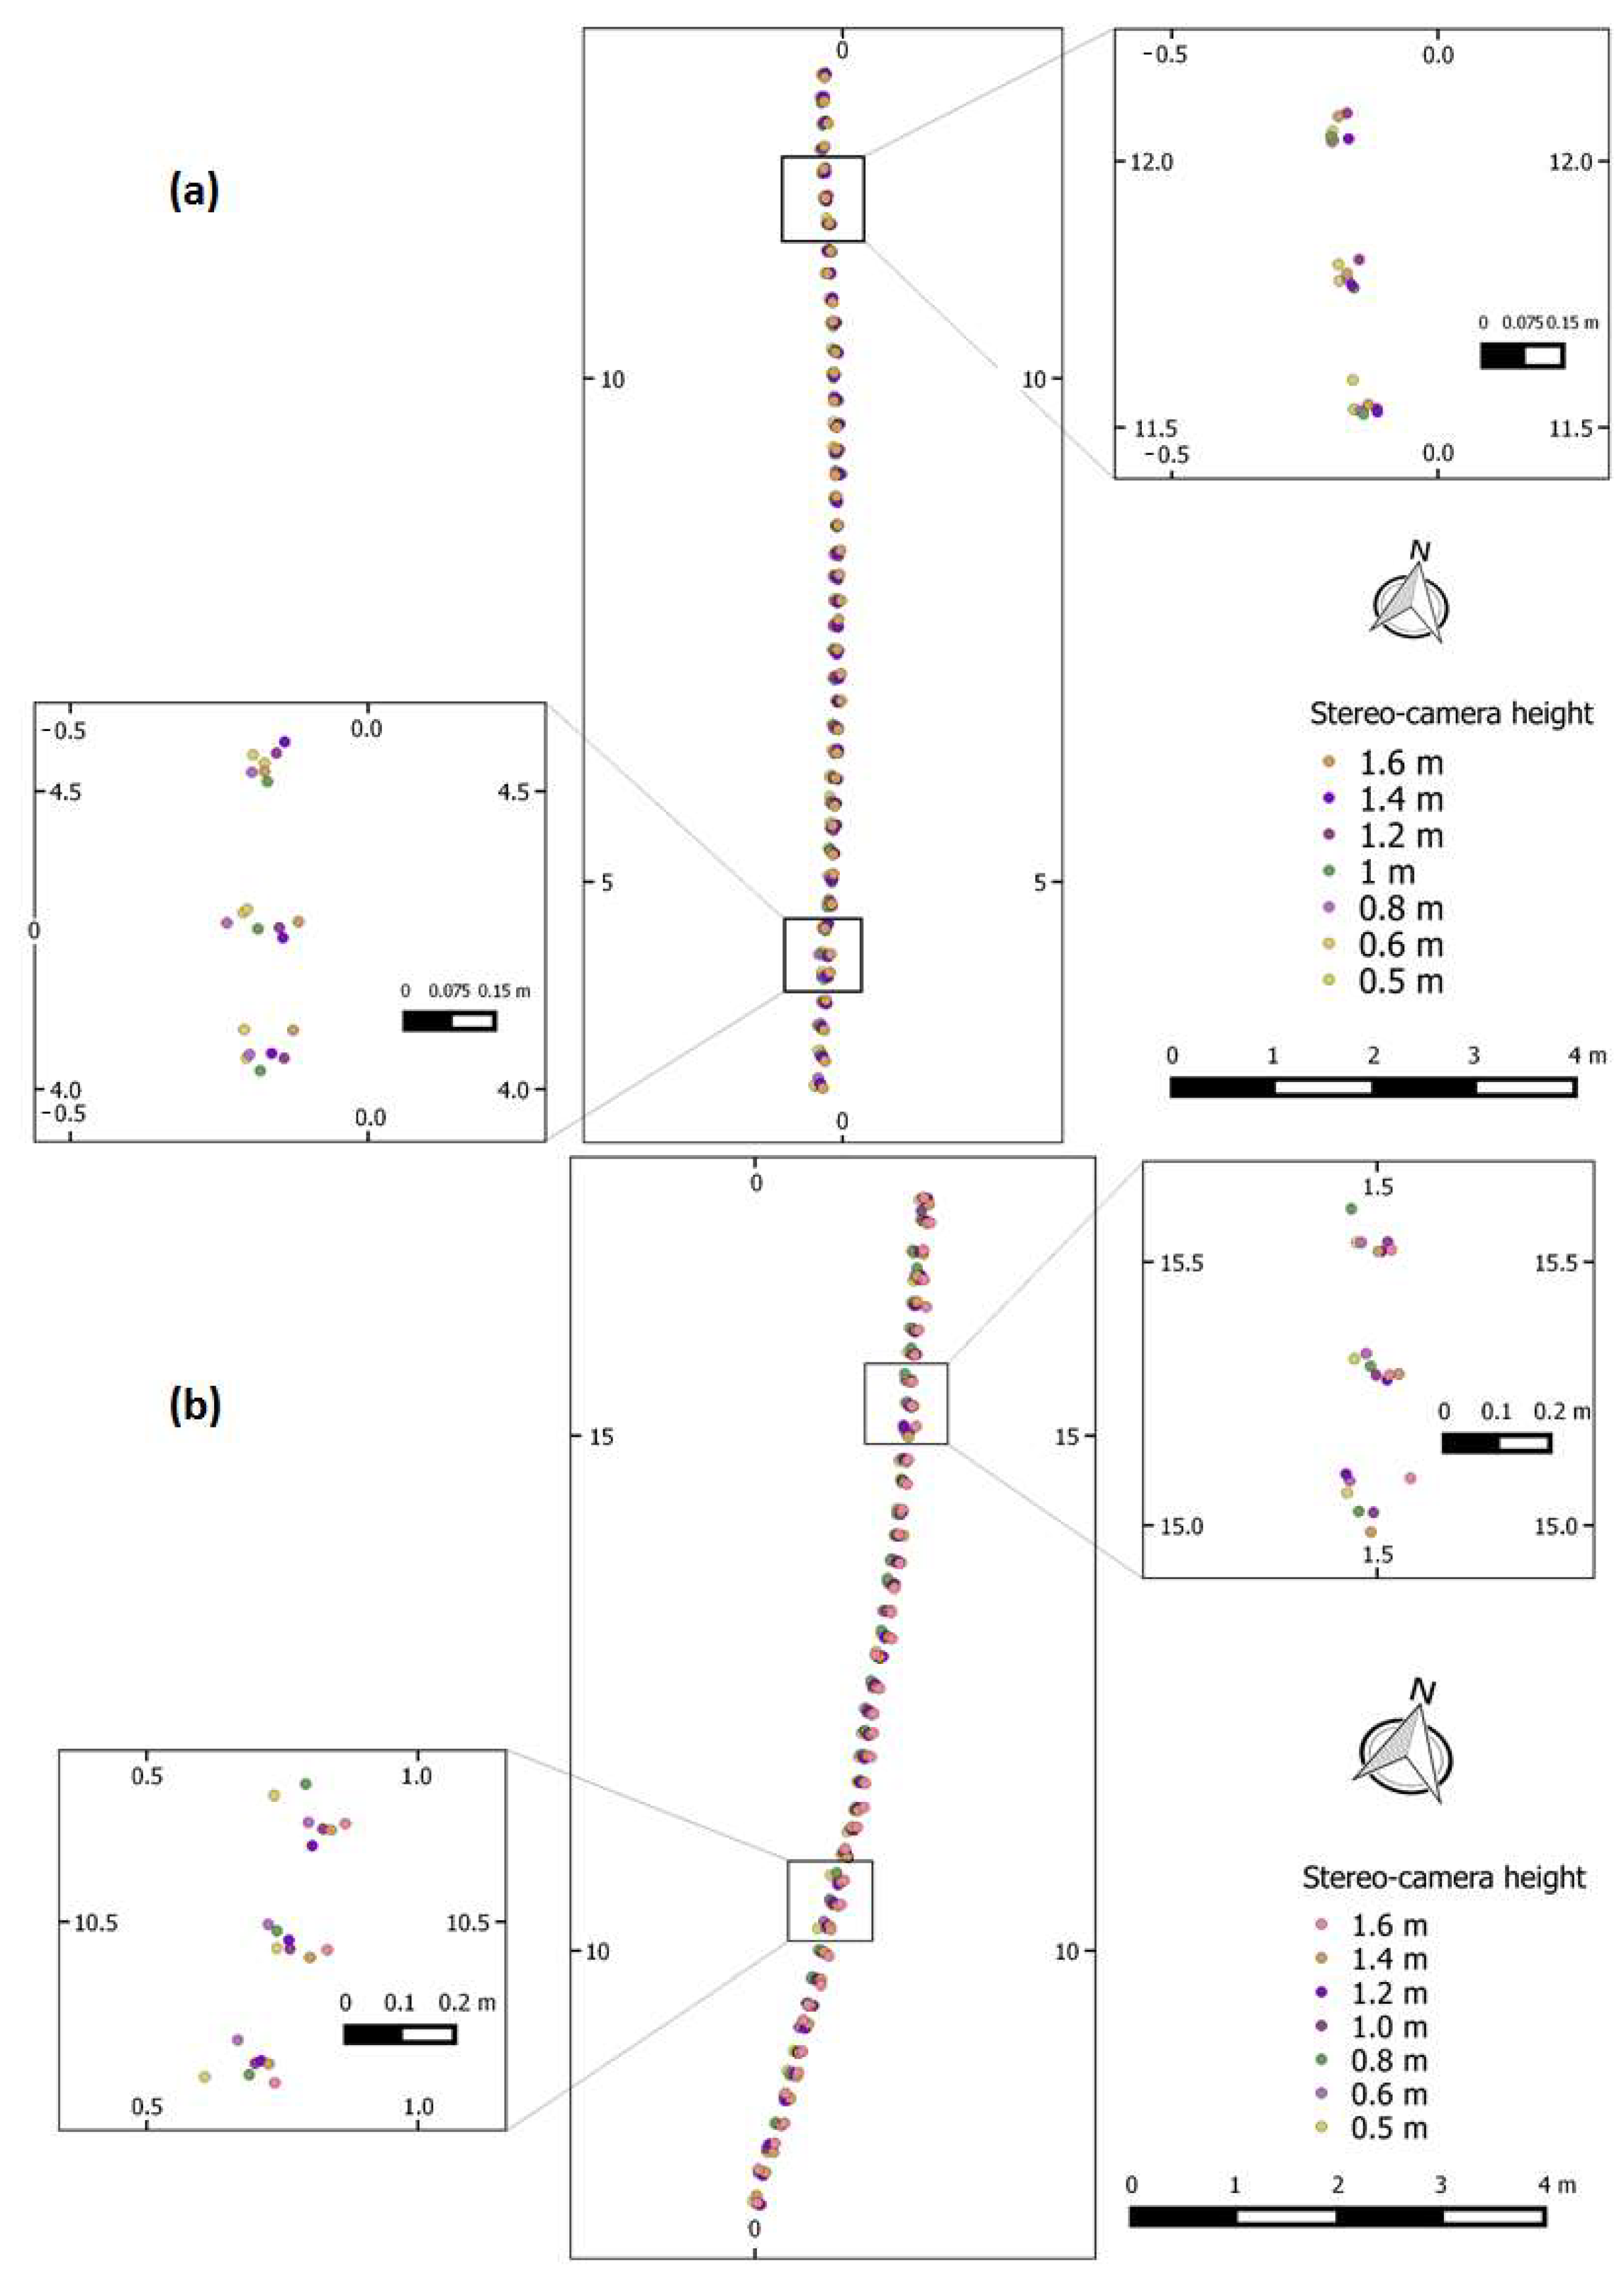
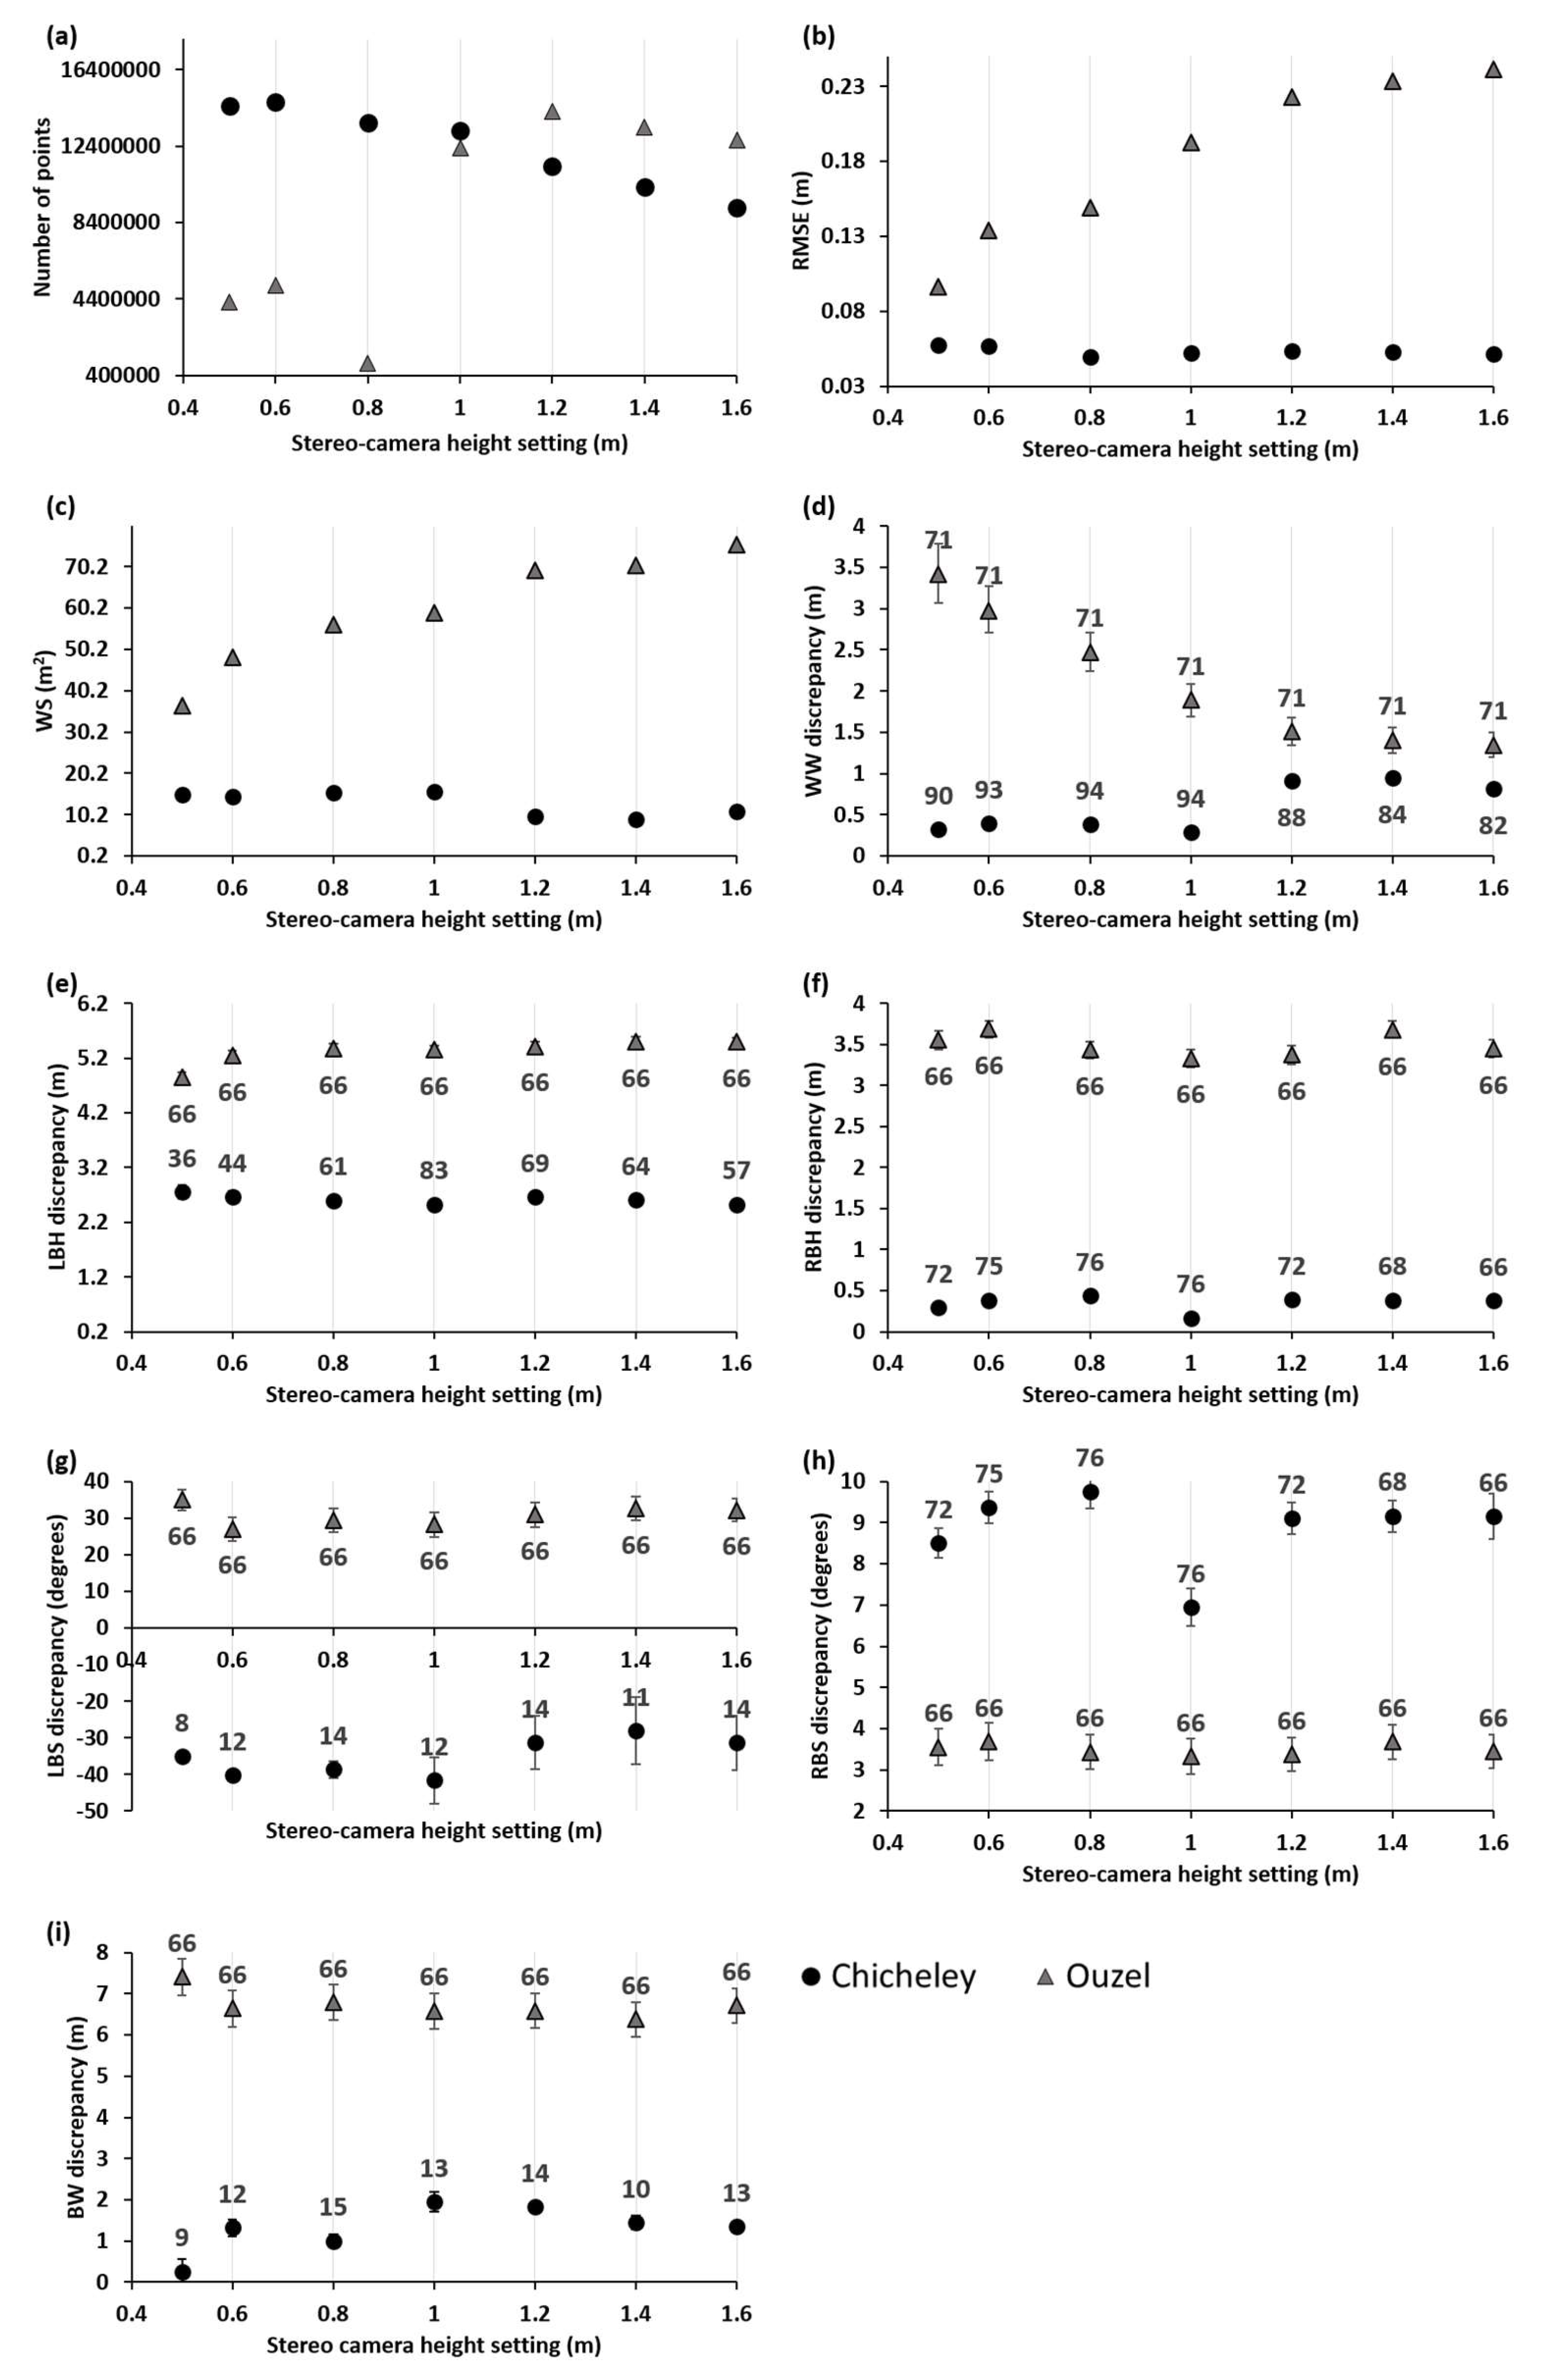
With respect to Objective (1), the stereo-camera height setting had an effect on the SfM-3D models produced of the river environment. This is due to the configuration of the point cloud obtained for each camera height setting and how this transferred to the estimation of the hydromorphological measures. Overall, the RMSE of distance measurements between the SfM and the TLS point clouds were less than 24.2 cm for stereo-camera height settings along the two reaches considered (i.e., Chicheley Brook and River Ouzel), with the RMSE for the rigid structures (i.e., bridge) along the River Ouzel presenting RMSEs below 7 cm. The RMSE values were greater than the 6 mm over 50 m reported in [43] for the comparison of two point clouds obtained with a repeated TLS survey along a rapidly meandering eroding bedrock river (Rangitikei river canyon, New Zealand). In [43], the reach under study was 50–70 m wide and the reported RMSE of distance measurements insignificant within the context of the river scale, whereas the RMSE reported in our study is larger and more significant when compared to the scale of the reaches sampled. However, as opposed to [43], the values in our study are the result of comparing two very distinct methods (SfM and TLS) to obtain dense point clouds. Within this context, the performance here obtained exceeds that reported by [35] for the 3D SfM modelling of two contiguous reaches (1.6 km and 1.7 km, with a braiding width of 500–800 m) (Ahuriri River, New Zealand) using SfM and a 10,622 RTK-GPS GCP ground truth derived point clouds.
The RMSE results obtained for the Chicheley Brook and the River Ouzel are encouraging. In [35], RMSE of 17 cm for bare ground and 78 cm for vegetated areas were reported, with an overall RMSE of 23 cm for all the areas combined. In our study, unlike in [35], additional sources of bias were present, namely: (i) data were collected when the vegetation was growing and present; (ii) oblique imagery was used as opposed to near vertical aerial photography; and (ii) the SfM point cloud was neither decimated nor corrected for vegetation presence. Without the data pre-processing methodology proposed by [35], the reported RMSE of distance measurements between clouds in their study were 2.41 m. Removal of the vegetated and undesirable mapped areas from the point cloud in [35] resulted in RMSEs of 20 cm. These values were similar to the maximum RMSE registered in our study. Without removing any vegetation linked artefacts.
It has to be noted that the RMSE of distance measurements registered also depends upon the number and location of GCPs used for the georegistration process. For example, in [45], the effect of the location of GCPs has in georeferencing within the photogrammetric process was investigated, with results showing that best performance was achieved when the GCPs were evenly distributed within the study area. The effect of GCPs on georeferencing was also investigated by [46,47] with results recommending stratified distribution of GCPs. The effect that the number of GCPs has on the implementation of SfM on aerial photography was investigated in [48] for an area of 420 m × 420 m, with improvements in accuracy considered to be minimal when more than 15 GCPs were used. In [45], the accuracy in the photogrammetric process was found to systematically increase with the number of GCPs up to a maximum of 27 GCPs. The framework presented in this paper has used a stratified random approach to GCPs distribution for a pre-determined number of GCPs, with a total of six GCPs placed along every 10 m of the selected reaches. Further work should be carried out to assess the effect that differing number and location of GCPs has on the overall RMSE.
The impact of the RMSE on the hydromorphological measures depended on the measure selected and the characteristics of the reach. For example, the stereo-camera setting was of particular importance for the estimation of WS and WW; on the River Ouzel, the measured WS increased from 36.6 m2 to 75.88 m2 (39.2 m2) when using the minimum stereo-camera setting of 0.5 m compared with the maximum setting of 1.6 m, whereas, for the Chicheley Brook, the WS decreased from 15.01 m2 to 10.86 m2 (4.15 m2). Similarly, the mapped WS became more discontinuous and asymmetric as the stereo-camera height increased. Increasing the stereo-camera height resulted in an additional 49 cm (from 32 cm to 81 cm) of error in WW estimation on the Chicheley Brook and a decrease of 2.08 m (from 3.42 m to 1.34 m) in error on the River Ouzel. For both sites, stereo-camera settings of approximately 1 m provided the best compromise for the estimation of the various hydromorphological measures whilst providing an angle of view slightly above that of existing river boat prototypes [49]. The hydromorphological configuration of the River Ouzel, with a wider mean WW (≈8 m) and more gently sloping banks than the Chicheley Brook (≈2 m), was better captured with stereo-camera settings of greater than 1 m whereas the Chicheley Brook was better characterised with camera at or below 1 m. These findings indicate that ideally, the stereo-camera height should be optimised on-site based on the characteristics of the reach. However, it has to be noted that the practicality of using camera heights greater than 1 m may be challenging on a boat. The effect of platform yaw, pitch and roll could impact the quality of the imagery, the field of view could be easily obstructed by overarching branches and greater likelihood of the cameras getting tangled with vegetation. However, with low height stereo-camera settings (e.g., 0.5 m), the lenses are more likely to be affected by water splash and lens obstruction arising from the boat navigation equipment. Potential solutions to overcome these problems could include the use of highly stable gimbals and the development of algorithms for obstacle avoidance during autonomous navigation.
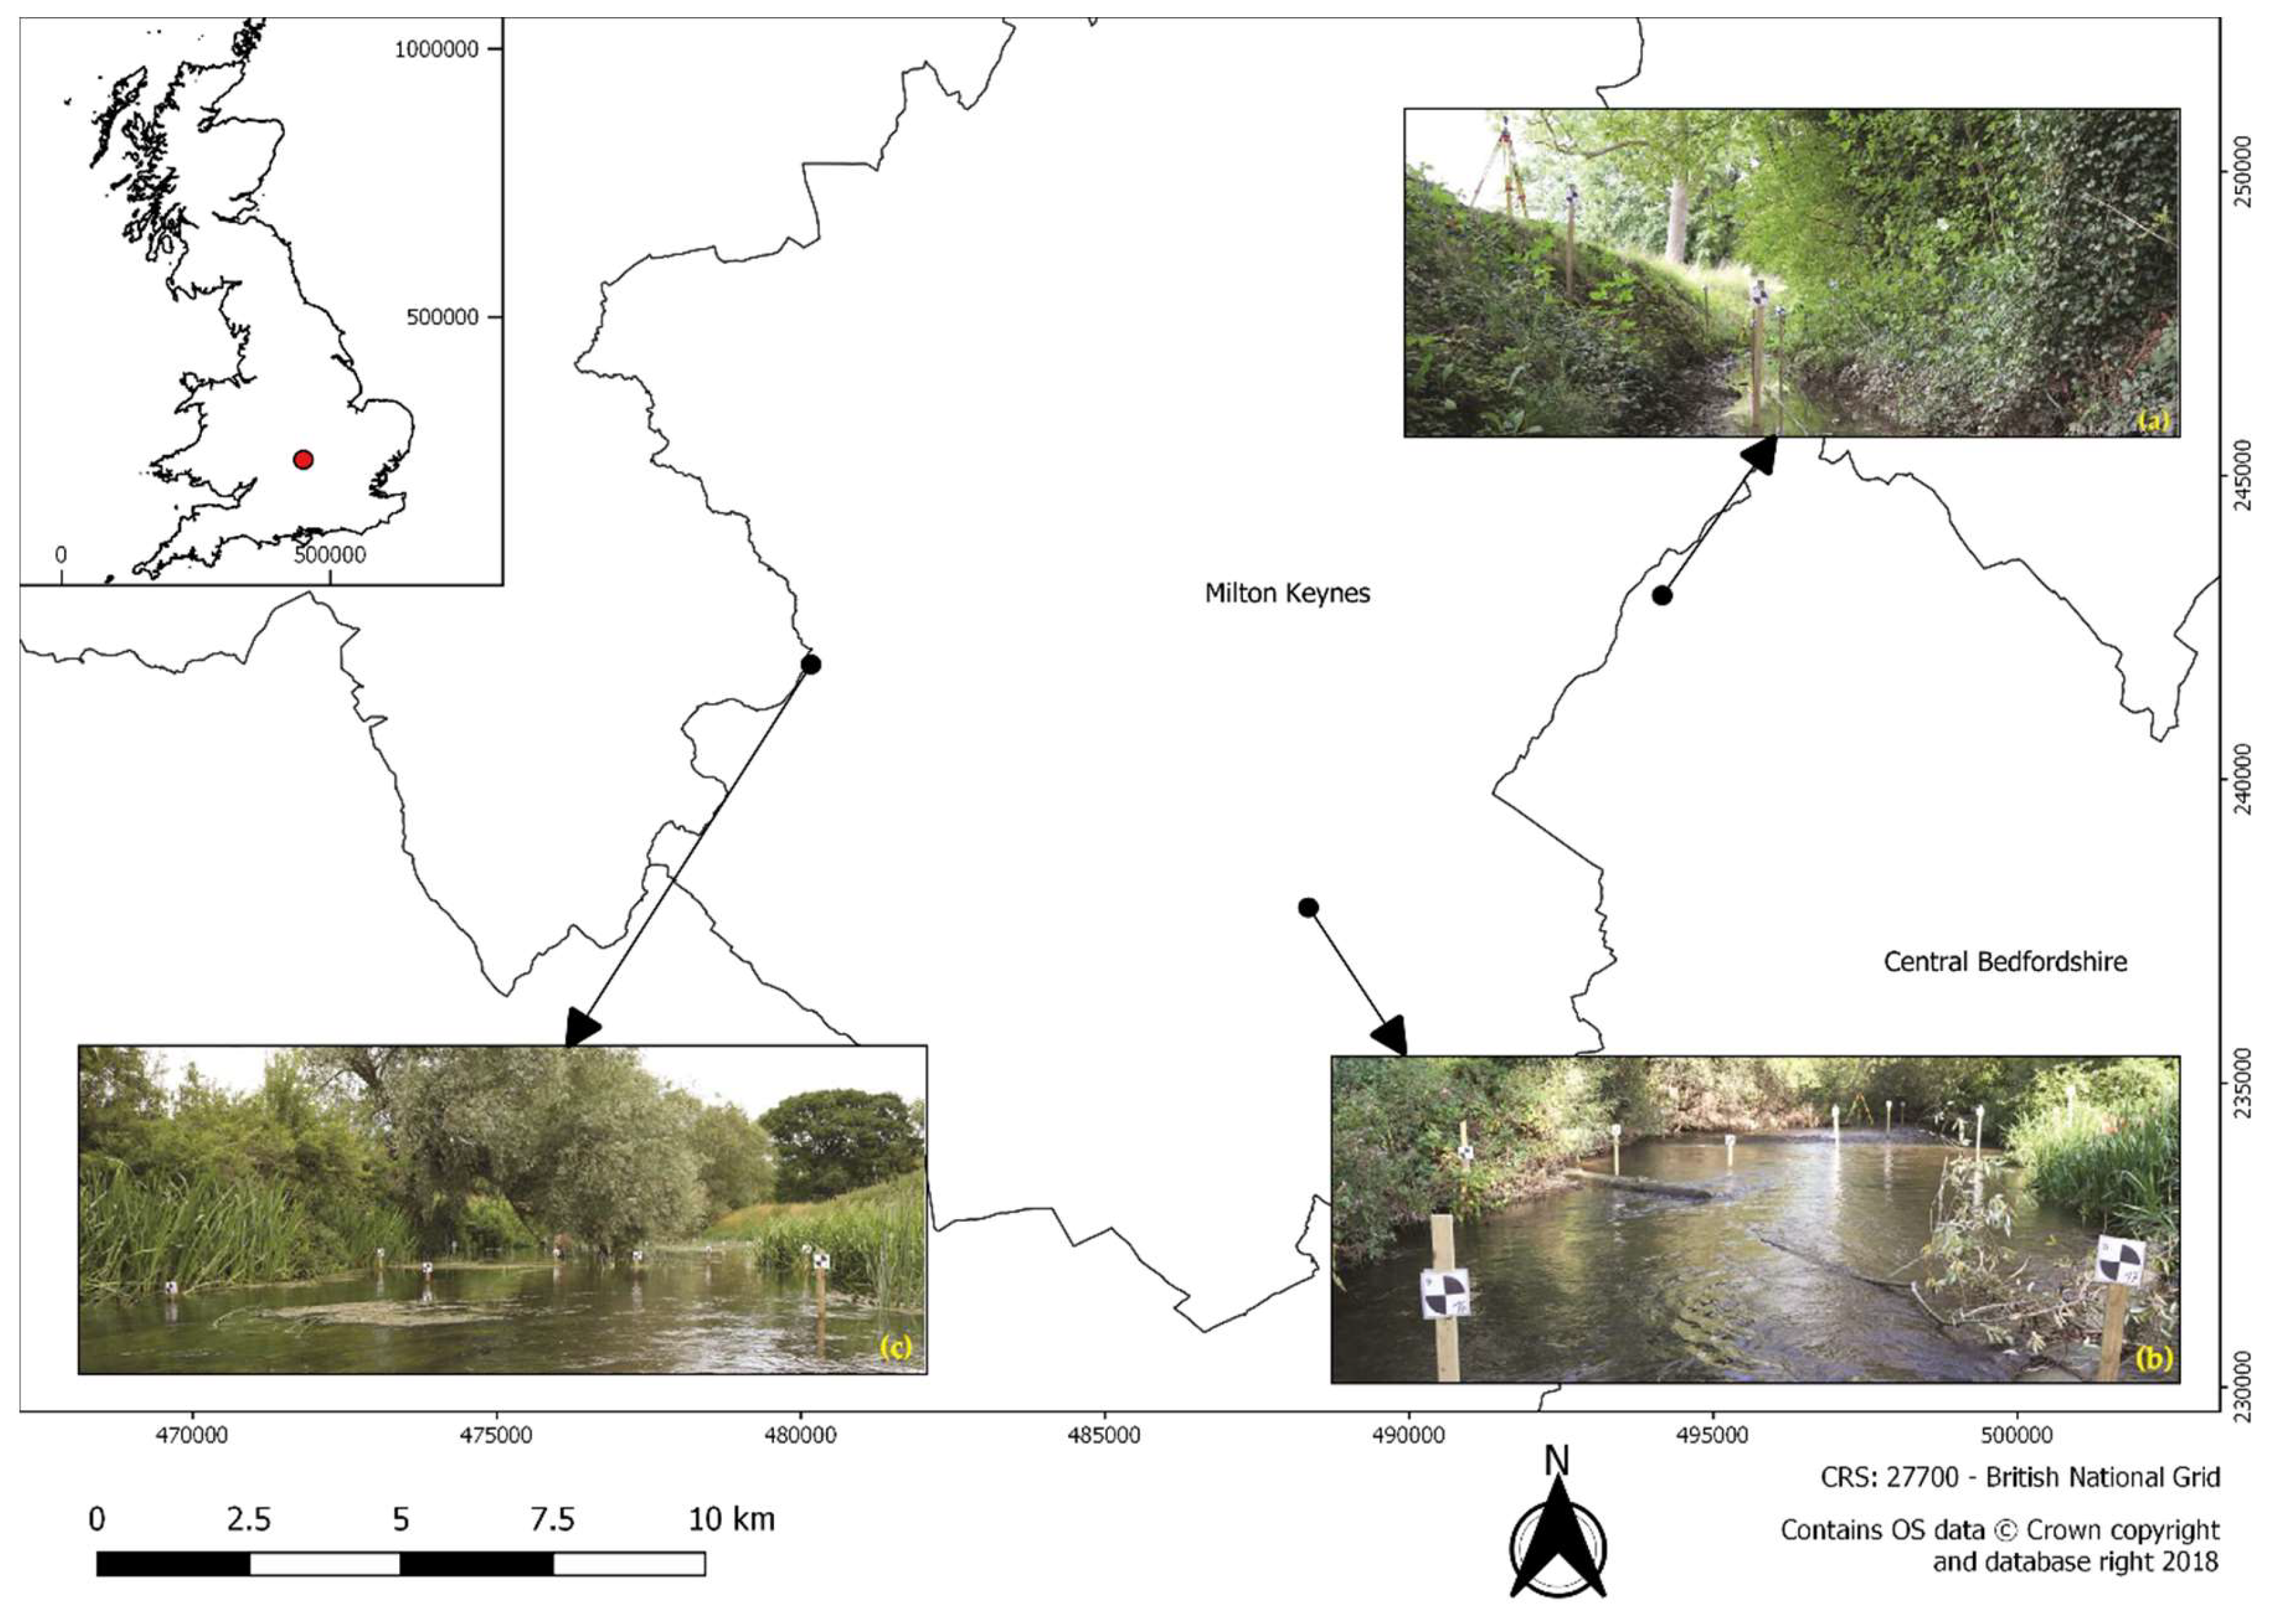
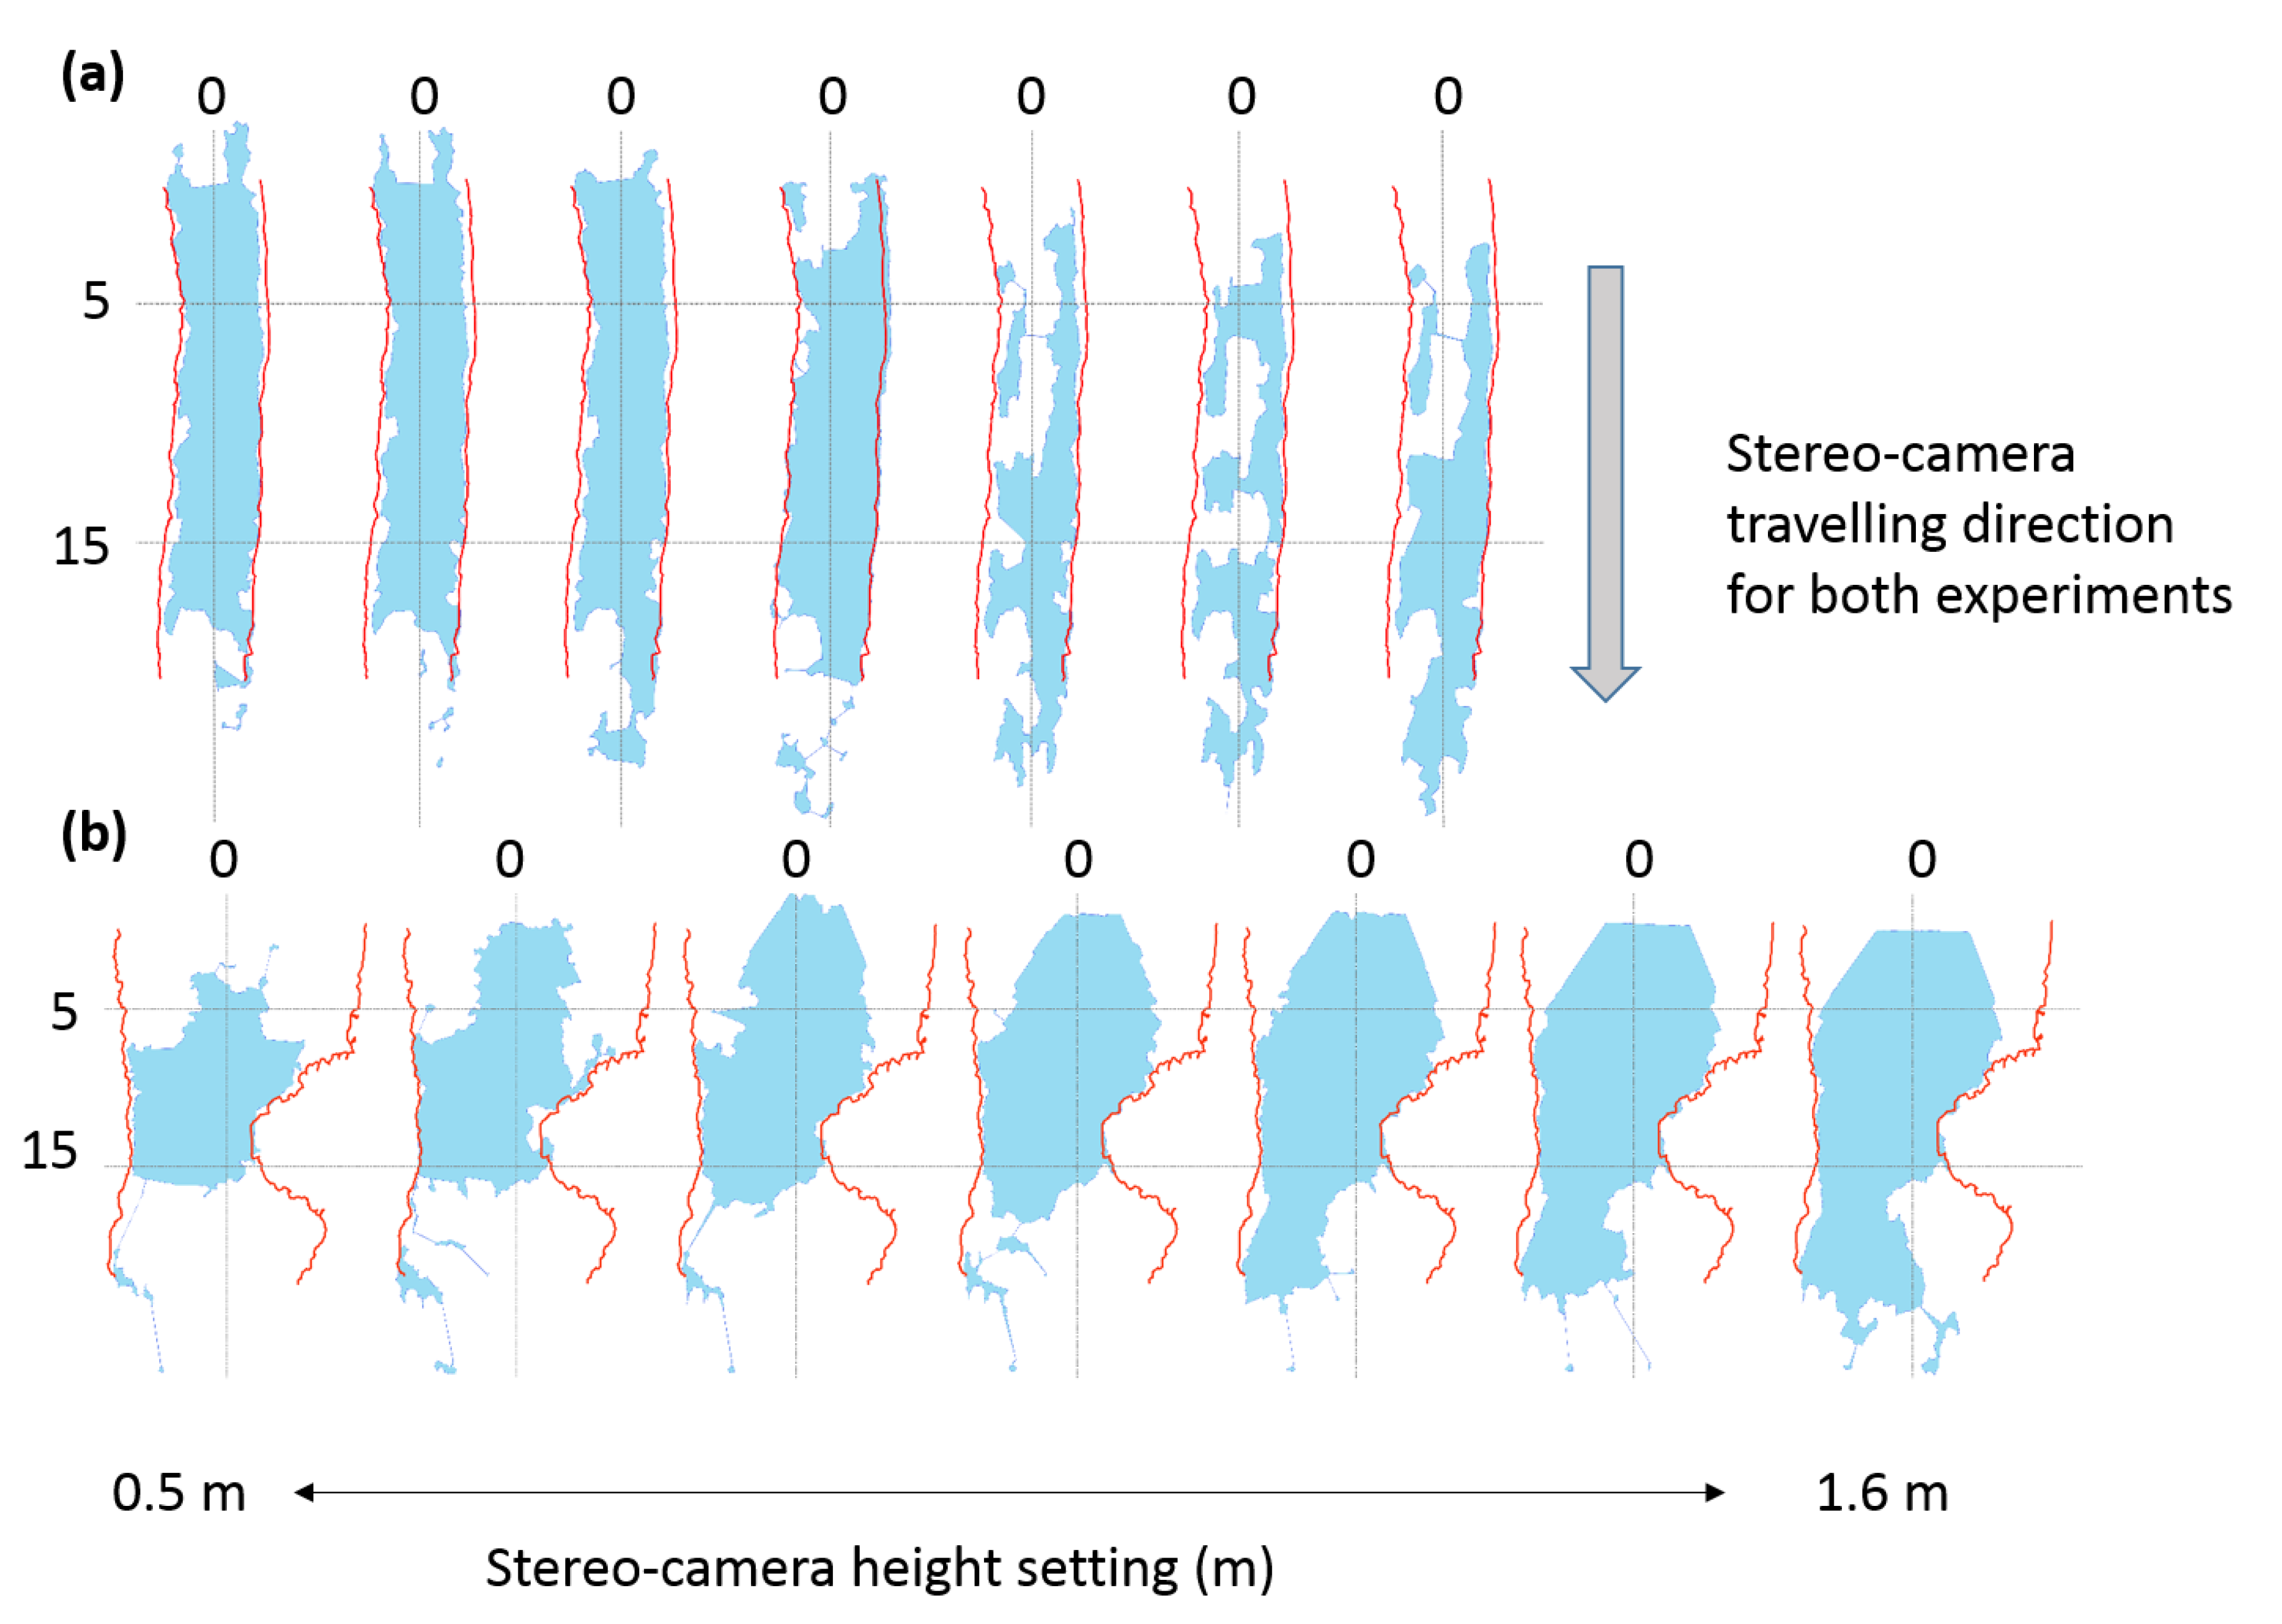
With respect to Objectived (2) and (3), the configuration of the river also had an impact on the estimation of the hydromorphological variables. Significant differences were observed in the estimation of the variables at all three sites. The largest (absolute) errors were observed at the River Ouzel site. On the River Ouzel, densely vegetated banks, overhanging vegetation, meandering morphology and debris on occasions obstructed the camera field of view (Figure 9 and Figure 10). On the Chicheley Brook and the River Great Ouse, differences were observed depending upon the hydromorphological measure. The steep banks of the Chicheley Brook enabled a more robust estimation of WW and BW whilst the sparse vegetation along the banks of the River Great Ouse provided better estimates of BH and overall BS.
The magnitude of the mean error should be interpreted based on the objective for which the measures are calculated and the dimensions of the overall reach. For example, the proposed framework provides estimates of WW with mean errors not exceeding 1.81 m in any of the study sites. However, on average, the errors represent 67% of the reach width at the Chicheley Brook and less than 6% at the River Great Ouse. Similarly, the mean error for BW estimation did not exceed 3.6 m for the Chicheley Brook (20% of the cross-section bank width) and River Great Ouse (16% of the cross-section bank width), although on the River Ouzel it was 11.15 m (27%) due to site configuration (presence of debris and overhanging vegetation which created additional imagery artefacts). The magnitude of these errors may not be significant for large scale hydrological or flood modelling but may have a substantial impact if the resulting measures are used for the assessment of localised interventions (e.g., river restoration appraisal). Note that in this study, the TLS point cloud and associated hydromorphological measures have been assumed to be the ground truthed through the use of reference points. However, some distortion of the TLS point cloud may occur due to the movement of scene features (e.g., leaves, water, and floating debris) and changes in light conditions during the day which would then have a consequent impact on the estimation of TLS derived hydromorphological measures. The mean error values for each of the estimated measures need to be interpreted with regards to this limitation. Similarly, the movement of scene features and changing light conditions would also have affected the structure of the SfM derived point cloud [35].
For all SfM analysis here presented, the co-registration errors were comparatively small with respect of the overall hydromorphological measures presented. For the calibration study, the error did not exceed 29 cm in any direction, whereas, for the main study, the error was always below 8.6 cm for any of the three 40 m reaches surveyed. It is therefore envisaged that translation, rotation and scaling within the SfM process does not result in significant errors in hydromorphological measure estimation. However, further work should focus on propagation the co-registration error, and additional sources of error such as the number and location of GCPs, through the overall processing work flow to assess the overall impact in performance.
The results presented here are only representative of rivers with similar characteristic to those described. How the proposed framework will perform in other river settings is as yet unknown. Further research should expand the stereo-camera calibration exercise and testing of the proposed framework to other river settings that capture a wider range of river ecosystems. There is also a need to assess the performance of the proposed framework in rivers larger (i.e., wider) to those here considered and determine whether there is a river size operational limit. The quality of long-range reconstruction is dependent on many factors like camera resolution, positions and scene layout. Some authors implemented long-range SfM reconstructions within other research areas such as extraction of terrain information (up to several kilometres). Other authors highlighted that an increase of the distance to matching features (i.e., discrete objects in the scene) had a detrimental effect in the implementation of SfM techniques [50]. It is envisaged that, for large rivers where all matching features are located along the distant banks, the accuracy of the estimated metrics will be lower than that presented in our study. Further work should also investigate the effect that yaw, pitch and roll of boat based systems has on image quality. It is envisaged that imagery captured with stereo-cameras on boats will result in more artefacts (or poorer image quality) than those encountered in this study. The work by Kriechbaumer et al. [49] showed that none of these artefacts affected the implementation of Simultaneous Localisation And Mapping (SLAM) algorithms for autonomous navigation. Similar results are therefore expected in the use of the algorithms tested in this paper.
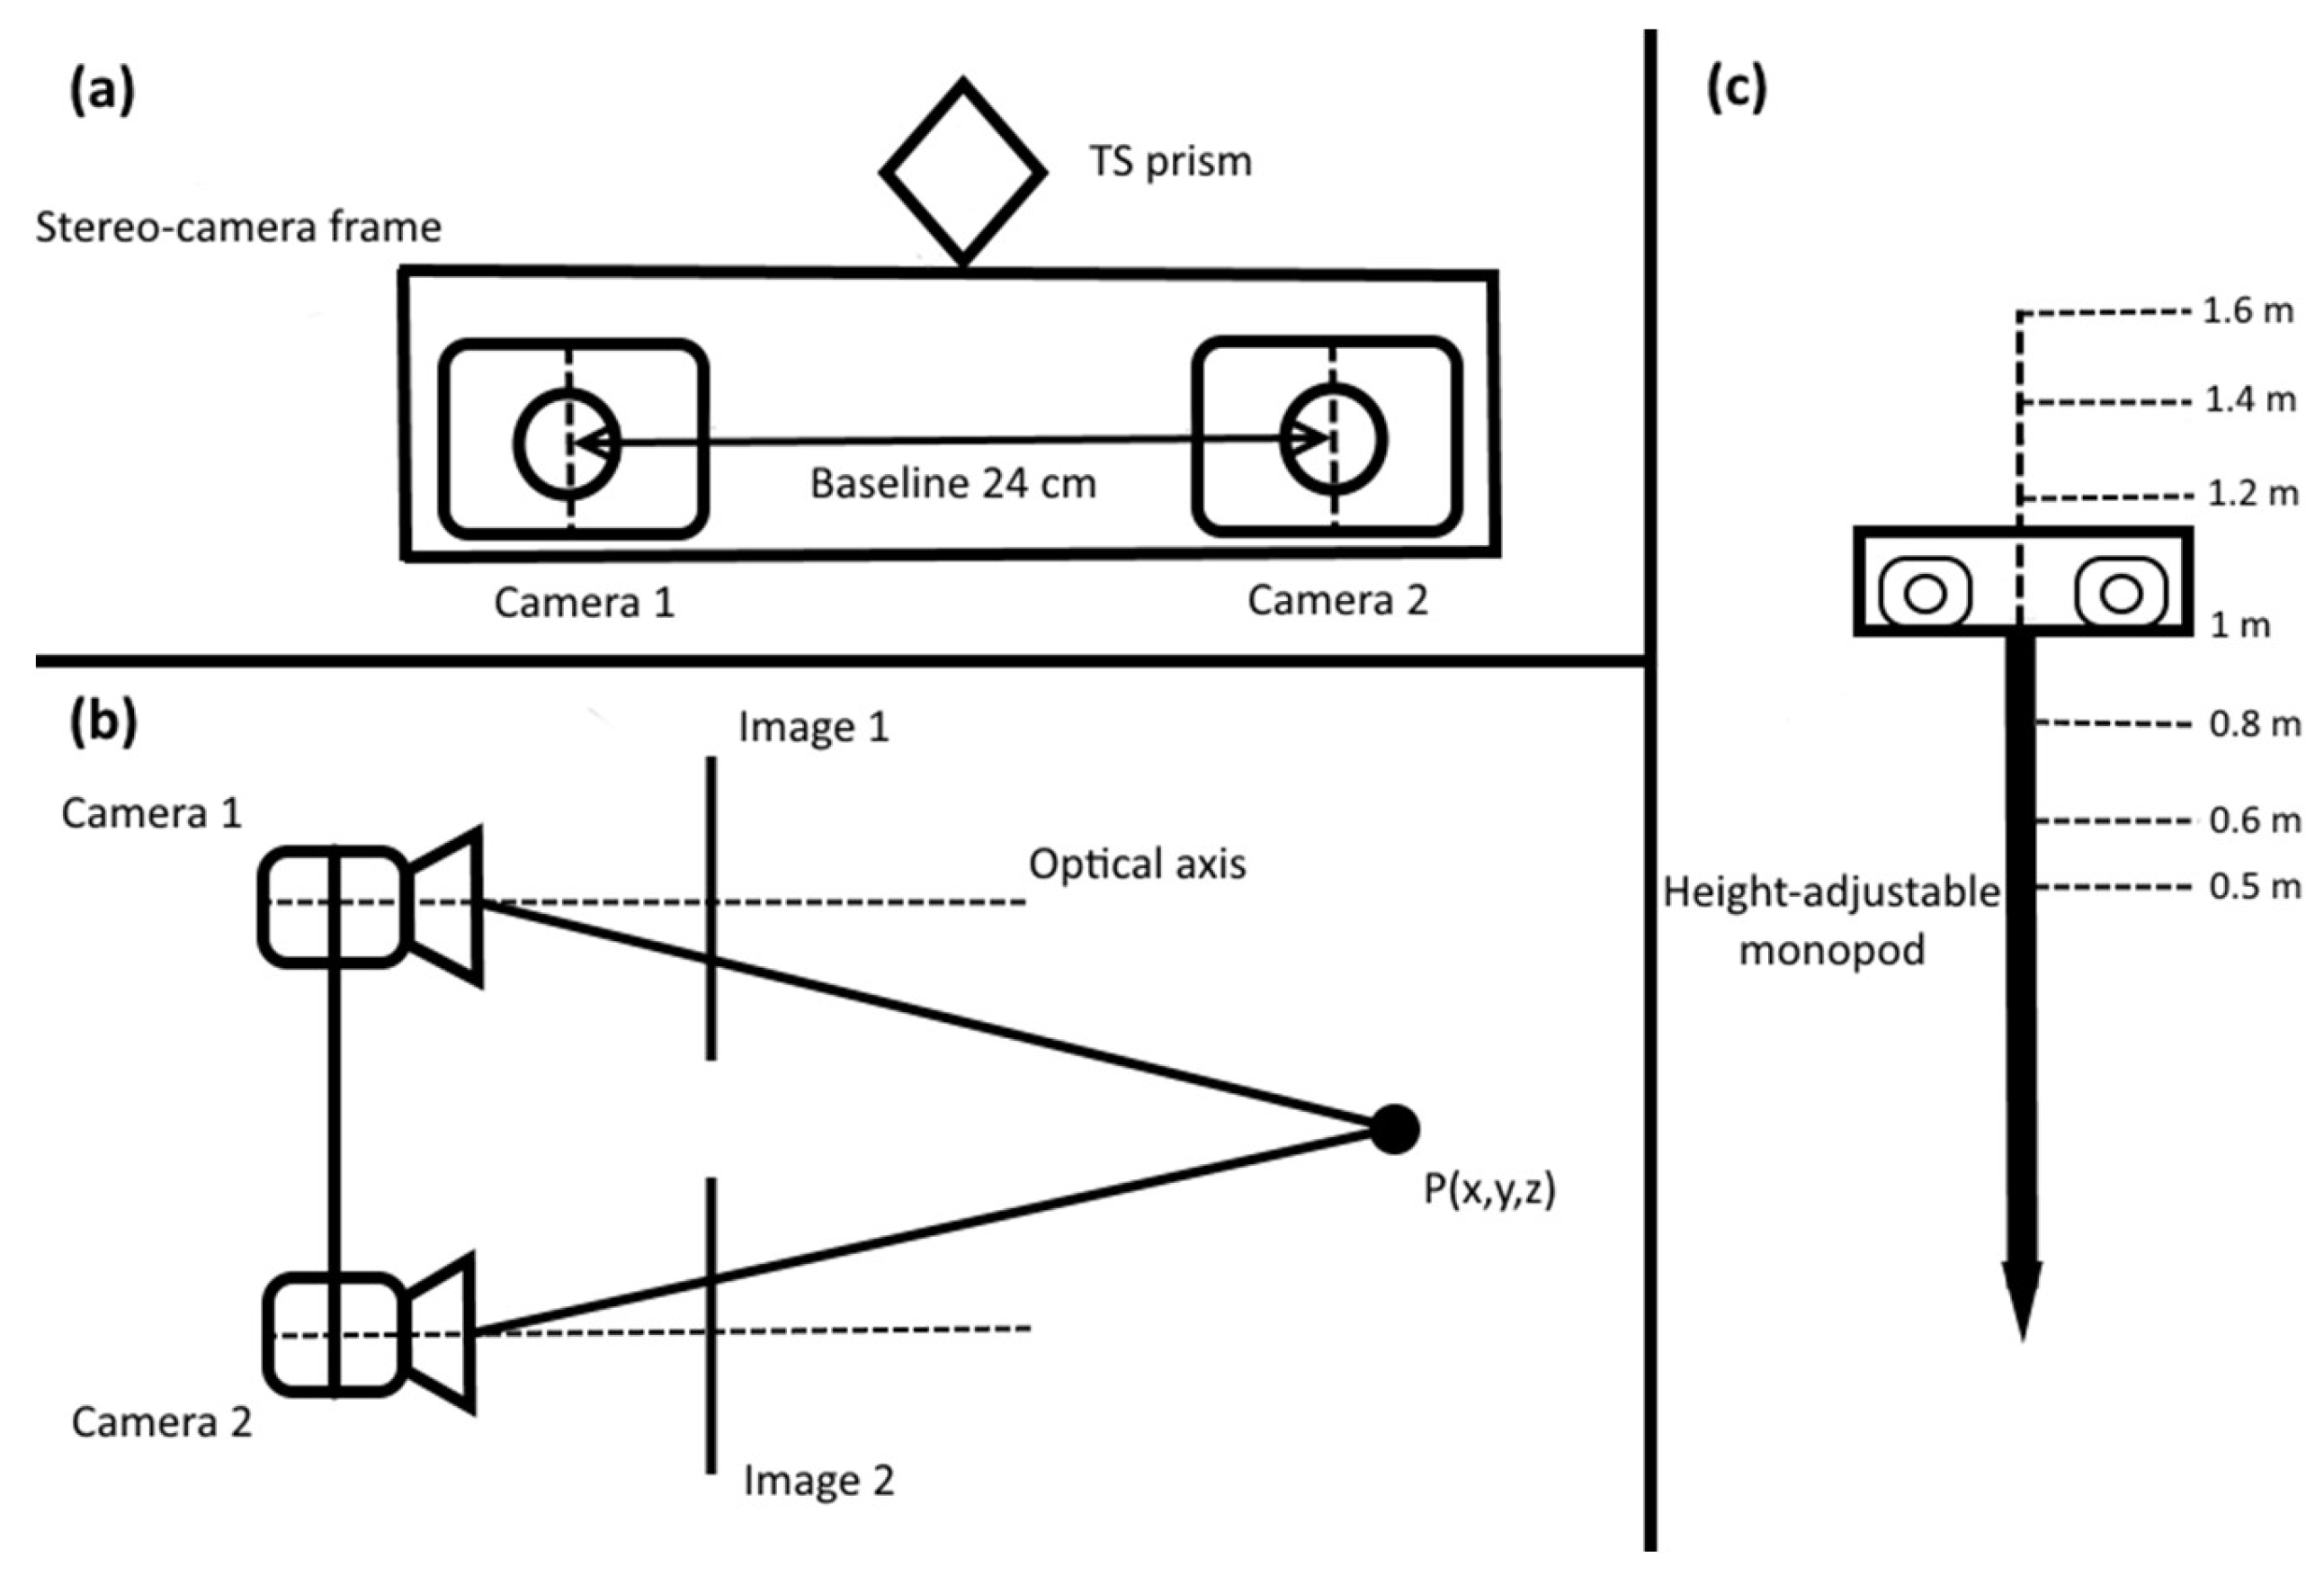
In our study, the baseline of the stereo-cameras was determined to be 24 cm based on previous work by other authors that reported the advantages and limitations of different camera settings. For example, in [51] the author recommended stereo-cameras of at least 20 cm baseline between the lenses to maximise underwater mapping. In [52], a 12 cm baseline stereo-camera embedded in a rotorcraft is used to map the river environment and determine river width and canopy height; the authors argued that the small stereo-camera baseline was the cause of poor performance of the proposed visual odometry approach. In [10], the author identified that larger stereo-camera baselines could reduce the uncertainty in the 3D position of objects derived from stereo-matching. This uncertainty is inversely proportional to the stereo-baseline [53,54]; for distances of 20 m, a baseline increase from 12–50 cm reduced the standard deviation of the object’s displacement error from 0.23 m to 0.06 m [10,54]. The proposed 24 cm stereo-camera baseline addressed some of the limitations identified above, with the added advantage of being comparable to existing commercial products (e.g., Bumblebee XB3-FLIR [55]). In addition, the reaches sampled in this study were less than 15 m wide and, as a result, the features used in the photogrammetric process were not expected to be more than 10 m away from the camera lenses. Features located further away became closer to the lenses as the cameras moved through the environment, thus improving their localisation for stereo-imagery matching via the photogrammetric process. Based on [56], the accuracy obtained in depth accuracy for baselines larger than 20 cm is 0.1 m for features located at 10 m distance. These values were considered sufficiently accurate for the purpose of the study. However, further work should look into quantifying the performance of the proposed SfM based framework for different stereo-camera baselines to inform a wider range of users with different stereo-camera settings and requirements. Comparative studies considering other existing cameras and methodologies will also highlight the advantages and limitations of the proposed approach.
The proposed framework would also benefit from real-time implementation with global georeferencing of processed outcomes. This will enable the integration of the framework with autonomous navigation solutions [49] for the rapid characterisation of water courses. At present, the overall data analysis as presented in this paper is time consuming and CPU demanding. For example, the generation of the point cloud from SfM requires between 304 h and 405 h for a 40 m long reach (Table 1), followed by another 8 h of data processing for semi-autonomous measure estimation. The reduction of such times will require the development of fast algorithms specifically tailored for this purpose. This should include the automatic detection of low quality images, development of real-time SfM solutions, exclusion of redundant points in the cloud, detection and elimination of outliers in the point cloud and the integration of these solutions with tools for real-time visualisation. Current advances in algorithm performance and technology are already available. For example, within the context of blurred image detection, Ribeiro-Gomes [57] successfully developed fast algorithms to detect blurred images from UAV data collected along a 40 ha case study area, with a reduction of up to 69% of the time required for image selection. Similarly, in [58], a filtering algorithm was developed for the automatic detection of blurred images in UAV image sets. Other authors have successfully developed alternative methodologies based on wavelet transforms and linear Gaussian theory [59,60,61]. The ZED stereo-camera (StereoLabs, San Francisco, CA) and associated algorithms already provide a feasible solution for real-time SfM implementation. The SfM processing is fast enough to make real-time river environment scanning feasible on reach lengths up to 10 m. The RANSAC algorithm [62] in real-time could be used to delete extreme/outlier cross sections that have to be deleted manually in this current version of the framework. Previous work [63] has shown positive results in the robust and effective identification of points within a cloud for ground versus vegetation identification. Similarly, tools for real-time visualisation in 3D have already been developed for other purposes [64,65]. The challenge now is to integrate all these solutions together with the SfM framework for the estimation of hydromorphological measures presented here.
The work presented here is another step forward towards an autonomous vessel for real-time hydromorphological river characterisation. In [49], we developed, tested and validated a solution for autonomous vessel navigation in riverine environments. In [9,14], we developed and tested the algorithms for hydromorphological feature identification. In this study we highlighted the potential of SfM to estimate basic and more complex hydromorphological features such as habitat or hydraulic units, automatically. The novel application of SfM-based techniques to river environments has provided the opportunity to generate detailed and spatially continuous models of river reaches. However, the image processing techniques used requires high volumes of data collection and high processing times. The next challenge is to work towards the integration of these scientific advances and developing technological solutions to enable the collection and processing of the vast amounts of imagery that will be collected over reaches up to 2000 m.

5. Conclusions

Extensive and intensive monitoring programmes for the characterisation of hydromorphology along rivers are required by multiple legislative approaches introduced with the intent of improving the quality of rivers. Structure-from-Motion (SfM) monitoring methods have been highlighted by multiple authors as a potential way forward for autonomous and wide-area hydromorphological river characterisation. The framework here presented extends existing SfM applications towards the semi-automated estimation of hydromorphological measures namely, water surface area, wetted water width, bank height, bank slope and bankfull width. Results showed mean errors below 1.8 m for wetted width estimation for all the study sites and below 3.6 m for bank width estimation for two of the sites. However, further work is required to improve the accuracy of the algorithms developed to determine bank height and bank slope. Results also highlighted that the accuracy in hydromorphological measure estimation also depends on the river configuration, with sites that are densely vegetated, present debris and sinuosity presenting the largest errors in measure estimation.
Overall, the framework highlights a potential way forward towards the automatic and autonomous estimation of hydromorphological measures. For that purpose, further work should focus on: (i) increasing the framework accuracy; (ii) developing real-time processing algorithms; and (iii) integrating of recent river monitoring advances (e.g., autonomous navigation, 3D visualisation and automated identification or river features and semi-automatic hydromorphological measure estimation).

Author Contributions

All authors contributed equally to the manuscript.

Funding

Knowledge Transfer Network iCASE Industrial Mathematics PhD Studentship voucher number 13330004.

Acknowledgments

We would like to thank the Environment Agency, The Smith Institute and EPSRC for funding this project under a Knowledge Transfer Network iCASE Industrial Mathematics PhD Studentship voucher number 13330004. The underlying data are confidential and cannot be shared. We would also like to thank the reviewers for their useful comments and constructive criticism. This manuscript became stronger thanks to their contribution.

Conflicts of Interest

The authors declare no conflict of interest.

References

  1. Chapra, S.C. Rubbish, stink, and death: The historical evolution, present state, and future direction of water-quality management and modeling. Environ. Eng. Res. 2011, 16, 113–119. [Google Scholar] [CrossRef]
  2. Australian and New Zealand Environment Conservation Council. National Water Quality Management Strategy: Australian Water Quality Guidelines for Fresh and Marine Waters; Australian and New Zealand Environment and Conservation Council and Agriculture and Resource Management Council of Australia and New Zealand: Canberra, Australia, 2000.
  3. U.S. Environment Protection Agency. Clean Water Act. Federal Water Act. of 1972 (Codified as Amended at 33 U.S.C.); U.S. Environment Protection Agency: Washington, DC, USA, 2006.
  4. European Commission. Directive 2000/60/EC of the European parliament and of the council of 23 October 2000 establishing a framework for community action in the field of water policy. Off. J. Eur. Union 2000, L327, 1–27. [Google Scholar]
  5. Raven, P.J.; Holmes, N.T.H.; Dawson, F.H.; Fox, P.J.A.; Everard, M.; Fozzaed, I.R.; Rouen, K.J. River Habitat Survey The Physical Character of Rivers and Streams in The UK and Isle of Man; The Environment Agency: Bristol, UK, 1998; Volume 2. [Google Scholar]
  6. Wright, J.F.; Sutcliffe, D.W.; Furse, M.T. Assessing the biological quality of fresh waters. Freshw. Biol. Assoc. 2000, 1–24. [Google Scholar]
  7. Gabriels, W.; Lock, K.; De Pauw, N.; Goethals, P.L.M. Multimetric macroinvertebrate index flanders (MMIF) for biological assessment of rivers and lakes in flanders (Belgium). Limnologica 2010, 40, 199–207. [Google Scholar] [CrossRef]
  8. Woodget, A.S.; Carbonneau, P.E.; Visser, F.; Maddock, I.P. Quantifying submerged fluvial topography using hyperspatial resolution UAS imagery and structure from motion photogrammetry. Earth Surf. Process. Landforms 2015, 40, 47–64. [Google Scholar] [CrossRef]
  9. Rivas Casado, M.; Ballesteros Gonzalez, R.; Kriechbaumer, T.; Veal, A. Automated identification of river hydromorphological features using UAV high resolution aerial imagery. Sensors 2015, 15, 27969–27989. [Google Scholar] [CrossRef] [PubMed] [Green Version]
  10. Kriechbaumer, T.; Blackburn, K.; Breckon, T.P.; Hamilton, O.; Rivas Casado, M. Quantitative evaluation of stereo visual odometry for autonomous vessel localisation in inland waterway sensing applications. Sensors 2015, 15, 31869–31887. [Google Scholar] [CrossRef] [PubMed] [Green Version]
  11. Kriechbaumer, T.; Blackburn, K.; Everard, N.; Rivas Casado, M. Acoustic Doppler Current Profiler measurements near a weir with fish pass: Assessing solutions to compass errors, spatial data referencing and spatial flow heterogeneity. Hydrol. Res. 2015, 47, nh2015095. [Google Scholar] [CrossRef]
  12. Griffith, S.; Drews, P.; Pradalier, C. Towards autonomous lakeshore monitoring. In Experimental Robotics; Hsieh, M.A., Khatib, O., Kumar, V., Eds.; Springer: Charm, Switzerland, 2016; Volume 109, pp. 545–557. ISBN 978-3-319-23777-0. [Google Scholar]
  13. Dunbabin, M.; Grinham, A.; Udy, J. An autonomous surface vehicle for water quality monitoring. In Proceedings of the Proceedings of the 2009 Australasian Conference on Robotics and Automation, Sydney, Australia, 2–4 December 2009. [Google Scholar]
  14. Rivas Casado, M.; Ballesteros Gonzalez, R.; Wright, R.; Bellamy, P. Quantifying the effect of aerial imagery resolution in automated hydromorphological river characterisation. Remote Sens. 2016, 8, 650. [Google Scholar] [CrossRef]
  15. Fonstad, M.A.; Dietrich, J.T.; Courville, B.C.; Jensen, J.L.; Carbonneau, P.E. Topographic structure from motion: A new development in photogrammetric measurement. Earth Surf. Process. Landforms 2013, 38, 421–430. [Google Scholar] [CrossRef]
  16. Westoby, M.J.; Brasington, J.; Glasser, N.F.; Hambrey, M.J.; Reynolds, J.M. Structure-from-Motion’ photogrammetry: A low-cost, effective tool for geoscience applications. Geomorphology 2012, 179, 300–314. [Google Scholar] [CrossRef] [Green Version]
  17. Westaway, R.M.; Lane, S.N.; Hicks, D.M. Remote survey of large-scale braided, gravel-bed rivers using digital photogrammetry and image analysis. Int. J. Remote Sens. 2003, 24, 795–815. [Google Scholar] [CrossRef]
  18. Cook, K.L. An evaluation of the effectiveness of low-cost UAVs and structure from motion for geomorphic change detection. Geomorphology 2017, 278, 195–208. [Google Scholar] [CrossRef]
  19. Armistead, C.C. Applications of Structure from Motion Photogrammetry to River Channel Change Studies; Boston College: Chestnut Hill, MA, USA, 2013. [Google Scholar]
  20. Barker, R.; Dixon, L.; Hooke, J. Use of terrestrial photogrammetry for monitoring and measuring bank erosion. Earth Surf. Process. Landforms 1997, 22, 1217–1227. [Google Scholar] [CrossRef]
  21. Belletti, B.; Rinaldi, M.; Buijse, A.D.; Gurnell, A.M.; Mosselman, E. A review of assessment methods for river hydromorphology. Environ. Earth Sci. 2014, 73, 2079–2100. [Google Scholar] [CrossRef] [Green Version]
  22. Micheletti, N.; Chandler, J.H.; Lane, S.N. Structure from Motion (SfM) Photogrammetry; British Society for Geomorphology: London, UK, 2015; p. 2. [Google Scholar]
  23. Pyle, C.J.; Richards, K.S.; Chandler, J.H. Digital photogrammetry monitoring of river bank Erosion. Photogramm. Rec. 1997, 15, 753–764. [Google Scholar] [CrossRef]
  24. Chandler, J.; Wackrow, R.; Sun, X. Measuring a dynamic and flooding river surface by close range digital photogrammetry. Int. Soc. Photogramm. Remote Sens. 2008, 211–216. [Google Scholar]
  25. Willen, O. Home GaugeMap. Available online: http://www.gaugemap.co.uk/#!Map/Summary/1580/1725/2017-09-24/2017-09-25 (accessed on 4 December 2017).
  26. Haversham, O. Details GaugeMap. Available online: http://www.gaugemap.co.uk/#!Detail/1587 (accessed on 4 December 2017).
  27. Ghosh, S.K. Analytical Photogrammetry; Pergamon Press: Elmsford, NY, USA, 1988. [Google Scholar]
  28. Lane, S.N.; Chandler, J.H.; Porfiri, K. Monitoring river channel and flume surfaces with digital photogrammetry. J. Hydraul. Eng. 2001, 127, 871–877. [Google Scholar] [CrossRef]
  29. Furukawa, Y.; Hernández, C. Multi-View Stereo: A Tutorial. Found. Trends® Comput. Graph. Vis. 2015, 9, 1–148. [Google Scholar] [CrossRef] [Green Version]
  30. Camera Calibration Toolbox for Matlab. Available online: http://www.vision.caltech.edu/bouguetj/calib_doc/ (accessed on 4 May 2018).
  31. Wackrow, R.; Chandler, J.H. A convergent image configuration for DEM extraction that minimises the systematic effects caused by an inaccurate lens model. Photogramm. Rec. 2008, 23, 6–18. [Google Scholar] [CrossRef] [Green Version]
  32. Leica Viva TS15—Your Vision: The Fastest Imaging Total Station—Leica Geosystems—HDS. Available online: https://hds.leica-geosystems.com/en/Leica-Viva-TS15_86198.htm (accessed on 9 June 2018).
  33. Leica ScanStation P40/P30 User Manual. Available online: http://surveyequipment.com/assets/index/download/id/457/ (accessed on 22 June 2018).
  34. Vericat, D.; Brasington, J.; Wheaton, J.; Cowie, M. Accuracy assessment of aerial photographs acquired using lighter-than-air blimps: LOW-cost tools for mapping river corridors. River Res. Appl. 2009, 25, 985–1000. [Google Scholar] [CrossRef]
  35. Javernick, L.; Brasington, J.; Caruso, B. Modeling the topography of shallow braided rivers using Structure-from-Motion photogrammetry. Geomorphology 2014, 213, 166–182. [Google Scholar] [CrossRef]
  36. Micheletti, N.; Chandler, J.H.; Lane, S.N. Investigating the geomorphological potential of freely available and accessible structure-from-motion photogrammetry using a smartphone. Earth Surf. Process. Landforms 2015, 40, 473–486. [Google Scholar] [CrossRef] [Green Version]
  37. Golparvar-Fard, M.; Bohn, J.; Teizer, J.; Savarese, S.; Peña-Mora, F. Evaluation of image-based modeling and laser scanning accuracy for emerging automated performance monitoring techniques. Autom. Constr. 2011, 20, 1143–1155. [Google Scholar] [CrossRef]
  38. Lowe, D.G. Distinctive image features from scale-invariant keypoints. Int. J. Comput. Vis. 2004, 60, 91–110. [Google Scholar] [CrossRef]
  39. Merwade, V.M.; Maidment, D.R.; Hodges, B.R. Geospatial representation of river channels. J. Hydrol. Eng. 2005, 10, 243–251. [Google Scholar] [CrossRef]
  40. Merwade, V.; Cook, A.; Coonrod, J. GIS techniques for creating river terrain models for hydrodynamic modeling and flood inundation mapping. Environ. Model. Softw. 2008, 23, 1300–1311. [Google Scholar] [CrossRef]
  41. Ramer, U. An iterative procedure for the polygonal approximation of plane curves. Comput. Graph. Image Process. 1972, 1, 244–256. [Google Scholar] [CrossRef]
  42. Monsouryar, M.; Hedayati, A. Smoothing via iterative averaging (SIA). A basic technique for line smoothing. Int. J. Comput. Electr. Eng. 2012, 4, 307–311. [Google Scholar] [CrossRef]
  43. Lague, D.; Brodu, N.; Leroux, J. Accurate 3D comparison of complex topography with terrestrial laser scanner: Application to the Rangitikei canyon (N-Z). ISPRS J. Photogramm. Remote Sens. 2013, 82, 10–26. [Google Scholar] [CrossRef] [Green Version]
  44. James, M.R.; Robson, S. Straightforward reconstruction of 3D surfaces and topography with a camera: Accuracy and geoscience application. J. Geophys. Res. Earth Surf. 2012, 117, 1–17. [Google Scholar] [CrossRef]
  45. Harwin, S.; Lucieer, A. Assessing the accuracy of georeferenced point clouds produced via multi-view stereopsis from unmanned aerial vehicle (UAV) imagery. Remote Sens. 2012, 4, 1573–1599. [Google Scholar] [CrossRef]
  46. Martínez-Carricondo, P.; Agüera-Vega, F.; Carvajal-Ramírez, F.; Mesas-Carrascosa, F.-J.; García-Ferrer, A.; Pérez-Porras, F.-J. Assessment of UAV-photogrammetric mapping accuracy based on variation of ground control points. Int. J. Appl. Earth Obs. Geoinform. 2018, 72, 1–10. [Google Scholar] [CrossRef]
  47. Wang, J.; Ge, Y.; Heuvelink, G.B.M.; Zhou, C.; Brus, D. Effect of the sampling design of ground control points on the geometric correction of remotely sensed imagery. Int. J. Appl. Earth Obs. Geoinform. 2012, 18, 91–100. [Google Scholar] [CrossRef]
  48. Agüera-Vega, F.; Carvajal-Ramírez, F.; Martínez-Carricondo, P. Assessment of photogrammetric mapping accuracy based on variation ground control points number using unmanned aerial vehicle. Measurement 2017, 98, 221–227. [Google Scholar] [CrossRef]
  49. Kriechbaumer, T.; Blackburn, K.; Breckon, T.P.; Hamilton, O.; Rivas-Casado, M. Quantitative evaluation of stereo visual odometry for autonomous vessel localisation in inland waterway sensing applications. Sensors 2015, 15, 31869–31887. [Google Scholar] [CrossRef] [PubMed] [Green Version]
  50. Recker, S.; Shashkov, M.M.; Hess-Flores, M.; Gribble, C.; Baltrusch, R.; Butkiewicz, M.A.; Joy, K.I. Hybrid Photogrammetry Structure-from-Motion Systems for Scene Measurement and Analysis—Semantic Scholar. Available online: https://www.semanticscholar.org/paper/Hybrid-Photogrammetry-Structure-from-Motion-Systems-Recker-Shashkov/6ca21d293ae705cee12ebe5485987612ae18abb7 (accessed on 29 April 2018).
  51. Hildebrandt, M. Development, Evaluation and Validation of a Stereo Camera Underwater SLAM Algorithm. Ph.D Thesis, University of Bremen, Bremen, Germany, 2013. [Google Scholar]
  52. Chambers, A.; Achar, S.; Nuske, S.; Rehder, J.; Kitt, B.; Chamberlain, L.; Haines, J.; Scherer, S.; Singh, S. Perception for a river mapping robot. In Proceedings of the IEEE/RSJ International Conference on Intelligent Robots and Systems, San Francisco, CA, USA, 25–30 September 2011; pp. 227–234. [Google Scholar]
  53. Lemaire, T.; Berger, C.; Jung, I.-K.; Lacroix, S. Vision-based SLAM: Stereo and monocular approaches. Int. J. Comput. Vis. 2007, 74, 343–364. [Google Scholar] [CrossRef]
  54. Hamilton, O.K.; Breckon, T.P.; Bai, X.; Kamata, S. A foreground object based quantitative assessment of dense stereo approaches for use in automotive environments. In Proceedings of the 2013 IEEE International Conference on Image Processing, Melbourne, VIC, Australia, 15–18 September 2013; pp. 418–422. [Google Scholar]
  55. FLIR Integrated Imaging Solutions Bumblebee2 and XB3 Datasheet. Available online: https://www.ptgrey.com/support/downloads/10132 (accessed on 9 May 2018).
  56. Chang, C.; Chatterjee, S. Quantization error analysis in stereo vision. In Proceedings of the [1992] Conference Record of the Twenty-Sixth Asilomar Conference on Signals, Systems & Computers, Pacific Grove, CA, USA, 26–28 October 1992; pp. 1037–1041. [Google Scholar]
  57. Ribeiro-Gomes, K.; Hernandez-Lopez, D.; Ballesteros, R.; Moreno, M.A. Approximate georeferencing and automatic blurred image detection to reduce the costs of UAV use in environmental and agricultural applications. Biosyst. Eng. 2016, 151, 308–327. [Google Scholar] [CrossRef]
  58. Sieberth, T.; Wackrow, R.; Chandler, J.H. Automatic detection of blurred images in UAV image sets. ISPRS J. Photogramm. Remote Sens. 2016, 122, 1–16. [Google Scholar] [CrossRef] [Green Version]
  59. Tsomko, E.; Kim, H.J. Efficient method of detecting globally blurry or sharp images. In Proceedings of the 2008 Ninth International Workshop on Image Analysis for Multimedia Interactive Services, Klagenfurt, Austria, 7–9 May 2008; pp. 171–174. [Google Scholar]
  60. Tsomko, E.; Kim, H.J.; Izquierdo, E. Linear Gaussian blur evolution for detection of blurry images. IET Image Process. 2010, 4, 302. [Google Scholar] [CrossRef]
  61. Tong, H.; Li, M.; Zhang, H.; Zhang, C. Blur detection for digital images using wavelet transform. In Proceedings of the IEEE International Conference on Multimedia and Expo (ICME). Taipei, China, 27–30 June 2004; pp. 17–20. [Google Scholar]
  62. Fischler, M.A.; Bolles, R.C. Random sample consensus: A paradigm for model fitting with apphcatlons to Image analysis and automated cartography. Graph. Image Process. 1981, 24, 381–395. [Google Scholar] [CrossRef]
  63. Weiss, U.; Biber, P. Plant detection and mapping for agricultural robots using a 3D LIDAR sensor. Rob. Auton. Syst. 2011, 59, 265–273. [Google Scholar] [CrossRef]
  64. ROS—Getting Started. Available online: https://www.stereolabs.com/documentation/integrations/ros/getting-started.html (accessed on 21 December 2017).
  65. Using the ZED Camera with ROS Stereolabs. Available online: https://www.stereolabs.com/blog/use-your-zed-camera-with-ros/ (accessed on 21 December 2017).
Figure 1. Location of the experimental setting at: (a) the Chicheley Brook (≈2 m wide), where downstream flow direction travels from the image horizon towards the camera lens; (b) the River Ouzel (≈8 m wide), where downstream flow direction travels from the camera lens towards the image horizon; and (c) the River Great Ouse (≈15 m wide), where downstream flow direction travels from the camera lens towards the image horizon. The images of the river sites depict part of the experimental setting along each of the reaches.
Remotesensing 10 01005 g001
Figure 2. (a) Diagram showing the stereo-camera baseline setting and the location of the total station (TS) prism; (b) diagram showing the configuration of the cameras from a top down view. x, y and z refer to the coordinates of the focal point (P); and (c) diagram depicting the stereo-camera on the adjustable monopod with an approximate indication of the heights tested in the calibration study.
Remotesensing 10 01005 g002
Figure 3. (a) Diagram showing the track followed along the 10 m reach at the Chicheley Brook (Cranfield, UK) for the stereo-camera calibration study; and (b) diagram showing the track followed along the 10 m reach at the River Ouzel site (Ouzel Valley Park, UK). Each stereo-camera height setting has been depicted with a different colour. The zoomed images show the precision in track replicability. All coordinates reported are local. Each of the points shows were stereo-imagery were collected for each of the height settings.
Remotesensing 10 01005 g003
Figure 4. Data collection set up for each of the 40 m reaches surveyed: (a) Chicheley Brook (Cranfield, UK); (b) River Ouzel (Ouzel Valley Park, UK); and (c) River Great Ouse (Wolverton, UK). GCP stands for Ground Control Point. Downstream and Upstream indicate the locations where images were collected when walking the reach in the stated direction. The coordinates are local.
Remotesensing 10 01005 g004
Figure 5. Workflow depicting the main steps followed to estimate the selected hydromorphological measures. Implementation of the workflow requires Photoscan Pro version 1.1.6 (Agisoft LLC, St. Petersburg, Russia), CloudCompare v2.6.1 (GPL Software) and bespoke Python scripts. The abbreviations stand for: Ground Control Point (GCP), Total Station (TS), Terrestrial Laser Scanner (TLS) and Root Mean Square Error (RMSE) of distance measurements.
Remotesensing 10 01005 g005
Figure 6. Schematic diagram showing the hydromorphological measures estimated at cross-section level with the proposed Structure-from-Motion framework. A full description of each measure can be found in Table 1.
Remotesensing 10 01005 g006
Figure 7. Structure-from-Motion (SfM) derived point clouds obtained for the two 10 m long reaches used for the stereo-camera calibration study: (a) Chicheley Brook; and (b) River Ouzel. The point clouds were generated with imagery collected for a stereo-camera height setting of 1 m above the water level. The arrow indicates the downstream flow direction.
Remotesensing 10 01005 g007
Figure 8. Summary of outcomes obtained for the stereo-camera height study along the 10 m reaches at the Chicheley Brook and River Ouzel. (a) Number of points; and (b) Root Mean Square Error (RMSE) of distance measurements (m) of the point clouds obtained for each stereo-camera height setting tested. The RMSE of distance measurements of the Structure-from-Motion (SfM) point cloud was estimated with respect to the total laser scanner (TLS) point cloud. (c) Water surface area obtained for the Chicheley Brook and River Ouzel sites. Discrepancy (error) between hydromorphological measures obtained for the SfM and TLS point clouds are reported as follows: (d) mean wetted water width; (e) mean left bank height; (f) mean right bank height; (g) mean left bank slope; (h) mean right bank slope; and (i) mean bankfull width. The error bars denote the SE, whereas the labels indicate the number of valid cross-sections used in the estimation of the measure average.
Remotesensing 10 01005 g008
Figure 9. Water surface area footprint (blue) obtained for each stereo-camera height setting during the 10 m reach calibration studies at: (a) the Chicheley Brook site; and (b) the River Ouzel site. The stereo-camera height settings tested from left to right are 0.5 m, 0.6 m, 0.8 m, 1.00 m, 1.2 m, 1.4 m and 1.6 m. All coordinates provided are local.
Remotesensing 10 01005 g009
Figure 10. Structure-from-Motion (SfM) generated point cloud obtained for each of the 40 m long study reaches: (a) Chicheley Brook; (b) River Ouzel; and (c) River Great Ouse. The images illustrate the proportion of the point cloud representing vegetated and un-vegetated banks, as well as any artificial structures along/across the reach. The arrows indicate downstream flow direction.
Remotesensing 10 01005 g010
Table 1. Hydromorphological measures estimated from the modelled river environment. Adapted from [5]. WS, WW, BH, BS and BW stand for water surface area, wetted water width, bank height, bank slope and bankfull width, respectively.
FeatureDescription
WSArea (m2) of the polygon describing the water surfaces defined by the point cloud.
WWDistance (m) across the wetted perimeter of the channel [5].
BHHeight (m) of the bank where the river first starts to spill water into the flood plain [5]. For a given cross-section, bank height was estimated for the left (LBH) and the right (RBH) banks.
BSSlope (degrees) of the bank based on the BH and the edge of the water at the cross-section bank as defined by the WS polygon. For a given cross-section, the slope was estimated for both the left (LBS) and the right (RBS) banks.
BWThe bankfull is the point where the river first spills on to the floodplain [5]. The width of the channel at that point is the bankfull width (m).
Table 2. Summary of variables describing the field work conditions, the study sites and the number of frames captured at each site. All the hydromorphological measures, except Water Surface Area (WS), were derived from the Total Laser Scanner (TLS) point cloud based on 10 cm and 50 cm interval cross sections for the calibration and framework development sites, respectively. The hydromorphological measures (Table 1) reported are: wetted water width (WW), left bank height (LBH), right bank height (RBH), left bank slope (LBS), right bank slope (RBS) and bankfull width (BW). “Stage” stands for the river stage and “Length” for the reach length. Values in brackets denote the standard errors. The number of stereo-frames reported for each of the 10 m reaches represent the images captured and processed for each of the stereo-camera height settings considered. PT stands for computer processing time based on an Intel Xeon E5-1650v3 3.50 GHz processor, 32 GB RAM, and GeForce GTX 1080 (NVIDIA, Santa Clara, CA, USA) graphics card. 1 [25], 2 [26].
VariableCalibrationFramework Development
ChicheleyOuzelChicheleyOuzelGreat Ouse
Date23 September 201724 September 20179 December 201724 September 201718 June 2017
Stage (m)0.100.27 10.100.27 10.41 2
Length (m)101042.439.643.7
Stereo-frames captured4141332385378
Stereo-frames processed4141321367371
WS (m2)15.8259.3574.98392.711031.711
WW (m)1.82 (0.00)7.36 (0.23)1.59 (0.07)7.81 (0.25)15.03 (0.22)
LBH (m)2.99 (0.06)6.01 (0.05)2.38 (0.03)5.78 (0.33)3.22 (0.22)
RBH (m)1.86 (0.07)4.05 (0.09)3.23 (0.11)12.38 (0.51)5.45 (0.25)
LBS (°)53.79 (1.85)41.91 (2.74)31.79 (1.18)20.66 (1.85)21.73 (0.91)
RBS (°)74.67 (1.03)40.48 (3.22)26.85 (1.03)31.70 (1.43)24.42 (1.13)
BW (m)4.47 (0.04)11.83 (0.42)6.82 (0.20)18.44 (0.72)20.22 (0.34)
PT (h)1716350405304
Table 3. Camera characteristics.
ParameterValue
CameraCannon 550D
Sensor TypeCMOS APS-C type
Million effective pixels18
Pixel size (µm)4.3
Focal length (mm)20
Table 4. Intrinsic parameters (internal orientation) of the cameras. The abbreviations stand for focal point (f), coordinate (c), and parameter in the polynomial function correcting for distortions (k). x and y refer to the axis directions.
ParameterCamera 1Camera 2
Focal lengthfx4813.58544778.7491
fy4809.45874772.1215
Principal pointcx2621.88181742.4222
cy2611.93111730.0474
Radial distortionk1−0.0785−0.0805
k20.08890.0751
k3−0.0374−0.0168
Tangential distortionk4−0.00050.0002
k50.00130.0006
Skew-0.00040.0002
Table 5. Absolute maximum (m) and average precision (m) in path replicability for each of the stereo-camera settings considered with respect to the position of the measurements taken at stereo-camera height 0.5 m. Results refer to each of the 10 m study sites selected for the stereo-camera calibration study. A total of 41 measurements were taken per site and stereo-camera setting.
Stereo-Setting Height (m)x (m)y (m)
Absolute MaximumAverageAbsolute MaximumAverage
Chicheley0.60.042−0.0020.0580.001
0.80.048−0.0120.0790.016
1.000.063−0.0230.0680.024
1.200.063−0.0360.0760.011
1.400.068−0.0380.0700.017
1.600.093−0.0370.1040.012
Ouzel0.60.063−0.0210.068−0.003
0.80.085−0.0210.118−0.010
1.000.093−0.0440.2110.017
1.200.104−0.0520.0930.010
1.400.118−0.0640.0740.014
1.600.137−0.0760.0850.006
Table 6. Co-registration errors obtained from the 3D Structure from Motion (SfM) model of the riverine environment at each study site. Results refer to each of the 10 m study sites selected for the stereo-camera calibration study.
Stereo-Setting Height (m)x (m)y (m)z (m)
Chicheley0.50.0100.0030.008
0.60.0150.0040.012
0.80.0160.0050.013
1.000.0140.0090.011
1.200.0140.0040.012
1.400.0140.0050.013
1.600.0120.0050.010
Ouzel0.50.0110.0030.002
0.60.2900.0140.005
0.80.0150.0040.002
1.000.0120.0030.002
1.200.0100.0040.001
1.400.0100.0020.001
1.600.0090.0020.001
Table 7. Co-registration errors obtained from the 3D Structure from Motion (SfM) model of the riverine environment at each 40 m study site. The stereo-camera height at the three sites was 1 m above the water level.
Study SiteDirectionx (m)y (m)z (m)
Chicheley BrookUpstream0.010.0040.02
Downstream0.0050.0010.012
River OuzelUpstream0.0560.0500.010
Downstream0.0400.0190.001
River Great OuseUpstream0.0030.0090.0005
Downstream0.0860.0330.0009
Table 8. Estimated mean error of the Structure from Motion (SfM) derived hydromorphological measures with respect to the Total Laser Scanner (TLS) measures for the 40 m long reaches at the Chicheley Brook, River Ouzel and River Great Ouse sites. The measures reported refer to: point cloud size (size), minimum number of cross-sections included in the calculations (N), the root mean square error (RMSE) of distance measurements between the SfM and TLS point clouds, surface standard deviation (m) (SSD) [44], distance (m) (D) [44], precision ratio (PR) [44], water surface area (WS), wetted water width (WW), left bank height (LBH), right bank height (RBH), left bank slope (LBS), right bank slope (RBS) and bank width (BW). Values in brackets represent the standard deviation.
MeasureChicheleyOuzelGreat Ouse
ValuesN1089981
Size SfM130,988,71743,880,5474,193,313
Size TLS147,170,33154,394,61227,297,355
RMSE (m)0.160.170.188
SSD0.150.160.18
D161831
PR1:1061:1121:172
WS (m2)76.94303.321007.397
Mean ErrorWW (m)−0.093 (0.04)1.81 (0.10)0.95 (0.12)
LBH (m)0.67 (0.054)4.00 (0.36)0.33 (0.21)
RBH (m)1.60 (0.097)10.09 (0.60)0.73 (0.21)
LBS (°)−3.49 (1.16)−5.58 (1.67)−3.61 (1.19)
RBS (°)−7.18 (1.46)9.03 (2.13)−2.89 (1.27)
BW (m)2.83 (0.25)11.15 (0.81)3.54 (0.35)
Table 9. Average discrepancy (in percentage) of the Structure from Motion (SfM) derived hydromorphological measures with respect to the Total Laser Scanner (TLS) derived measures at cross-section level for the 40 m long reaches at the Chicheley Brook, River Ouzel and River Great Ouse sites. The measures reported refer to: wetted water width (WW), left bank height (LBH), right bank height (RBH), left bank slope (LBS), right bank slope (RBS) and bank width (BW). Values in brackets represent the standard deviation.
Study SiteWWLBHRBHLBSRBSBW
Chicheley Brook67.027.242.972.180.6−19.8
(191.4)(21.3)(35.6)(267.5)(185.5)(279.4)
River Ouzel23.761.171.8−83.2−15.026.6
(12.5)(32.1)(27.7)(219.6)(132.4)(125.5)
River Great Ouse5.6−0.57.933.4−38.615.8
(6.2)(54.4)(36.4)(79.05)(134.5)(16.0)

