Flash Flood Hazard Using Optical, Radar, and Stereo-Pair Derived DEM: Eastern Desert, Egypt

1
Planning and Development Department, Town of Carolina Beach, Carolina Beach, NC 28428, USA
2
Department of Earth and Ocean Sciences; University of North Carolina Wilmington, 601 South College Road, Wilmington, NC 28403, USA
*
Author to whom correspondence should be addressed.
Remote Sens. 2018, 10(8), 1204; https://doi.org/10.3390/rs10081204
Submission received: 21 May 2018
/
Revised: 5 July 2018
/
Accepted: 20 July 2018
/
Published: 1 August 2018
(This article belongs to the Special Issue Remote Sensing for Flood Mapping and Monitoring of Flood Dynamics)
Abstract
:Flash floods are classified among the Earth’s most deadly and destructive natural hazards, particularly in arid regions. Wadi El-Ambagi, one of the largest drainage basins in the Eastern Desert of Egypt, is frequently subjected to severe flash flood damage following intense, short-lived rainstorms. This wadi is home to one of the few road networks which connects the Nile River Valley to the Red Sea Coast. At its outlet lies Quseir, one of the major coastal towns in the area. Quseir is a developing tourism and scuba diving town, and is known for its historical importance as an ancient port; thus, efforts are in place to preserve the town’s heritage. The lack of hydrological and meteorological data in this region necessitates the use of a hydrological modeling approach to predict the spatial extent, depth, and velocity of the flood waters, and hence locate sites at risk of flood inundation. This was accomplished by understanding the characteristics of surface runoff through modeled hydrographs. Here, elevation data were extracted from Shuttle Radar Topography Mission (SRTM) and a two-meter digital elevation model (DEM) derived from WorldView-2 stereo pair imagery. The land use/land cover and soil properties were mapped from fused ASTER multispectral and ALOS-PALSAR Synthetic Aperture Radar (SAR) data to produce a hybrid image that combines spectral properties and surface roughness, respectively. The results showed that storm events with rainfall intensities of 30 mm and ~60 mm over a two-hour period would generate maximum peak flows of 165 m3 s−1 and 875 m3 s−1 , respectively. The latter peak flow would generate floods with depths of up to 2 m within the town of Quseir. A flood of this magnitude would inundate 217 buildings, 7 km of the highway, and 1.43 km of the railroad in the downstream area of Wadi El-Ambagi. Findings from this work indicate that the integration of remote sensing and hydrological modeling can be a practical and quick approach to predict flash flood hazards in arid regions where data are scarce.

1. Introduction
Flash floods are hydro-meteorological events that are distinguished from ordinary floods by the time scale of the event [1]. According to the United Nations Educational, Scientific, and Cultural Organization (UNESCO), a flash flood is defined as one that has a short duration with a relatively high peak discharge [2,3]. Complexities of flood response in arid regions are related to multiple factors including intense storms, steep slopes within a drainage basin, a lack of vegetation cover, and high velocity flows where there is nothing to slow flood waters [2]. Arid environments experience infrequent, intense, short-lived rainstorm events [4,5] that produce flash floods that can develop in a period of hours, making them extremely dangerous to human safety [6,7]. Dry channel beds, known in Arabic as wadis, fill rapidly with rainwater, which flows down the mountains, through the wadi course, and into the sea [8]. As the water travels it gains strength, which creates a destructive force.
The Eastern Desert of Egypt, where Wadi El-Ambagi is located, suffers from a hyper-arid climate that lacks regular precipitation. Precipitation occasionally occurs in the region in the form of short-lived, intense rainstorm events. While the average annual precipitation is less than 5 mm/year, historically, Quseir has seen annual precipitation as high as 60 mm [9]. The basin is ungauged, and there is little detailed meteorological and hydrological data for it. In the Red Sea coastal region there are two monitoring stations in total, one is located in Hurghada, and one in Quseir. Precipitation data for these gauges for the years 1925–1997 were obtained by Badawy [9] from the Egyptian Meteorological Authority. In June 1965, Quseir experienced an intense rainfall event totaling 60 mm of precipitation, which is the highest precipitation event on record for Quseir [9].
While flash flooding has been perceived as a natural hazard, especially in dry areas, parts of the procedures prompting its initiation remain unclear, and in many cases, inadequately documented [8,10]. Since flash floods do not occur regularly, people pay little attention to the potential hazard, which prompts a misguided feeling of security among residents [4]. Many detailed aspects of the process that lead to flood inundation remain ineffectively comprehended. Much of this uncertainty can be attributed to the lack of hydrological and precipitation data; this creates a need for hydrological modeling to predict flash flood risk. Typically, remote location, harsh climate, and the vast scope of flood-affected areas make it difficult to analyze flash flood behavior from the field [11]. Utilizing remote sensing and GIS techniques can overcome these disadvantages. While a given study region may contain a suite of variables influencing flash flooding conditions, many of these variables can be mapped to high fidelity using remote sensing and GIS products. This is particularly significant for large remote undeveloped areas where ground-based investigations are impractical.
Understanding the hydrological properties of an area is the first step to identifying sites at risk of flash flood damage. In remote arid areas with scarce hydrological records and field measurements, these hydrological properties can be derived from remotely sensed data. Among these data are the topology of the terrain [5], land cover characteristics [12], lithology, and ground surface type [6]. Important surface topology variables such as stream network, catchment area, and surface gradient can be derived from a digital elevation model (DEM). Land use and land cover characteristics can be derived from the classification of multispectral satellite imagery, whereas surface lithology and soil texture properties can be extracted from a fusion of multispectral and spaceborne radar images [13,14]. The ultimate goal of this work is to integrate remote sensing and GIS techniques, along with hydrological and hydraulic models, to explore the flood response of Wadi El-Ambagi to intense, short-lived precipitation events. Here, we aim to assess the capability of a modeling-based approach for predicting locations that are sensitive to flash flood risk in the wadi basin using moderate and very high-resolution satellite remote sensing data. The present work will utilize stereo pair WorldView-2 (WV-2) satellite imagery to derive fine resolution topographic data for the downstream area of Wadi El-Ambagi, which will enable better delineation and, thus, better prediction of flash flood threats. In addition, Synthetic Aperture Radar (SAR) using ALOS-PALSAR will be incorporated into the study to enable the mapping of different soil textures along the main wadi floor in order to gain a better understanding of flood water that may be lost to infiltration in the event of a rainstorm. The incorporation of these types of data with other remote sensing data (e.g., Landsat and ASTER), enables the production of much needed enhanced flood maps. Consequently, this will help compensate for the scarcity of data in many dry land regions. Throughout, attention is focused on the relative shape and magnitude of predicted peak flows, flood spatial extent, depth, and water velocity on the town of Quseir and the transportation network within the basin as indicators of flash flood risk. Such information provides much needed information for decision makers to initiate sustainable development for the region under investigation.
2. Study Area
The Eastern Desert consists of mountainous terrain with a dense network of wadis that drain the mountain range. The town of Quseir is located at the outlet of Wadi El-Ambagi, one of the largest wadis in the Eastern Desert, making it potentially vulnerable to flash flooding and associated damage (Figure 1). With many homes of the town of Quseir situated within the wadi course, risk from flood inundation remains a concern. As an ancient port, Quseir is of historical importance and is home to many ancient artifacts and old buildings, which are currently being protected in an effort to preserve the town’s heritage (www.alquseirguide.org). Moreover, the town of Quseir is developing a reputation as a prime scuba diving location and tourist destination in Egypt. Wadi El-Ambagi is bisected by a major roadway, known as the Qift–Quseir highway, which is approximately 70 km in length, and connects the town of Qift in the Nile Valley with the town of Quseir on the Red Sea coast. Perpendicular to this highway, along the coastline, is the second major highway, which traverses the wadi outlet and connects the northern coast with the southern Red Sea Coast. Both highways are susceptible to damage following flash flooding. In 1980, 1985, 1989, 1991, and 1994, the region was struck with large flash floods [15], which caused the loss of many lives and significant property damage. Wadi El-Ambagi is also home to the phosphate mine railway network (Figure 1). During the 1989 flash flood, a large section of this railway, which connects the Abu Tartour phosphate mine in the Western Desert of Egypt with the Hamrawein phosphate factory in Quseir, was completely destroyed. This flash flood also caused severe damage to the Qift–Quseir highway and the coastal highway (Quseir–Marsa Alam road) [9].
3. Materials and Methods
The lack of hydrological data for Wadi El-Ambagi creates the need for modeling techniques in order to predict the behavior of the basin during a flash flood and the dynamics of surface runoff from potential flood waters. Through the use of remote sensing and GIS techniques, land cover and topographic data are generated for input into hydrological and hydraulic models. The Army Corps of Engineers’ Hydrologic Modeling System (HEC-HMS) [16] was used to simulate the rainfall-runoff process, model the behavior of surface runoff through the generation of flood hydrographs for the main sub-basins of Wadi El-Ambagi, and measure the water access and loss in the study basin. The Army Corps of Engineers’ River Analysis System (HEC-RAS) [17] software was used to determine the route of runoff through stream channels and determine water surface profiles at specific locations along Wadi El-Ambagi’s stream network. This assists in measuring the spatial extent of the flooding, as well as the depth and water velocity in the downstream area of Wadi El-Ambagi at the city of Quseir.
Images from four sensors were utilized in the present work. Optical data consist of an ASTER image acquired in December 2006 with a spatial resolution of 15–90 m, and a stereo pair WorldView-2 image acquired in December 2006 with a spatial resolution of 2 m. The microwave dataset is composed of a Shuttle Radar Topography Mission (SRTM) digital elevation model (DEM) with a 30-m resolution and four ALOS-PALSAR scenes (L-band, HH-polarization, ascending orbit) acquired on January 2006, with a spatial resolution of 12.5 m. A simplified workflow of the used data and adopted methodology is shown in Figure 2.
3.1. Hydrologic Modeling and Generation of Hydrographs
The hydrologic model requires data representing the surface topography, land use and land cover data (LULC), as well as soil texture properties. The SRTM DEM covering Wadi El-Ambagi and the surrounding area was processed using HEC-GeoHMS software to delineate the drainage basin and its corresponding drainage network. The stream network was delineated using the 8D flow direction algorithm [18,19] (Figure 3a). The delineated drainage network was generated using a threshold of 300 cells, and was then compared against the actual drainage network from Google Earth Pro for model validation. Basin characteristics such as surface gradient, channel slope, and longest flow path were generated for use within the model to aid in determining the response of the basin to flood waters.
Flood waters that may be lost to infiltration were computed through the Soil Conservation Service’s Curve Number (SCS-CN) method developed by the US Department of Agriculture (USDA-SCS 1985). This method is suitable for humid, semi-arid, and arid conditions [6,12,20]. Surface runoff occurs after rainfall surpasses an initial abstraction () value. Rainfall excess () is associated with the effective precipitation, (), through a maximum potential retention value () as follows:
The initial abstraction () was approximated by the SCS to be 20% of the maximum potential retention. The retention factor is a function of an empirical curve number coefficient (), and can be determined by the following equation:
The () is a function of land cover and soil conditions, which can be estimated using published tables [21] including the following information: antecedent moisture condition, land cover/lithology type, and hydrological soil type. The antecedent moisture condition, which measures the soil wetness, is a function of the total rainfall in the five-day period preceding the storm [22]. Due to the arid climate of the present study area, a dry antecedent moisture condition is assumed [12].
The LULC layer for Wadi El-Ambagi was generated from ASTER multispectral images using ENVI 5.4 software. ASTER multispectral imagery for 2006 was obtained through the USGS Global Visualization Viewer (http://glovis.usgs.gov) and was chosen over LANDSAT satellite data due to the large number of spectral bands in the mid-infrared (MIR) portion of the spectrum, which are useful for mapping soil and lithology (Yamaguchi and Naito, 2003). ASTER has a total of 14 multispectral bands: three in the visible/near infrared (VNIR) with a 15-m spatial resolution, six in the mid-infrared (MIR) with a 30-m spatial resolution, and five in the thermal (TIR) with a 90-m spatial resolution (Figure 3b). A hybrid classification scheme was used to extract relevant classes from the minimum noise fraction (MNF) transform imagery, with ASTER used to distinguish basin rock types, and PALSAR used to differentiate between coarse, medium, and fine sediments along the drainage course. The MNF method was first applied to the image in order to remove noise and redundancy. A principal component analysis typically produces uncorrelated output bands to segregate noise components and reduce the dimensionality of datasets [23]. A hybrid classification scheme based on supervised (maximum likelihood) and unsupervised (K-means) classifications was then conducted on the MNF image to generate the final land cover and surface lithology map (Figure 3c,d). These classification techniques were used interchangeably to distill spectral information and force the classifier to differentiate between spectrally similar classes and create a classified image. A 1:500,000 geological map of Quseir area [24] was scanned, georeferenced, and clipped to the study area and used as a reference (Figure 3e). The accuracy of the combined land cover map derived from the hybrid image classification was estimated to be 89%, which was above the commonly specified target accuracy (85%) for many thematic maps [1].
The soil texture properties along the main wadi channel bed were mapped using PALSAR radar imagery (Figure 3f). Unlike multispectral satellite imagery, radar data provides surface roughness (grain size relative to the radar wavelength) that can be used to distinguish fine-grained from coarse-grained material [13,14,25]. Radar backscatter coefficient values extracted from radar data were correlated and checked in the field, confirming that radar wavelengths produced similar textural classes that correspond to specific grain or fragment sizes of alluvial deposits in dry lands [25]. Typically, fine-grained deposits appear dark due to the specular reflection of the radar wave away from the receiving antenna, whereas coarse deposits appear bright because of diffused reflection [19]. Radar data used for this study were obtained from the ALOS-PALSAR sensor. PALSAR is an active microwave sensor that provides full L-band synthetic aperture radar with dual polarization. Four PALSAR SAR scenes with a 12.5-m spatial resolution were mosaicked in order to cover the entire study area. The Frost Filter [26], with a kernel of 3 × 3, was then applied to reduce the speckled effect. The main drainage course of Wadi El-Ambagi was mapped through on-screen digitization from high spatial resolution images available in Google Earth Pro. The digitized drainage network was then used to clip the channel network from the SAR mosaic (Figure 4a). The latter SAR layer was then resampled to 30 m to match the spatial resolution of ASTER. An unsupervised classification using a K-means clustering algorithm was performed on the Wadi El-Ambagi channel course.
The assumption here is that wadi alluvial deposits are texturally very diverse, as they are made up of a range of rock fragment sizes. The classification resulted in three classes of material with different surface roughness properties: fine texture, moderate texture, and coarse texture (Figure 4b). Classes derived from ASTER and PALSAR image processing were combined and provided the foundation for the final CN layer.
The final CN grid indicates that the study area is composed of materials with two main rates of surface infiltration: high and low. Igneous and metamorphic rock types and desert pavement with low infiltration are assigned soil type D, while areas with high infiltration rates (e.g., sedimentary rocks, dry coarse-grained sand, and gravel) are assigned soil type A. Two different groups of classes are specified based on the classified wadi course and the classified drainage basin. Each class within the land cover map is assigned a CN based on the specified soil/rock type and the SCS curve number parameters, resulting in a range of CNs from 63% (coarse-grained material with moderate to high rates of infiltration) to 98% (metamorphic rocks with little to no infiltration).
The lag time for Wadi El-Ambagi was calculated using the delineated stream network, topographic information (e.g., basin and channel gradient, longest flow path), LULC, surface soil properties, and Muskingum parameters set at 0.2 [27]. Baseflow is reported as none due to the lack of groundwater accumulation in arid regions, and the commonly cited Muskingum method is selected for routing [1,6]. Two major rainstorms with intensities of 30 mm and 60 mm over a two-hour period were reported in the area [9,12], and resulted in a destructive flash floods with a depth of two meters in the town of Quseir. Accordingly, two hypothetical rainfall events using the same rainfall intensity and duration (30 mm and 60 mm h−1 over 2 h) were used, with an assumed equal distribution of precipitation across the basin. These values lie also within the range of rainstorms observed in Quseir town by the Egyptian Meteorological Authority in 1965, 1994, and 1996 [9,12]. It is worth mentioning here that although TRMM data and other satellite rainfall products performed well in wet regions during rainy seasons, these data showed limited performance in estimating precipitation over arid and semi-arid regions [28]. All of the derived parameters were used in the HMS model to generate the flow hydrographs and peak discharge of the main drainage basin of Wadi El-Ambagi and its associated five sub-basins.
3.2. Hydraulic Modeling and River Flood Visualization
HEC-RAS hydraulic modeling was utilized in this study to simulate the behavior of flow in the main channel and floodplain of the downstream area where the town of Quseir lies. The derived flow hydrographs were used as the main input for the hydraulic modeling. Among the required inputs for the hydraulic modeling is an estimated Manning’s n value (this value typically applies to uniform flow in open channels and is a function of the channel velocity, flow area, and channel slope), which can be generated from very high spatial resolution terrain and land cover data). A detailed LULC was extracted from the radiometrically calibrated and atmospherically corrected eight multispectral bands WorldView-2 (WV-2) using the K-means unsupervised classification. WV-2 imagery has a panchromatic band and eight multispectral bands with spatial resolutions of 0.46 m and 1.84 m, respectively. Five major classes were mapped, which include urban, vegetation, water, wadi course, and rocks/bare soil. Road networks and railroads were manually digitized from Google Earth Pro and added to the five classes to generate a combined seven-class LULC map (Figure 5). The resulted LULC map was used to estimate Manning’s n values, which are required for the model. To accurately model the spatial extent and depth of flood waters in the town of Quseir, it was imperative to use detailed terrain data. Here, a stereo pair WV-2 was used to generate a 2-m DEM for the downstream area of Wadi El-Ambagi near the outlet and town of Quseir (Figure 6) using the ENVI DEM Extraction Module. A good agreement was found between the derived DEM and several available height points for the downstream area of the study basin [29].
A stereo pair imagery is typically comprised of two images taken on the same orbital pass with a forward and a backward-looking view. The detailed topography provided by this 2-m DEM is better suited to delineate narrow river floodplains. The generated DEM was converted to a triangulated irregular network (TIN) to be used in a HecGeoRAS Module. TINs are a vector-based representation of a physical surface, and are often viewed as being advantageous over a raster DEM in flood mapping and surface analysis. TIN data were used to extract the necessary stream geometry, including stream centerline, main channel banks, flow path centerline, and cross sectional cut lines.
The LULC-derived Manning’s n values, the derived geometry data, and peak discharges generated from HMS were all used within the HEC-RAS software to model the flood depth, spatial extent, and water velocity in the downstream area. Two flood depth profiles were generated to provide the final flood spatial extent and depth layers for each of the specified flow rates. Areas with positive values are those that may experience inundation, while areas with negative values will remain safe from the inundation of flood waters.
4. Results
4.1. Flood Hydrographs and Peak Discharges
The results of this study provide a hydrological model representing the discharge rate of flood waters for the main outlet of the El-Ambagi drainage basin in Quseir. The model created hydrographs that report the amount of water discharging through the main outlet of the wadi, as well as the lag time and total peak discharge. The two hypothetical storms, 30 mm and 60 mm of precipitation over the course of two hours, were incorporated into the model. The results show that a rainstorm producing 30 mm of precipitation would cause the main outlet of the wadi to experience a peak discharge rate of 165 m3 s−1. Additionally, results show that a 60-mm rain event would result in a surge of water inundating the town of Quseir within 14 hours at a maximum peak flow of 875 m3 s−1 (Figure 7). Such high peak flows can be attributed to the morphometric characteristic of the drainage basin of Wadi El-Ambagi. Catchment area, basin slope, drainage density, basin ruggedness number, surface properties, channel gradient, and land cover types are among the morphometric characteristics that can be used to explain the hydrological response of a drainage basin [6].
Analysis indicated that Wadi El-Ambagi is massive in size, and harvests rainwater from a total catchment area of about 1540.4 km2. The drainage basin has an overall moderate slope of 11.5°, a relatively moderate to high channel gradient of 6.3°, and consists of 44% impermeable outcrops with almost no vegetation cover. These parameters are characteristic of a drainage basin that would typically experience high peak flow rates, which could lead to major flash floods. The El-Ambagi basin has a relatively moderate drainage density of 0.55 km/km2 with a ruggedness number of 0.57. Drainage density reflects the efficiency of a basin in removing excess precipitation [30]. Ruggedness number is derived from information about basin relief and associated drainage density. This morphometric parameter is a dimensionless number that expresses the geometric characteristics of a drainage system. Typically, peak flow rises with increasing basin ruggedness [31], which is due to the improved efficiency of the drainage network as a result of the increased stream density and basin relief [30]. The moderate ruggedness number for the basin represents an increasing peak flow rate [31], further confirming Wadi El-Ambagi’s risk for flash flooding. Additionally, the drainage basin of Wadi El-Ambagi has an overall pear shape with the narrowest portion being at the outlet.
Moreover, the produced surface roughness unexpectedly shows the abundance of coarse texture materials (pebble, cobble, and bolder) along the main channel course of the downstream area of Wadi El-Ambagi. The dominance of coarse-grained alluvial deposits along the main wadi bed indicates a low infiltration rate and high surface runoff, and accordingly, an increased flash flood hazard in the event of a rainstorm. The narrowing of the channel course where the confluences of three main sub-basins meet (basins 2, 3, and 4) causes a frequent concentration of floodwaters, and hence increases the destructive effect of the flow during intense rainstorms. Furthermore, the average lag time for the basin is short, with lag times under one hour. Since lag time defines the amount of time between rainfall being in excess and the time in which it begins to runoff, basins with short lag times are at a greater risk of flash flooding than those with longer lag times. The curve numbers for El-Ambagi range from 63 to 98 with an overall average CN of 74, and the most dominant single rock type being clastic. However, more than 50% of the basin is made up of igneous, metamorphic, and metasediment, which have little to no infiltration capacity. Areas with higher CN values are typically prone to increased surface runoff due to the lack of permeability within the drainage basin [6].
The analysis shows that within the El-Ambagi watershed, there are 36 sub-basins that drain toward the Qift–Quseir highway: 18 basins from the north and 18 from the south. The hazard level demonstrated by each sub-basin, as shown in Figure 8 and Table 1, varies in regard to their physiographic characteristics, drainage network, and soil properties.
Due to these differences, the behavior of surface runoff also varies, and as a result, has different effects on the Qift–Quseir highway. Of the 36 sub-basins, one sub-basin, basin 24, was determined to be of very high risk as a result of its high drainage density (0.90), moderately steep slope, large catchment area (570.2 km2), and moderate CN (83.7). The outlet of this sub-basin intersects with the Qift–Quseir highway and poses a great risk at this locality. This exact site, located approximately 14 km from the town of Quseir, has been reported to have suffered significant flood damage during the 1994 and 1996 flash floods [29]. At this site, a 50-m road segment, along its southern flank, was severely eroded by the flood water that reached a depth of 1 m [29]. Such field observation validates the used methodology and confirms the hazard vulnerability inferred from the adopted model. A close-up look at this site shows traces of surface runoff flowing toward the Qift–Quseir Highway and causing road erosion at this locality (Figure 8). Three of the sub-basins, basins 18, 25, and 31, were determined to be of high risk, whereas the remaining 32 of the sub-basins were classified as moderate to moderate–high risk mainly due to their less dense drainage network and lower CNs, and thus relatively higher surface water loss (Figure 8).
4.2. Flood Depth and Water Velocity
The results revealed that flood depths for the downstream area of Wadi El-Ambagi, where the town of Quseir lies, can reach up to 2 m (Figure 9 and Figure 10). A similar water depth that ranges between 1–2 m has been observed and reported in Quseir during the 1994 and 1996 flash floods [29]. A hypothetical precipitation events with a peak flows of 82.5 m3 s−1 and 165 m3 s−1 (50-year flood) would inundate sections of the town with water depths of up to 1 m. This depth would increase to 2 m in the southern town area, as a result of a peak flow of 875 m3 s−1. Away from the town toward the upper stream area, where the channel becomes very narrow, the water depth will exceed the 3 m in some localities with lower topography. A hypothetical extreme case scenario of intense precipitation with a peak flow of 1585 m3 s−1 would surge the southern section of the town of Quseir with flood waters above 3 m in depth (Figure 10). With many homes at the southern section of Quseir situated within the wadi course, risk from flood inundation remains a concern. It is estimated that flood waters of these magnitudes (875 m3 s−1 and 1585 m3 s−1) would inundate at least 217 buildings within the town of Quseir, which covers about 411,000 m2 of residential area (Figure 11). Additionally, segments of the Qift–Quseir highway totaling 7 km and 1.43 km of the railroad, which are currently used by the phosphate mines, would be flooded and potentially washed away (see Figure 11).
The modeled velocities along the main course of Wadi El-Ambagi range from 1.03 m s−1 and 6.13 m s−1 (Figure 12), with higher velocities occurring mostly in the area where the three main sub-basins (basins 2, 3, and 4) merge. A surface water velocity with a similar value of 6 m s−1 was reported in drainage basins in neighboring wadis and similar arid regions [32,33,34] supporting the model results. High water velocities are observed along segments with a narrow channel course due to the concentration of flood waters, whereas low water velocities are located along the wider and flat channel course near the main outlet (Figure 12).
5. Discussion and Flood Mitigation
All of the GIS-based flood inundation modeling, including the one adopted in this study, rely primarily on the use of DEMs. The use of publicly available DEMs, such as SRTM and ASTER-GDEM, are suitable for delineating large drainage basins such as Wadi El-Ambagi and modeling their discharge and peak flows. However, the spatial resolution of these DEMs (30 m) was too coarse and thus challenging for the accurate mapping of flood extents and depths within the wadi’s narrow courses. In contrast, the cost-effective DEMs produced from very high resolution satellite stereo-pair images, such as the one used in this study, offer a highly detailed DEM that enables more affordable and better flood delineation, and accurately model inundation along narrow low-laying floodplains. This work has also demonstrated that in drylands, the use of satellite radar data enables a better mapping of the wadi floor with different soil texture classes. Fusing these microwave-derived classes with optical satellite data can be of fundamental help for generating better LULC, which is one of the key inputs for flash flood modeling.
Here, we explored the use of space-based data with hydrological and hydraulic flood models to simulate flood discharge and predict flood prone areas in a data scarce region in the mountainous eastern desert of Egypt. This approach could be implemented on similar ungauged wadi courses in the area, and the outcomes can contribute toward efficient flood risk management decisions for flood mitigation and the establishment of early flood warning systems in the region.
Quseir is expanding, in particular along the course of Wadi El-Ambagi. In places, attempts have been made to minimize potential flood damage by building on top of sediment rock hills, but these locations may still be sensitive to lateral erosion from flood waters, and may still be at risk from hazards associated with flash flood events. The historical importance of Quseir, and its hyper-arid climate, make implementing mitigation efforts essential to stopping the flow of flood waters, and ideally storing this freshwater for future use. A few protective measures have been undertaken recently in Wadi El-Ambagi to alleviate the flood damage in the town of Quseir and the Qift–Quseir highway that connects it to the Nile Valley. Amongst these mitigation measures are the construction of three small detention dams (roughly 1 km apart) across the downstream area to reduce the speed of flood water and create an artificial lake behind the first dam to reduce flood power.
In dry regions such as this, this lake could contribute to the recharging of the local aquifer, and its water could potentially be utilized for domestic use. Many segments of the highway were also lowered to the wadi floor’s level in order to avoid water blocking and hence erosion along the highway sides during flash flood events.
Several methods of mitigating flood waters are cited in the literature. As suggested by Geriesh et al. [35], cisterns can be constructed in an effort to stop flood waters and store them for future use. The suggested type of cistern is one that is constructed underground, allowing it to collect runoff, as well as any available groundwater, for storage. Additionally, storage dams should be considered in the area. This method would benefit the region in two ways: first, to store flood waters, and second, to slow the flow, which would allow for an increase in infiltration and evacuation time for residents [35,36]. A flash flood study in the Red Sea Coast of Egypt [37] suggested another method of flood mitigation in which spur dyke dams are constructed to slow the velocity of flood waters. These dams are built using heaps of boulders secured with wire netting in a zigzag pattern. This method allows the infiltration of a portion of the floodwaters, and thus preserves the integrity of the dam in the event of an intense flood [37]. Another method of mitigating flood waters is the construction of cross openings or channels positioned parallel to the direction of flow and at right angles of roadways [36]. This method of mitigation, while not as effective in storing floodwaters, may be a more economical solution. A more recent study in the northwestern part of Kumtag Desert [38] proposed the construction of long parallel dams that form a comb-like structure in order to divert the flood water into desert low-lying areas where it gets filtered through sandy surface soil. The purified water will then get collected in desert artificial lakes, and could be used to support irrigated croplands, fish farming, and the initiation of wetlands. Adopting this approach in the Yangguan Town in dryland China was proven to be successful in reducing the flash flood risk and transforming it into a freshwater resource. In the dryland region of Egypt, where water is scarce, flash floods are valuable freshwater resources that should be exploited.
Methods of warning residents of potential floods have been used in the past, as noted in the literature. An early warning system would inform residents of an impending flood prior to its arrival, thus enabling a timely evacuation [39]. Determining whether or not to issue a warning can be concluded based on forecasted precipitation, volume of runoff, flow rates, and flood depth [11]. As of 2012, the first early warning system used in Arab nations is being utilized and tested by the Water Resources Research Institute in Cairo, Egypt [11]. This system delivers a warning to registered residents at two different stages: the first warning is delivered after rainfall levels reach 10 mm within a six-hour period, and the second warning is delivered when precipitation levels reach 15 mm. These warnings are delivered via e-mail, but will be delivered via SMS text message in the future [11]. This type of warning system would benefit the residents of the town of Quseir by providing ample warning, allowing for evacuation.
6. Conclusions
Flash floods are a highly misunderstood hazard due to the infrequent nature of their occurrence and the lack of available data. This research reaffirms geospatial technologies as a useful and practical tool for flash flood studies across large remote areas with data scarcity. The results indicated that locations at risk of high peak flow rates may be predicted using remote sensing, GIS, hydrological modeling, and a numerical simulation in which key parameters were derived from satellite data (both passive and active).
For this paper, flash flooding in Wadi El-Ambagi was predicted using a hydrologic model along with several types of spatial data. Here, the remote sensing data was used to construct variable layers required for flood modeling such as elevation, lithology/land cover, and curve number. It was found that the availability of archival remote sensing data such as SRTM, ASTER, and PALSAR could be successfully used to better predict locations at risk from flash floods. Additionally, the current work indicated that, unlike the relatively coarse resolution of the SRTM, the very fine resolution topographic data derived from stereo pair satellite images, such as WV-2, offers a highly detailed DEM that enables the better prediction of the flash flood threat with a higher accuracy.
Moreover, the incorporation of PALSAR radar data enabled the mapping of different soil textures along the main channel bed for better understanding of flood water that may be lost to infiltration in the event of a rainstorm. The combining of these radar data with ASTER multispectral images enabled the production of a hybrid land cover map that contains spectral and texture information, and thus compensates for the limitation of using a single data product alone.
Integrating the above data and techniques assists in determining the hydrological response of an ungauged drainage basin to intense precipitation in an arid environment, as well as locating potential sites at risk of flash flooding. Physiographic characteristics and modeled hydrographs show that the study basin has an overall moderate lag time and a high peak flow rate that assists in understanding the hydrological response of Wadi El-Ambagi. Little vegetation cover and the dominant rock type being mostly impermeable basement rocks correlate with high peak flow rates for the region.
Hydrologic modeling and resulting hydrographs indicate that rainfall events with intensities of 30 mm and 60 mm over 2 hours would generate peak discharges of 165 m3 s−1 and 875 m3 s−1, respectively. Hydraulic modeling provides data illustrating the effects of these peak flow rates on the town of Quseir, with potential flood depths ranging from a few centimeters to two meters. With the highest flood magnitude, a large portion of the southern section of the town, including 217 buildings, would be inundated. Additionally, at least 7 km of the main highway and 1.43 km of the railroad used by the phosphate mining industry would be flooded and potentially washed away. Furthermore, the results indicate that during major flood events, surface water would discharge directly to the Qift–Quseir highway and damage parts of it. Analysis indicated that the site where the largest sub-basin of Wadi El-Ambagi intersects with the Qift–Quseir highway is at constant risk of damaged by flood water. This conclusion was supported by an earlier study that reported an extensive erosion to the same spot on that highway during the 1994 and 1996 flash floods. Therefore, this section of the highway should be better protected to withstand the force of floodwaters. This information is essential for future planning purposes in the region, and could be used to help decision makers enact appropriate protection measures to alleviate the effects of flash flooding. The integrated geospatial techniques used in this research offer the ability to locate areas at risk of flash flood that could be adopted, with appropriate modifications, for other desert coastal regions worldwide where data is scarce.
Author Contributions
J.M. and E.G. have equally developed the research framework, processed the data, wrote the manuscript and created the figures.
Funding
This research received no external funding.
Acknowledgments
The authors would like to thank NASA, JAXA, and the Alaska Satellite Facility for providing the PALSAR data. Thanks also goes to the UNCW-RSRL for funding the Worldview-2 Stereo Pairs. Thanks also go to the editor and the four anonymous reviewers, whose comments have helped to improve the overall quality of this paper.
Conflicts of Interest
The authors declare no conflict of interest.
References
- Foody, G.; Ghoneim, E.; Arnell, N. Predicting locations sensitive to flash flooding in an arid environment. J. Hydrol. 2004, 292, 48–58. [Google Scholar] [CrossRef]
- Lin, X. Flash Floods in Arid and Semi-Arid Zones; The United Nations Educational, Scientific and Cultural Organization: Paris, France, 1999. [Google Scholar]
- Halbert, K.; Nguyen, C.C.; Payrastre, O.; Gaume, E. Reducing uncertainty in flood frequency analyses: A comparison of local and regional approaches involving information on extreme historical floods. J. Hydrol. 2016, 541, 90–98. [Google Scholar] [CrossRef]
- Greenbaum, N.; Margalit, A.; Schick, A.P.; Sharon, D.; Baker, V.R. A high magnitude storm and flood in a hyperarid catchment, nahal zin, negev desert, israel. Hydrol. Processes 1998, 12, 1–23. [Google Scholar] [CrossRef]
- Ghoneim, E.; Arnell, N.; Foody, G. Characterizing the Flash Flood Hazards Potential along the Red Sea Coast of Egypt; IAHS Publisher: Wallingford, UK, 2002; Volume 271. [Google Scholar]
- Ghoneim, E. Optimum groundwater locations in the northern united arab emirates. Int. J. Remote Sens. 2008, 29, 5879–5906. [Google Scholar] [CrossRef]
- Yang, L.; Smith, J.; Baeck, M.L.; Morin, E.; Goodrich, D. Flash flooding in arid/semiarid regions: Dissecting the hydrometeorology and hydrology of the 19 August 2014 storm and flood hydroclimatology in arizona. J. Hydrometeorol. 2017, 18, 3103–3123. [Google Scholar] [CrossRef]
- Ghoneim, E.; Foody, G. Assessing flash flood hazard in an arid mountainous region. Arabian J. Geosci. 2013, 6, 1191–1202. [Google Scholar] [CrossRef]
- Badawy, M. Applications of Remote Sensing and Geographic Information Systems in Geomorphological Studies: Safaga-el Quseir Area, Red Sea Coast, Egypt as an Example. Ph.D. Thesis, University of Main, Mainz, Germany, 2008. [Google Scholar]
- Schick, A.P.; Grodek, T.; Wolman, M.G. Hydrologic processes and geomorphic constraints on urbanization of alluvial fan slopes. Geomorphology 1997, 31, 325–335. [Google Scholar] [CrossRef]
- Cools, J.; Vanderkimpen, P.; El Afandi, G.; Abdelkhalek, A.; Fockedey, S.; El Sammany, M.; Abdalla, G.; El Bihery, M.; Bauwens, W.; Huygens, M. An early warning system for flash floods in hyper-arid Egypt. Nat. Hazards Earth Syst. Sci. 2012, 12, 443–457. [Google Scholar] [CrossRef] [Green Version]
- Gheith, H.; Sultan, M. Construction of a hydrologic model for estimating wadi runoff and groundwater recharge in the eastern desert, Egypt. J. Hydrol. 2002, 263, 36–55. [Google Scholar] [CrossRef]
- Ghoneim, E. Ibn-batutah: A possible simple impact structure in southeastern Libya. Geomorphology 2009, 103, 340–350. [Google Scholar] [CrossRef]
- Ghoneim, E. Rimaal: A sand buried structure of possible impact origin in the sahara: Optical and radar remote sensing investigation. Remote Sens. 2018, 10, 1–17. [Google Scholar] [CrossRef]
- Azab, M.A. Flood hazard between marsa alam–ras banas, red sea, Egypt. In Proceedings of the 4th Environmental Conference, Zagazig, Egypt, 4–6 April 2009; pp. 17–35. [Google Scholar]
- USACE. Hec-Hms Hydrologic Modeling System Applications Guide; Hydrologic Engineering Center: Davis, CA, USA, 2008. [Google Scholar]
- USACE. Hec-Ras Hydraulic Modeling System User’s Manual; Hydrologic Engineering Center: Davis, CA, USA, 2010. [Google Scholar]
- Maidment, D.R. Handbook of Hydrology; McGraw-Hill: New York, NY, USA, 1993. [Google Scholar]
- Ghoneim, E.; Benedetti, M.; El-Baz, F. An integrated remote sensing and gis analysis of the kufrah paleoriver, Eastern Sahara, Libya. Geomorphology 2012, 139, 242–257. [Google Scholar] [CrossRef]
- Sosnowski, A.; Ghoneim, E.; Burke, J.J.; Hines, E.; Hals, J. Remote regions, remote data: A spatial investigation of precipitation, dynamic land covers, and conflict in the sudd wetland of South Sudan. Appl. Geography 2016, 69, 51–64. [Google Scholar] [CrossRef]
- U.S. Department of Agriculture, Soil Conservation Service. National Engineering Handbook; Section 19, Construction Inspection; U.S. Department of Agriculture, Soil Conservation Service: Washington, DC, USA, 1985.
- McCuen, R.H. A Guide to Hydrologic Analysis Using Scs Methods; Englewood Cliffs, Prentice-Hall: New York, NY, USA, 1982. [Google Scholar]
- Richards, J.A. Remote Sensing Digital Image Analysis: An Introduction; Springer: Berlin, Germany, 1999. [Google Scholar]
- Klitzsch, E.; Pohlmann, G. Geological Map of Egypt, 1:500,000, Quseir, Sheet Number Ng35ne, Cairo, Egypt; Egyptian General Petroleum Corporation and Technische Fachhochschule Berlin: Berlin, Germany, 1987. [Google Scholar]
- Gaber, A.; Koch, M.; El-Baz, F. Textural and compositional characterization of wadi feiran deposits, sinai peninsula, Egypt, using radarsat-1, palsar, srtm and etm+ data. Remote Sens. 2010, 2, 52–75. [Google Scholar] [CrossRef] [Green Version]
- Shi, Z.; Fung, K.B. A Comparison of Digital Speckle Filters. In Proceedings of the International Geoscience and Remote Sensing Symposium (IGARSS), Pasadena, CA, USA, 8–12 August 1994. [Google Scholar]
- Chow, V.T.; Maidment, D.R.; Mays, L.W. Applied Hydrology; McGraw-Hill: New York, NY, USA, 1988. [Google Scholar]
- Xie, P.; Yatagai, A.; Chen, M.; Hayasaka, T.; Fukushima, Y.; Liu, C.; Yang, S. A gauge-based analysis of daily precipitation over east Asia. J. Hydrometeorol. 2007, 8, 607–626. [Google Scholar] [CrossRef]
- Nassar, W. The Impact of the Natural Disasters on Replanning of the Disaster Zones; Ain Shams University: Ain Shams, Egypt, 2001. [Google Scholar]
- Patton, P.C.; Baker, V.R. Morphometry and floods in small basins subject to diverse hydro-geomorphic controls. Water Resour. Res. 1976, 12, 941–952. [Google Scholar] [CrossRef]
- Parker, R.S. Experimental Study of Drainage Basin Evolution and Its Hydrological Implications; Colorado State University Hydrology: Fort Collins, CO, USA, 1977. [Google Scholar]
- Allam, M.; Balkhair, K. Case study evaluation of the geomorphic instantaneous unit hydrograph. Water Resour. Manag. 1987, 1, 267–291. [Google Scholar] [CrossRef]
- Reid, I.; Laronne, J.; Powell, M. Flash-flood and bedload dynamics of desert gravel-bed streams. Hydrol. Processes 1998, 12, 543–557. [Google Scholar] [CrossRef]
- Kehew, A.; Milewski, A.; Soliman, F. Reconstructing an extreme flood from boulder transport and rainfall–runoff modelling: Wadi isla, South Sinai, Egypt. Glob. Planet. Chang. 2010, 70, 64–75. [Google Scholar] [CrossRef]
- Geriesh, M.H.; El-Rayes, A.; Fouad, A. Runoff control and management in wadi ghweiba hydrographic basin, northwest of gulf of Suez region, Egypt. In Proceedings of the 7th Conference Geology of Sinai for Development, Ismailia, Egypt, 2004; pp. 53–67. Available online: https://www.researchgate.net/publication/244642965_Runoff_control_and_management_in_Wadi_Ghweiba_hydrographic_basin_northwest_of_Gulf_of_Suez_region_Egypt (accessed on 5 July 2018).
- Zaid, M.Z. Potential of flash flooding of the drainage basins of quseir area and risk evaluation. In Proceedings of the Fourth Environmental Conference, Zagazig, Egypt, 2009; Faculty of Science, Zagazig University: Zagazig, Egypt, 2009; pp. 1–16. Available online: https://www.researchgate.net/publication/271212556_POTENTIONAL_OF_FLASH_FLOODING_OF_THE_DRAINAGE_BASIN_OF_QUSEIR_AREA_A_RISK_EVALUATION (accessed on 5 July 2018).
- Abdalla, F.; El Shamy, I.; Bamousa, A.O.; Mansour, A.; Mohamed, A.; Tahoon, M. Flash floods and groundwater recharge potentials in arid land alluvial basins, southern red sea coast, Egypt. Int. J. Geosci. 2014, 5, 971–982. [Google Scholar] [CrossRef]
- Zhang, J.; Yu, Z.; Yu, T.; Si, J.; Feng, Q.; Cao, S. Transforming flash floods into resources in arid China. Land Use Policy 2018, 76, 746–753. [Google Scholar] [CrossRef]
- Vanderkimpen, P.; Rocabado, I.; Cools, J.; El-Sammany, M.; Abdelkhalek, A. Flaflom—An early warning system for flash floods in Egypt. WIT Trans. Ecol. Environ. 2010, 133, 193–202. [Google Scholar]
Figure 1.
Map of the study region. Rectangular box indicates the study area of Wadi El-Ambagi on the Red Sea coast.
Figure 1.
Map of the study region. Rectangular box indicates the study area of Wadi El-Ambagi on the Red Sea coast.

Figure 2.
Simplified workflow for the used data and adopted methodology.

Figure 3.
Hydrological and surface properties of Wadi El-Ambagi watershed: (a) Drainage basin and stream network of Wadi El-Ambagi, (b) ASTER color composite mosaic (bands 3, 2, and 1), (c) Aster derived Minimum Noise Fraction (MNF) image, (d) Land cover map derived from hybrid image classification, (e) 1: 500,000 geological map and (f) ALOS-PALSAR mosaic for the drainage basin.

Figure 4.
The alluvial deposits of the main channel course of Wadi El-Ambagi (the main channel course was mapped through on-screen digitizing from Google Earth Pro). (a) ALOS-PALSAR illustrating different surface roughness properties of wadi course, and (b) Surface textures of wadi alluvial deposits.

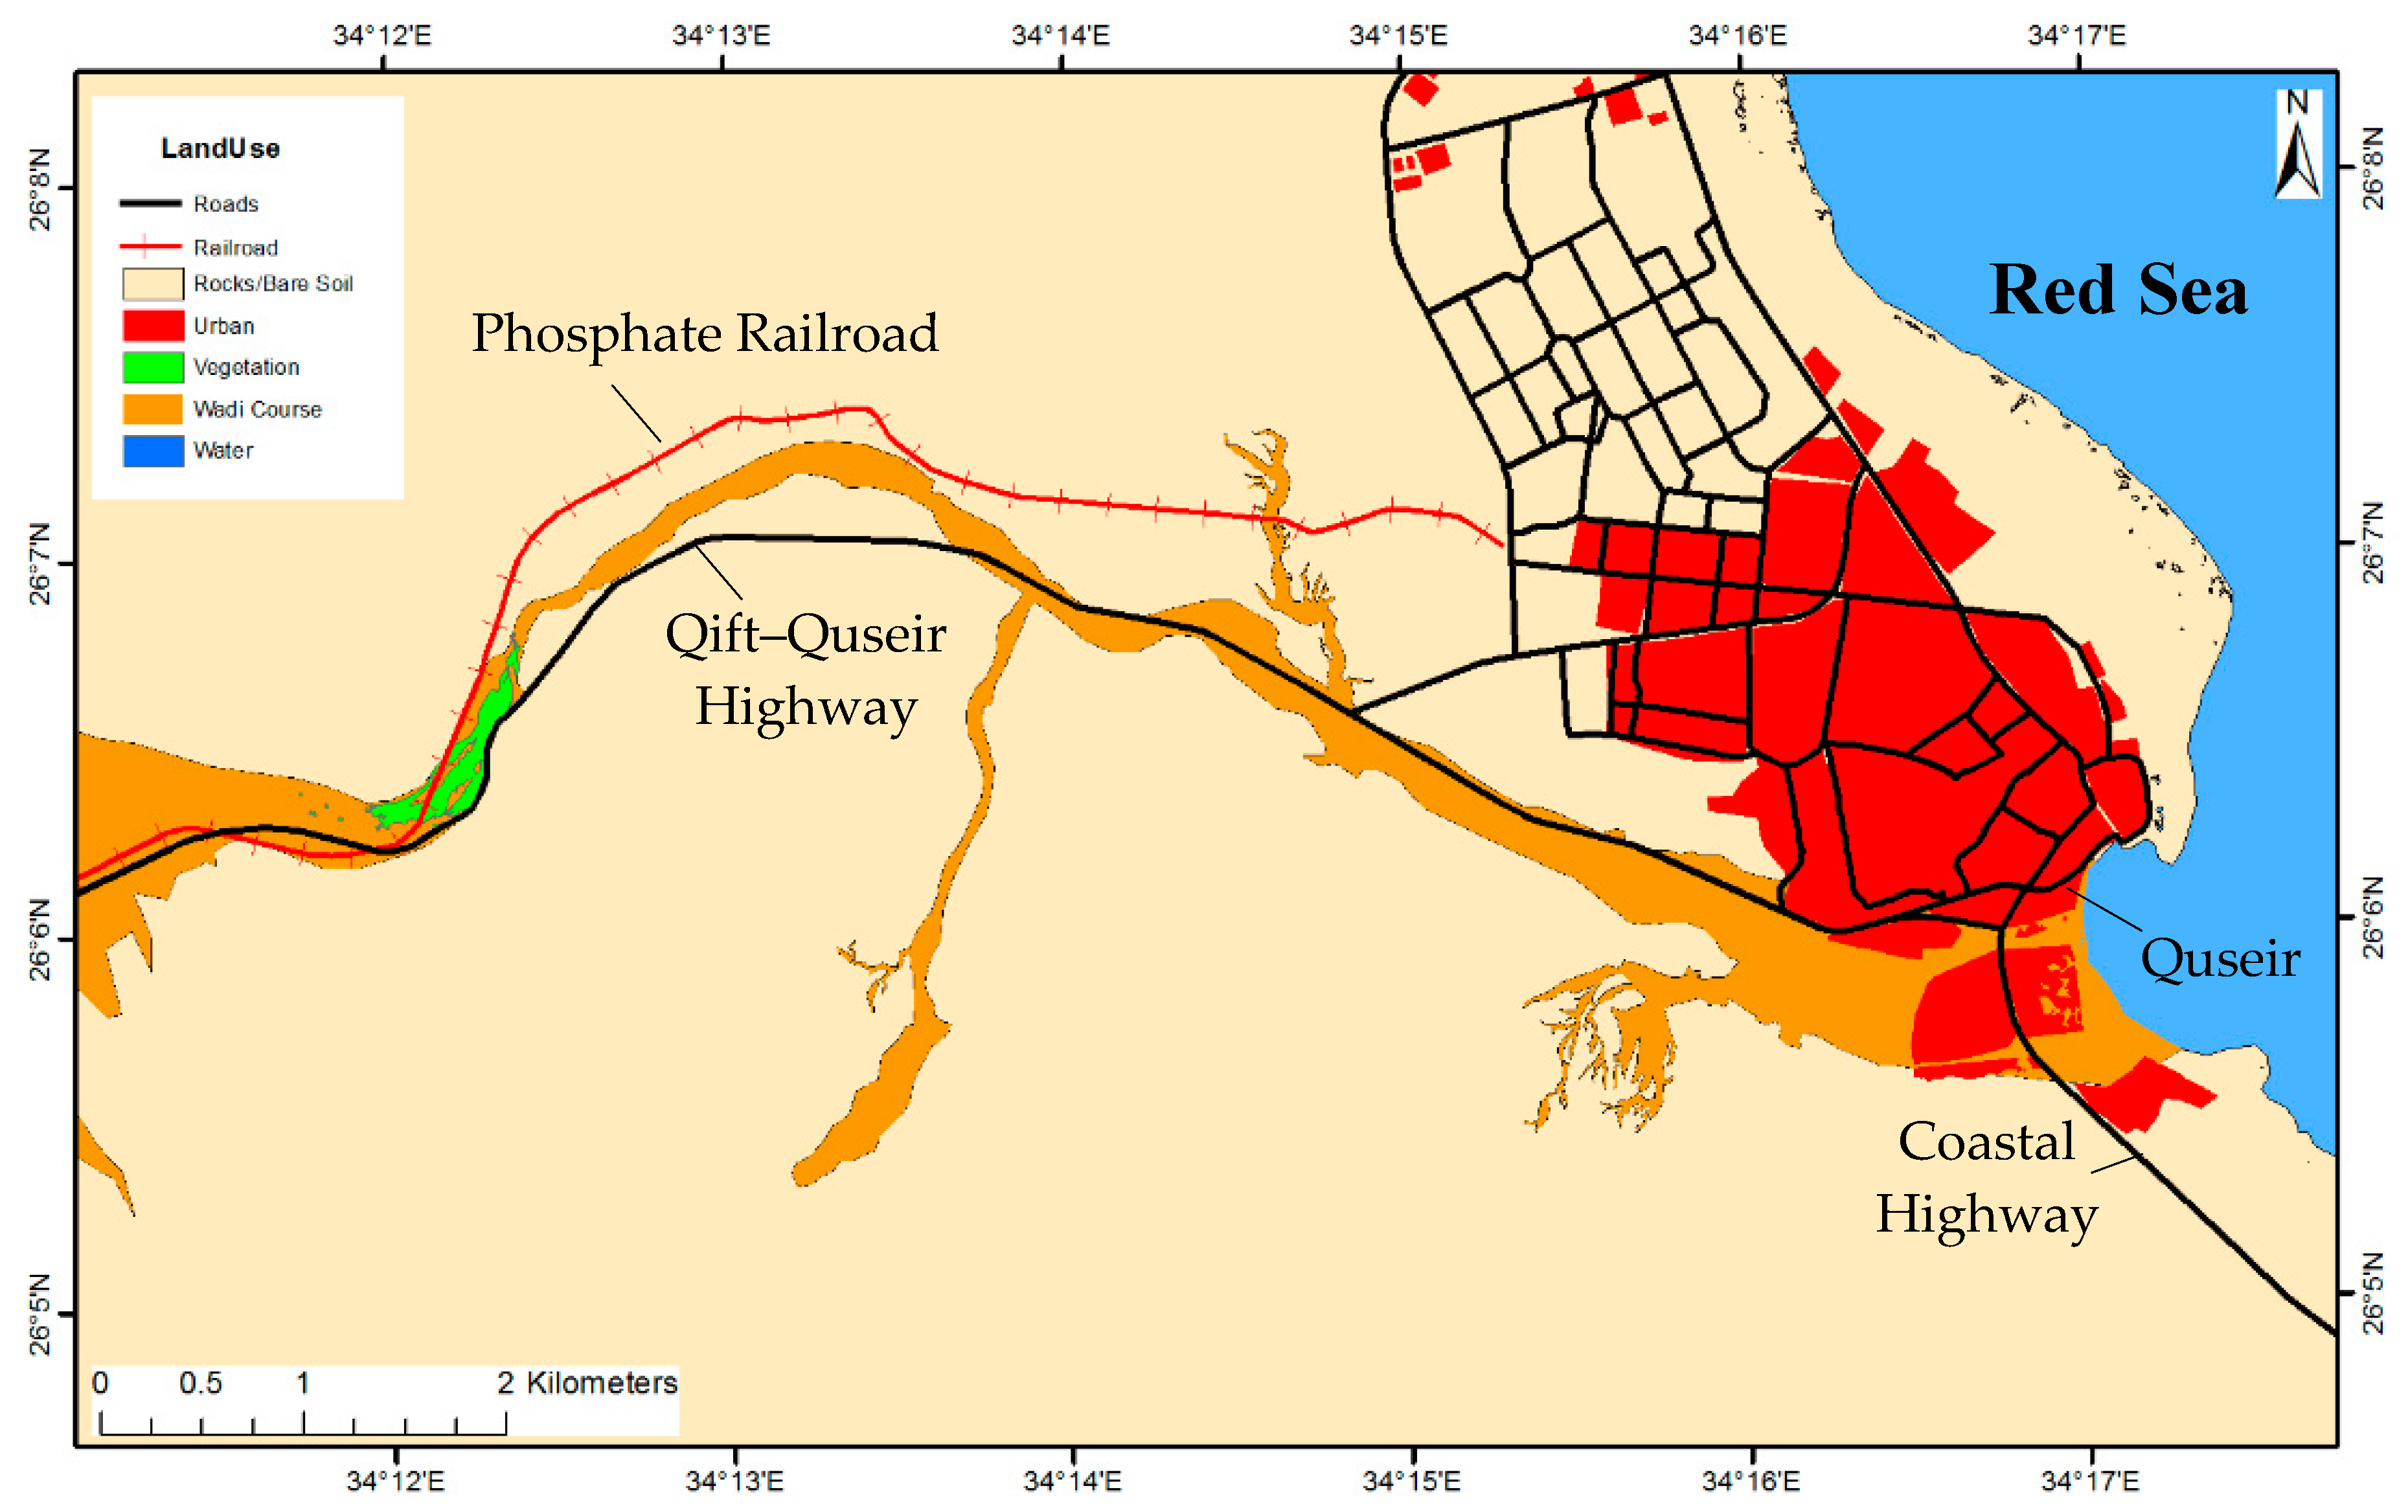
Figure 5.
WV-2 derived land use land cover (LULC) for the downstream area of Wadi El-Ambagi.

Figure 6.
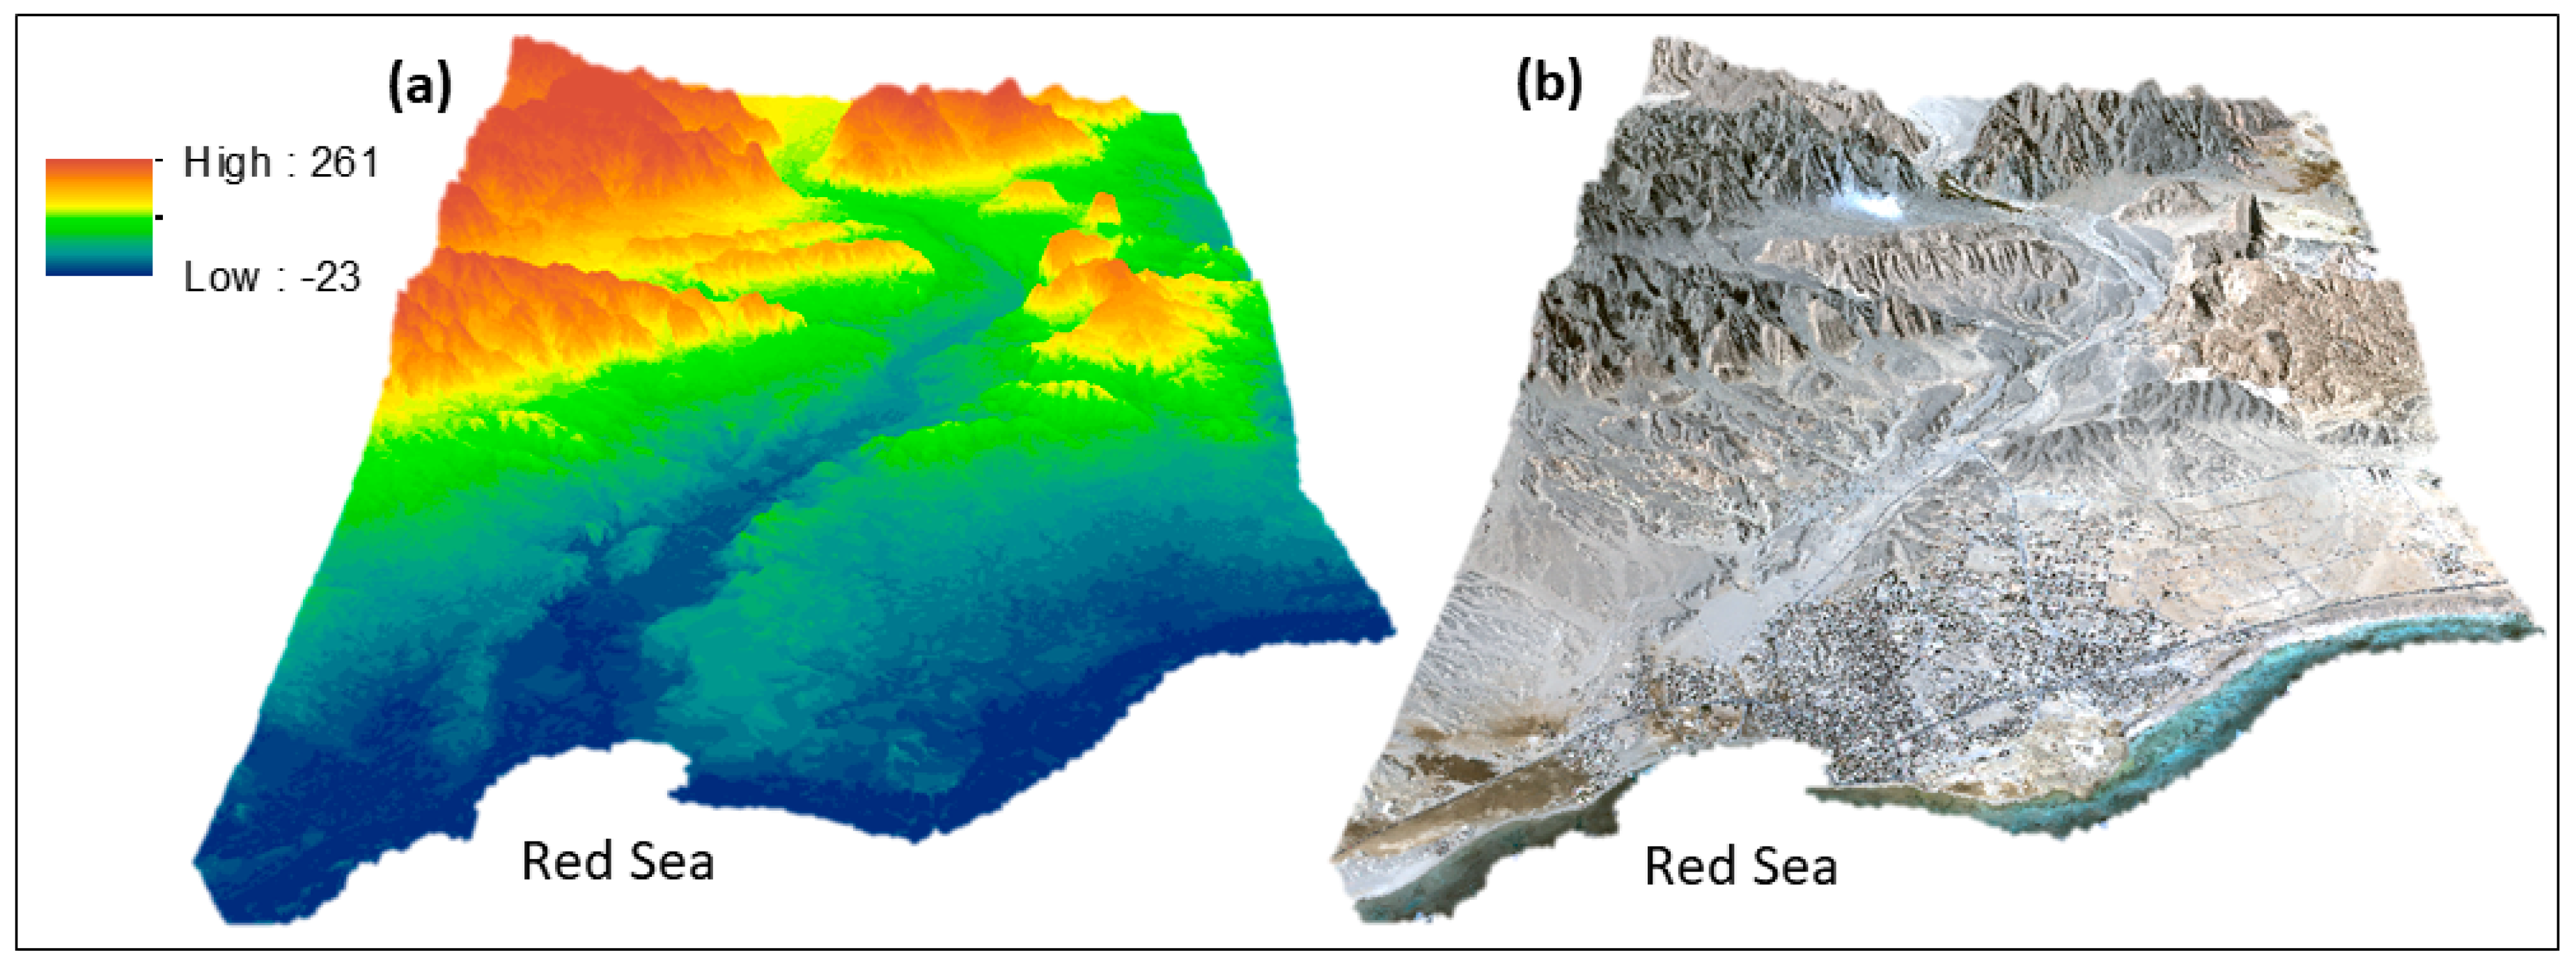
An oblique, three-dimensional (3D) perspective of the downstream area of Wadi El-Ambagi. (a) WorldView-2 (WV-2) stereo pair derived digital elevation model (DEM) and (b) WV-2 multispectral imagery superimposed on the 2-m DEM.
Figure 6.
An oblique, three-dimensional (3D) perspective of the downstream area of Wadi El-Ambagi. (a) WorldView-2 (WV-2) stereo pair derived digital elevation model (DEM) and (b) WV-2 multispectral imagery superimposed on the 2-m DEM.

Figure 7.
The modeled hydrographs showing the range of discharges predicted for the main five sub-basins of Wadi El-Ambagi under 2-hour hypothetical rainstorms of 30 mm (left) and 60 mm (right).
Figure 7.
The modeled hydrographs showing the range of discharges predicted for the main five sub-basins of Wadi El-Ambagi under 2-hour hypothetical rainstorms of 30 mm (left) and 60 mm (right).

Figure 8.
Illustrates the 36 sub-basins that drain toward the Qift–Quseir Highway. The figure highlights the hazard levels of these sub-basins in regard to their physiographic characteristics, drainage network, and soil properties. Right: A close-up look to the site categorized as very high flood risk. It shows traces of surface runoff flowing toward the Qift–Quseir Highway and causing road erosion at this locality (Source: Google Earth Pro).

Figure 9.
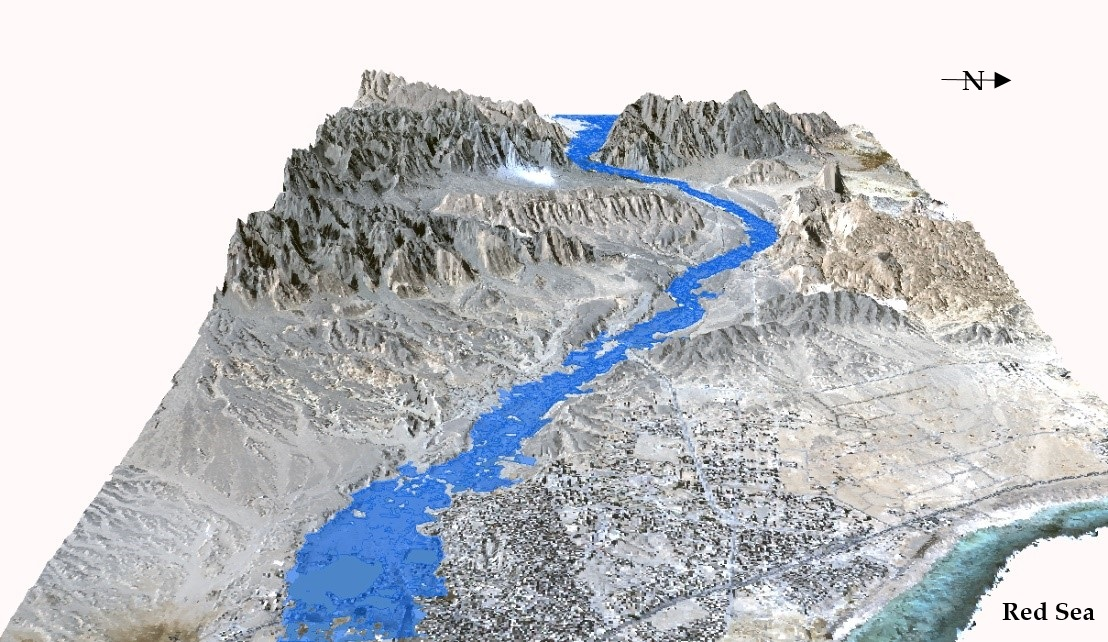
Modeled flood map for the downstream area of Wadi El-Ambagi based on a 60-mm precipitation event with a peak flow of 875 m3 s−1 m3 s−1. This flood would surge the eastern flank of the town of Quseir with flood waters up to 2 m deep.
Figure 9.
Modeled flood map for the downstream area of Wadi El-Ambagi based on a 60-mm precipitation event with a peak flow of 875 m3 s−1 m3 s−1. This flood would surge the eastern flank of the town of Quseir with flood waters up to 2 m deep.

Figure 10.
Flood simulations using hypothetical precipitation events and resulting peak flows. A hypothetical precipitation event with a peak flows of 82.5 and 165 m3 s−1 would inundate the southern section of the town of Quseir with water depths of up to 1 m. The depth would increase to 2 m and 3 m as a result of peak flows of 875 m3 s−1 and 1585 m3 s−1, respectively.

Figure 11.
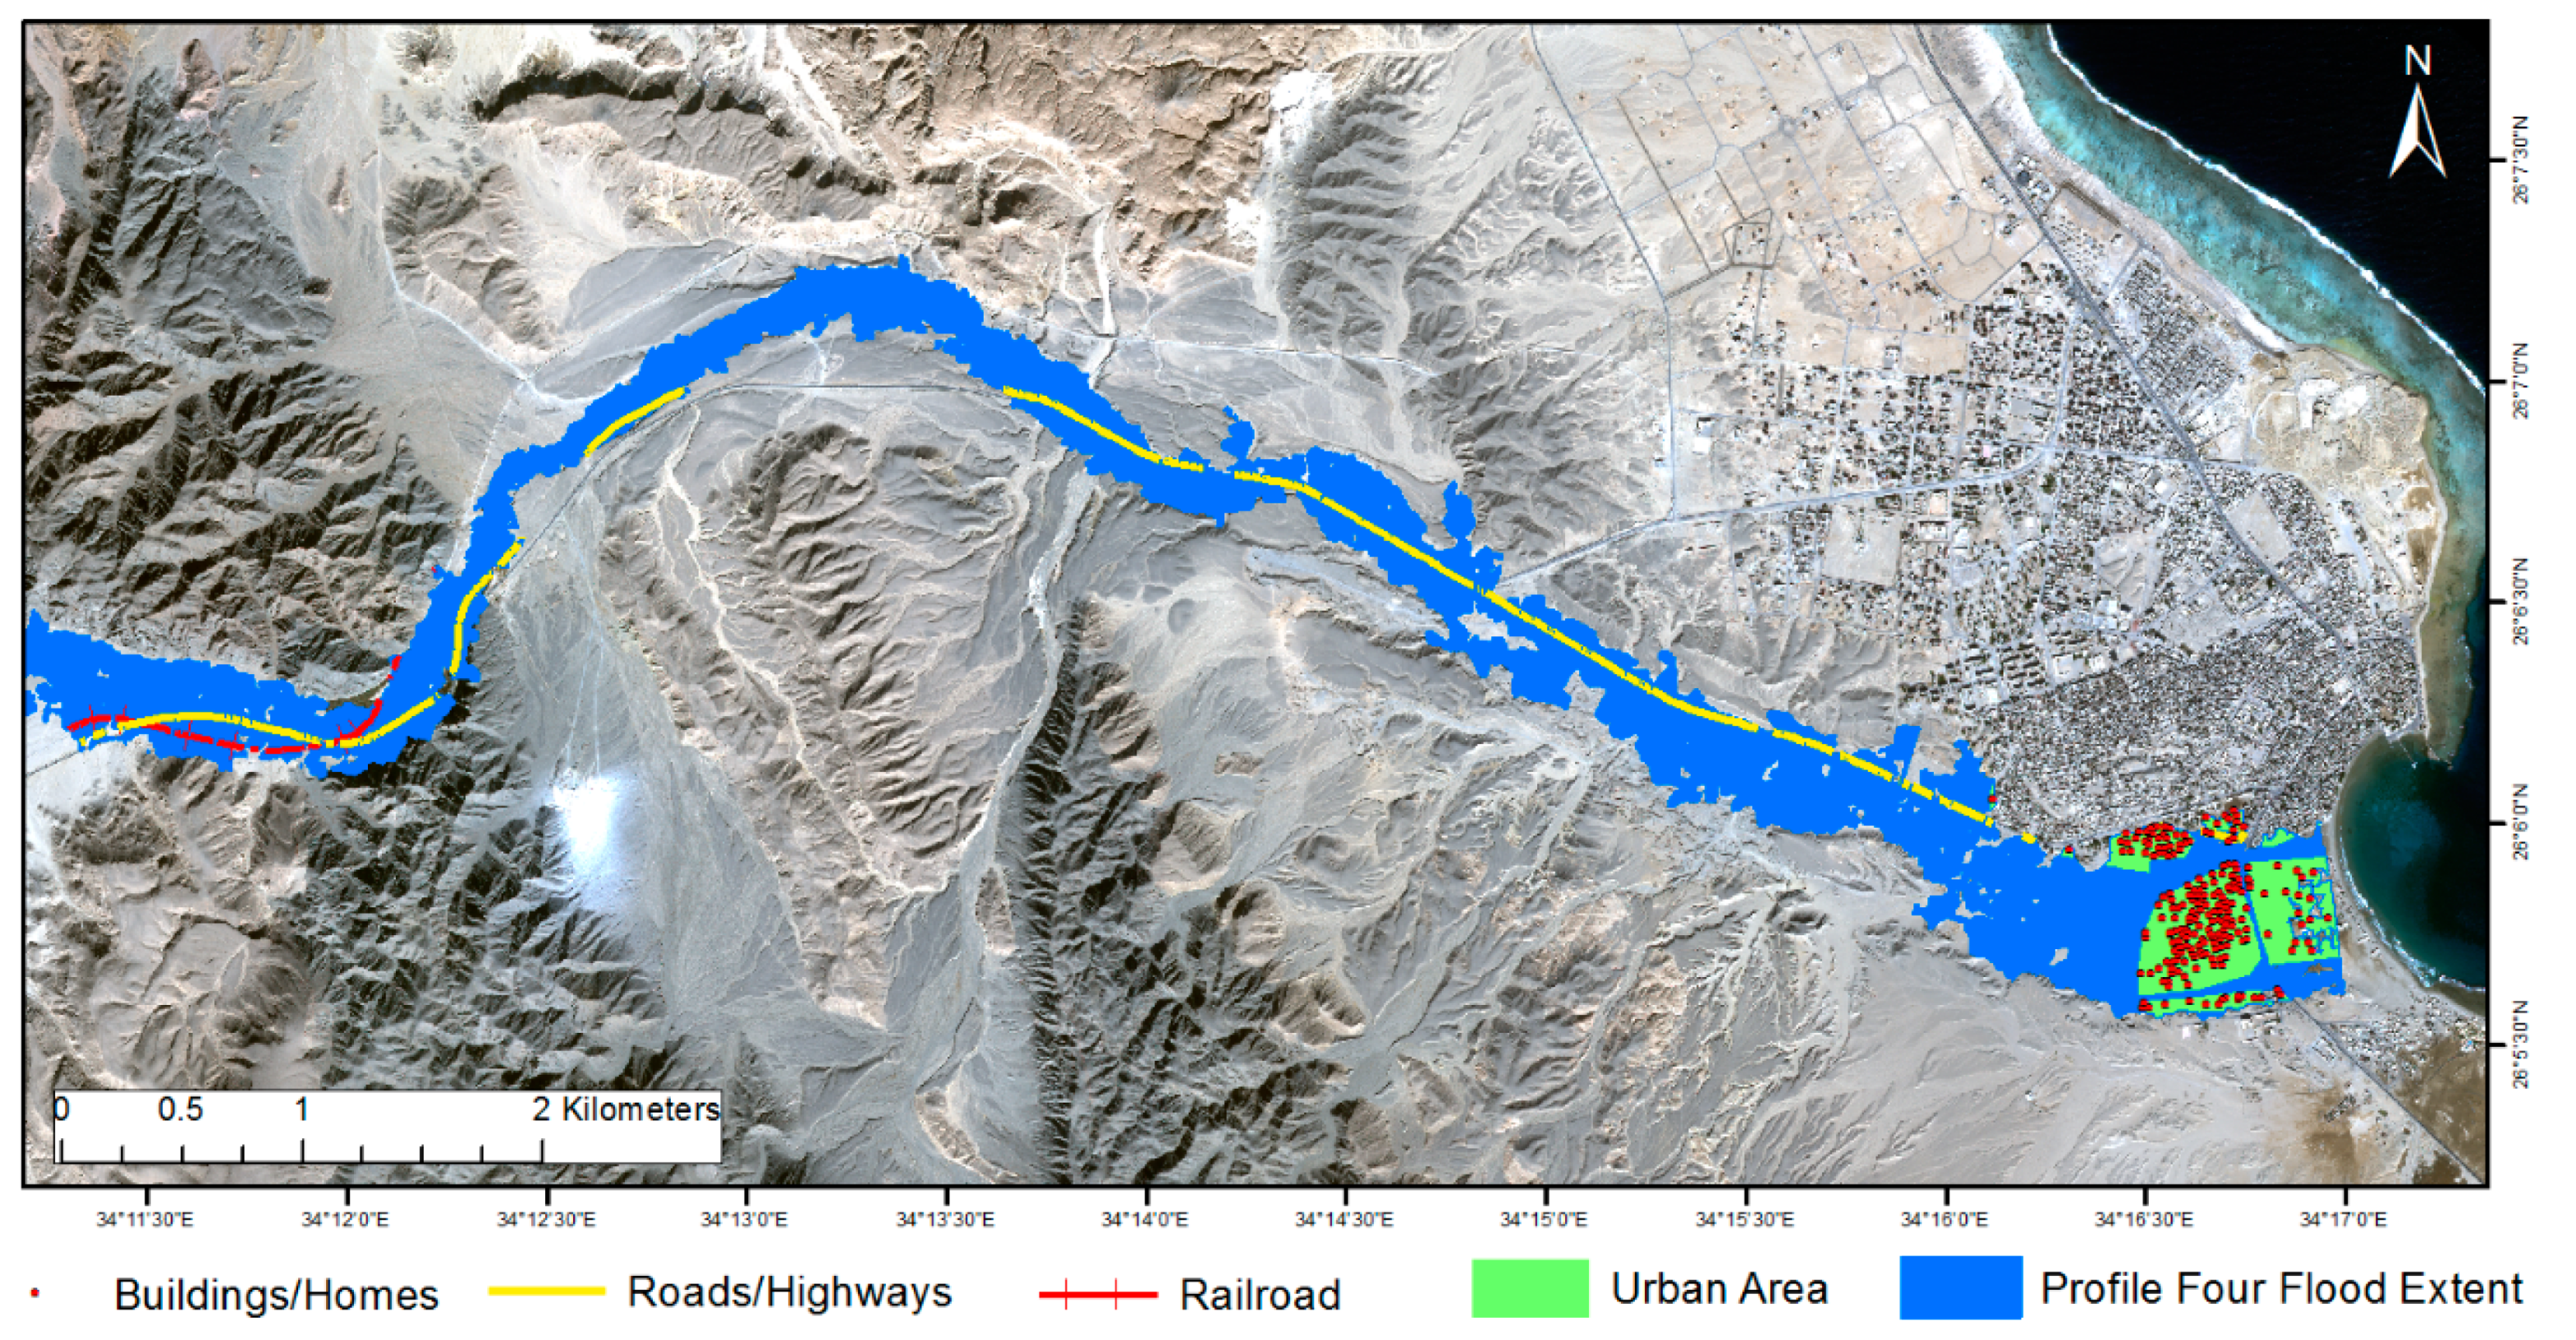
Flood inundation simulation with a rainfall intensity of 60 mm. This flood would surge the southern areas of the town of Quseir with a flood depth of 2 m, inundating 217 buildings, segments of the Qift–Quseir highway, and the phosphate railroad.
Figure 11.
Flood inundation simulation with a rainfall intensity of 60 mm. This flood would surge the southern areas of the town of Quseir with a flood depth of 2 m, inundating 217 buildings, segments of the Qift–Quseir highway, and the phosphate railroad.

Figure 12.
The modeled floodwater velocities along the main course of Wadi El-Ambagi. The flow velocity ranges between 1.03–6.13 m s−1, where high water velocities are observed along segments with a narrow channel course due to the concentration of surface runoff.
Figure 12.
The modeled floodwater velocities along the main course of Wadi El-Ambagi. The flow velocity ranges between 1.03–6.13 m s−1, where high water velocities are observed along segments with a narrow channel course due to the concentration of surface runoff.


Table 1.
Morphometric parameters of the sub-catchments of Wadi El-Ambagi draining toward the Qift–Quseir highway.
Table 1.
Morphometric parameters of the sub-catchments of Wadi El-Ambagi draining toward the Qift–Quseir highway.
| Basin ID | Basin Area/km2 | Relief Ratio | Drainage Density | Stream Frequency | Ruggedness Number | Curve Number |
|---|---|---|---|---|---|---|
| 1 | 5.99 | 0.08 | 1.06 | 0.50 | 0.32 | 91.1 |
| 2 | 4.01 | 0.10 | 1.07 | 0.75 | 0.37 | 90.6 |
| 3 | 8.47 | 0.07 | 0.96 | 0.59 | 0.33 | 90.5 |
| 4 | 2.56 | 0.05 | 0.79 | 0.39 | 0.11 | 93.1 |
| 5 | 82.63 | 0.04 | 0.87 | 0.54 | 0.53 | 94.7 |
| 6 | 5.57 | 0.01 | 0.92 | 0.18 | 0.35 | 90.6 |
| 7 | 9.06 | 0.09 | 0.82 | 0.33 | 0.43 | 94.7 |
| 8 | 8.34 | 0.07 | 0.94 | 0.48 | 0.26 | 95.0 |
| 9 | 31.86 | 0.07 | 0.89 | 0.47 | 0.63 | 93.6 |
| 10 | 9.96 | 0.04 | 0.94 | 0.30 | 0.22 | 87.5 |
| 11 | 18.63 | 0.03 | 1.01 | 0.54 | 0.25 | 83.6 |
| 12 | 23.45 | 0.05 | 0.91 | 0.47 | 0.32 | 78.1 |
| 13 | 23.94 | 0.04 | 0.88 | 0.54 | 0.34 | 78.0 |
| 14 | 4.24 | 0.10 | 1.02 | 0.71 | 0.34 | 76.0 |
| 15 | 2.92 | 0.05 | 1.07 | 0.34 | 0.16 | 75.3 |
| 16 | 5.33 | 0.09 | 0.79 | 0.19 | 0.27 | 76.1 |
| 17 | 4.24 | 0.11 | 0.86 | 0.71 | 0.27 | 76.4 |
| 18 | 114.07 | 0.03 | 0.97 | 0.53 | 0.57 | 77.6 |
| 19 | 7.03 | 0.04 | 1.04 | 0.57 | 0.24 | 76.7 |
| 20 | 14.61 | 0.03 | 0.92 | 0.27 | 0.23 | 77 |
| 21 | 2.98 | 0.08 | 1.07 | 0.34 | 0.20 | 76.1 |
| 22 | 7.11 | 0.04 | 0.83 | 0.42 | 0.19 | 75.9 |
| 23 | 26.94 | 0.02 | 0.81 | 0.41 | 0.19 | 76.6 |
| 24 | 570.21 | 0.02 | 0.90 | 0.44 | 0.85 | 83.7 |
| 25 | 136.99 | 0.03 | 0.91 | 0.49 | 0.49 | 82.3 |
| 26 | 25.44 | 0.05 | 0.97 | 0.59 | 0.39 | 79.9 |
| 27 | 26.99 | 0.05 | 0.83 | 0.48 | 0.30 | 83.9 |
| 28 | 24.45 | 0.02 | 0.84 | 0.45 | 0.26 | 87.1 |
| 29 | 26.70 | 0.03 | 0.95 | 0.34 | 0.26 | 90.3 |
| 30 | 18.04 | 0.03 | 0.96 | 0.61 | 0.25 | 93.0 |
| 31 | 104.15 | 0.03 | 0.91 | 0.50 | 0.43 | 88.2 |
| 32 | 12.84 | 0.04 | 0.93 | 0.70 | 0.28 | 90.4 |
| 33 | 4.51 | 0.05 | 1.02 | 0.22 | 0.20 | 89.2 |
| 34 | 7.65 | 0.06 | 1.07 | 0.52 | 0.27 | 90.1 |
| 35 | 4.81 | 0.11 | 0.66 | 0.62 | 0.19 | 89.4 |
| 36 | 18.63 | 0.04 | 0.90 | 0.32 | 0.22 | 86.6 |
© 2018 by the authors. Licensee MDPI, Basel, Switzerland. This article is an open access article distributed under the terms and conditions of the Creative Commons Attribution (CC BY) license (http://creativecommons.org/licenses/by/4.0/).
Share and Cite
MDPI and ACS Style
Mashaly, J.; Ghoneim, E. Flash Flood Hazard Using Optical, Radar, and Stereo-Pair Derived DEM: Eastern Desert, Egypt. Remote Sens. 2018, 10, 1204. https://doi.org/10.3390/rs10081204
AMA Style
Mashaly J, Ghoneim E. Flash Flood Hazard Using Optical, Radar, and Stereo-Pair Derived DEM: Eastern Desert, Egypt. Remote Sensing. 2018; 10(8):1204. https://doi.org/10.3390/rs10081204
Chicago/Turabian StyleMashaly, Jehan, and Eman Ghoneim. 2018. "Flash Flood Hazard Using Optical, Radar, and Stereo-Pair Derived DEM: Eastern Desert, Egypt" Remote Sensing 10, no. 8: 1204. https://doi.org/10.3390/rs10081204
Note that from the first issue of 2016, this journal uses article numbers instead of page numbers. See further details here.