Application of Ensemble-Based Machine Learning Models to Landslide Susceptibility Mapping


1
Division of Science Education, Kangwon National University, 1 Kangwondaehak-gil, Chuncheon-si, Gangwon-do 24341; Korea
2
Geological Research Division, Korea Institute of Geoscience and Mineral Resources (KIGAM), 124 Gwahang-no, Yuseong-gu, Daejeon 305-350, Korea
3
Department of Geophysical Exploration, Korea University of Science and Technology, 217 Gajeong-roYuseong-gu, Daejeon 305-350, Korea
*
Authors to whom correspondence should be addressed.
Remote Sens. 2018, 10(8), 1252; https://doi.org/10.3390/rs10081252
Submission received: 21 June 2018
/
Revised: 3 August 2018
/
Accepted: 5 August 2018
/
Published: 9 August 2018
(This article belongs to the Special Issue Selected Papers from the “International Symposium on Remote Sensing 2018”)
Abstract
:The main purpose of this study was to produce landslide susceptibility maps using various ensemble-based machine learning models (i.e., the AdaBoost, LogitBoost, Multiclass Classifier, and Bagging models) for the Sacheon-myeon area of South Korea. A landslide inventory map including a total of 762 landslides was compiled based on reports and aerial photograph interpretations. The landslides were randomly separated into two datasets: 70% of landslides were selected for the model establishment and 30% were used for validation purposes. Additionally, 20 landslide condition factors divided into five categories (topographic factors, hydrological factors, soil map, geological map, and forest map) were considered in the landslide susceptibility mapping. The relationships among landslide occurrence and landslide conditioning factors were analyzed and the landslide susceptibility maps were calculated and drawn using the AdaBoost, LogitBoost, Multiclass Classifier, and Bagging models. Finally, the maps were validated using the area under the curve (AUC) method. The Multiclass Classifier method had higher prediction accuracy (85.9%) than the Bagging (AUC = 85.4%), LogitBoost (AUC = 84.8%), and AdaBoost (84.0%) methods.
1. Introduction
Landslides are a highly complex natural phenomenon that cause substantial damage to people, properties, and transportation networks [1]. Landslides generally occur in mountainous areas due to their steep slopes. Korea has a large mountainous area, covering about 70% of the total land area. Mountainous areas consisting of granite or gneiss lithology tend to have steep inclines and are the most vulnerable to landslides [2]. In the rainy season, Korea have around 300 mm of average monthly rainfall on July and 280 mm on August. These conditions, as well as low soil strength due to weathering and unstable slopes and high rainfall in the rainy season, are highly influential on slope stability and vulnerability to landslides. Many government agencies have attempted to find solutions to mitigate the disastrous consequences of landslides by educating people about the severe effects of landslides and developing appropriate planning and decision-making tools. This process generally involves identifying and mapping areas susceptible to landslides based on a landslide susceptibility assessment, which is an assessment of the spatial distribution of the probability of landslide occurrence in a given area based on local geo-environmental factors [3,4].
In recent decades, assessments of landslide-susceptible zones have become one of the most discussed topics in the related literature because of the difficulty in predicting landslide events due to their complex nature [5]. Other scientists have recently proposed methods based on physical modeling, suggesting that they may be more accurate because they use universal laws which apply in all cases. Furthermore, analysis of past landslides gives useful data which can be used in methods based on physical landslide risk. Methods based on the have recently been proposed and applied [6,7,8,9,10]. Otherwise, various methods and techniques have been proposed in recent years, such as probability models [11,12,13], artificial neural networks [14,15,16], logistic regression [17,18,19], decision trees [20,21,22], and support vector machines [23,24,25]. Such landslide models also require constant evaluation to adapt to changes in landslide information and related factors. Regardless, with limited available information on landslides and related factors, the prediction power and robustness are the two main factors used to select the most appropriate methods to obtain better modeling results [26].
Ensemble frameworks have received substantial attention in many fields due to their ability to improve the prediction performance of models and deal with complex high-dimensional data [27,28]. Ensemble methods are machine learning techniques in which a prediction model is formed from a combination of various base classifiers. Various ensemble frameworks have been proposed, such as stacking, random subspace, random forests, rotation forests [29], Bagging [30], AdaBoost [31], and MultiBoost [32], which can be grouped into two main categories: heterogeneous and homogeneous [33]. The first incorporates models from different algorithms to form the final ensemble classifier (e.g., [27]), whereas in the second type, only one algorithm is used but the original training data is split into several subsets to build classifiers, from which a committee is constructed; for example, the Bagging algorithm [34]. Nevertheless, exploration of ensemble frameworks for landslide susceptibility modeling has seldom been carried out.
This study fills this gap by assessing and verifying a novel ensemble methodology for landslide susceptibility modeling. Four ensemble techniques (AdaBoost, LogitBoost, Multiclass Classifier, and Bagging) were used in the proposed approach. The four functional models are homogeneous ensemble frameworks that can significantly improve the performance of prediction models [35,36,37]. The prediction performances of the ensemble models were assessed using the training and validation datasets, statistical evaluation measures, the receiver operating characteristic (ROC) curve, and the area under the curve (AUC). The modeling process was carried out using Weka ver. 3.7. [38].
2. Study Area and Materials
The study area is located in Sacheon-myeon, Gangneung City, Gangwon Province, South Korea (37°47′50″ N, 128°48′08″ E) (Figure 1). Gangneung has experience frequent landslides during typhoon and heavy rainfall events. Typhoon Rusa hit Gangneung area by storm and heavy rain on 30–31 August 2002. The daily rainfall was recorded at 609 mm and hourly rainfall was 80 mm. Around 266 people died and the damage to property was about a value of 8 billion Korean won because of the typhoon and another natural hazard disaster caused by typhoon and heavy rain. Among the victims, 81 people died as by landslide and collapse of cut-slope [39]. In Gangneung area, Sacheon-myeon was one of the area the most landslides occurred.
In this study, landslides in the Sacheon-myeon area were interpreted using web-based aerial photographs. The first stage in all landslide susceptibility assessments consists of the collection of existing information and data within the area of interest [3]. This step is accepted as the most important part of landslide hazard mitigation studies [41,42], as the reliability and accuracy of the collected data affect the success of the applied method. Therefore, the relationship between landslide occurrence and the conditioning parameters employed is also crucial for landslide susceptibility mapping.
2.1. Landslide Inventory
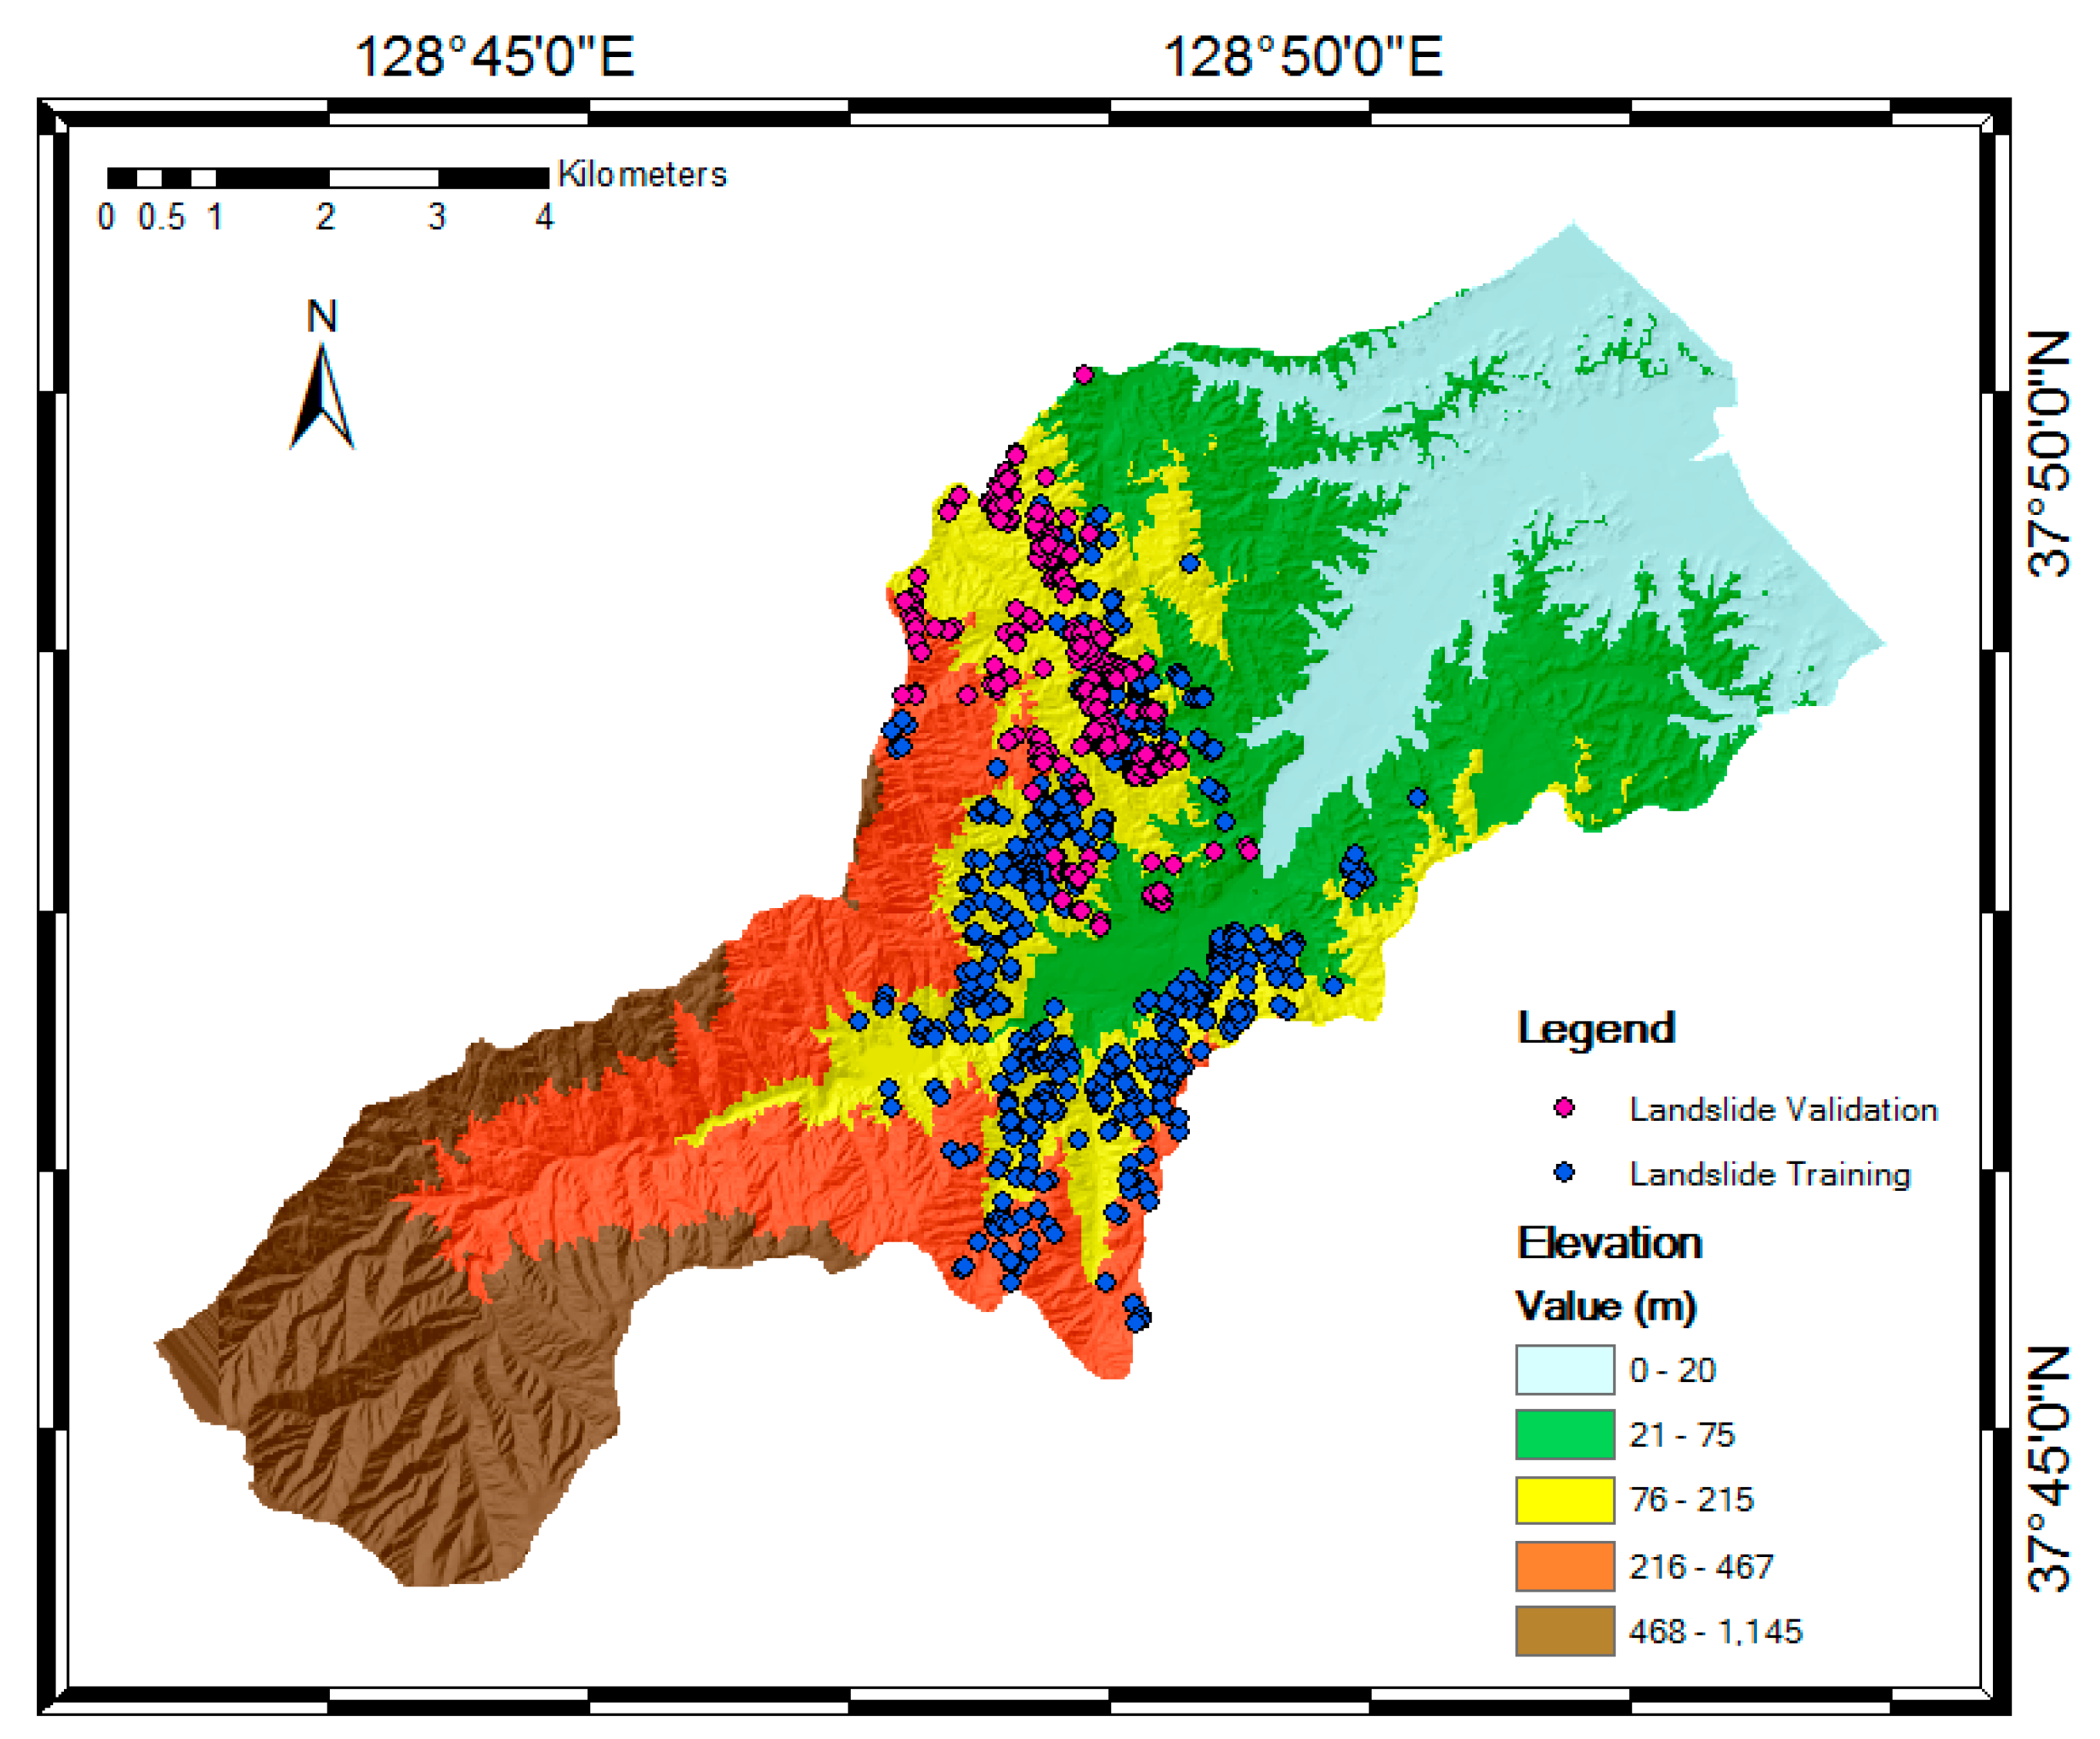
The preparation of a landslide inventory map is considered a primary and crucial step in landslide susceptibility assessments. The map indicates the location of previous landslide events and current conditions. In this study, the landslide inventory map was constructed based on 762 landslide locations that were identified from aerial photographs using images without ground control points (GCPs). In Korea, the aerial photographs can be freely obtained at the portal site http://map.daum.net/ [26,43]. Images taken after landslide events were selected from each region with landslide occurrences and applied to digital topographic features using ArcMap ver. 10.4.1. For example, photos taken after landslide occurrences are shown in Figure 2b,d,f,h. Figure 2a,c,e,g show the areas before landslide occurrences as a comparison. The spatial distribution of landslides was determined using remote sensing and geographic information system (GIS) spatial analysis methods. Detected landslide points were plotted from aerial photographs. The landslide point were inputted to digital elevation model (DEM) data for spatial processing (Figure 3).
2.2. Landslide Conditioning Factors
Environmental factors are important in the determination of landslide susceptibility. Therefore, we considered 20 conditioning factors related to landslide occurrence, which are listed in Table 1. Although these factors were important controls, in practice, their spatial distribution was difficult to determine. The locations of landslides and environmental factors were denoted within 30-m × 30-m pixels. Topographic and hydrologic factors were constructed from DEM data using the terrain analysis of the SAGA (System for Automated Geoscientific Analyses) GIS module [44] (Table 1). Meanwhile, the soil, forest, and geological factors were extracted from soil, forest, and geological maps, respectively.
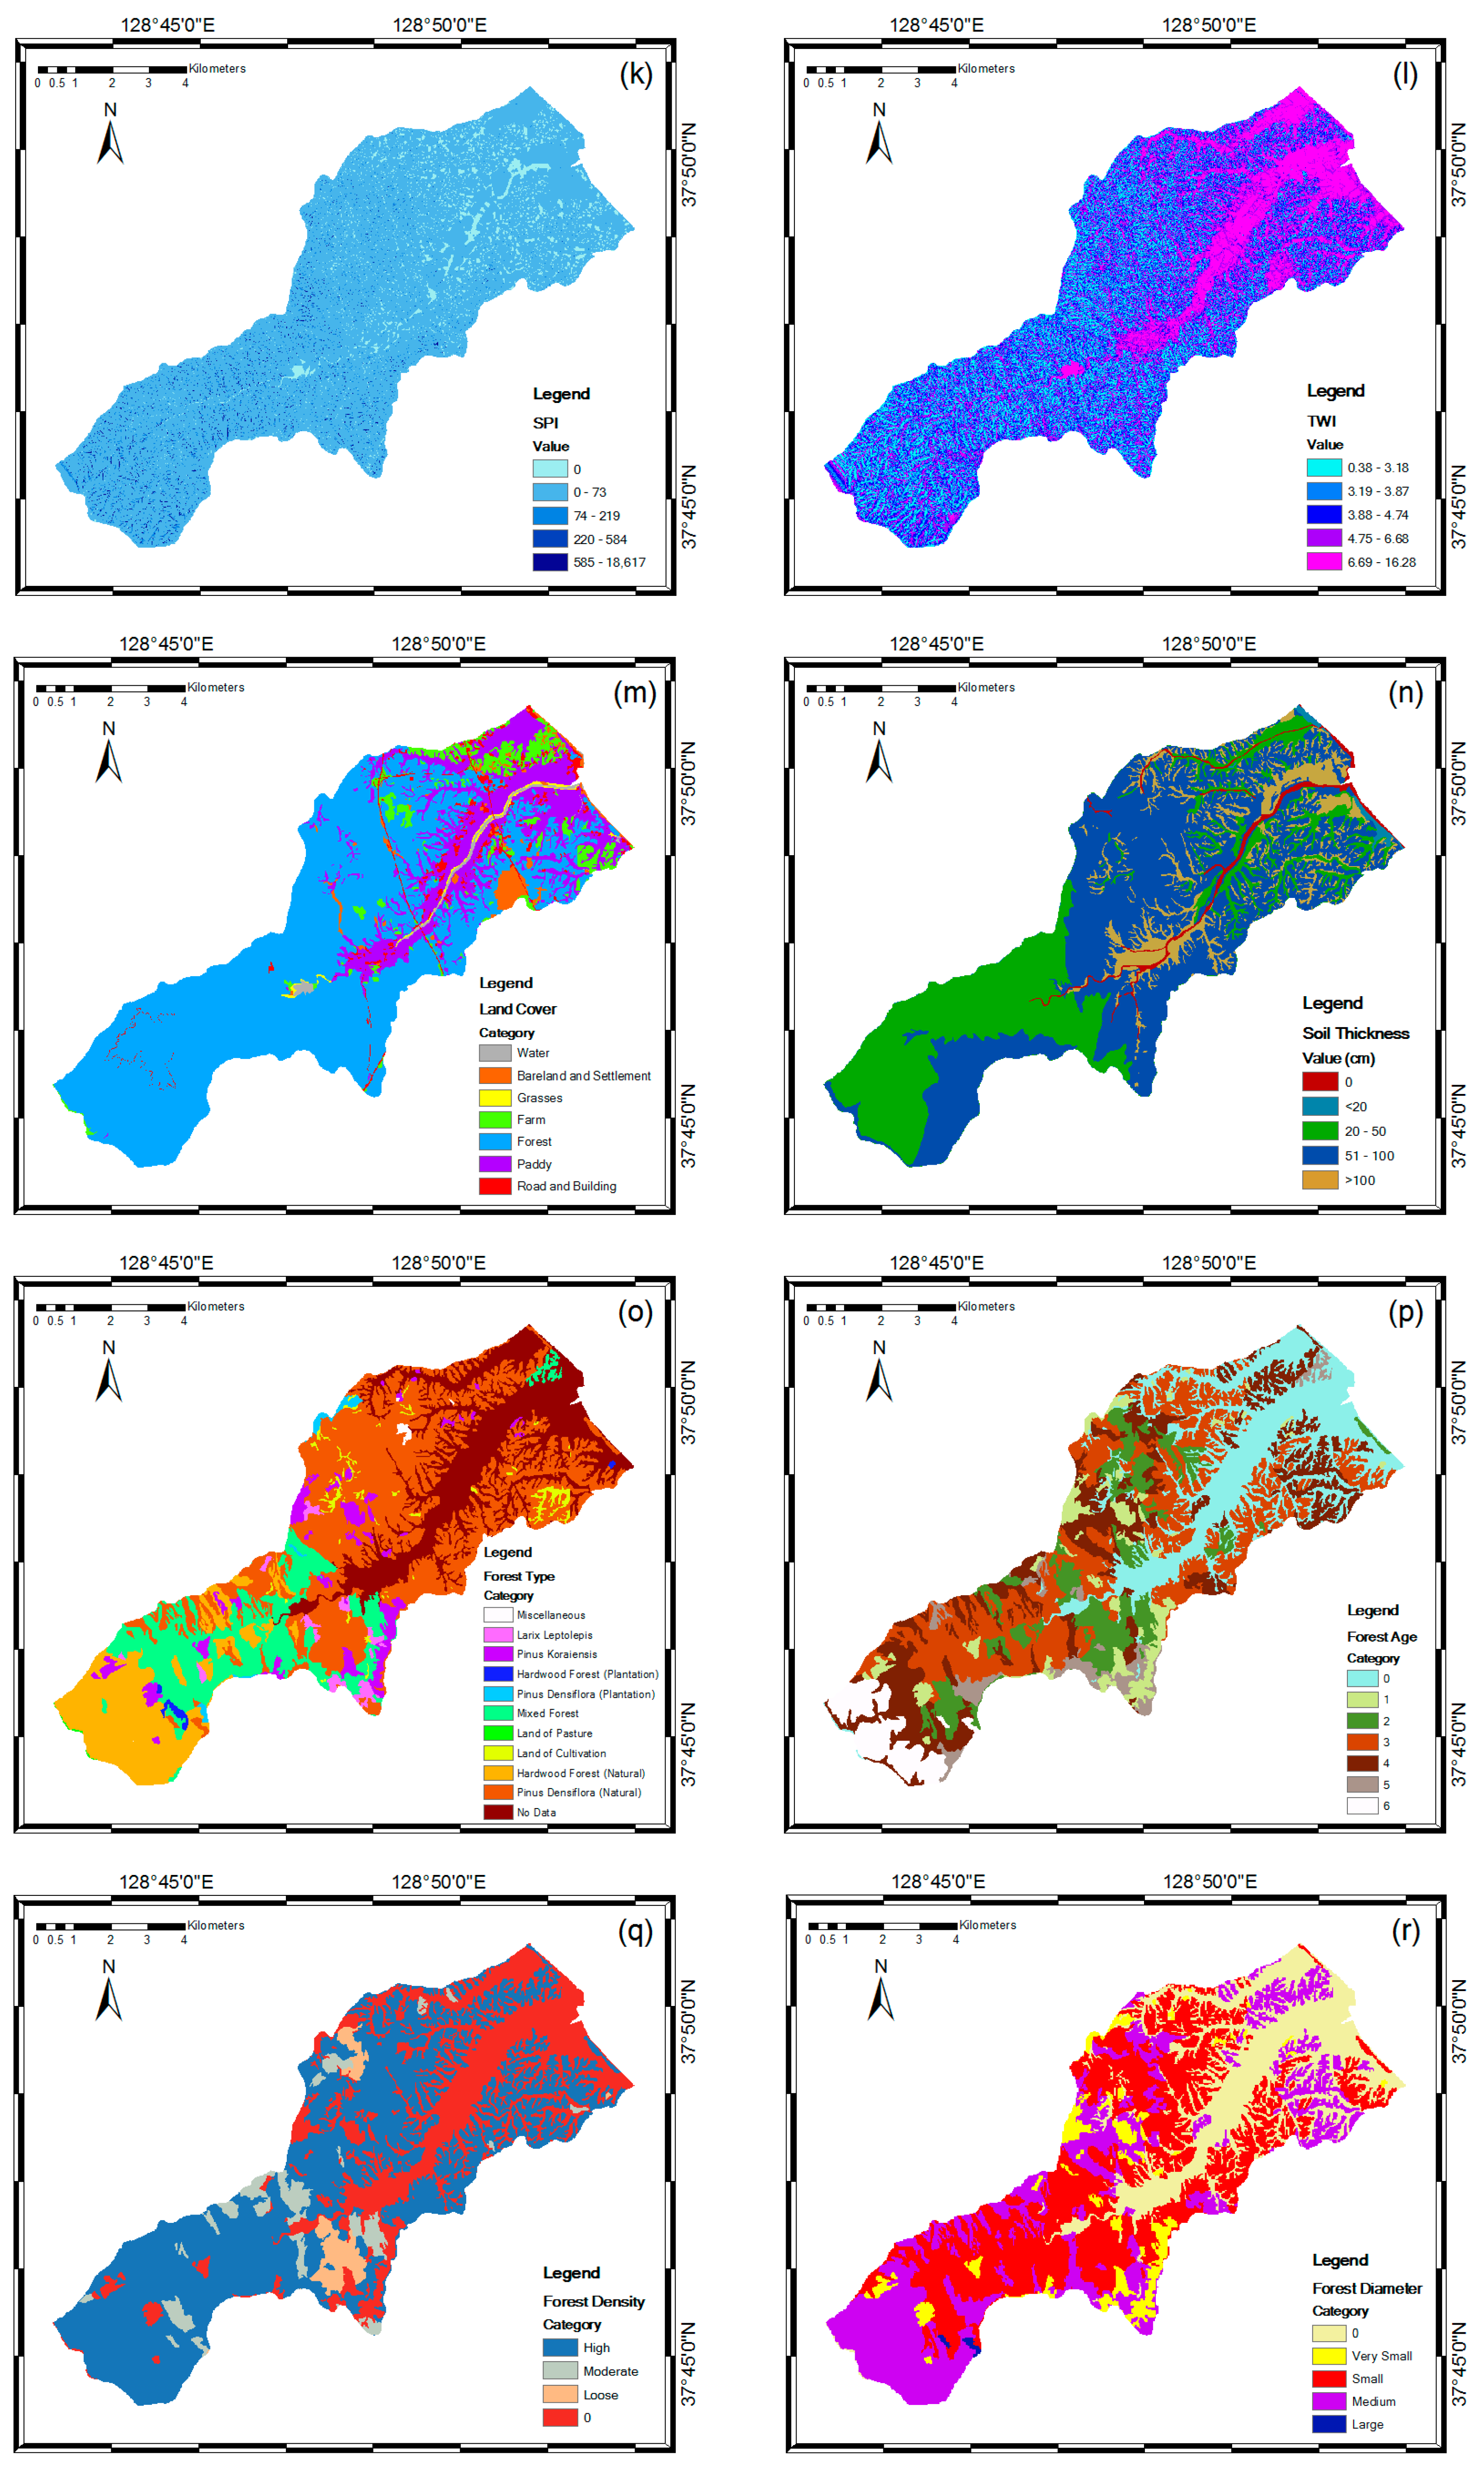
Topography and hydrology influence debris flow initiation through the effect of gradient on slope stability with rainfall. These factors also determine the concentration and dispersion of the material and the material balance on the slope associated with the slope stability. The extracted topographic factors were slope, aspect, maximum curvature, profile curvature, convexity, texture, mid-slope position (MSP), topographic position index (TPI), and terrain ruggedness index (TRI) (Figure 4a–i). Slope indicated the steepness of a hill, and aspect was the steepest downhill direction. MSP is correlated with slope, thus were assigned a 0 value in the middle of slope, while maximum vertical distances from the mid-slope to peak or valley directions were assigned a 1 value. Curvature function (maximum curvature and profile curvature) represents the morphology of topography. A part of a surface can be concave or convex and affects the divergence and convergence of flow across the surface. Convexity was described as positive surface curvature and represented the percentage of convex-upward cells [45]. Texture or terrain surface texture is correlated with TRI and TPI. TRI is used to express the amount of elevation difference between surface and surrounding area, including concave and convex regions. TPI is an algorithm increasingly used to measure topographic slope positions [46]. The extracted hydrologic factors were flow accumulation, stream power index (SPI), and topographic wetness index (TWI) (Figure 4j–l). Flow accumulation used to simulate the flow or potential flow of water creeks, stream, and rivers. From the flow accumulation, the valley shapes in the watershed were obtained. SPI represented the erosive power of a water flow and TWI is a steady state wetness index, which is commonly used to quantify topographic control on hydrological processes [45].
The attribute column in the digital land cover map (Table 1) is land use (Figure 4m). Land use was classified into bare land and settlement, grasses, farm, forests, paddy fields, and road. The class of soil thickness (Figure 4n) from the soil maps was divided into four classes; namely, very shallow (0–19 cm), shallow (20–49 cm), moderate (50–99 cm), and deep (>100 cm). Soil on the slope affects the spatial distribution of debris flows. These factors are significant controls, and can be represented as spatial distribution from digital elevation models (DEM) and soil maps and land cover maps.
Plant root strength also substantially influences the occurrence of slope failure [47]. Therefore, forest factors such as forest type, forest diameter, forest density, and forest age are closely related to the strength of soil–root bonds (Figure 4o–r). This means that high-density timber has a high capacity to maintain water pressure and pore soil water under heavy rainfall. In general, older forests composed of trees with large diameters tend to have stronger roots that contribute to slope stability. Root strength and timber diameter are also influenced by forest type or existing trees type.
Because various lithological units have different susceptibilities to active geomorphologic processes such as landslides, lithology plays an important role in landslide occurrence [48,49,50,51]. Therefore, lithology was considered as a geological parameter in this study (Figure 4s). Faults were also regarded as a critical factor in triggering landslides in tectonically active areas (Figure 4t). Because the strengths of fracturing and shearing stresses crucially influence slope instability, the distance to faults was considered to investigate the relationship between lineaments and landslide occurrence.
3. Methods
To construct the landslide models and evaluate their performance, the landslide inventory and 20 conditioning factor maps were converted into ASCII (American Standard Code for Information Interchange) format with a cell size of 30 m. All determined landslide locations from ArcGIS ver. 10.41 were divided into a training set (70%) and a validation set (30%). Because the number of landslide pixels was much smaller than the total number of pixels of the study area, we used the under-sampling method [21,52]. Therefore, the same number of non-landslide pixels was randomly sampled from the free-landslide area, where landslide pixels were assigned a value of 1 and non-landslide pixels were assigned a value of 0. Finally, the values for the landslide conditioning factors were extracted to build the training and validation datasets. The values for the landslide conditioning factors were collated in SPSS and then converted from ASCII into a statistical file format.
We used the open-source tool Weka in this study [38]. Weka is a data-mining tool that supports the easy application of a learning algorithm to a dataset. Weka consists of various machine learning algorithms for different data-mining applications. Therefore, we could preprocess the dataset, place it into the learning scheme, and analyze the generated classes and their performance without writing the program code. All algorithms used a single relational table in ARFF (Attribute-Relation File Format) format as their input. The ARFF format was derived from the landslide conditioning factor values collated in a statistical file and converted into ARFF format using Weka. The main focus of this research was the performance and evaluation of Meta (i.e., ensemble learning) algorithms for landslide susceptibility analysis. We classified the ARFF data and used the training set as test options to run the ensemble algorithms.
The four ensemble learning algorithms used to establish the ensemble models of landslide susceptibility in this study, namely, AdaBoost, LogitBoost, Multiclass Classifier, and Bagging, are briefly described below.
3.1. AdaBoost
AdaBoost (from “adaptive boosting”) is a machine learning ensemble algorithm proposed by Freund and Schapire (1997) [31]. AdaBoost is one of the most widely used boosting algorithms, in which a series of individual classifiers is produced iteratively and each classifier in the ensemble attempts to accurately classify the training data. The classifier uses an adaptive resampling technique to select training samples. For example, a misclassified dataset produced by a previous classifier is selected more often than a correctly classified one, so that the new classifier can perform better in the new dataset. Each iteration assigns a weight to the dataset so that the next integration concentrates on reweighted datasets that were previously misclassified. The final model is obtained from the weighted sum of all classifier base models. Furthermore, AdaBoost can be used to evaluate the relevance of variables by examining how often they are selected by weak learners. In this research, we used Weka to process the AdaBoost model. The class used for boosting was a nominal class classifier using the AdaBoost method, and only nominal class problems could be considered. This method dramatically improves performance, but sometimes results in overfitting.
3.2. LogitBoost
In the field of machine learning and computational learning theory, LogitBoost is a boosting algorithm formulated by Friedman, Hastie, and Tibshirani (2000) [53]. The original paper cast the AdaBoost algorithm into a statistical framework, where the AdaBoost model was considered as a generalized additive model to which the cost functional of logistic regression was applied. Therefore, the LogitBoost algorithm is an extension of the AdaBoost algorithm, and replaces the exponential loss of the AdaBoost algorithm with conditional Bernoulli-likelihood loss. LogitBoost uses additive logistic regression for classification, which performs classification using a regression scheme as the base learner and can handle multi-class problems.
3.3. Multiclass Classifier
In machine learning, multiclass or multinomial classification addresses the problem of classifying instances into one of three or more classes, in contrast to binary classification, which is the classification of instances into one of two classes. Although some classification algorithms naturally permit the use of more than two classes, others are by nature binary algorithms. However, these can be transformed into multinomial classifiers following a variety of strategies. Multiclass classification should not be confused with multi-label classification, where multiple labels are predicted for each instance. Existing multiclass classification techniques can be categorized into transformation to binary, extension from binary, and hierarchical classification [54]. A Multiclass Classifier is a Meta classifier that can handle multiclass datasets with two-class classifiers. This kind of classifier is also capable of applying error-correcting output codes for increased accuracy.
3.4. Bagging
Bagging is a machine learning ensemble Meta algorithm designed to improve the stability and accuracy of machine learning algorithms used in statistical classification and regression. Bagging was one of the earliest ensemble methods that used the bootstrap sampling technique [30]. The bootstrap technique involves performing random sampling with replacements to generate multiple samples that form a training set. Each of the generated subsets is used to construct a decision tree, which are later aggregated into the final model. This improves classification accuracy by decreasing the variance of the classification error. We used Bagging to obtain a more robust and accurate landslide model, as it has proven useful in landslide susceptibility models for its sensitivity to small changes in the training data, and therefore may be able to improve prediction capability [35]. Bagging uses a classifier to reduce variance, which can perform classification and regression depending on the base learner.
4. Results
4.1. Landslide Susceptibility Map Construction
We constructed the landslide models using a training dataset. The performance of the landslide models depended significantly on the selection of the calculation parameters. Therefore, optimization was carried out to obtain the optimal parameters that yielded the best landslide model performance. Table 2 lists the optimal parameters for the landslide models in this study.
The landslide susceptibility maps were constructed after the successful completion of the model training process. First, landslide susceptibility indices were generated for all pixels in the study area, where each pixel was assigned a unique susceptibility index. Then, the susceptibility indices were reclassified using the quantile method on the basis of finding adjacent feature pairs with a relatively large difference [55]. Based on reclassification of the landslide susceptibility indices, the landslide susceptibility maps were constructed using five susceptibility classes: very low, low, moderate, high, and very high (Figure 5).
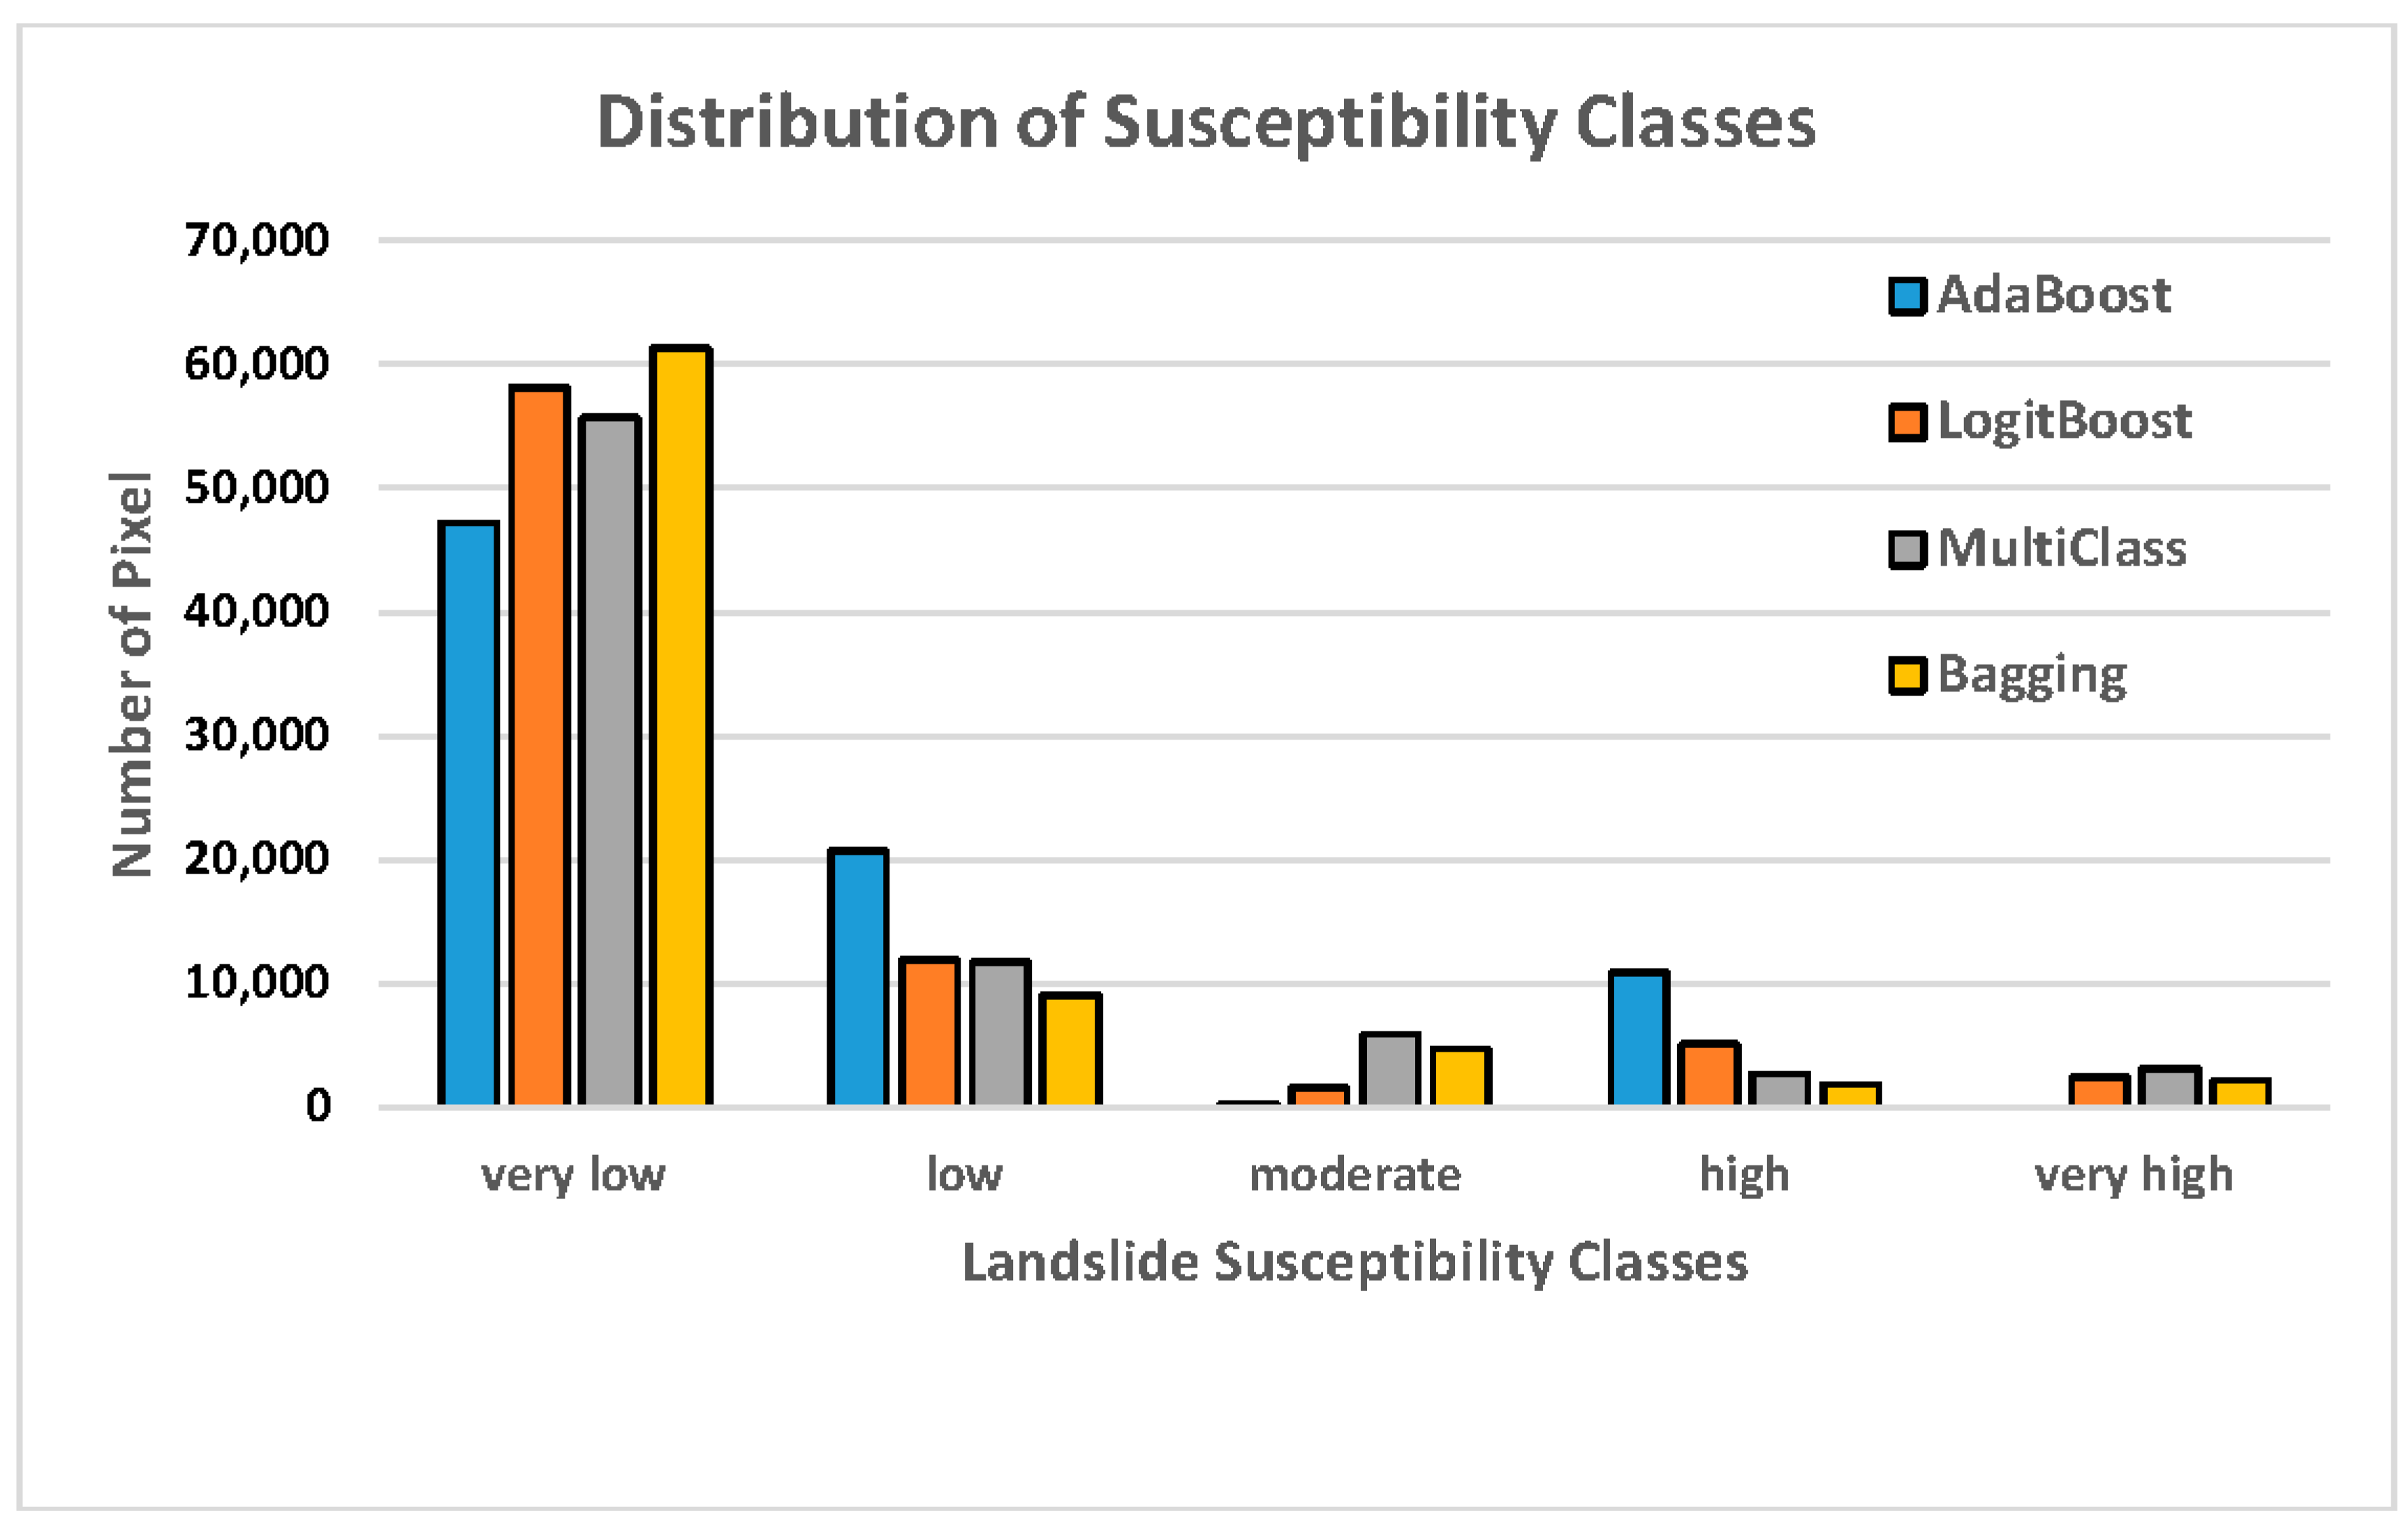
Figure 6 presents the distribution of the susceptibility classes in the landslide susceptibility maps. In the landslide susceptibility map constructed using the AdaBoost model, 59.65% of the study area had a very low susceptibility to landslides, while 26.23%, 0.33%, and 13.79% of the area had low, moderate, and high susceptibilities, respectively. The AdaBoost model can only classify four classes; therefore, the very high susceptibility class was excluded. In the map based on the LogitBoost model, 73.43% of the area had a very low susceptibility to landslides, while 15.05%, 2.01%, 6.43%, and 3.08% had low, moderate, high, and very high susceptibilities, respectively. In the map based on the Multiclass Classifier model, 70.38% of the area had a very low susceptibility to landslides, while 14.76%, 7.42%, 3.46%, and 3.98% of the area had low, moderate high, and very high susceptibilities, respectively. Finally, in the map based on the Bagging model, 77.45% of the area had a very low susceptibility to landslides, while 11.43%, 5.91%, 2.39%, and 2.82% of the area had low, moderate, high, and very high susceptibilities.
4.2.Map Validation and Accuracy Assessment
A landslide susceptibility map should be able to effectively predict future landslide areas and be validated by combining existing landslide location data with landslide locations as they occur. Therefore, the results of the landslide susceptibility analysis were confirmed using the validation data. The landslide susceptibility maps produced by various Meta-classifier models were validated by comparing the susceptibility maps with the validation data, which comprised 229 landslides (i.e., 30% of the total landslides).
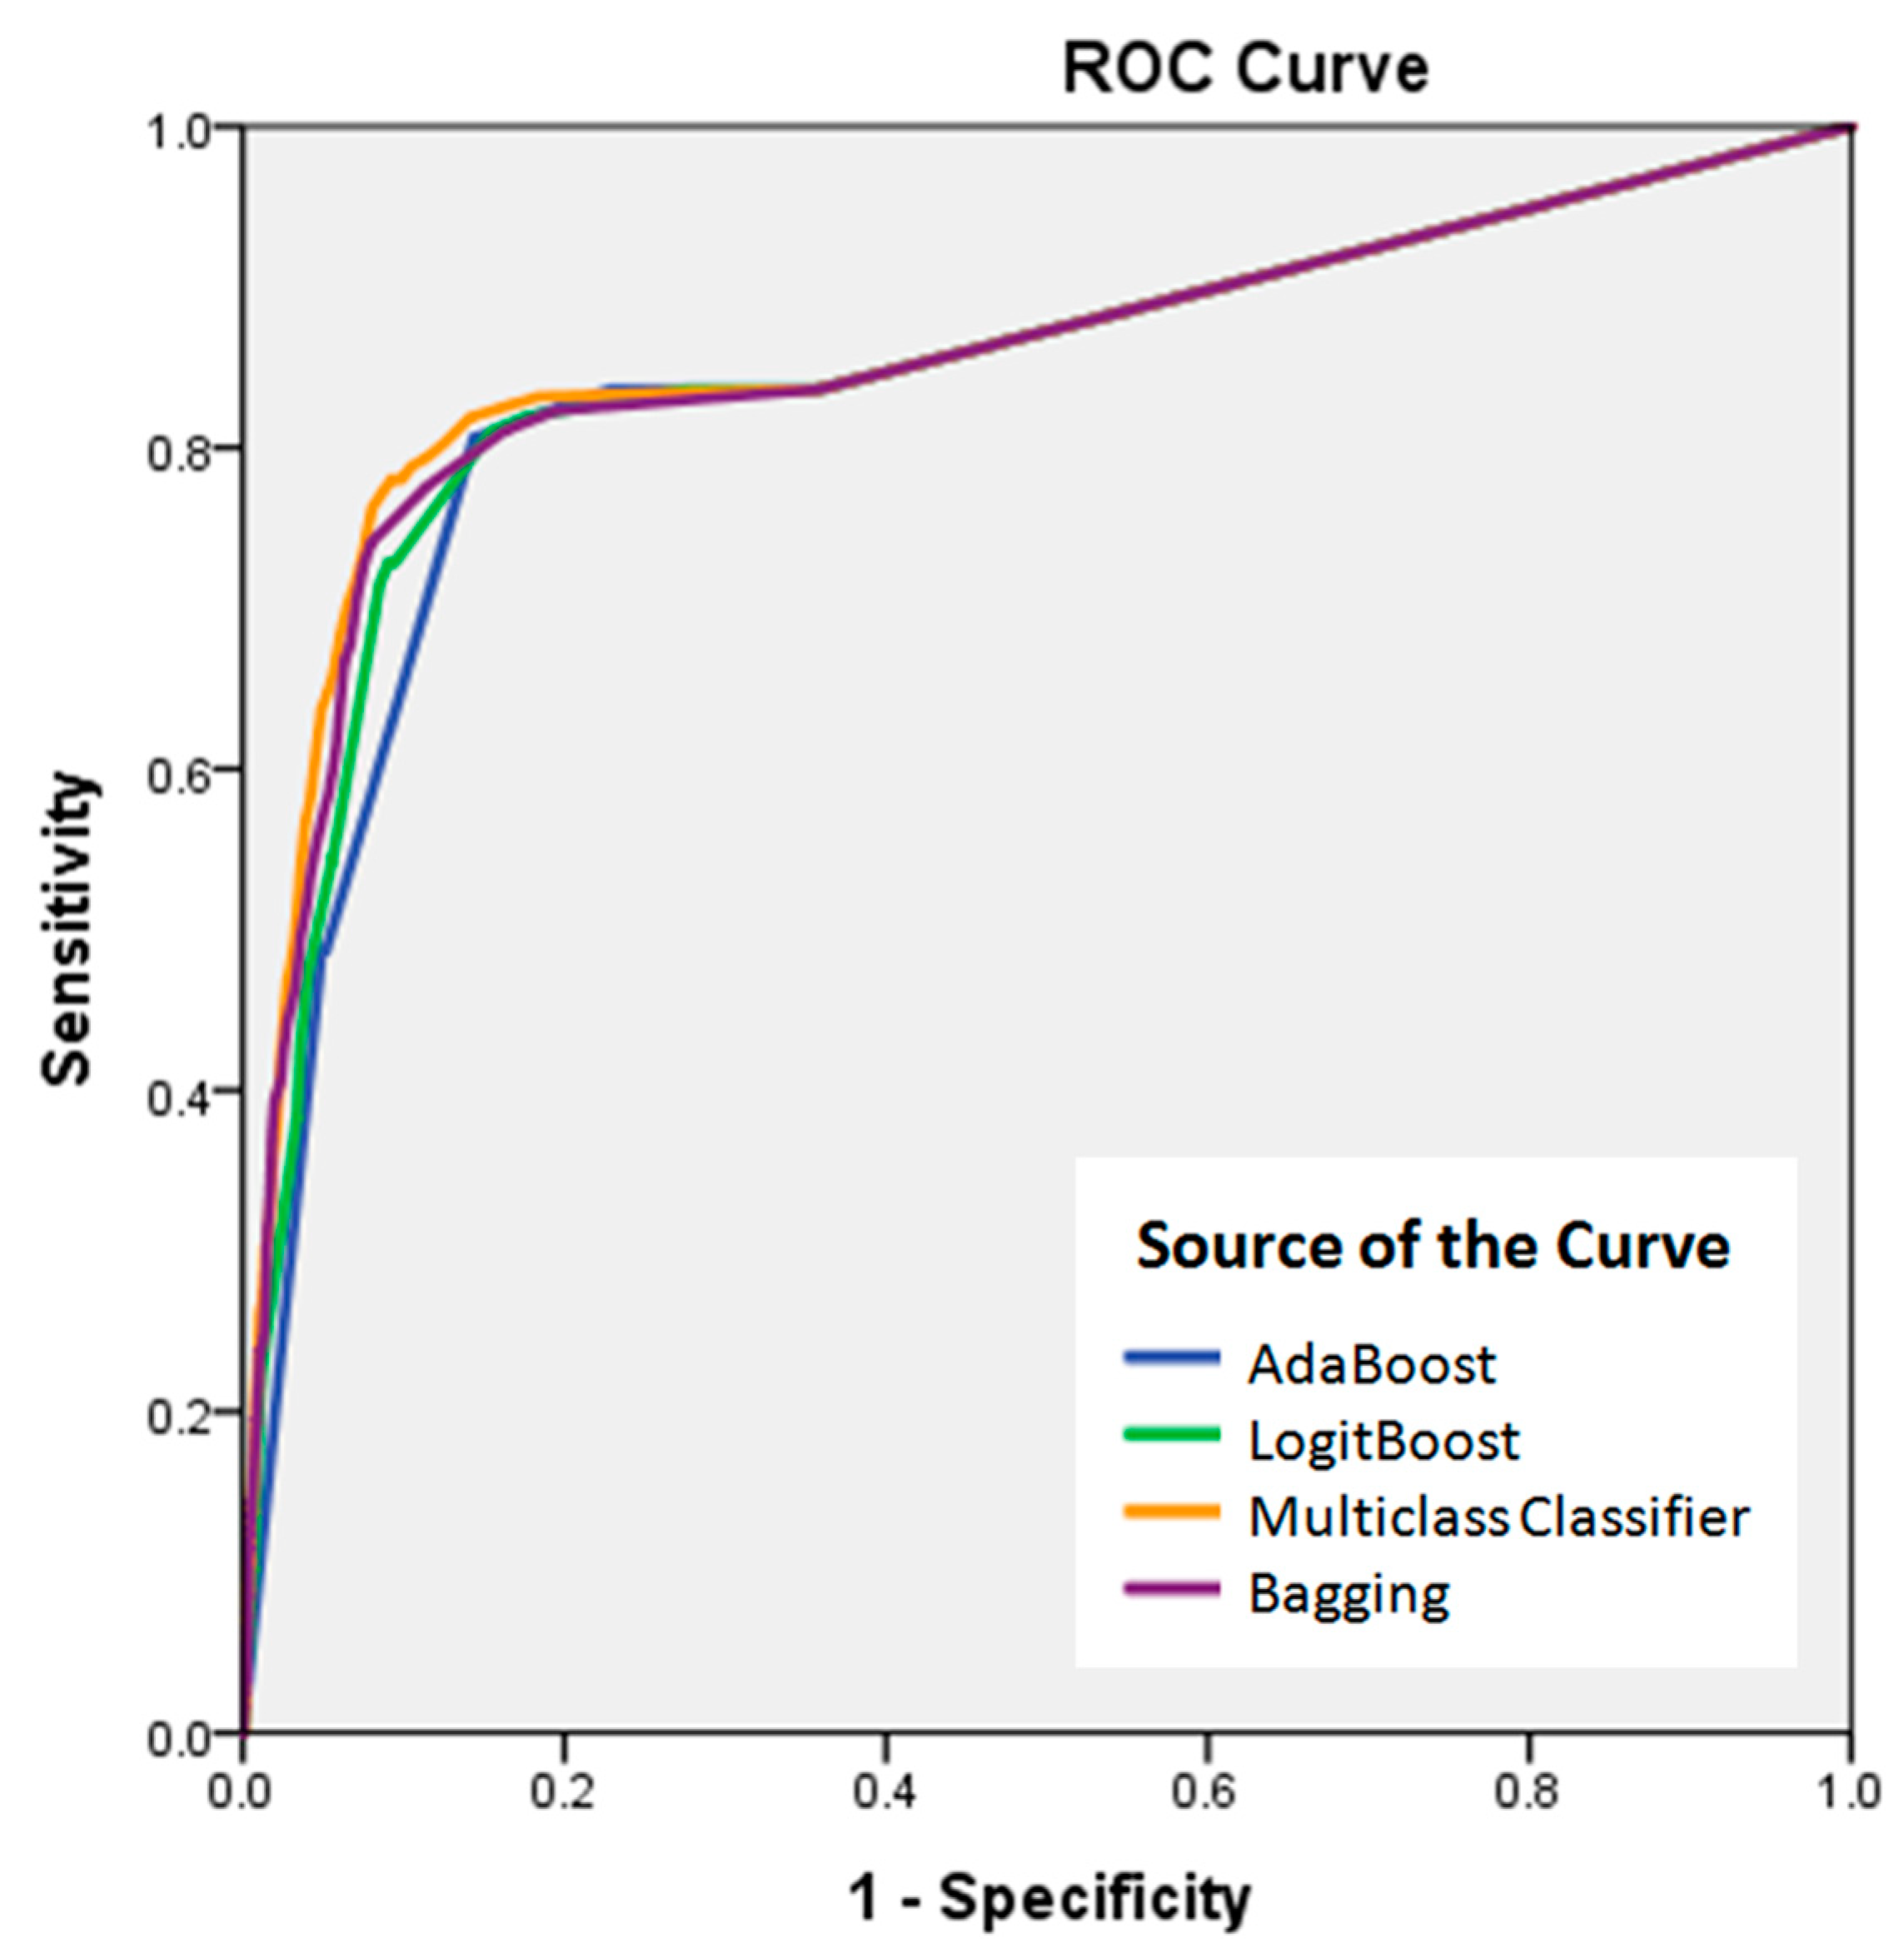
The AUC (area under the curve) was used to quantitatively compare the model performance among the four models (Table 3), where the model with the highest AUC was considered to be the best model. The success rate curve was obtained by comparing the training data with the landslide susceptibility maps. The Multiclass Classifier algorithm yielded the highest AUC (0.859), followed by the Bagging (0.854), LogitBoost (0.848), and AdaBoost algorithms (0.840) (Figure 7). Although all models exhibited sufficient performance for application to the spatial prediction of landslide hazards in the study area, the landslide susceptibility map produced with the Multiclass Classifier algorithm had the best performance.
5. Discussion
There is a great deal of interest in the landslide research community to improve landslide susceptibility model performance, because model quality is controlled by the method employed [52] and new machine-learning techniques have proven effective in terms of prediction performance [36]. Therefore, in this study, we investigated the application of four machine learning ensembles, namely, AdaBoost, LogitBoost, Multiclass Classifier, and Bagging, to landslide susceptibility assessments. According to the literature, such investigations are rare, particularly based on a case study in Sacheon-myeon, South Korea.
The results of this study confirmed that the landslide model performance improved with the use of machine learning ensembles. For comparison, we also considered a traditional model, frequency ratio, which had an AUC of 0.817 (Figure 8). The ensemble model prediction was improved by 2.3% with AdaBoost, 3.1% with LogitBoost, 3.7% with Bagging, and 4.2% with the Multiclass Classifier. These results are reasonable because the techniques used in classifier ensemble frameworks can reduce both bias and variance and avoid overfitting problems against base classifiers to improve their predictive capability [56]. Moreover, the results are in agreement with those of Tien Bui et al. (2016a) [5], who found that the prediction performance of landslide models was enhanced with the use of a machine learning ensemble framework.
Among the four machine learning ensembles, the Multiclass Classifier model provided the greatest improvement. This can be explained by the fact that it uses feature extraction to optimize the learning sets used to train the base classifiers, which improves the predictive capability compared with other ensembles (AdaBoost, LogitBoost, and Bagging).
A major advantage of the four machine learning algorithms is that they automate the process of examining several databases to collect valuable information. Along with automating the analysis of large datasets, they can cater to specific assumptions that can be used to support planning decisions. Regardless, machine learning algorithms have several disadvantages. For example, the data must be processed before being used as an input into the preferred algorithm, and the processing method can have a major impact on the results. Moreover, data preparation before classification using machine learning algorithms is time-consuming.
6. Conclusions
Landslide susceptibility modeling is one of most important methods of addressing human casualties and socioeconomic losses during disasters. Therefore, high-performance landslide prediction models are useful tools for government institutions to develop landslide hazard prevention and mitigation strategies.
We used the ensemble classifier method to determine the landslide susceptibility across the study area in Sacheon-myeon, South Korea. The results revealed that all four landslide models had high performances (AUC > 0.8). However, the Multiclass Classifier model offered the highest prediction capability (AUC = 0.859), followed by the Bagging (0.854), LogitBoost (0.848), and AdaBoost (0.840) models. Overall, all landslide models in this study had higher accuracies than the traditional frequency ratio model (AUC = 0.817). Therefore, machine learning models represent a promising method for use in landslide susceptibility assessments in landslide-prone areas worldwide.
Because these results are representative of the currently implemented versions of these techniques, the performance of susceptibility models may be improved with future changes to the algorithm codes. However, the results in this study are only representative of the study area, and investigations for other areas with different terrains and geological contexts should be considered. With changes to some of the controlling factors, such as topography or hydrology, the four tested models could be applied to other areas with different geological conditions and different terrain conditions.
Finally, the resulting landslide susceptibility maps could assist decision-makers during site selection and planning processes. Such maps could also be accepted as a basis for landslide risk management studies to be applied to various study areas. Despite a number of weaknesses of the database, the machine learning modeling approach combined with remote sensing and GIS spatial data offers reasonable accuracy for landslide predictions.
Author Contributions
P.R.K. processed ensemble-based machine learning models for mapping of landslide susceptibility and wrote the paper. C.-W.L. suggested the idea of landslide susceptibility and organized the paper work. S.L. interpreted the results and designed the experiments. All of the authors contributed to the writing of each part.
Funding
This research was supported by the Basic Research Project of the Korea Institute of Geoscience and Mineral Resources (KIGAM) funded by the Ministry of Science and ICT, and The National Research Foundation of Korea (NRF) grant funded by the Korea government (MSIP) (No. 2017R1A2B4003258).
Acknowledgments
The first author acknowledges the support of the Kangwon National University Scholarship for his master degree studies.
Conflicts of Interest
The authors declare no conflict of interest.
References
- Lee, S.; Seong, W.J.; Oh, K.Y.; Lee, M.J. The spatial prediction of landslide susceptibility applying artificial neural network and logistic regression models: A case study of Inje, Korea. Open Geosci. 2016, 8, 117–132. [Google Scholar] [CrossRef]
- Kim, K.S.; Song, Y.S. Geometrical and geotechnical characteristics of landslides in Korea under various geological conditions. J. Mt. Sci. 2015, 12, 1267–1280. [Google Scholar] [CrossRef]
- Aleotti, P.; Chowdhury, R. Landslide hazard assessment: Summary review and new perspectives. Bull. Eng. Geol. Environ. 1999, 58, 21–44. [Google Scholar] [CrossRef]
- Wang, L.J.; Guo, M.; Sawada, K.; Lin, J.; Zhang, J. Landslide susceptibility mapping in Mizunami City, Japan: A comparison between logistic regression, bivariate statistical analysis and multivariate adaptive regression spline models. Catena 2015, 135, 271–282. [Google Scholar] [CrossRef]
- Tien Bui, D.; Ho, T.C.; Pradhan, B.; Pham, B.T.; Nhu, V.H.; Revhaug, I. GIS-based modeling of rainfall-induced landslides using data mining-based functional trees classifier with AdaBoost, Bagging, and MultiBoost ensemble frameworks. Environ. Earth Sci. 2016, 75, 1–22. [Google Scholar] [CrossRef]
- Crosta, G.B.; Imposimato, S.; Roddeman, D.G. Numerical modelling of large landslides stability and run out. Nat. Hazards Earth Syst. Sci. 2003, 3, 523–538. [Google Scholar] [CrossRef]
- Di, B.; Stamatopoulos, C.A.; Dandoulaki, M.; Stavrogiannopoulou, E.; Zhang, M. A method predicting the earthquake-induced landslide risk by back analyses of past landslides and its application in the region of the Wenchuan 12/5/2008 earthquake. Nat. Hazards 2017, 85, 903–927. [Google Scholar] [CrossRef]
- McDougall, S.; Hungr, O. A model for the analysis of rapid landslide motion across three-dimensional terrain. Can. Geotech. J. 2004, 41, 1084–1097. [Google Scholar] [CrossRef]
- Pastor, M.; Haddad, B.; Sorbino, G.; Cuomo, S.; Drempetic, V. A depth-integrated coupled SPH model for flow-like landslides and related phenomena. Int. J. Numer. Anal. Methods Geomech. 2009, 33, 143–172. [Google Scholar] [CrossRef]
- Stamatopoulos, C.; Di, B. Analytical and approximate expressions predicting post-failure landslide displacement using the multi-block model and energy methods. Landslides 2015, 12, 1207–1213. [Google Scholar] [CrossRef]
- Lee, S.; Hwang, J.; Park, I. Application of data-driven evidential belief functions to landslide susceptibility mapping in Jinbu, Korea. Catena 2013, 100, 15–30. [Google Scholar] [CrossRef]
- Oh, H.J.; Lee, S.; Hong, S.M. Landslide susceptibility assessment using frequency ratio technique with iterative random sampling. J. Sens. 2017, 2017, 21. [Google Scholar] [CrossRef]
- Pradhan, A.M.S.; Kang, H.S.; Lee, S.; Kim, Y.T. Spatial model integration for shallow landslide susceptibility and its run out using a GIS-based approach in Yongin, Korea. Geocarto Int. 2017, 32, 420–441. [Google Scholar] [CrossRef]
- Oh, H.J.; Lee, S. Shallow landslide susceptibility modeling using the data mining models artificial neural network and boosted tree. Appl. Sci. 2017, 7, 1000. [Google Scholar] [CrossRef]
- Tien Bui, D.; Tuan, T.A.; Klempe, H.; Pradhan, B.; Revhaug, I. Spatial prediction models for shallow landslide hazards: A comparative assessment of the efficacy of support vector machines, artificial neural networks, kernel logistic regression, and logistic model tree. Landslides 2015, 13, 361–378. [Google Scholar] [CrossRef]
- Aditian, A.; Kubota, T.; Shinohara, Y. Comparison of GIS-based landslide susceptibility models using frequency ratio, logistic regression, and artificial neural network in a tertiary region of Ambon, Indonesia. Geomorphology 2018, 318, 101–111. [Google Scholar] [CrossRef]
- Lee, S.; Won, J.S.; Jeon, S.W.; Park, I.; Lee, M.J. Spatial landslide hazard prediction using rainfall probability and a logistic regression model. Math. Geosci. 2015, 47, 565–589. [Google Scholar] [CrossRef]
- Regmi, N.R.; Giardino, J.R.; McDonald, E.V.; Vitek, J.D. A comparison of logistic regression-based models of susceptibility to landslides in western Colorado, USA. Landslides 2014, 11, 247–262. [Google Scholar] [CrossRef]
- Chen, W.; Pourghasemi, H.R.; Zhao, Z. A GIS-based comparative study of Dempster-Shafer, logistic regression and artificial neural network models for landlside susceptibility mapping. Geocarto Int. 2017, 32, 367–385. [Google Scholar] [CrossRef]
- Kim, J.C.; Lee, S.; Jung, H.S.; Lee, S. Landslide susceptibility mapping using random forest and boosted tree models in Pyeong-Chang, Korea. Geocarto Int. 2017, 2017, 1–16. [Google Scholar] [CrossRef]
- Pradhan, B. A comparative study on the predictive ability of the decision tree, support vector machine and neuro-fuzzy models in landslide susceptibility mapping using GIS. Comput. Geosci. 2013, 51, 350–365. [Google Scholar] [CrossRef] [Green Version]
- Pham, B.T.; Khosravi, K.; Prakash, I. Application and comparison of decision tree-based machine learning methods in landslide susceptibility assessment at Pauri Garhwal area, Uttarakhand, India. Environ. Process. 2017, 4, 711–730. [Google Scholar] [CrossRef]
- Kavzoglu, T.; Sahin, E.K.; Colkesen, I. Landslide susceptibility mapping using GIS based multi-criteria decision analysis, support vector machines, and logistic regression. Landslides 2014, 11, 425–439. [Google Scholar] [CrossRef]
- Lee, S.; Hong, S.; Jung, H. A support vector machine for landslide susceptibility mapping in Gangwon province, Korea. Sustainability 2017, 9, 48. [Google Scholar] [CrossRef]
- Kalantar, B.; Pradhan, B.; Naghibi, S.A.; Motevalli, A.; Mansor, S. Assessment of the effects of training data selection on the landslide susceptibility mapping: A comparison between support vector machine (SVM), logistic regression (LR) and artificial neural network (ANN). Geomat. Nat. Hazard Risk 2018, 9, 49–69. [Google Scholar] [CrossRef]
- Lee, S.; Song, K.Y.; Oh, H.J.; Choi, J. Detection of landslide using web-based aerial photographs and landslide susceptibility mapping using geospatial analysis. Int. J. Remote Sens. 2012, 33, 4937–4966. [Google Scholar] [CrossRef]
- Lee, S.; Oh, H.J. Ensemble based landslide susceptibility maps in Jinbu area, Korea. In Terrigenous Mass Movements; Pradhan, B., Buchroithner, M., Eds.; Springer: Berlin\Heidelberg, Germany, 2012; Volume 67, pp. 193–220. ISBN 978-3-642-25494-9. [Google Scholar]
- Rokach, L. Ensemble-based classifiers. Artif. Intell. Rev. 2010, 33, 1–39. [Google Scholar] [CrossRef]
- Rodriguez, J.J.; Kuncheva, L.I.; Alonso, C.J. Rotation forest: A new classifier ensemble method. IEEE Trans. Pattern Anal. Mach. Intell. 2006, 28, 1619–1630. [Google Scholar] [CrossRef] [PubMed]
- Breiman, L. Bagging predictors. Mach. Learn. 1996, 24, 123–140. [Google Scholar] [CrossRef] [Green Version]
- Freund, Y.; Schapire, R. A decision-theoretic generalization of on-line learning and an application to boosting. J. Comput. Syst. Sci. 1997, 55, 119–139. [Google Scholar] [CrossRef]
- Webb, G.I. MultiBoosting: A technique for combining boosting and wagging. Mach. Learn. 2000, 40, 159–196. [Google Scholar] [CrossRef]
- Shun, B.; Wenjia, W. Investigation on diversity in homogenous and heterogeneous ensembles. In Proceedings of the 2006 IEEE International Joint Conference on Neural Network Proceedings, Vancouver, BC, Canada, 16–21 July 2006. [Google Scholar]
- Maudes, J.; Rodriguez, J.J.; Garcia-Osorio, C.; Garcia-Pedrajas, N. Random feature weights for decision tree ensemble construction. Inf. Fusion 2012, 13, 20–30. [Google Scholar] [CrossRef]
- Tien Bui, D.; Tien Ho, C.; Revhaug, I.; Pradhan, B.; Duy Nguyen, B. Landslide susceptibility mapping along the national road 32 of Vietnam using GIS-based j48 decision tree classifier and its ensembles. In Geoinformation and Cartography; Buchroithner, M., Prechtel, N., Burghardt, D., Eds.; Springer: Berlin/Heidelberg, Germany, 2014; pp. 303–317. ISBN 978-3-642-32618-9. [Google Scholar]
- Pham, B.T.; Tien Bui, D.; Dholakia, M.B.; Prakash, I.; Pham, H.V.; Mehmood, K.; Le, H.Q. A novel ensemble classifier of rotation forest and naive bayes for landslide susceptibility assessment at the Luc Yen district, Yen Bai province (Vietnam) using GIS. Geomat. Nat. Hazard Risk 2017, 8, 649–671. [Google Scholar] [CrossRef]
- Hong, H.; Liu, J.; Tien Bui, D.; Pradhan, B.; Acharya, T.D.; Pham, B.T.; Zhu, A.; Chen, W.; Ahmad, B.B. Landslide susceptibility mapping using J48 decision tree with adaboost, bagging and rotation forest ensembles in the Guangchang area (China). Catena 2018, 163, 399–413. [Google Scholar] [CrossRef]
- Bouckaert, R.R.; Frank, E.; Hall, M.; Kirkby, R.; Reutemann, P.; Seewald, A.; Scuse, D. WEKA Manual for Version 3-7-8; University of Waikato: Hamilton, New Zealand, 2013; pp. 29–166. [Google Scholar]
- Lee, S.; Lee, M.J. Detecting landslide location using KOMPSAT 1 and its application to landslide susceptibility mapping at the Gangneung area, Korea. Adv. Space Res. 2006, 38, 2261–2271. [Google Scholar] [CrossRef]
- Earth Explorer USGS. Available online: https://www.earthexplorer.usgs.gov/ (accessed on 8 August 2018).
- Guzzetti, F. Landslide fatalities and the evaluation of landslide risk in Italy. Eng. Geol. 2000, 58, 89–107. [Google Scholar] [CrossRef]
- Ercanoglu, M.; Gokceoglu, C. Use of fuzzy relations to produce landslide susceptibility map of a landslide prone area (West Black Sea Region, Turkey). Eng. Geol. 2004, 75, 229–250. [Google Scholar] [CrossRef]
- Daum map. Available online: http://map.daum.net (accessed on 5 June 2018).
- Conrad, O.; Bechtel, B.; Bock, M.; Dietrich, H.; Fischer, E.; Gerlitz, L.; Wehberg, J.; Wichmann, V.; Bohner, J. System for Automated Geoscientific Analysis (SAGA) v. 2.1.4. Geosci. Model Dev. 2015, 8, 1991–2007. [Google Scholar] [CrossRef]
- Moore, I.D.; Grayson, R.B.; Landson, A.R. Digital terrain modelling: A review of hydrological, geomorphological, and biological applications. Hydrol. Process. 1991, 5, 3–30. [Google Scholar] [CrossRef]
- De Reu, J.; Bourgeois, J.; Bats, M.; Zwertaegher, A.; Gelorini, V.; De Smedt, P.; Chu, W.; Antrop, M.; De Maeyer, P.; Finke, P.; et al. Application of the topographic position index to heterogeneous landscapes. Geomorphology 2013, 186, 29–49. [Google Scholar] [CrossRef]
- Schmidt, K.M.; Roering, J.J.; Stock, J.D.; Dietrich, W.E.; Montgomery, D.R.; Schaub, T. The variability of root cohesion as an influence on shallow landslide susceptibility in the Oregon Coast Range. Can. Geotech. J. 2001, 38, 995–1024. [Google Scholar] [CrossRef]
- Anbalagan, R. Landslide hazard evaluation and zonation mapping in mountainous terrain. Eng. Geol. 1992, 32, 269–277. [Google Scholar] [CrossRef]
- Carrara, A.; Cardinalli, M.; Detti, R.; Guzetti, F.; Pasqui, V.; Reichenbach, P. GIS techniques and statistical models in evaluating landslide hazard. Earth Surf. Process. Landf. 1991, 16, 427–445. [Google Scholar] [CrossRef]
- Dai, F.C.; Lee, C.F.; Xu, Z.W. Assessment of landslide susceptibility on the natural terrain of Lantau Island, Hong Kong. Environ. Geol. 2001, 40, 381–391. [Google Scholar] [CrossRef]
- Pachauri, A.K.; Gupta, P.V.; Chander, R. Landslide zoning in a part of the Garhwal Himalayas. Environ. Geol. 1998, 36, 325–334. [Google Scholar] [CrossRef]
- Bui, D.T.; Pradhan, B.; Nampak, H.; Bui, T.Q.; Tran, Q.A.; Nguyen, Q.P. Hybrid artificial intelligence approach based on neural fuzzy inference model and Meta-heuristic optimization for flood susceptibility modelling in a high-frequency tropical cyclone area using GIS. J. Hydrol. 2016, 540, 317–330. [Google Scholar] [CrossRef]
- Friedman, J.; Hastie, T.; Tibshirani, R. Additive logistic regression: A statistical view of boosting (with discussion and rejoinder by the authors). Ann. Stat. 2000, 28, 337–407. [Google Scholar] [CrossRef]
- Kowsari, K.; Brown, D.E.; Heidarysafa, M.; Meimandi, K.J.; Gerber, M.S.; Barnes, L.E. HDLTex: Hierarchical deep learning for text classification. In Proceedings of the 16th IEEE International Conference on Machine Learning and Applications (ICMLA), Cancun, Mexico, 18–21 December 2017; pp. 364–371. [Google Scholar]
- Irigaray, C.; Fernandez, T.; El Hamdouni, R.; Chacón, J. Evaluation and validation of landslide-susceptibility maps obtained by a GIS matrix method: Examples from the Betic Cordillera (southern Spain). Nat. Hazards 2007, 41, 61–79. [Google Scholar] [CrossRef]
- Kuncheva, L.I. Combining Pattern Classifiers: Methods and Algorithms; John Wiley & Sons, Inc.: Hoboken, NJ, USA, 2004; pp. 203–234. ISBN 0-471-21078-1. [Google Scholar]
Figure 1.
Location of the study area from Landsat Imagery, acquired on 21 July 2018 [40].
Figure 1.
Location of the study area from Landsat Imagery, acquired on 21 July 2018 [40].

Figure 2.
Satellite image of respective areas (a,c,e,g) before landslide occurrences from Daummap 2011 and (b,d,f,h) after landslide occurrences from Daummap 2008 [43].
Figure 2.
Satellite image of respective areas (a,c,e,g) before landslide occurrences from Daummap 2011 and (b,d,f,h) after landslide occurrences from Daummap 2008 [43].

Figure 3.
Digital elevation model and landslide occurrence in the study area.

Figure 4.
Spatial databases of the landslide causative factors; slope (a), aspect (b), maximum curvature (c), profile curvature (d), convexity (e), texture (f), mid-slope position (MSP) (g), topographic position index (TPI) (h), terrain ruggedness index (TRI) (i), flow accumulation (j), stream power index (SPI) (k), topographic wetness index (TWI) (l), land cover (m), soil (n), forest type (o), forest age (p), forest density (q), forest diameter (r), geology (s), distance from fault (t).


Figure 5.
Landslide susceptibility maps of the Sacheon-myeon area based on the (a) AdaBoost, (b) LogitBoost, (c) Multiclass Classifier, and (d) Bagging models.
Figure 5.
Landslide susceptibility maps of the Sacheon-myeon area based on the (a) AdaBoost, (b) LogitBoost, (c) Multiclass Classifier, and (d) Bagging models.


Figure 6.
Distribution of susceptibility classes in the landslide susceptibility maps constructed with the four machine learning models.
Figure 6.
Distribution of susceptibility classes in the landslide susceptibility maps constructed with the four machine learning models.

Figure 7.
Receiver operating characteristic (ROC) curve of the landslide susceptibility maps created using four algorithms from the Meta classifiers.
Figure 7.
Receiver operating characteristic (ROC) curve of the landslide susceptibility maps created using four algorithms from the Meta classifiers.

Figure 8.
Receiver operating characteristic (ROC) curve of the landslide susceptibility maps created using a traditional algorithm and the area under the curve (AUC) test result variables. The AUC of the frequency ratio method was 0.817.
Figure 8.
Receiver operating characteristic (ROC) curve of the landslide susceptibility maps created using a traditional algorithm and the area under the curve (AUC) test result variables. The AUC of the frequency ratio method was 0.817.


Table 1.
Data layers related to landslide susceptibility in the study area.
| Category | Factor | Data Type | Scale | Source |
|---|---|---|---|---|
| Topographic factors | Slope Aspect Maximum curvature Convexity Texture Mid-slope position Terrain ruggedness index Topographic position index | Grid 1 | 1:5000 | National Geographic Information Institute |
| Hydrologic factors | Flow accumulation Stream power index Topographic wetness index | Grid 1 | 1:5000 | National Geographic Information Institute |
| Land cover factors | Land use | Polygon 2 | 1:5000 | National Academy of Agricultural Science |
| Soil factors | Soil thickness | Polygon 2 | 1:5000 | National Academy of Agricultural Science |
| Forest factors | Forest type Forest age Forest density Forest diameter | Polygon 2 | 1:5000 | Korea Forest Research Institute |
| Geological factors | Lithology Distance from fault | Polygon 2 | 1:25,000 | Korean Institute of Geoscience and Mineral Resources |
1 Raster data file, 2 Shape data file.
Table 2.
Calculated parameters of the algorithms used in this study.
| Algorithm | Parameters |
|---|---|
| AdaBoost | Number of iterations, 10; Seed, 1; Percentage of weight mass, 100. |
| LogitBoost | Number of iterations, 10; Seed, 1; Percentage of weight mass, 100; Threshold of likelihood, −1.7976E308; Shrinkage, 1; Max threshold, 3; Thread pool, 1; Thread to batch prediction, 1. |
| Multiclass Classifier | Seed, 1; Number of method use, 0; Number of multipliers, 2; Ridge in the log-likelihood, 1.0E-8; Max number of iterations, −1. |
| Bagging | Number of iterations, 10; Seed, 1; Percentage of weight mass, 100; Number of execution slots, 1; Minimum number of instances, 2; Minimum variance for split, 0.001; Number of folds, 3; Maximum tree depth, −1. |
Table 3.
The area under the curve (AUC) of each model.
| Algorithm | AUC (Area Under the Curve) |
|---|---|
| AdaBoost | 0.840 1 |
| LogitBoost | 0.848 1 |
| Multiclass Classifier | 0.859 1 |
| Bagging | 0.854 1 |
1 The test result variables had at least one association between the positive actual state group and negative actual state group; therefore, the statistics may be biased.
© 2018 by the authors. Licensee MDPI, Basel, Switzerland. This article is an open access article distributed under the terms and conditions of the Creative Commons Attribution (CC BY) license (http://creativecommons.org/licenses/by/4.0/).
Share and Cite
MDPI and ACS Style
Kadavi, P.R.; Lee, C.-W.; Lee, S. Application of Ensemble-Based Machine Learning Models to Landslide Susceptibility Mapping. Remote Sens. 2018, 10, 1252. https://doi.org/10.3390/rs10081252
AMA Style
Kadavi PR, Lee C-W, Lee S. Application of Ensemble-Based Machine Learning Models to Landslide Susceptibility Mapping. Remote Sensing. 2018; 10(8):1252. https://doi.org/10.3390/rs10081252
Chicago/Turabian StyleKadavi, Prima Riza, Chang-Wook Lee, and Saro Lee. 2018. "Application of Ensemble-Based Machine Learning Models to Landslide Susceptibility Mapping" Remote Sensing 10, no. 8: 1252. https://doi.org/10.3390/rs10081252
Note that from the first issue of 2016, this journal uses article numbers instead of page numbers. See further details here.