1. Introduction
Like the other islands between Japan and the Philippines off the eastern and southeastern coasts of Asia, Taiwan is visited by three to four typhoons per year, on average. Some extreme cases of torrential and sustained rainfall brought by typhoons have caused flooding, severe damage, and significant loss of lives and properties in the past two decades, such as the flooding in Taipei caused by severe Typhoon Winnie (18 August 1997); the flooding in Kaohsiung and Pingtung caused by Tropical Storm Trami (11 July 2001); the flooding in Taipei and Keelung caused by Typhoon Nari (17 September 2001); the flooding in Kaohsiung and Pingtung caused by Typhoon Mindulle (2–4 July 2004); the flooding in middle and southern Taiwan caused by Typhoon Kalmaegi (17–18 July 2008), and the flooding in middle, eastern, and southern Taiwan caused by Typhoon Morakot (6–10 August 2009). To improve our knowledge of flood prevention and emergency response requires a sound collection and analysis of information that is transformed from a huge amount of data. Apart from the historical, real-time, and forecast data in meteorology, the status of pumping stations and mobile machines, the available resources and facilities, as well as many other data, are both crucial and useful to the government and general public. The data must be identified, collected, integrated, processed, analyzed, distributed, and visualized rapidly through the Internet, in order to support a variety of management decisions, particularly a timely response to an urgent event. This was not possible until the Google Earth application programming interface (API) was released on 28 May 2008. After the devastating Typhoon Morakot hit Taiwan in August 2009, the Google Earth API was employed to develop the Formosat-2 pre- and post-Morakot image-comparison system [
1] that succeeded in rapid distribution of geospatial information to the general public and government agencies (
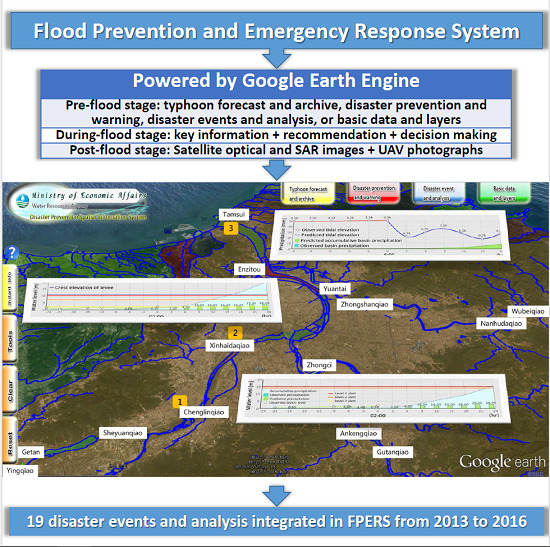
http://research.ncku.edu.tw/re/articles/e/20110429/1.html). In light of the great potential revealed by the system, the Water Resource Agency (WRA) of Taiwan initiated a multi-year project from 2012 to 2016, which led to the development of the Flood Prevention and Emergency Response System (FPERS) powered by Google Earth Engine (GEE).
This paper reviews the efforts made and experiences gained in developing FPERS using GEE, with focus on its applications at different stages and some examples of success. Motivated by the demand for processing a large amount of Formosat-2 imagery (2 m resolution) to support a rapid response to disasters caused by Typhoon Morakot, a new super-overlay tool for creating image tiles was developed [
1] and incorporated into the Formosat-2 Automatic Image Processing System (F-2 AIPS) [
2]. In the aftermath of Japan’s earthquake and tsunami on March 11, 2011, we demonstrated that Formosat-2 imagery can be rapidly acquired, processed, and distributed through the Internet to global users by deploying the system through cloud servers [
3]. Therefore, FPERS was developed with an intention to collect and display the huge amount of relevant geospatial imagery, including Formosat-2 pre- and post-flood imagery (2-m resolution) used to detect and monitor barrier lakes, the synthetic aperture radar (SAR) imagery used to derive an inundation map [
4], and the high-spatial-resolution photos taken by unmanned aerial vehicles (UAV) to evaluate the damage to river channels and structures due to a debris flow [
5]. In spite of these successes, these data were mainly used for disaster assessment at the post-flood stage.
To expand the application of FPERS to the pre-flood stage, numerous hydrology and meteorology observation data and all the related geospatial data were identified and integrated in FPERS. The challenge was to host and share this tremendous amount of data with the flexible functions provided by GEE. These efforts marked the application of FPERS to the pre-flood stage. To support decision-making during typhoon events, a huge amount of real-time monitoring data from various sensors, such as the videos of water gates and bridge pillars captured by closed-circuit televisions (CCTVs), was also linked to FPERS. A special outsourcing function was developed that enabled users to upload photographs, video clips, or a paragraph of text to report the disaster areas. With such an unprecedented dataset integrated using FPERS, we proposed a set of standard operating procedures (SOPs) in which all related data are automatically loaded and displayed at different stages of a flood. Rapid data processing and analyses were also conducted to make suggestions of action to the decision makers. FPERS was successfully employed by the Water Hazard Mitigation Center (WHMC) of WRA to support the flood prevention and emergency response for Typhoon Soudelor in August 2015.
The successful development and operation of FPERS powered by GEE demonstrated that a huge amount of geospatial data can be effectively integrated and distributed through the Internet to support a variety of demands at different stages of response to floods. The capability of switching among different topographic models, as well as the flexibility of managing and searching for data through a geospatial database system, are also explained in this paper, and suggestions are made for future works.
2. Flood Prevention and Emergency Response System
The prototype of FPERS was the web-based Google Earth that enabled users to select image-based or vector-based datasets from a preset list and display them on a map as overlaid layers. With the backbone of GEE, FPERS not only had an easily accessible and user-friendly front-end, but also a powerful back-end with petabyte-scale data prepared and updated by Google for scientific analysis and visualization. We were able to add and curate more data and collections to FPERS, as long as the data was preprocessed and stored as standard tiles, following the rules specified by the Google Earth API. Displaying huge amounts of geospatial data in a 3D fashion, especially through the Internet, is supposed to be a resource-demanding task that required tedious amounts of coding and a large network bandwidth. Google would undertake all the required processing, whether a few or a multitude of users were using FPERS simultaneously from anywhere all over the world through the Internet. This capacity allowed this study to bypass purchasing the large processing power in the form of the latest computers or the latest software and allowed us to focus on the development and application of FPERS in three stages: post-, pre-, and during-flood.
2.1. Post-Flood Stage
In light of the successful case of rapid response to Typhoon Morakot using Formosat-2 imagery [
1], acquiring, processing, and sharing a huge amount of Formosat-2 imagery to the general public was set up as FPERS’ primary function. Although optical images obtained from spaceborne platforms are limited by weather in terms of mapping the inundated regions, they are advantageous for monitoring existing barrier lakes and detecting emergent ones that are formed in mountainous areas after a major typhoon or earthquake. This function is crucial because a barrier lake might have a large water capacity, and the catastrophic burst of a dam would result in significant casualties [
6,
7,
8].
2.1.1. Optical Satellite Imagery
When a natural disaster occurs, Formosat-2 is scheduled to be used to acquire images as soon as possible. All images are processed by F-2 AIPS, which is able to digest the Gerald format of the raw data; apply the basic radiometric and geometric corrections; output the level-1A product; and rigorously conduct band-to-band co-registration [
9], automatic orthorectification [
10], multi-temporal image geometrical registration [
11], multi-temporal image radiometric normalization [
12], spectral summation intensity modulation pan-sharpening [
9], the absolute radiometric calibration [
13], and super-overlay processing [
1]. For each image, all tiles are uploaded to a cloud machine. The link to the KML (Keyhole Markup Language) files is added to FPERS, so users can select and browse through a particular image in FPERS at different level-of-detail (LOD) in a 3D fashion. Both the pre- and post-disaster images of the same region are displayed synchronously in the dual window mode as well.
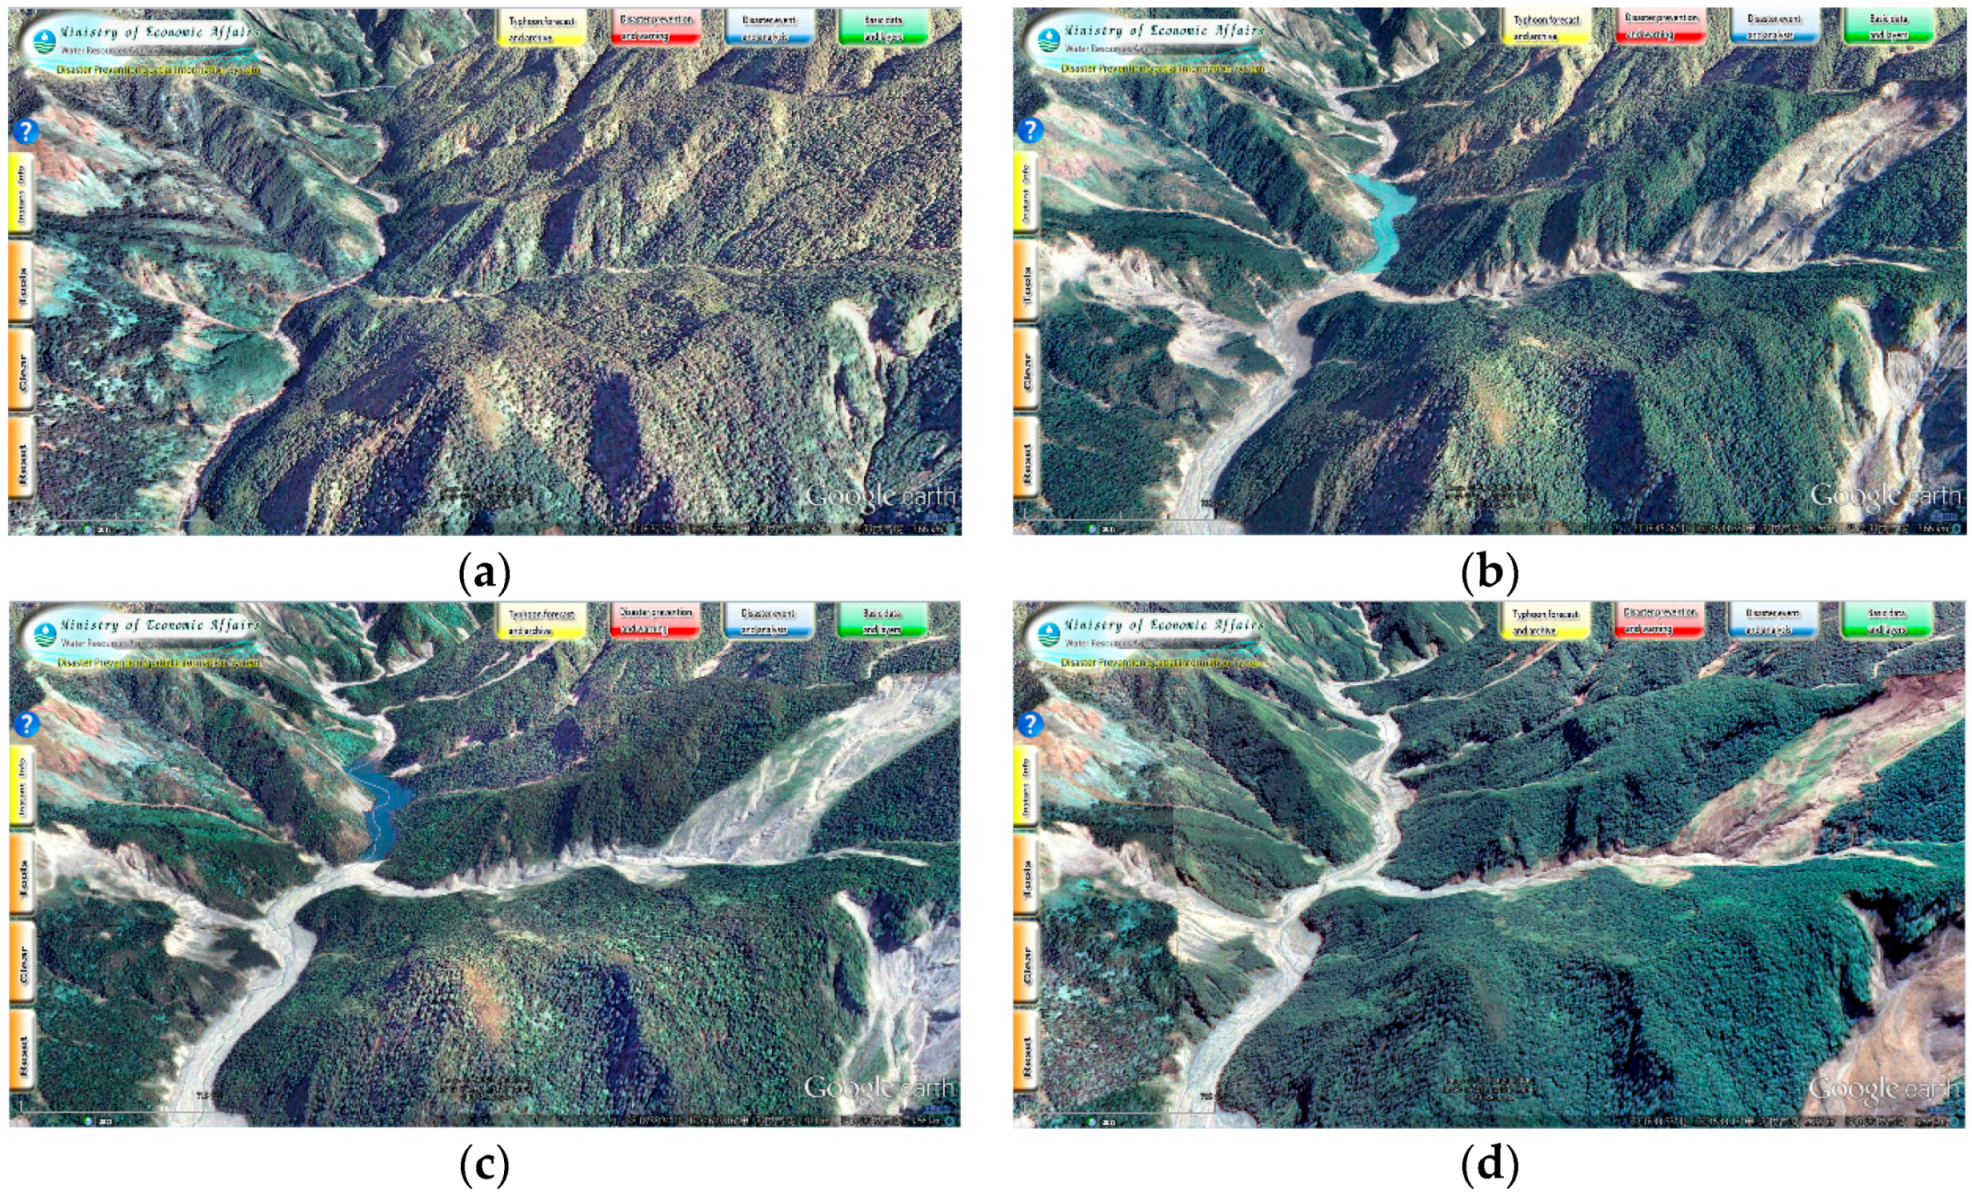
A total of 17 barrier lakes were formed after Typhoon Morakot in 2009. They have been continuously monitored by the Forest Bureau using various approaches and instruments ever since. Whenever there was a typhoon or torrential rain event, the most up-to-date status of these lakes were checked one by one via FPERS, using the pre- and post-event images in the dual window mode. As an example,
Figure 1 shows a barrier lake located upstream of the Qishan River that is inaccessible by vehicle. Its formation can be confirmed by comparing the Formosat-2 images acquired before (
Figure 1a) and after (
Figure 1b) Typhoon Morakot in 2009, while its destruction can also be confirmed by comparing the Formosat-2 images acquired before (
Figure 1c) and after (
Figure 1d) the torrential rain on 10 June 2012. All figures with their original resolutions and sizes are available in the
Supplementary Materials.
Apart from monitoring and detecting barrier lakes, comparing the pre- and post-event images acquired by Formosat-2 is also advantageous in terms of examining water conservancy facilities, including dikes, revetments, water intake and drainage facilities, canals, culverts, reservoirs, dams, and affiliated structures. Some examples include mapping the coverage of driftwood in Shimen Reservoir caused by Typhoon Soulik, tracking the spatiotemporal variation of the Gaoping River plume [
14], and monitoring reservoir water quality [
12]. However, when it comes to the original goal of FPERS—flood prevention and management—the optical imagery acquired from the spaceborne platforms tends to be limited by clouds. Therefore, the second function of FPERS is to photograph inundated areas using unmanned aerial vehicles (UAVs).
2.1.2. Unmanned Aerial Vehicle Photographs
UAVs provide an alternative approach to remote sensing that is much cheaper, safer, and more flexible for deployment in small areas. An automatic mission-planning and image-processing system was developed to plan a flight mission that generated three levels of georeferenced products. It was successfully employed to rapidly respond to several disaster events involving landslides or debris flows in Taiwan [
5]. To deploy a UAV to map the inundated areas, however, would be much more challenging because a flood usually rises and subsides in a very short period of time. The operation of UAVs is also restricted by rain and wind conditions, which are usually poor during a flood event. To tackle this challenge, we sent out a team to standby near the flooded region when the forecast and warning were received. Once the wind subsided, and the rain stopped, the UAV was deployed and operated in the first person view, with the intention to fly to the boundary of the inundated area.
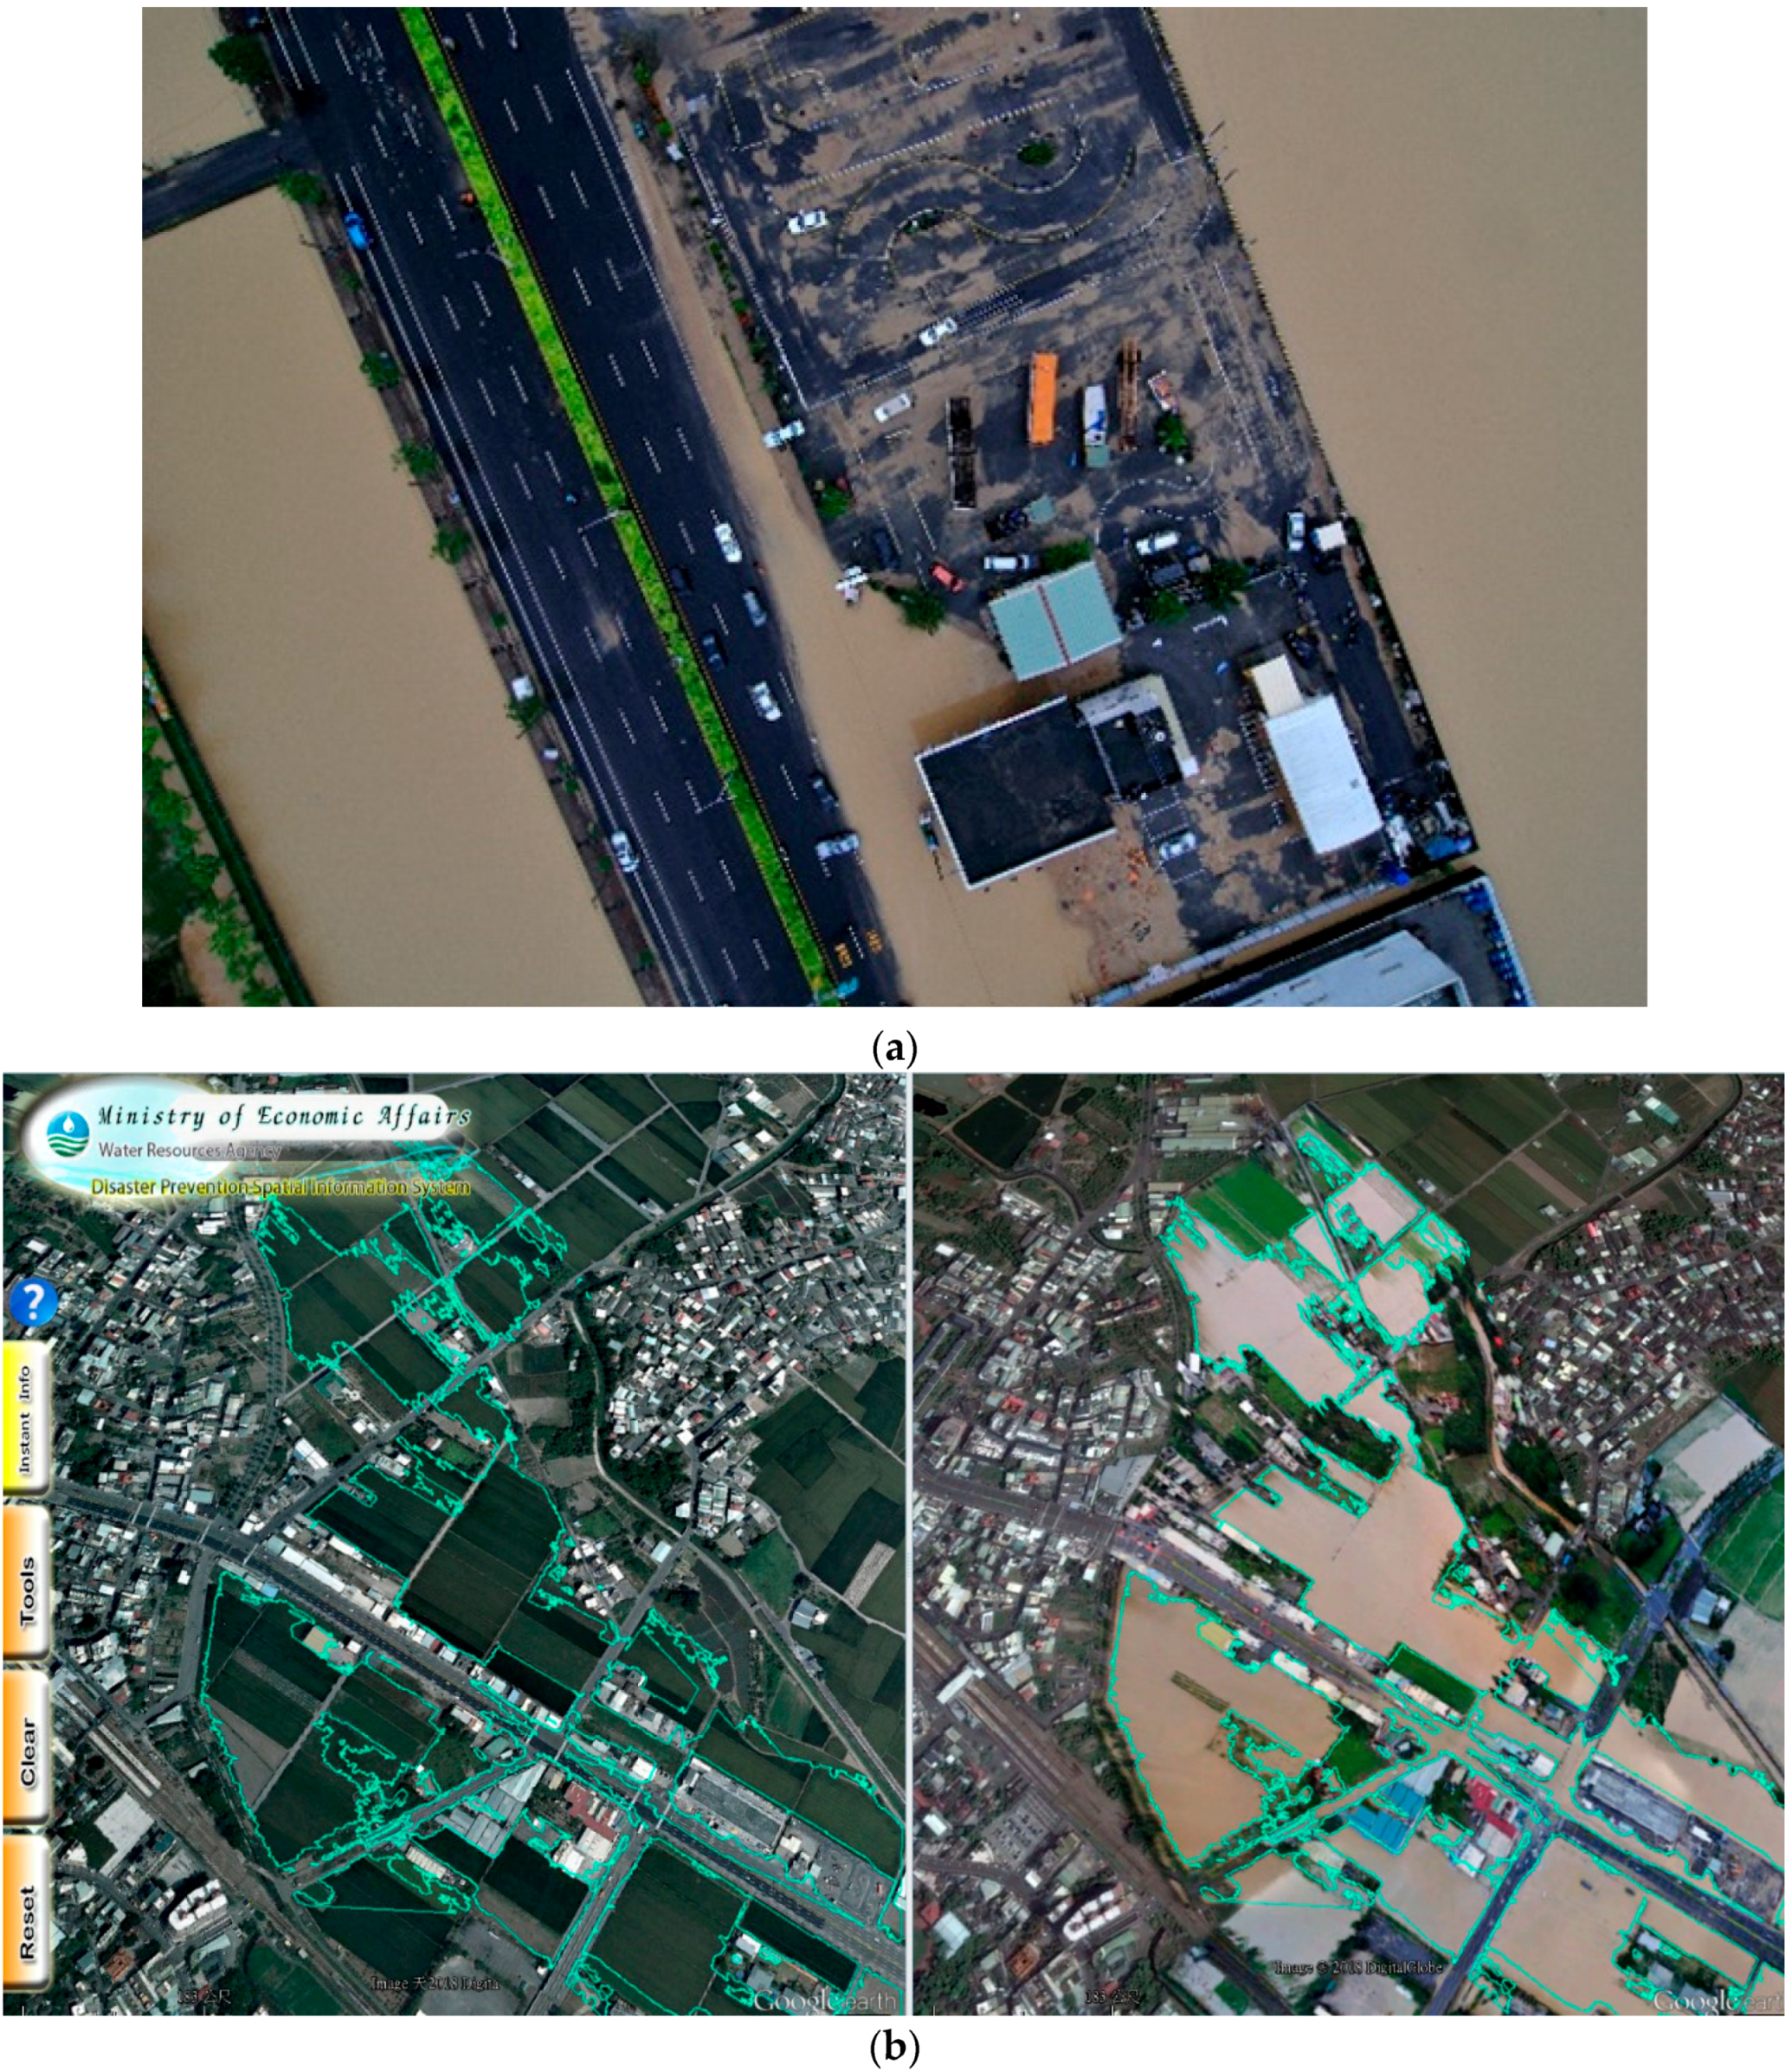
Figure 2a shows one of the 74 high-spatial-resolution photographs taken by a UAV in Minxiong, Chiayi County of Taiwan, caused by Typhoon Kong-Rey on 29 August 2013. The boundary of the inundated area can be clearly delineated from these photographs. All photographs were processed to one seamless, color-balanced, and georeferenced mosaic to publish on FPERS in dual-window mode (left: before-flood; right: after-flood) within 24 h, as shown in
Figure 2b.
2.1.3. Synthetic Aperture Radar Imagery
The feasibility of mapping the inundated areas with a low-cost UAV was proven by the Minxiong mission. However, the limitations of deploying a UAV under severe weather conditions to cover a large area were also highlighted by this mission. To remove those limitations, we were motivated to seek another type of imagery from SAR to derive an inundation map [
4]. Chung et al. reported a successful case of rapid response with a map of inundated areas derived from COSMO-SkyMed 1 radar satellite imagery during the July 2013 flood in I-Lan County in Taiwan, which was caused by Typhoon Soulik [
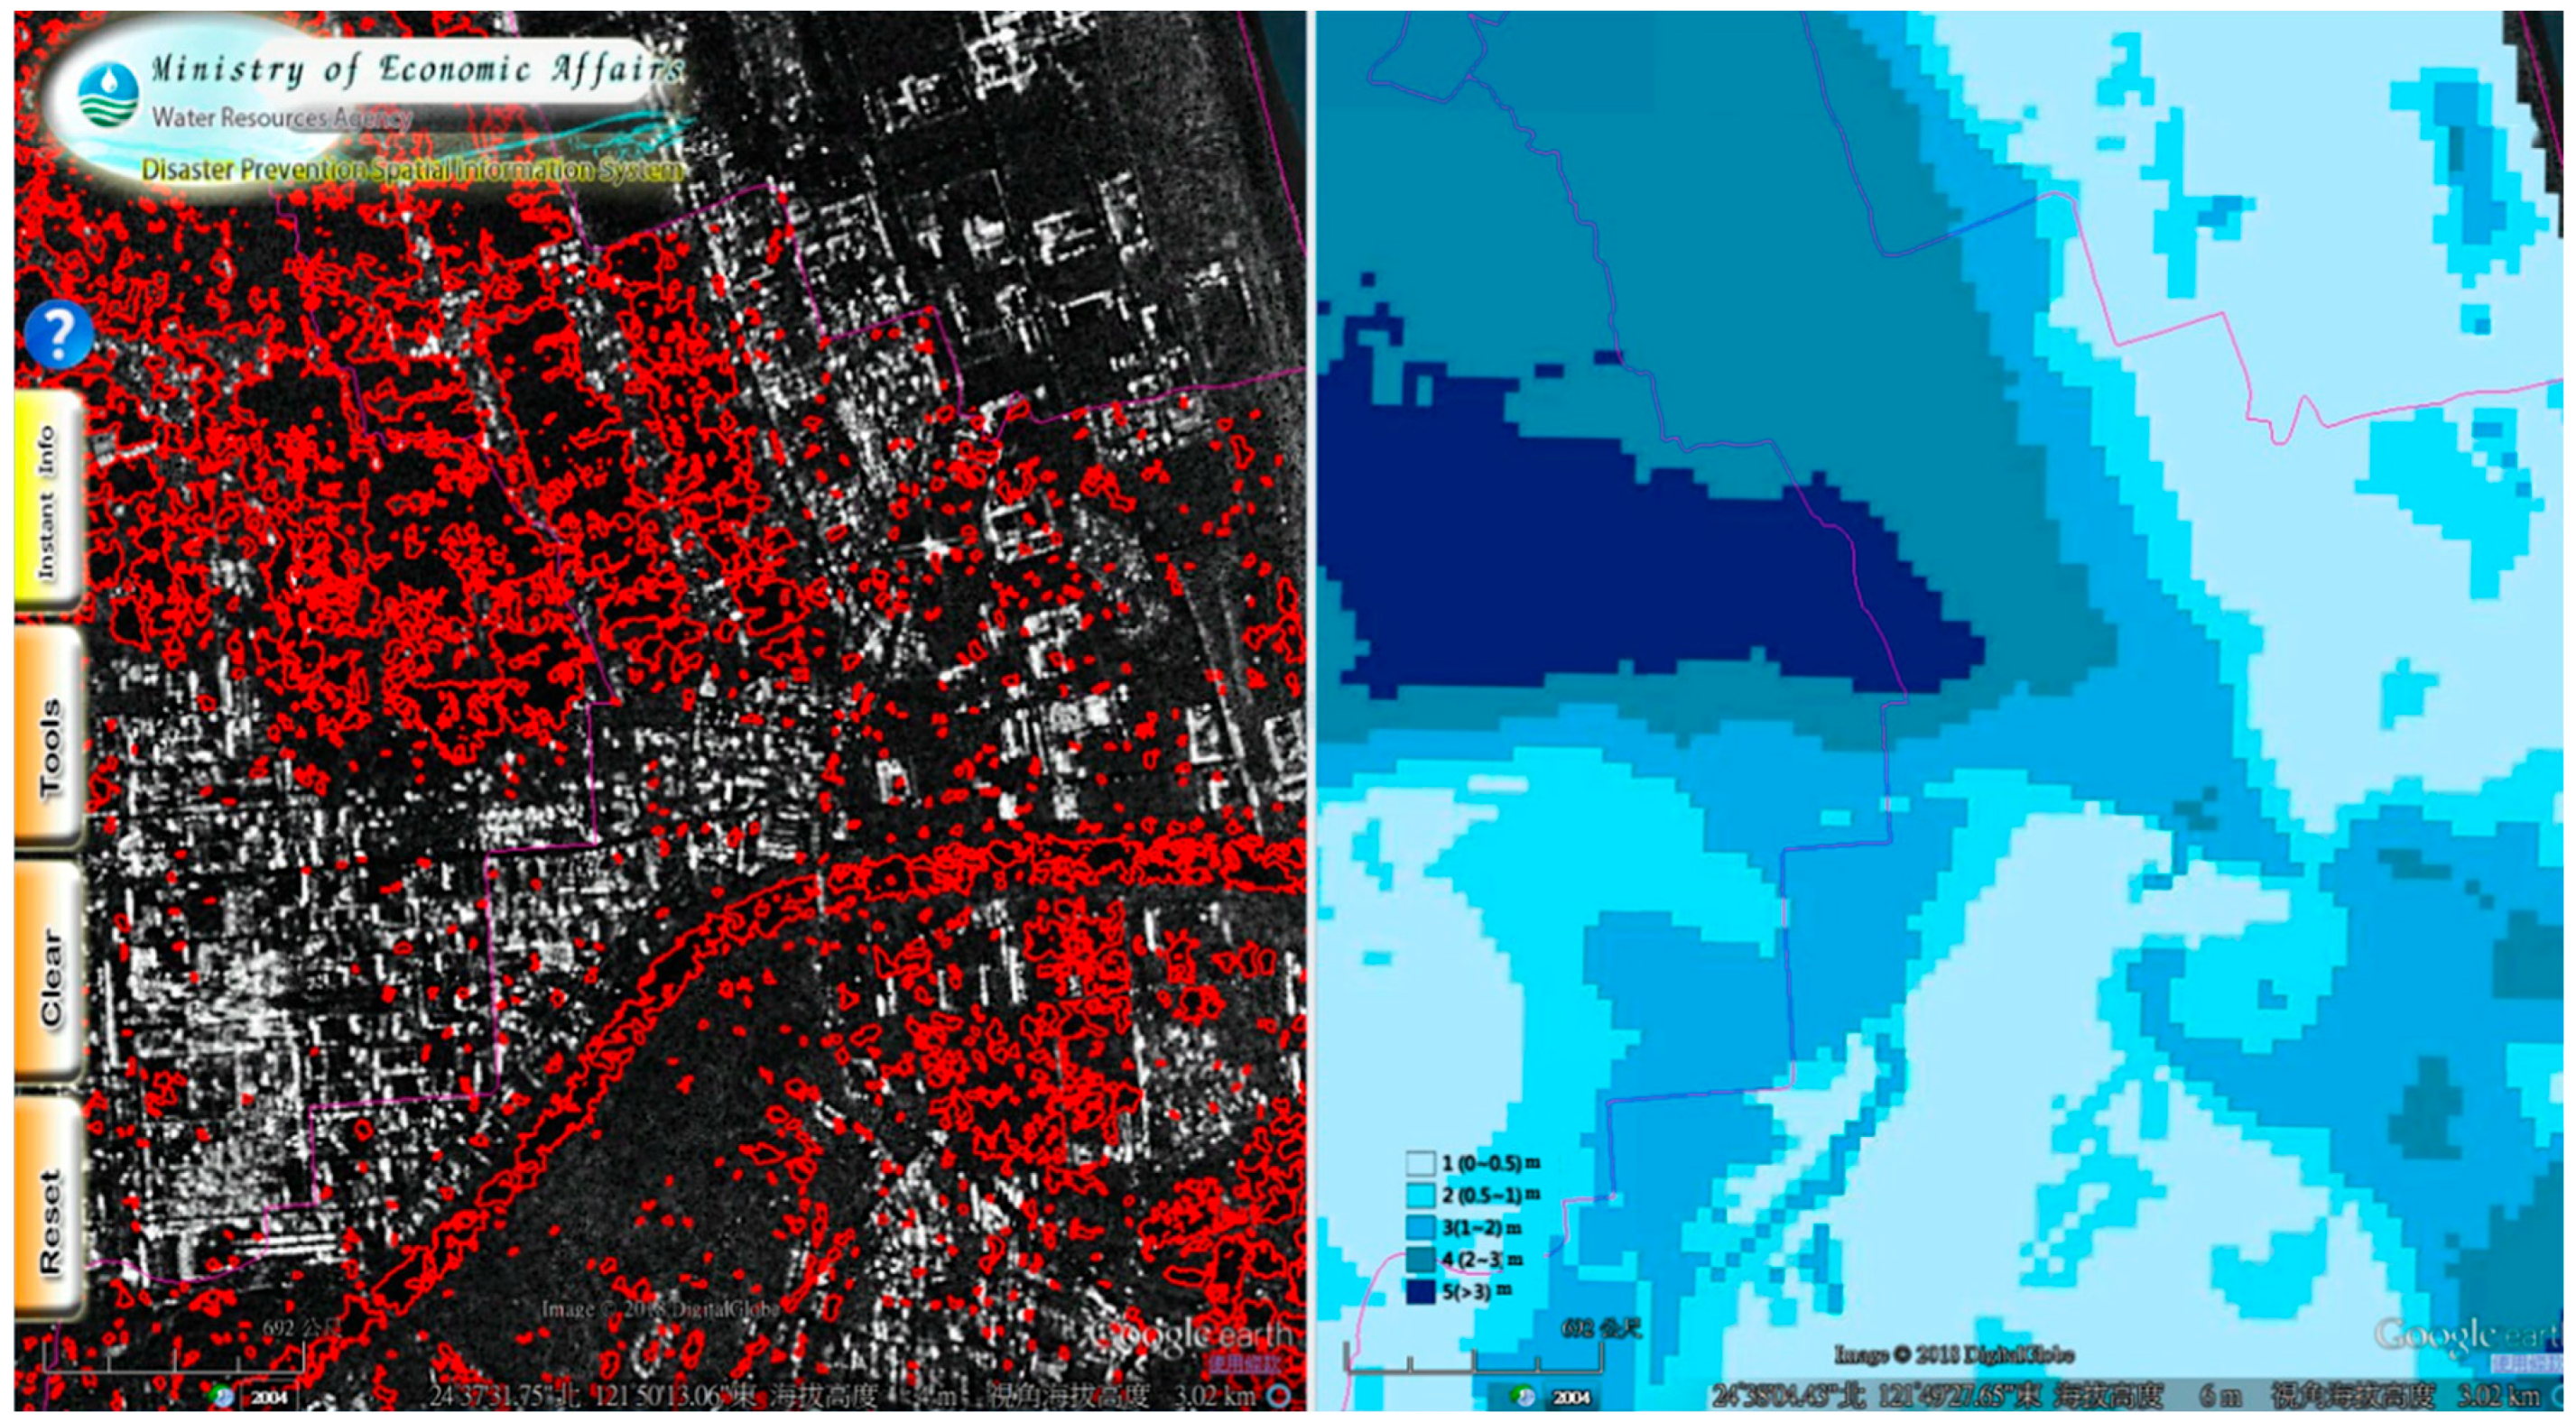
4]. An SOP was established to identify the inundated area on an SAR image with ancillary information from Formosat-2, and the flood depth was inferred based on a comparison between the flood extent map and different inundation potential maps. This procedure was adopted again after Typhoon Soudelor (August 2015), and the results were shared by FPERS in dual-window mode within 24 h after the SAR image was received, as shown in
Figure 3. The left window shows the SAR image of I-Lan County taken by COSMO-SkyMed 1 on 8 August 2015 (Typhoon Soudelor), overlaid with the inundated areas (red polygons), while the right window shows the same SAR image overlaid with the inferred flood depths (color polygons).
2.2. Pre-Flood Stage
The successful application of FPERS at the post-flood stage demonstrated its advantages related to rapid distribution of geospatial information, which also encouraged us to expand the FPERS application to the pre-flood stage. This involved identifying, collecting, integrating, processing, analyzing, distributing, and visualizing data rapidly through the Internet. We put the hydrology and meteorology data, as well as all the related geospatial data into the following four categories, because they are logical and convenient to store and search these data.
2.2.1. Typhoon Forecast and Archive
When a typhoon is approaching, and the warning is issued, the most updated forecasts of the typhoon path from various agencies always receive a lot of attention. Apart from the official forecast from the Central Weather Bureau (CWB) of Taiwan, the forecasts provided by the other agencies are all of great values as a reference, including the Japan Meteorological Agency (JMA), Hong Kong Observatory (HKO), the Joint Typhoon Warning Center (JTWC), the National Meteorological Center (NMC) of China Meteorological Administration (CMA), the Korea Meteorological Administration (KMA), the Philippine Atmospheric Geophysical and Astronomical Services Administration (PAGASA), and the Macao Meteorological and Geophysical Bureau (SMG). Although users could access each forecast from its original provider, FPERS integrated all forecasts in one place and allowed the users to overlay them with other useful geospatial layers, such as sea surface temperature and atmospheric pressure. This combination produced guidelines for quick evaluations of the forecasted typhoon path.
Another advantage of FPERS was that a comprehensive archive of typhoons provided by the CWB had also been integrated into the system, which traced back to 1958. To make the best use of this archive, we developed a function to compare the forecast of a typhoon path to all historical paths in the archive. When a typhoon is approaching Taiwan, 24 to 36 h before a typhoon warning is issued, the angle between each historical typhoon track and the CWB forecast typhoon track is calculated automatically. Five historical typhoons with the least values of angle will be listed in order. Similar historical typhoons obtained under the above conditions will vary with the actual location of current typhoons; therefore, the information users see is consistent with the latest and most immediate calculation result.
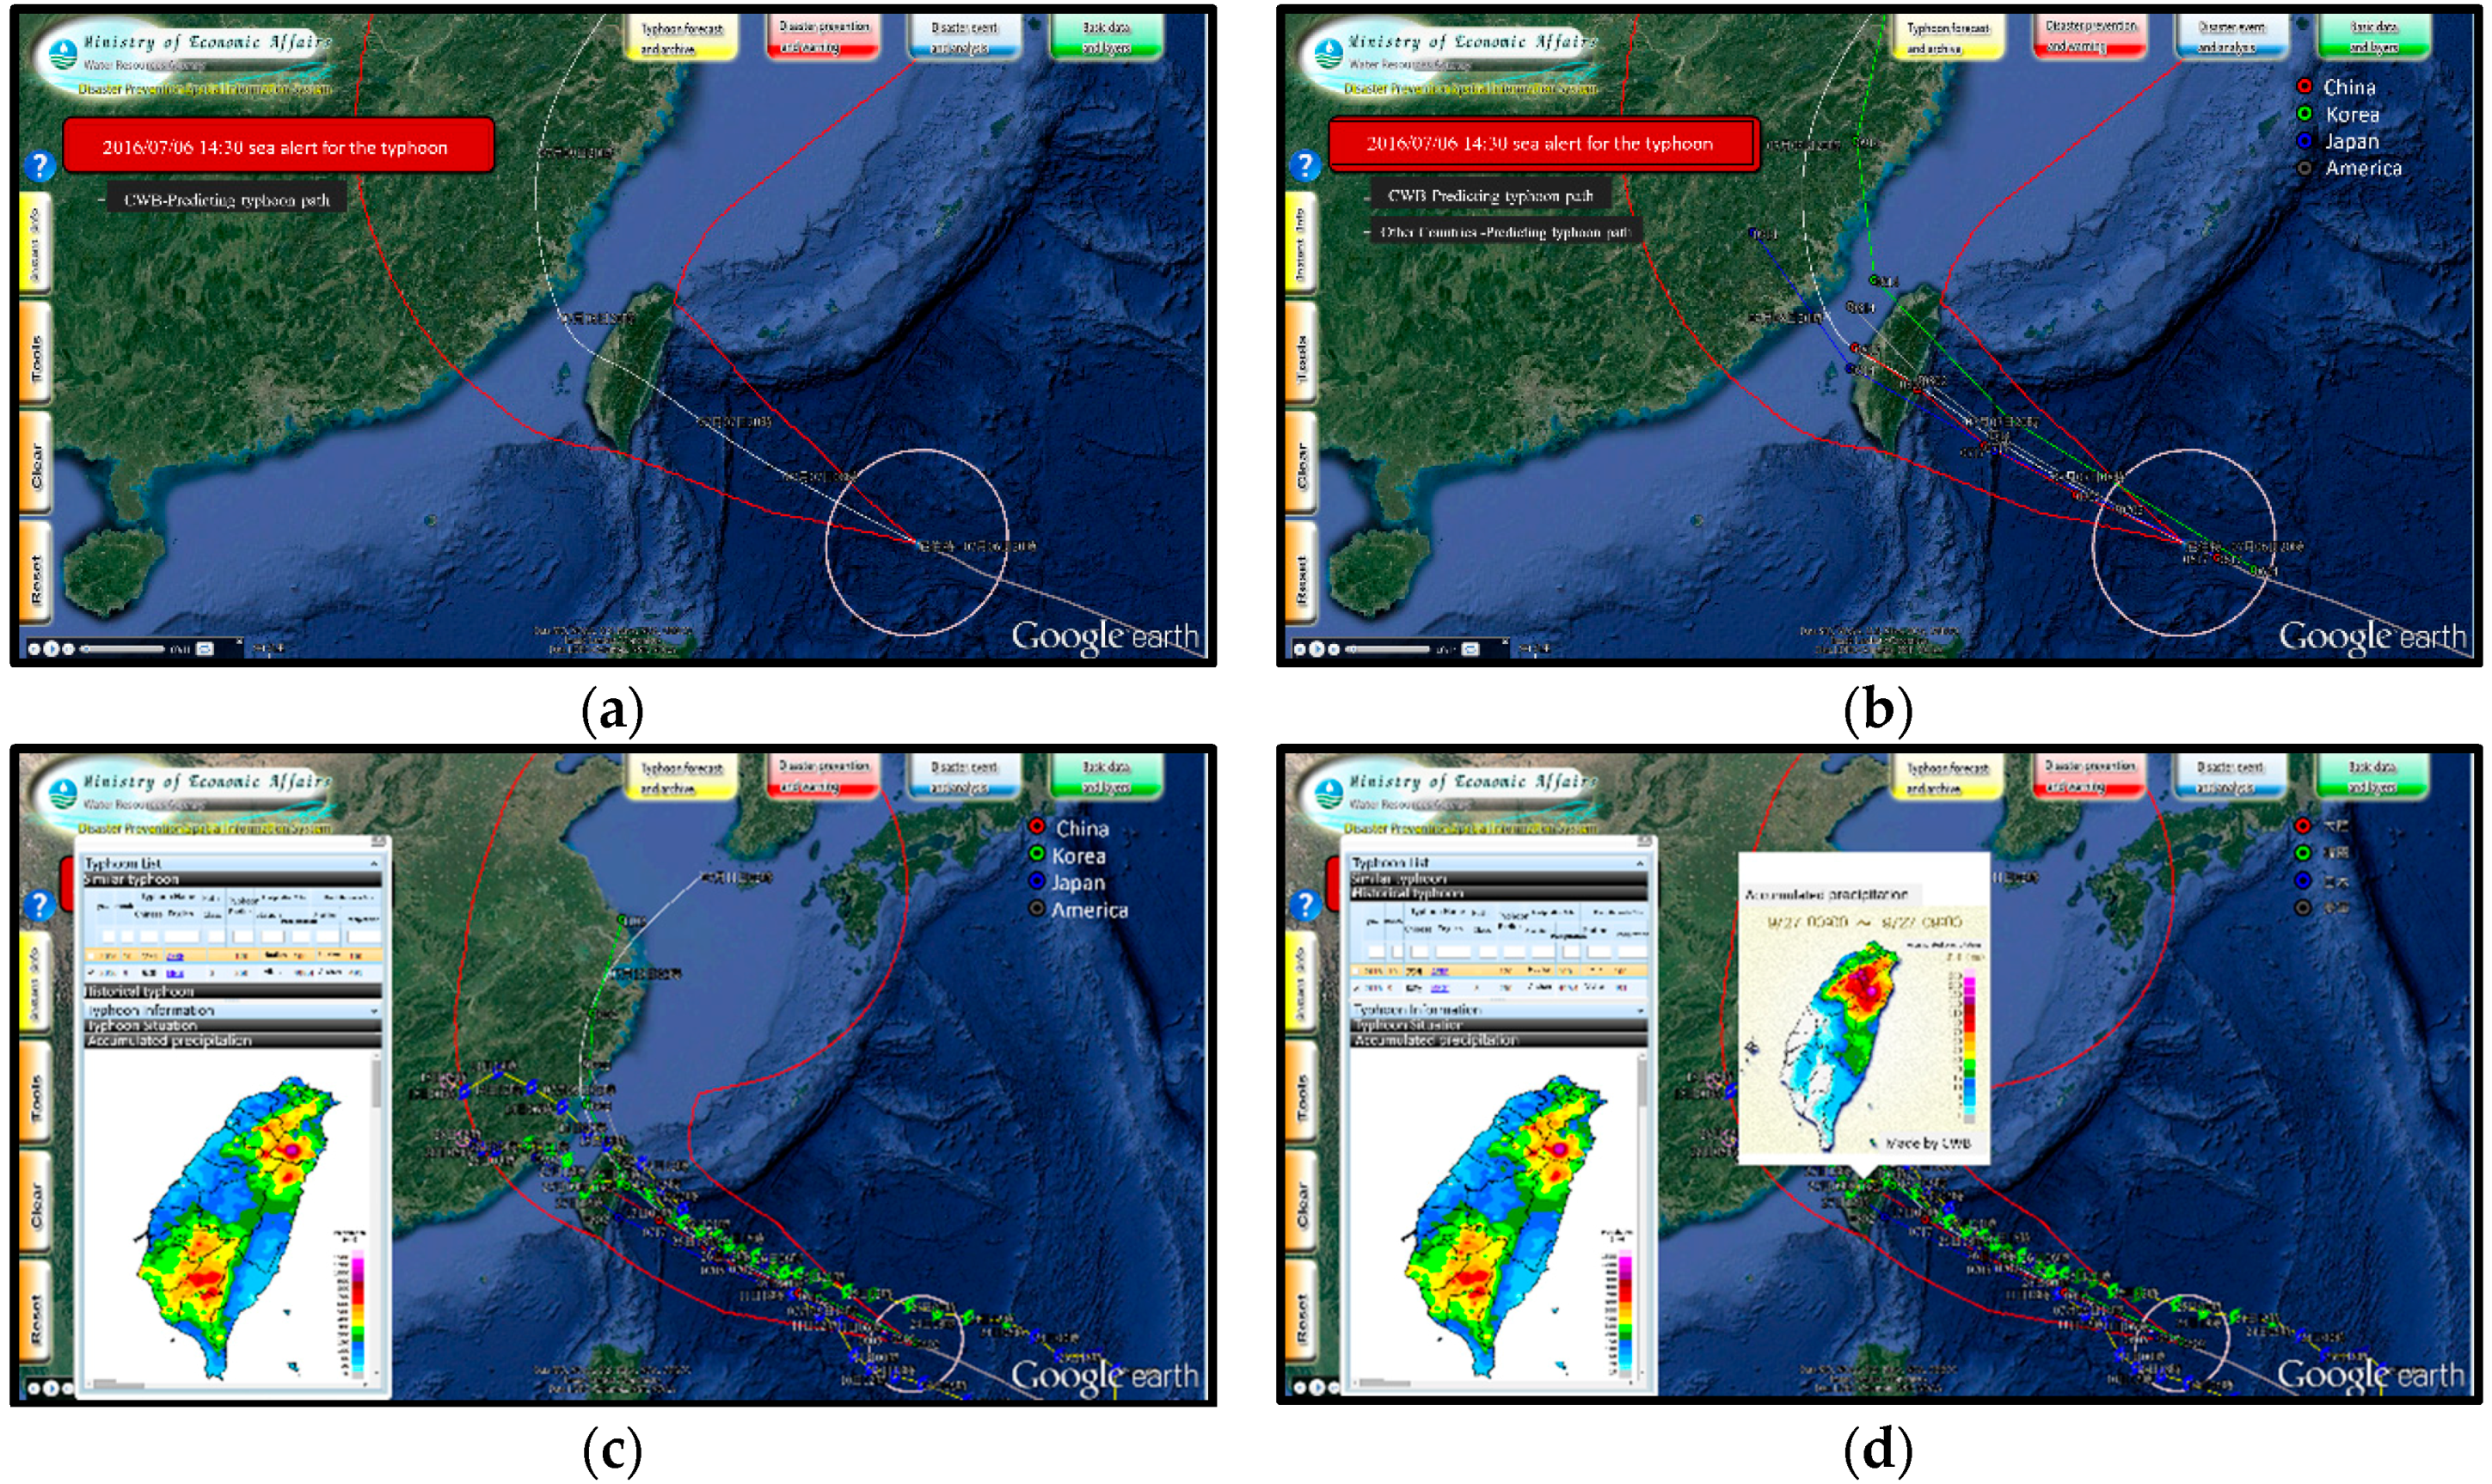
Figure 4 illustrates the application of the typhoon forecast and archive provided by FPERS for Typhoon Nepartak (8 July 2015). Based on the official forecast from the CWB at 14:00 on 7 July 2015 (
Figure 4a), the decision makers could evaluate this forecast by comparing it with the forecasts provided by the other agencies (
Figure 4b). In the meantime, FPERS compared this forecast with all historical paths in the archive and indicated that Typhoon Bilis (21 August 2000) had the closest path (
Figure 4c). The decision makers could refer to the historical typhoon and evaluate the possible disaster regions (
Figure 4d).
2.2.2. Disaster Prevention and Warning
Apart from typhoon forecast and archive, all other data related to disaster prevention and warning were identified, collected, and integrated in FPERS to support the decision-making and timely response to a flood event. The type of data used includes meteorology data, hydrology data, auxiliary data, or disaster alert.
- (1)
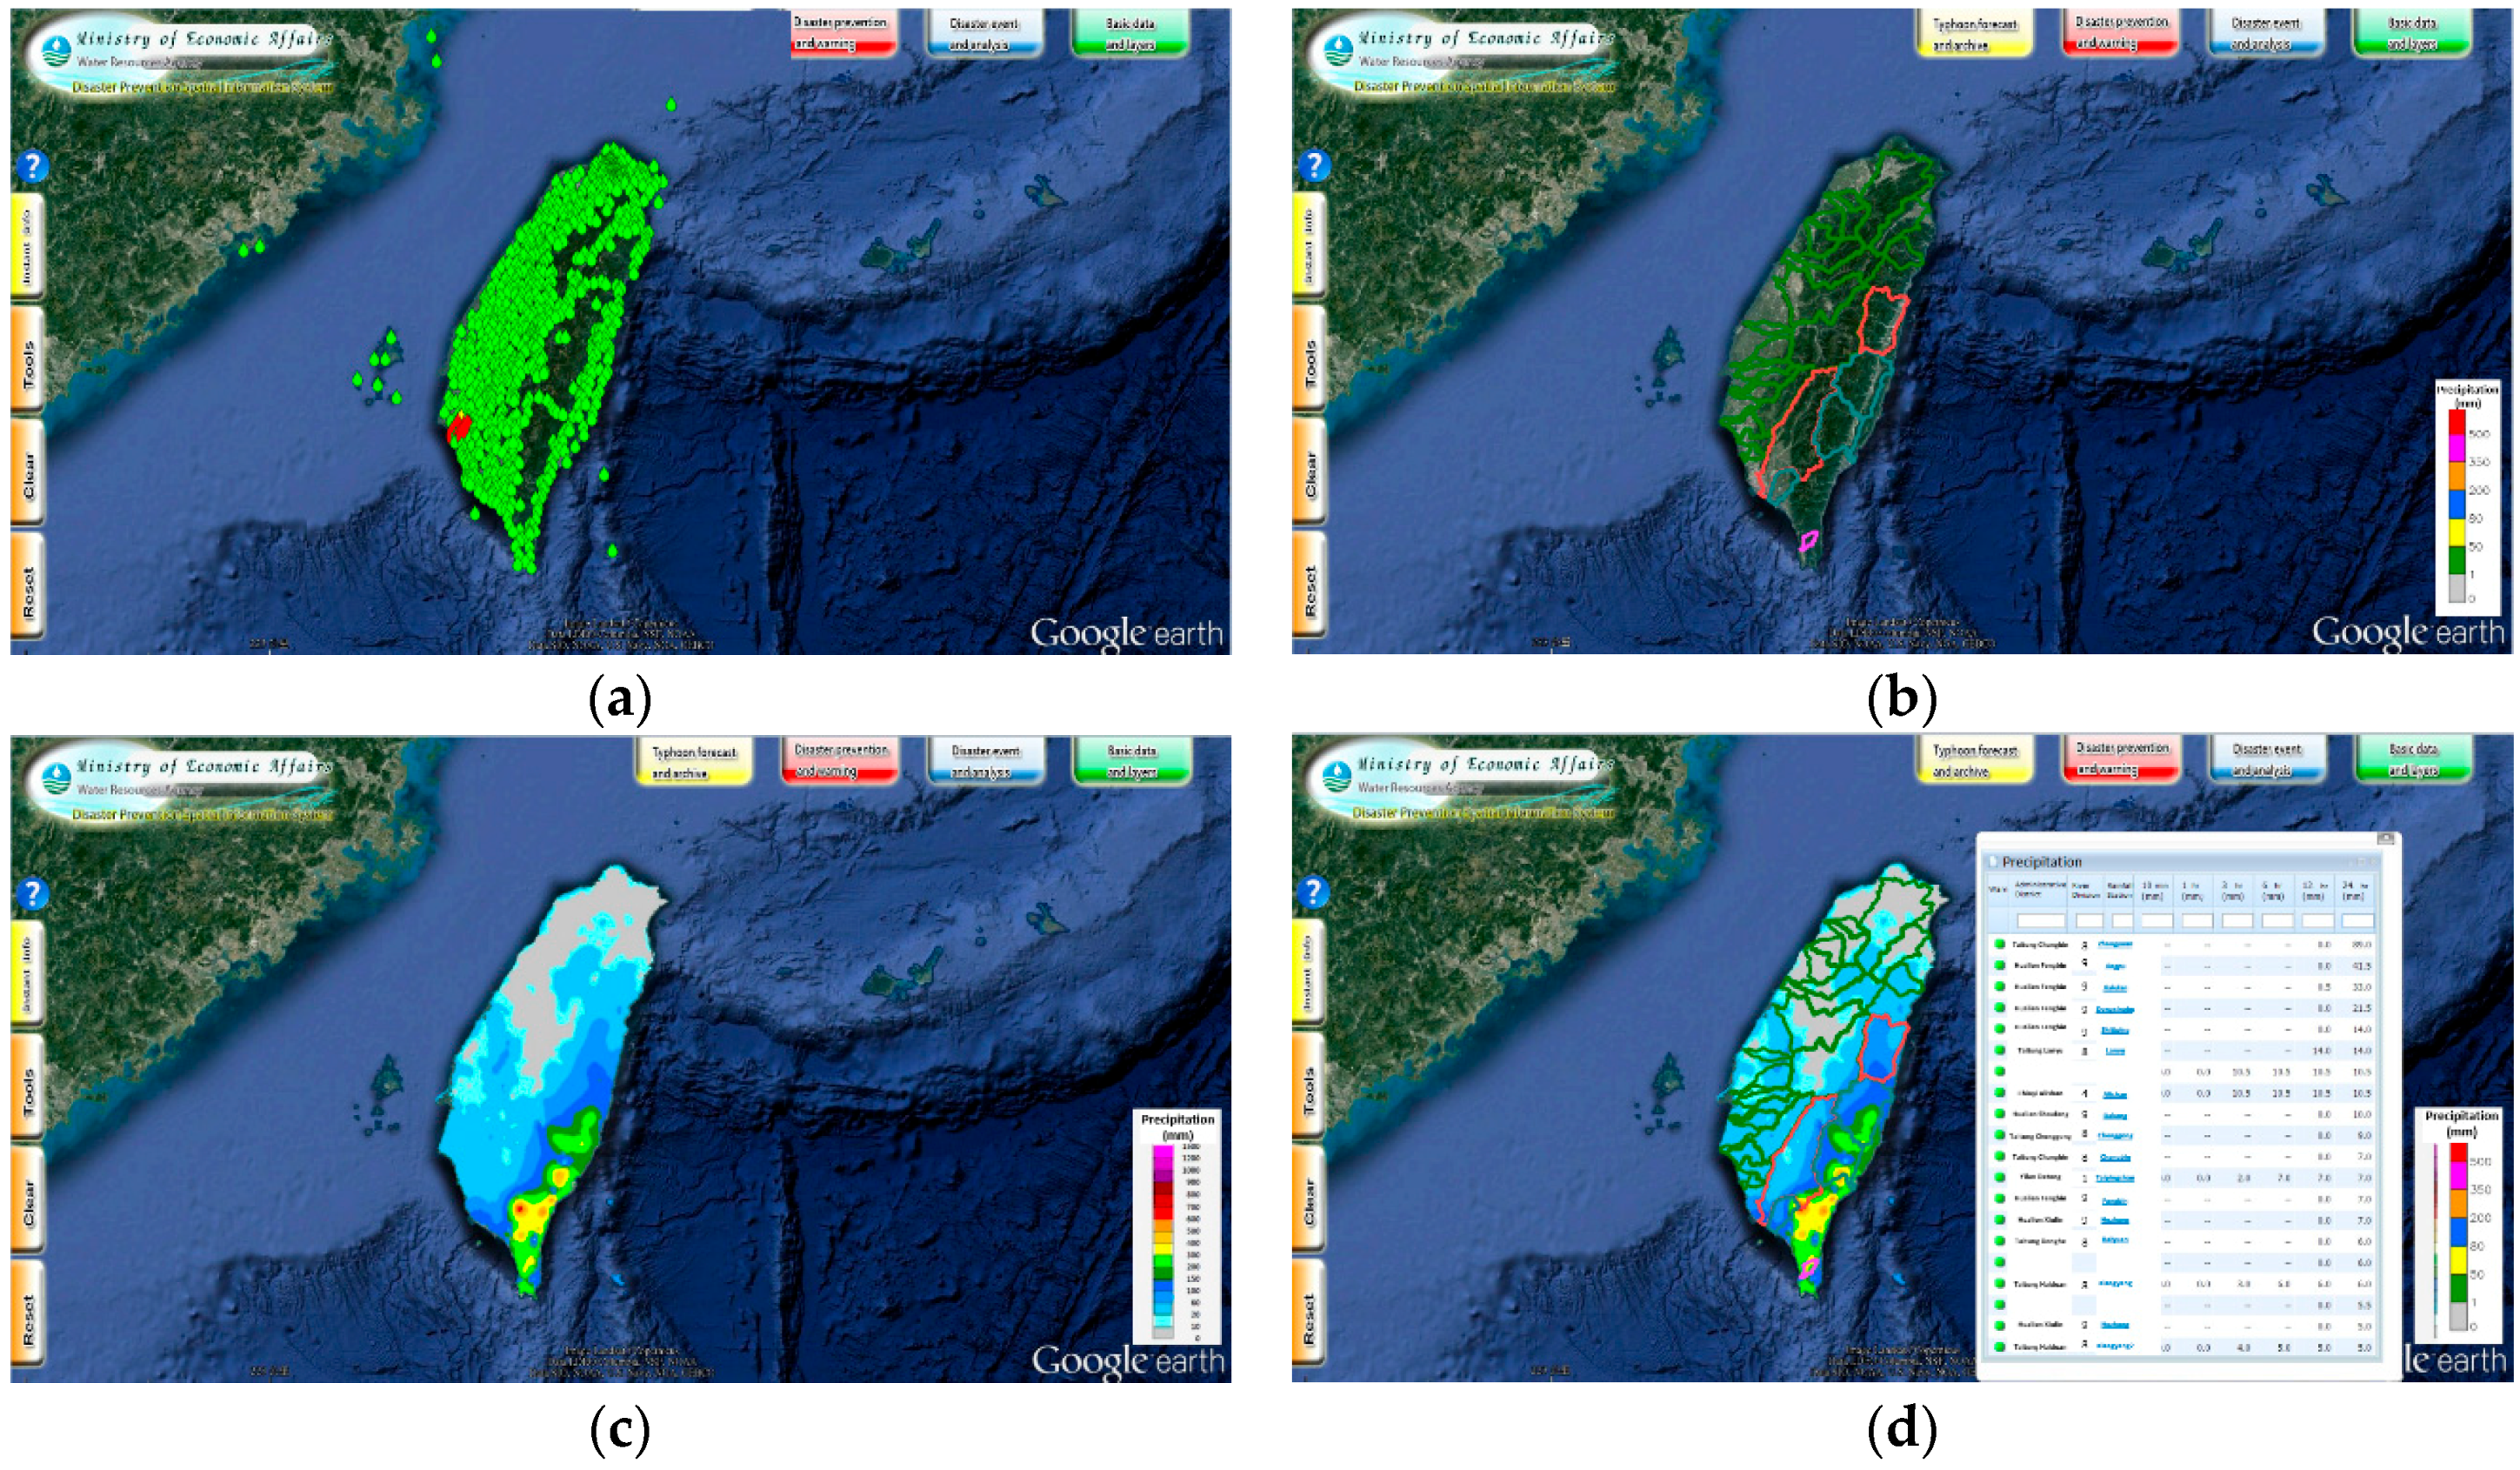
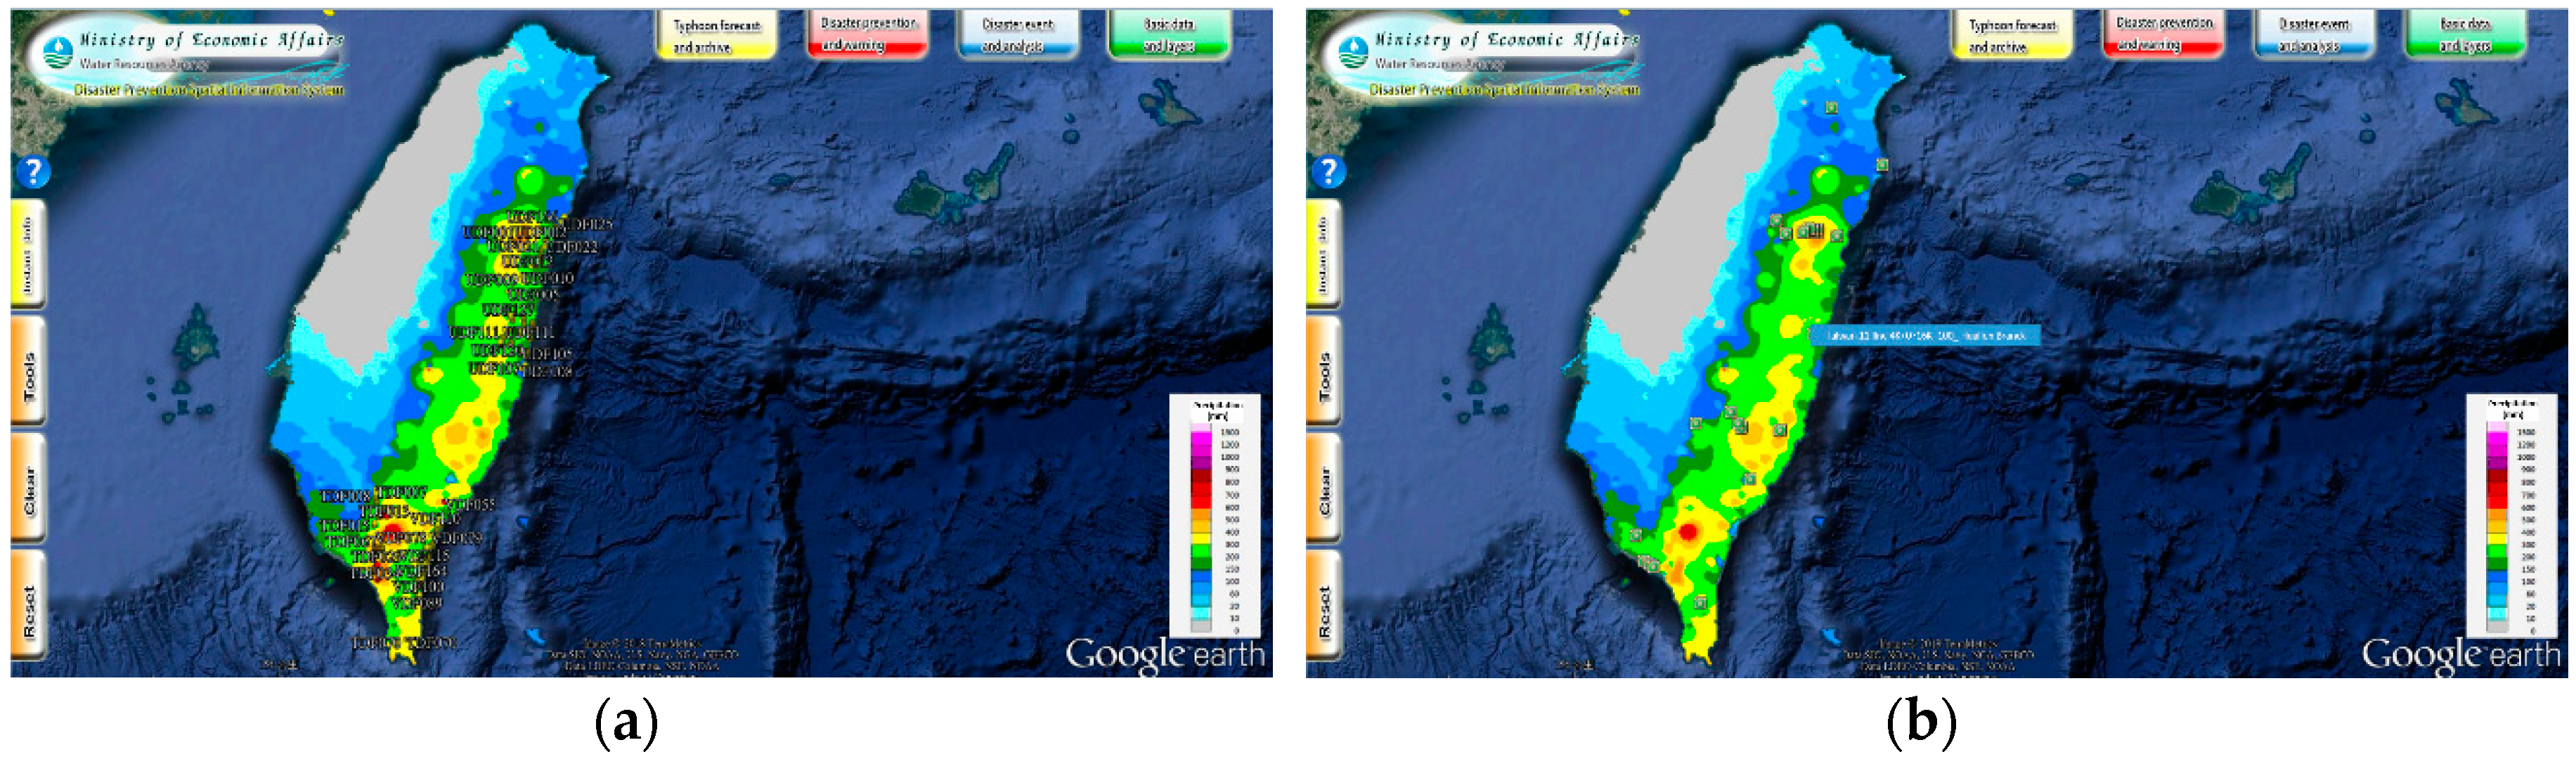
Meteorology Data: The rainfall distribution in Taiwan is extremely uneven as a result of the four major mountain ranges in the central region that include more than 200 peaks rising higher than 3000 m. For the same reason, the locations of the 916 rainfall stations in Taiwan are also restricted by topography and transportation (
Figure 5a), resulting in sparse observations of rainfall in mountainous areas. To tackle this problem, we followed the same Kriging interpolation approach that the CWB employs to generate the gridded precipitation from the real-time rainfall data transmitted from the 916 rainfall stations at intervals of 10 min. This gridded precipitation was further processed as basin, watershed, and administrative area rainfall, based on the polygons of integration in space (
Figure 5b). These products could be further processed to generate the one-hour, three-hour, six-hour, twelve-hour, twenty-four-hour, and daily accumulative rainfall, based on the polygons of integration in time (
Figure 5c). All these totals were automatically calculated, stored, and managed through a Microsoft SQL (Structured Query Language) database as the real-time rainfall data were transmitted from the 916 rainfall stations every 10 min. A user-friendly function was developed and implemented in FPERS to facilitate user searches, queries, comparisons, and sorting of all meteorological products (
Figure 5d). This function can help decision-makers convert the point precipitation from the 916 rainfall stations into colorful polygons of accumulative rainfall, based on the specified basin, watershed, or administrative area.
- (2)
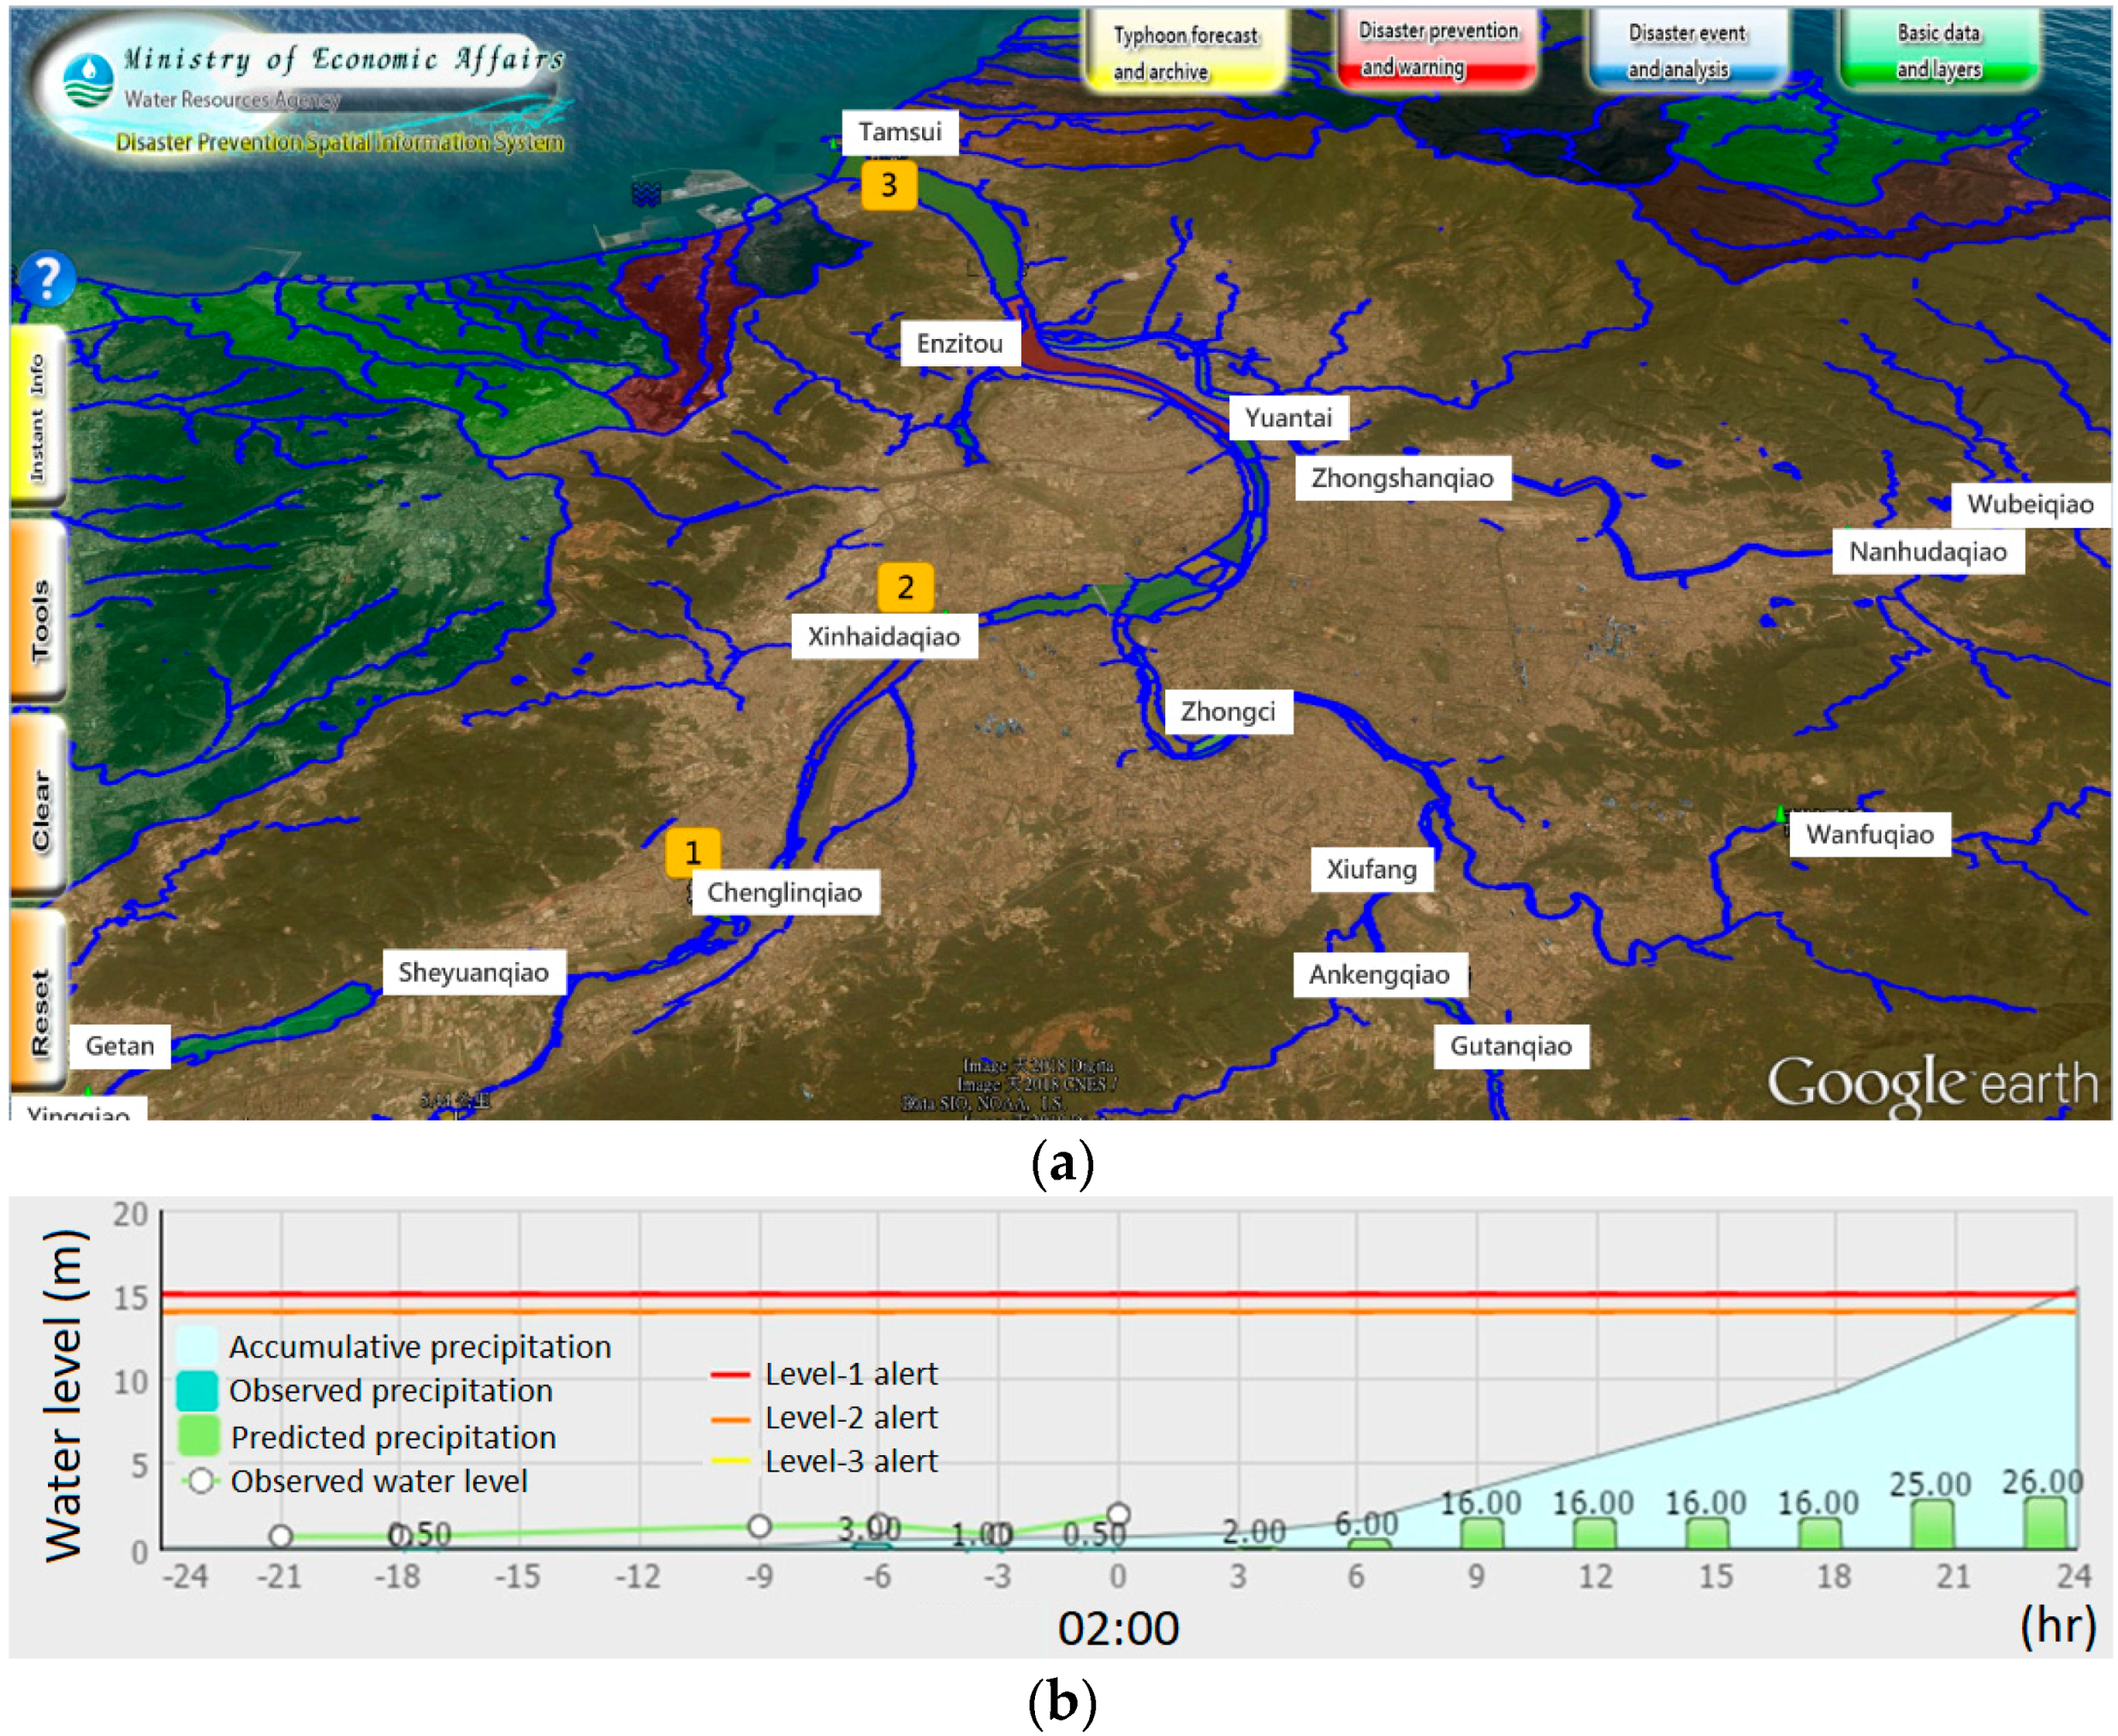
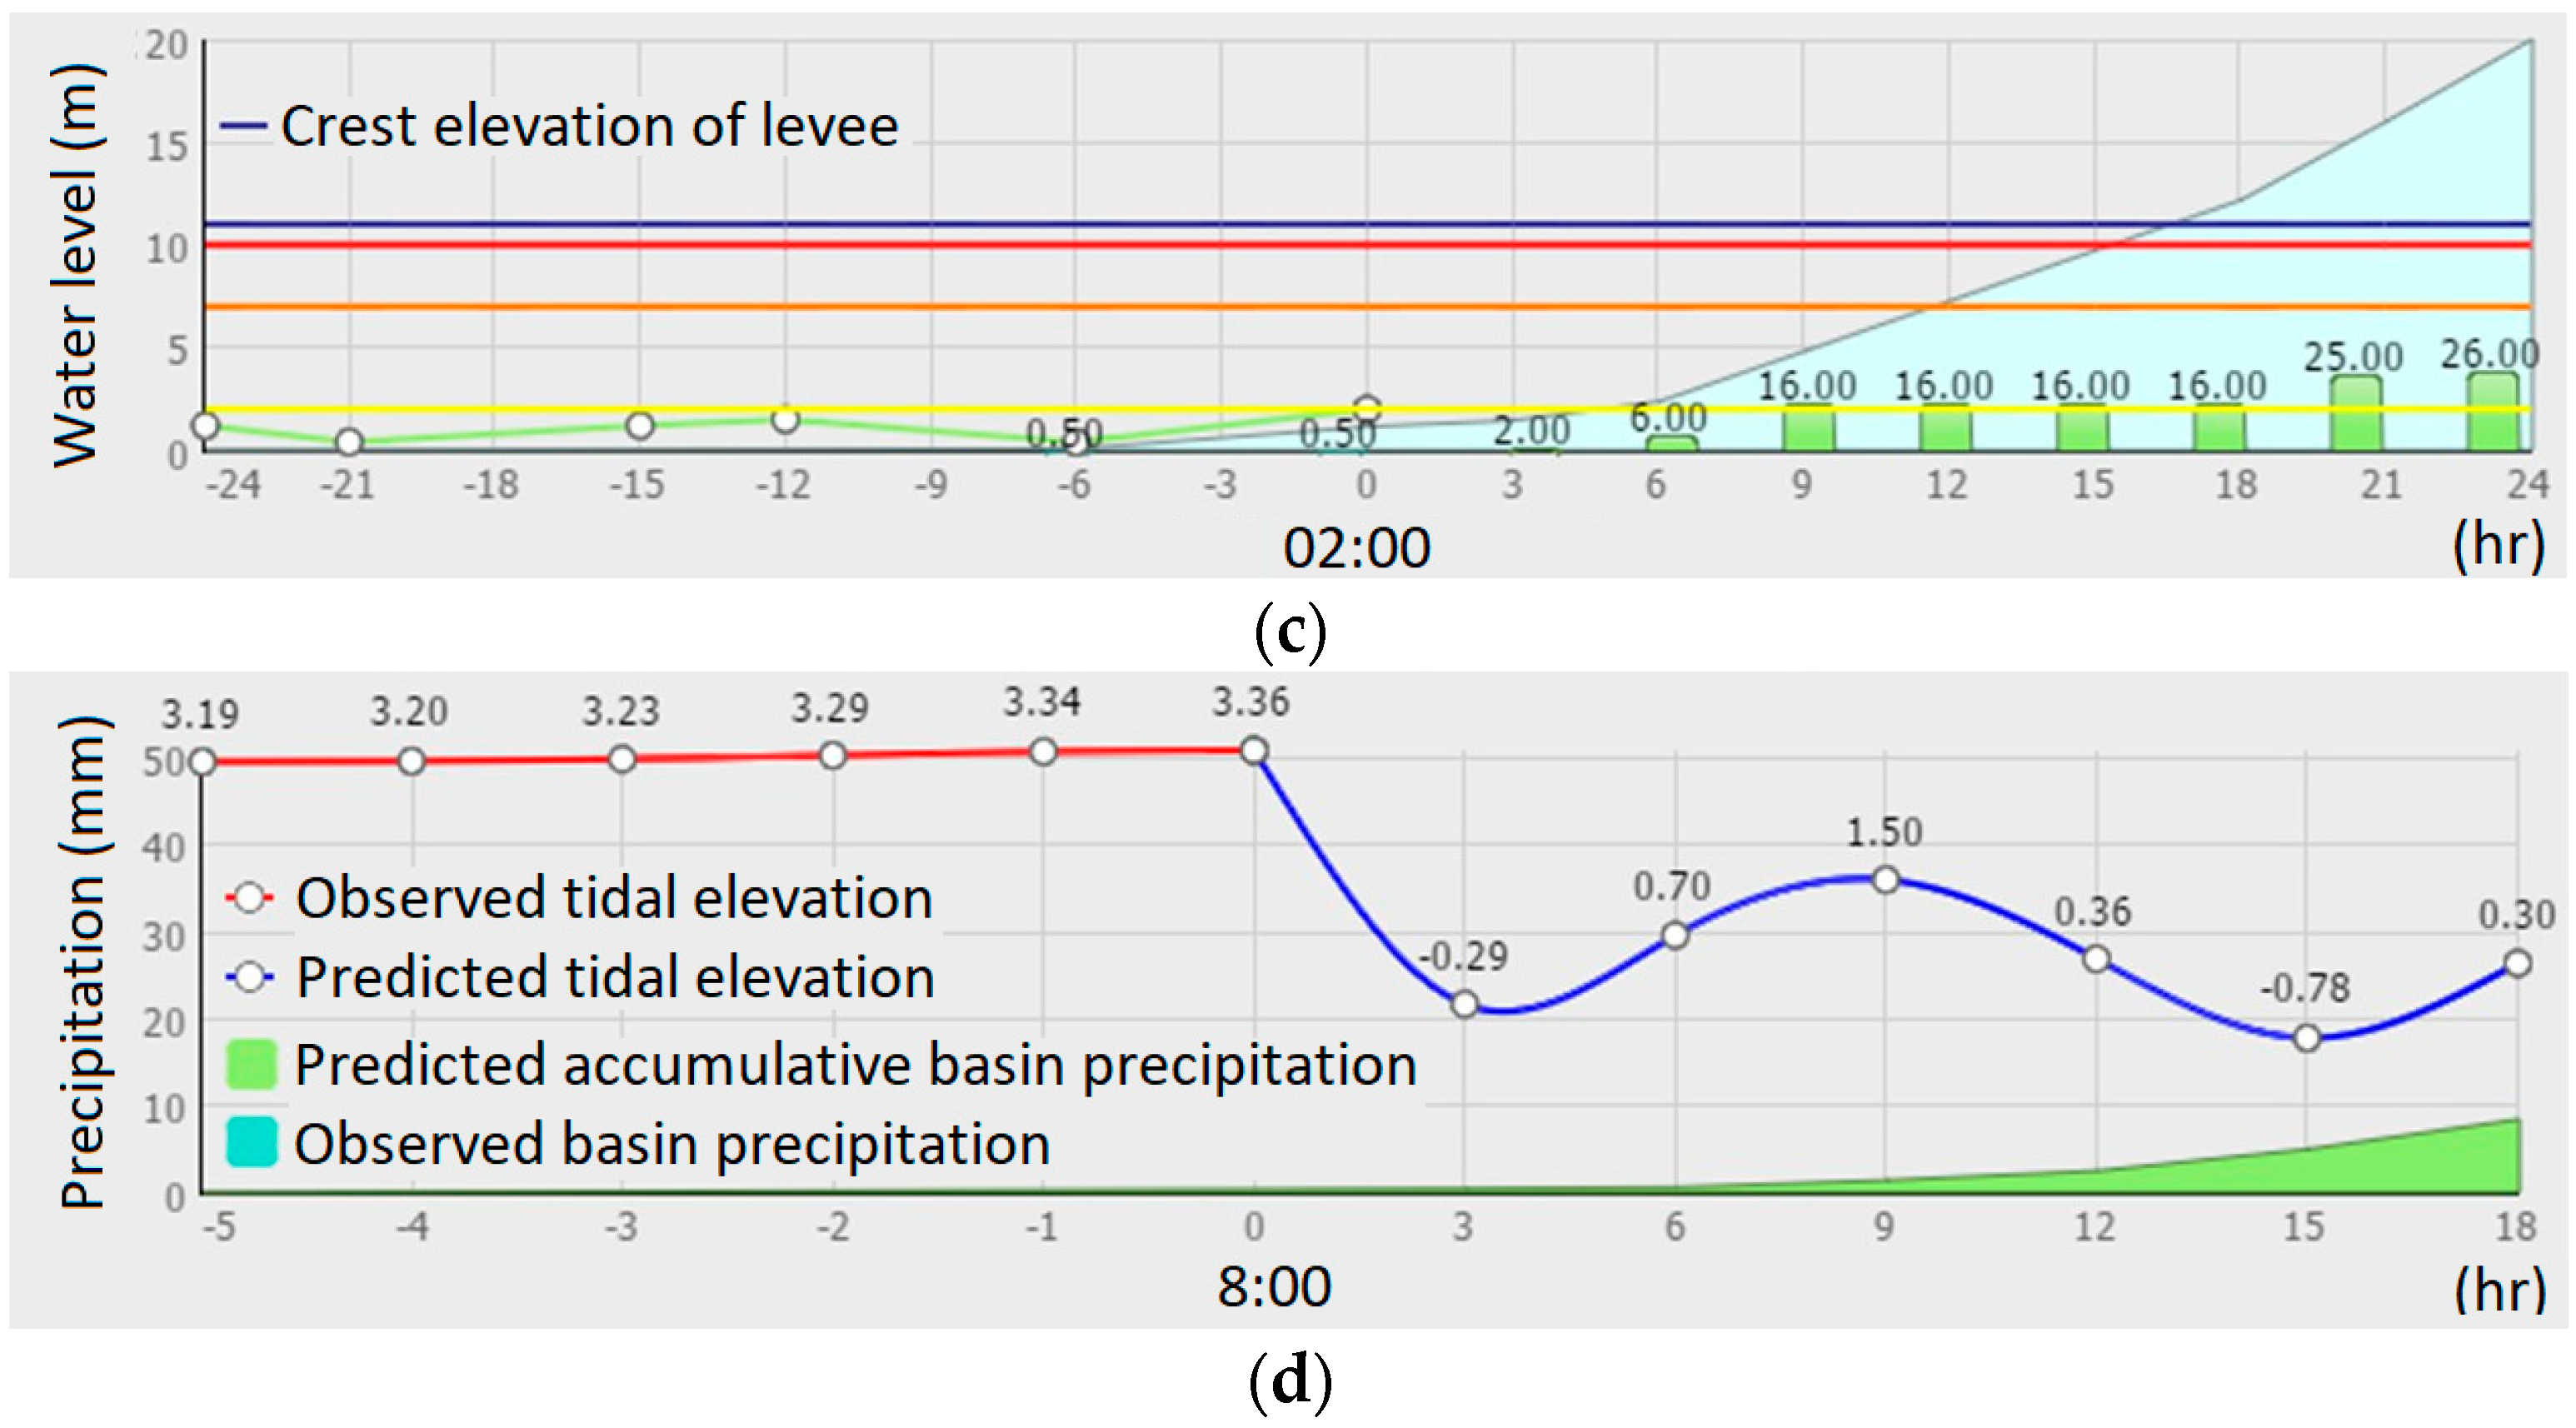
Hydrology Data: The WRA is in charge of collecting and archiving most of Taiwan’s hydrology data on a systematic basis. Among these data, the water levels from reservoirs, river stations, and tide stations provide valuable information for flood prevention and emergency response. The intensive precipitation brought by typhoons in the mountainous areas not only raises the water level in reservoirs, but also propagates the peak flow downstream, resulting in the rise of water levels at river stations one by one along the river. The time at which the peak flow arrives at the plain and river mouth can be calculated by simply comparing the hydrographs of different river stations, as shown in the
Figure 6b,c. On the other hand, the water level at a tide station is mainly dominated by tides that are predictable, as shown in
Figure 6c. Flooding becomes a certainty if the high tide coincides with the peak flow. To make the best use of the hydrology data, a user-friendly function was developed and implemented in FPERS to facilitate the ability of users to display hydrographs by clicking any reservoirs, river stations, or tide stations.
- (3)
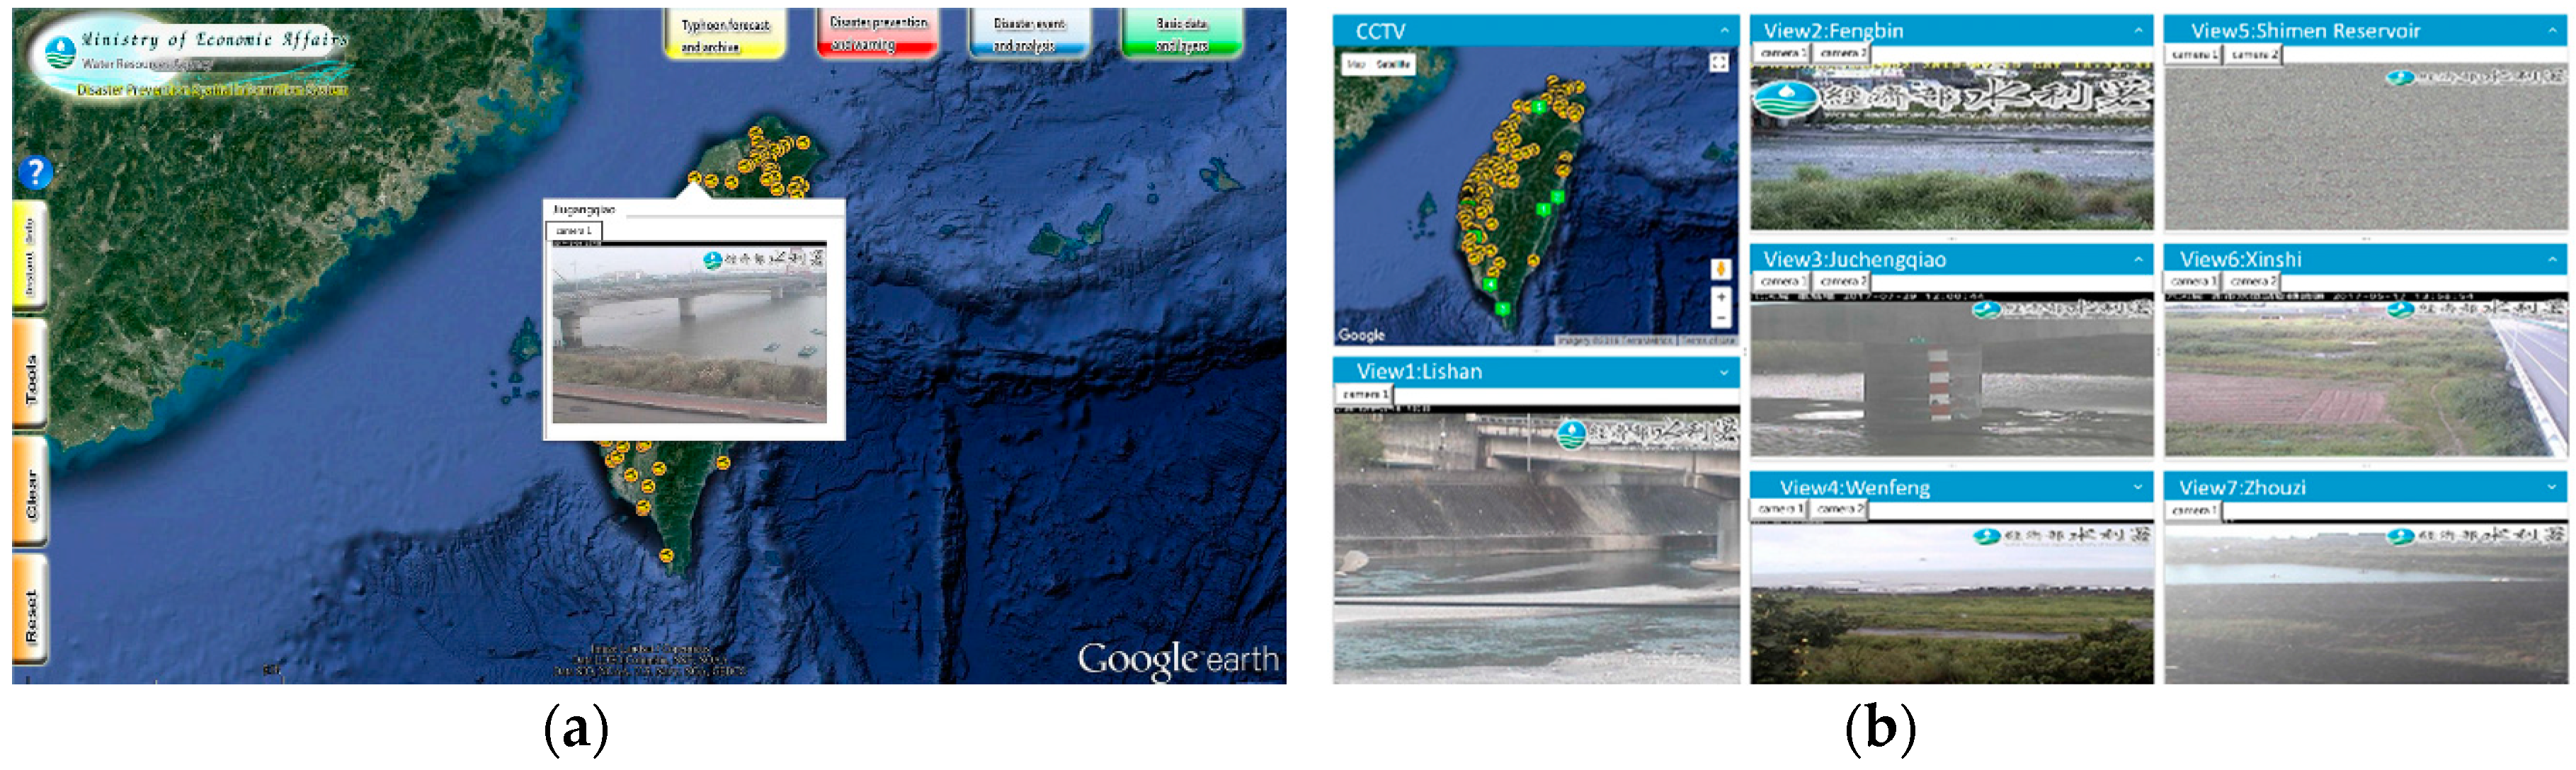
Auxiliary Data: There are many valuable, yet sensitive data that are crucial for disaster prevention and decision-making, such as the most updated map of the status of pumping stations and mobile machines, the available resources and facilities, flood defense materials, the gaps and breaks of levees, flood potential maps, the streaming of real-time video captured and transmitted by CCTVs, and so on. Because of security and privacy issues, we were not able to include these data in FPERS at first, until the WRA purchased the Google Earth Enterprise product that allowed developers to create maps and 3D globes for private use. All sensitive data are hosted by this commercial product and linked to FPERS. To access these data, users must register and login to FPERS; then, another list will be available for selecting and viewing the data. In this manner, the issue of security and privacy was resolved by increasing the amount of auxiliary data that can be integrated in FPERS.
Figure 7 presents one example of displaying the streaming of a real-time CCTV video in FPERS in single-window mode and multi-window mode, respectively.
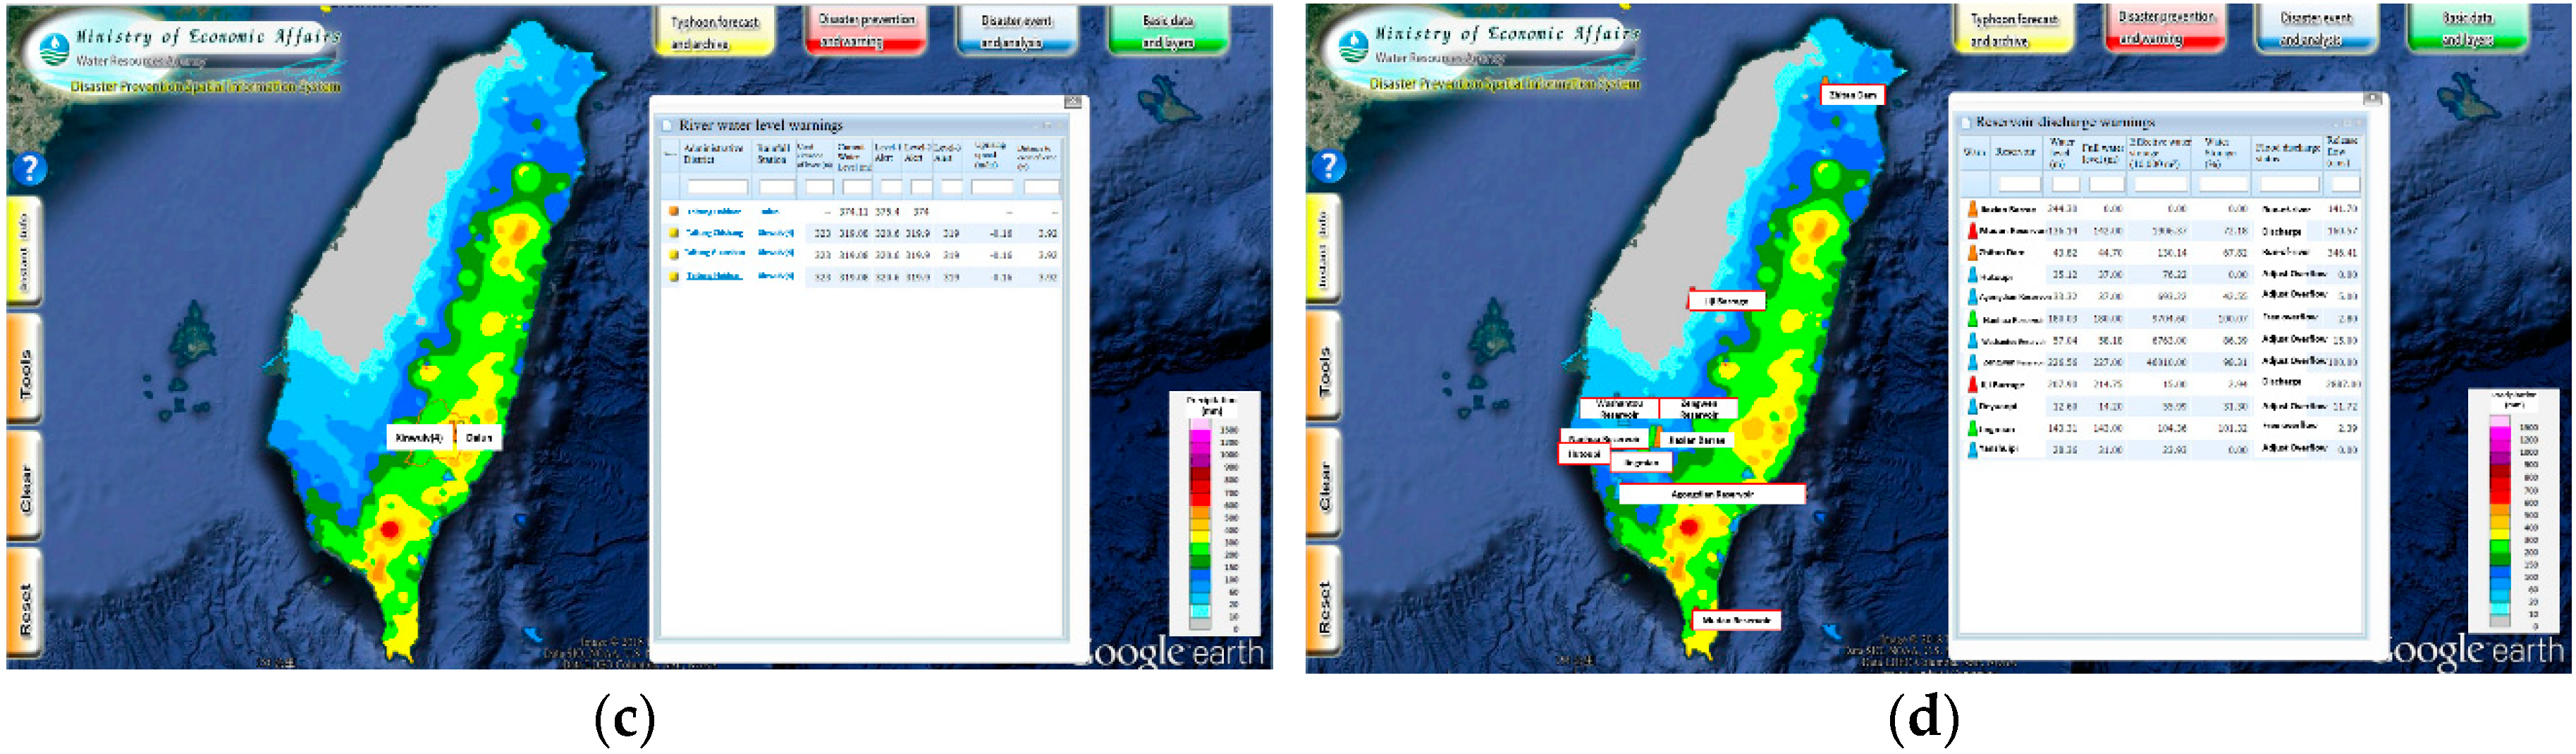
- (4)
Disaster Alert: Different government agencies issue various disaster alerts, such as the yellow or red alerts for debris flow issued by the Soil and Water Conservation Bureau (SWCB), notices of road and bridge closures issued by the Directorate General of Highways (DGH), heavy or torrential rain alerts issued by the CWB, and river water level warnings and reservoir discharge warnings issued by the WRA. Thanks to the wide applications of GEE and the standard KML/KMZ (Zipped KML) format, each warning can be dynamically integrated into FPERS by linking to specific KML/KMZ files. As long as the KML/KMZ file is maintained and updated by the provider of the warning, the most updated and complete warnings are accessible in FPERS.
Figure 8 presents an example of accessing various disaster alerts in FPERS in the event of Typhoon Nepartak (8 July 2015).
2.2.3. Disaster Events and Analysis
After FPERS was put online in 2013, a considerable amount of data related to a total of 19 typhoons or torrential rain events and the associated analysis results were collected and integrated into FPERS, as listed in
Table 1. FPERS served not only as a comprehensive database that archived all information in a systematic way, but also as a powerful form of media that displayed various data in a flexible fashion. The time slider function is particularly useful for reflecting on the decision-making process at different stages. Users can pause at any stage and bring up more data, images, or analyses to see if there are any differences. It should be noted that FPERS is used as a database to review disaster events rather than as a model to simulate disaster scenarios. A short video review was made and posted online for each typhoon or torrential rain from 2013 to 2016.
2.2.4. Basic Data and Layers
After the security and privacy issue was resolved by linking to the private globes provided by Google Earth Enterprise, more basic data and layers hosted by other agencies were added to FPERS, as listed in
Table 2. Most of them were in a vector format with various attributes. Although GEE allowed FPERS to load several large-sized vector layers all at once, transmitting and displaying huge amounts of data simultaneously would inevitably affect its performance. Thus, manipulating more than five vector layers at the same time was not practical. This motivated us to consider not just adding more data, but having the right data.
2.3. During-Flood Stage
The most challenging stage for the use of FPERS was the during-flood stage. The during-flood state refers to the time between the issuance and lifting of a typhoon sea alert. The major considerations for this stage are facilitating access to real-time monitoring data, presenting key information, making sound recommendations, and supporting decision-making. Three strategies were implemented as described below.
2.3.1. Real-Time Monitoring Data
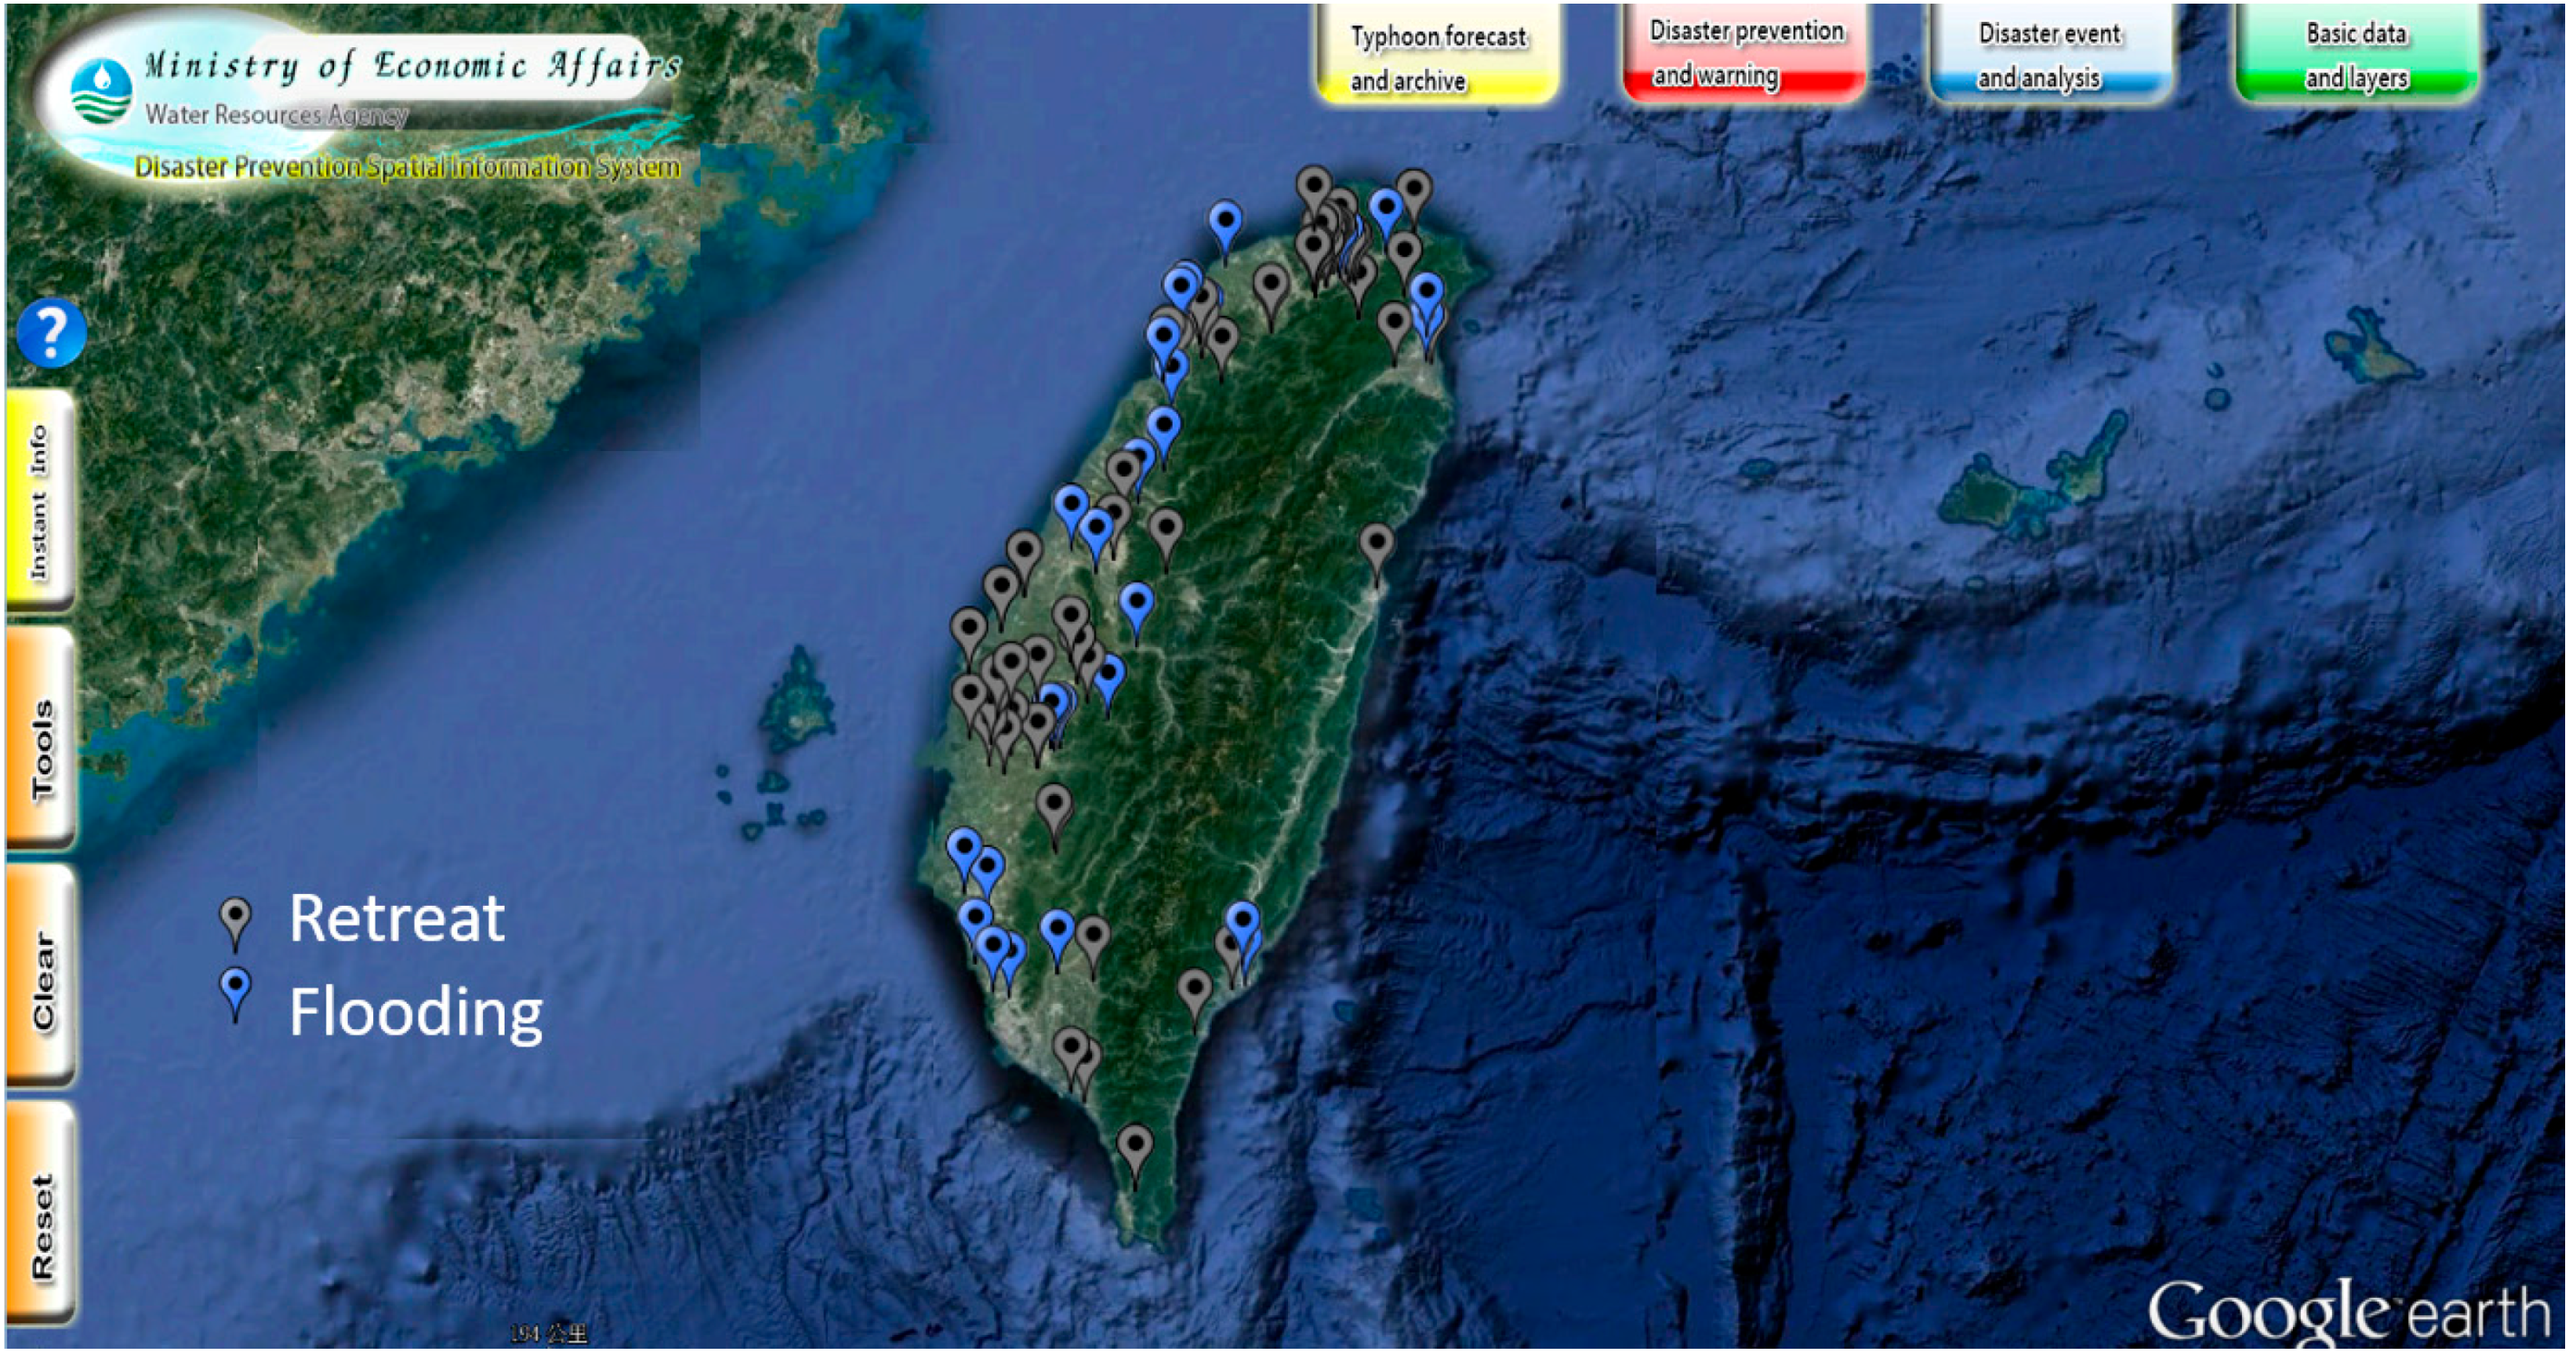
Real-time monitoring of data from various sensors is crucial at the during-flood stage, such as videos of water gates and bridge piers captured by CCTVs, as well as water level readings recorded at reservoir stations, river stations, and tide stations. In the study, the data had already been identified and linked to FPERS for the pre-flood stage. To quickly grasp the changes in the during-flood stage, all data were automatically sorted in high-to-low order and displayed in the form of a slideshow window. The data were highlighted in red if a preset threshold was reached. A special outsourcing function was also developed to enable users to upload photographs, video clips, or a paragraph of text to report the disaster areas. All information was integrated into one disaster map published and updated by FPERS, as shown in
Figure 9.
2.3.2. User-Friendly Functions
To facilitate access to the huge amount of data integrated in FPERS and quick acquisition of key information on a limited screen size, four user-friendly functions were designed and placed on the left-hand side of the FPERS screen display.
- (1)
“Instant Info” would bring up the slideshow window with selected meteorology data, hydrology data, geospatial information data, and disaster alerts.
- (2)
“Tools” would toggle between the single- and dual-window mode; adjust the transparency of each layer; measure the perimeter or area by drawing a polyline or a polygon on the screen; and pinpoint the location with inputs of coordinates, address, place name, or some key words.
- (3)
“Clear” would unselect all layers that have been displayed, but keep them in the list. Users can reselect the layers they want in order to avoid too much data overcrowding the screen.
- (4)
“Reset” would return the view to the entire Taiwan, focalized on its center. The list of all accessed data and layers would be emptied.
2.3.3. Standard Operation Procedure
The time for making decisions in the during-flood stage is fleeting, and the selection of data can be very versatile and time-consuming. To ensure all important data were being properly displayed and reviewed as time progressed, we proposed an SOP that comprised eight steps, as listed in
Table 3. The purpose and intention of each step are outlined below. A special button was designed to bring up all required data and layers that should be displayed and reviewed with merely one click at each step. Together with this SOP, FPERS was employed by the WHMC of the WRA to support flood prevention and emergency responses from 2013 to 2016. The application of FPERS during Typhoon Soudelor in August of 2015 is used as an example and is described in detail below.
3. Application of FPERS in Typhoon Soudelor
Typhoon Soudelor was the third most intense tropical cyclone worldwide in 2015. It formed as a tropical depression on 29 July, made landfall on Saipan on 2 August, and developed into a Category 5-equivalent super typhoon under favorable environmental conditions later on 3 August. Late on 7 August, Soudelor made landfall over Hualien, Taiwan, and moved out to the Taiwan Strait early the next day. The torrential rains and destructive winds caused widespread damage and disruptions, resulting in eight deaths, and 420 people sustained injuries. Taiping Mountain recorded the heaviest rains during this event, with accumulations peaking at 1334 mm, which caused floods in I-Lan County. Rainfall in the Wulai District reached 722 mm in 24 h and triggered a large landslide.
The case of Typhoon Soudelor is used as an example to demonstrate how FPERS was employed to support flood prevention and emergency responses. All related data and layers collected and employed at different stages were recorded in a tour file, which is ideal for reviewing this event by replaying the scenarios in chronological order. Users could even pause or reverse the tour, and they could also add more data or layers at any stage. This tour file is available in the
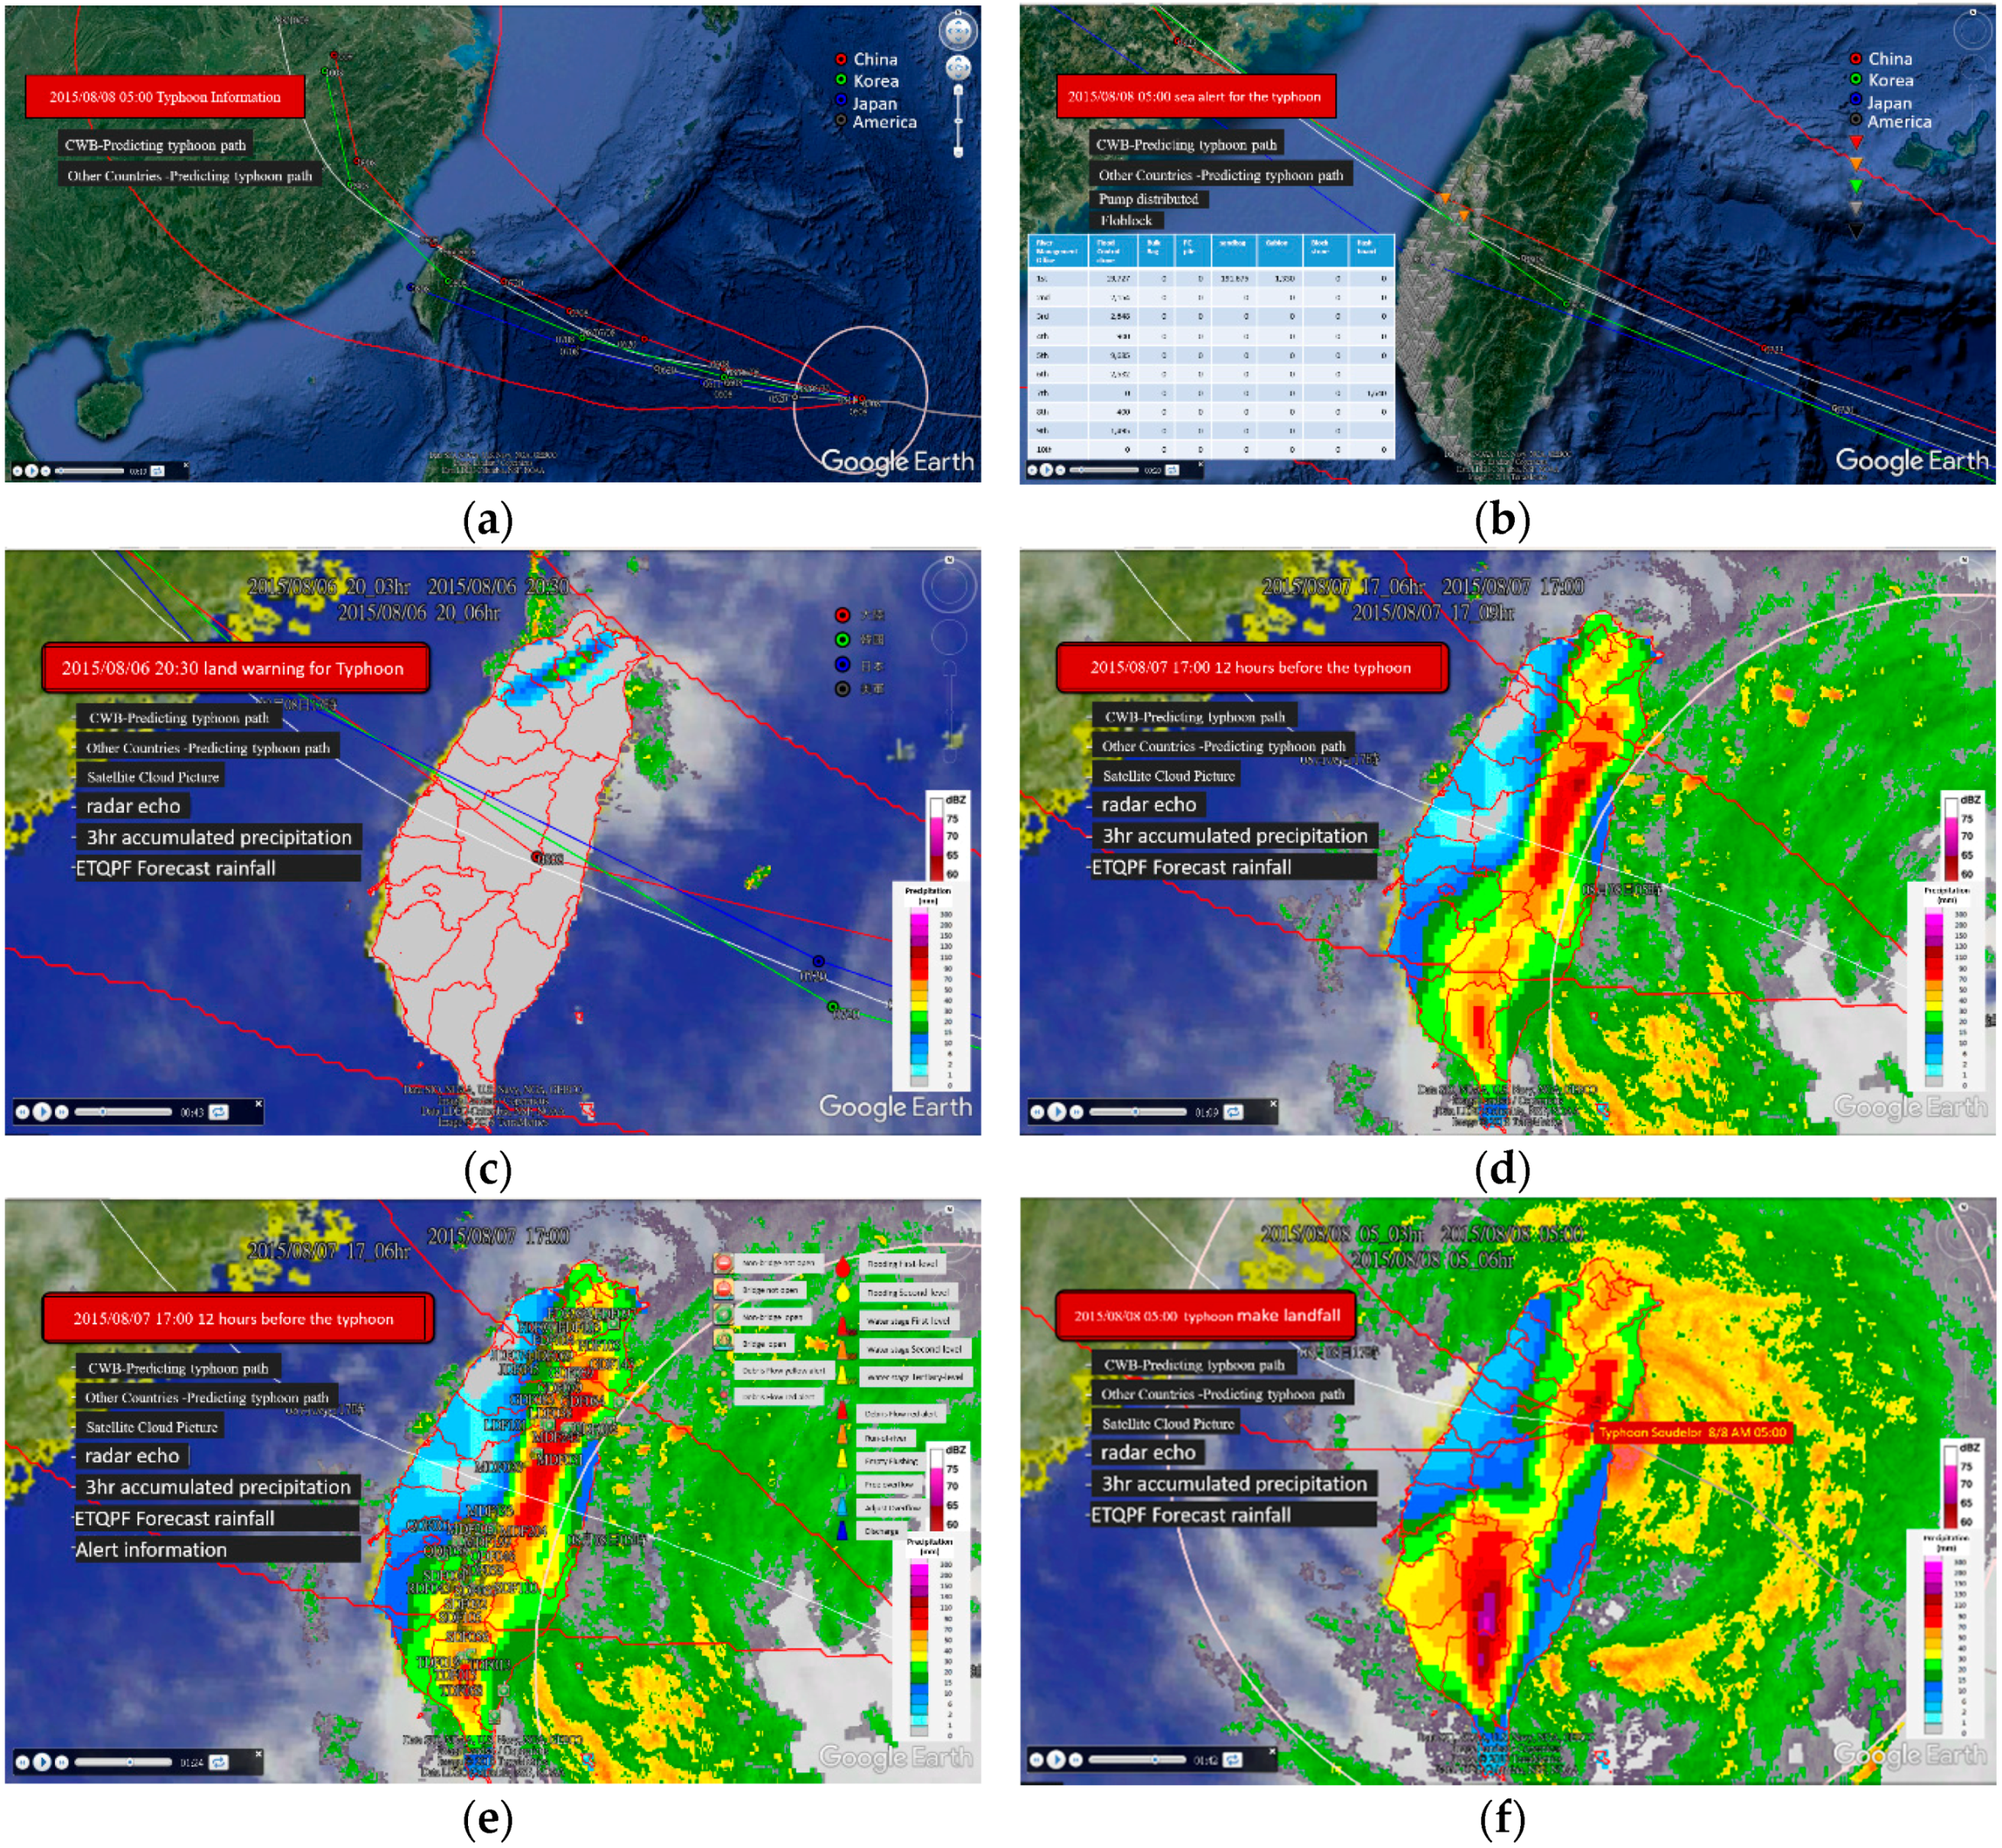
Supplementary Materials. From the file, eight scenarios were captured at different stages, as shown in
Figure 10. These are explained in detail as follows.
When Typhoon Soudelor formed on 29 July, the forecasts of the typhoon path made by the CWB of Taiwan and other countries were acquired and displayed in FPERS (
Figure 10a), with an intention to see whether this typhoon was coming towards Taiwan or not. Requests for urgent SAR image acquisition were also sent to a few distributors to evaluate the suitable slots and coverages from different satellites. As the order had to be placed at least 24 h before the image acquisition, the decision was made when CWB issued the Typhoon Soudelor sea alert at 11:00 on 6 August. At the same time, WHMC of WRA also initiated the SOP to respond to this event. The most updated forecasts of typhoon paths were overlaid on the map of pumping machines and flood protection materials (
Figure 10b), which could be used to determine whether the dispatch of resources was appropriate or not. Both the wind and rain intensified as the typhoon was approaching Taiwan. Later, at 20:30 that day, the land warning was issued by the CWB, and the major concern at this stage was the possible amount and distribution of precipitation. Therefore, the most updated forecasts of typhoon paths were overlaid on the satellite cloud images, the radar echo chart, the accumulated rainfall chart, as well as the Ensemble Typhoon Quantitative Precipitation Forecast (ETQPF) (
Figure 10c), to identify the possible sites of floods and to reallocate pumping machines and flood protection materials if necessary. The data and layers were kept updated, and the same assessment procedure was repeated until 12 h before the typhoon landed. All kinds of disaster alerts were annotated on the map (
Figure 10d), including the yellow or red debris flow alerts issued by the SWCB, the notice of road and bridge closures issued by the DGH, the heavy or torrential rain alerts issued by the CWB, and the reservoir discharge warning issued by the WRA. Based on these alerts, people staying in regions with higher risks were asked to make necessary and compulsory evacuations.
The center of Typhoon Soudelor eventually made landfall on the east coast of Taiwan at 04:40 on 8 August, and both the wind and rain reached their maximum values. This was also the time when the runoff was accumulating and when most of the floods were triggered. Even though the clouds and rains were overcasting the northern part of Taiwan, the active radar signals could penetrate the storm, and one SAR image of I-Lan area was successfully acquired at 05:56 on 8 August. This image was processed using the approach described in the literature [
4] and was posted in FPERS (
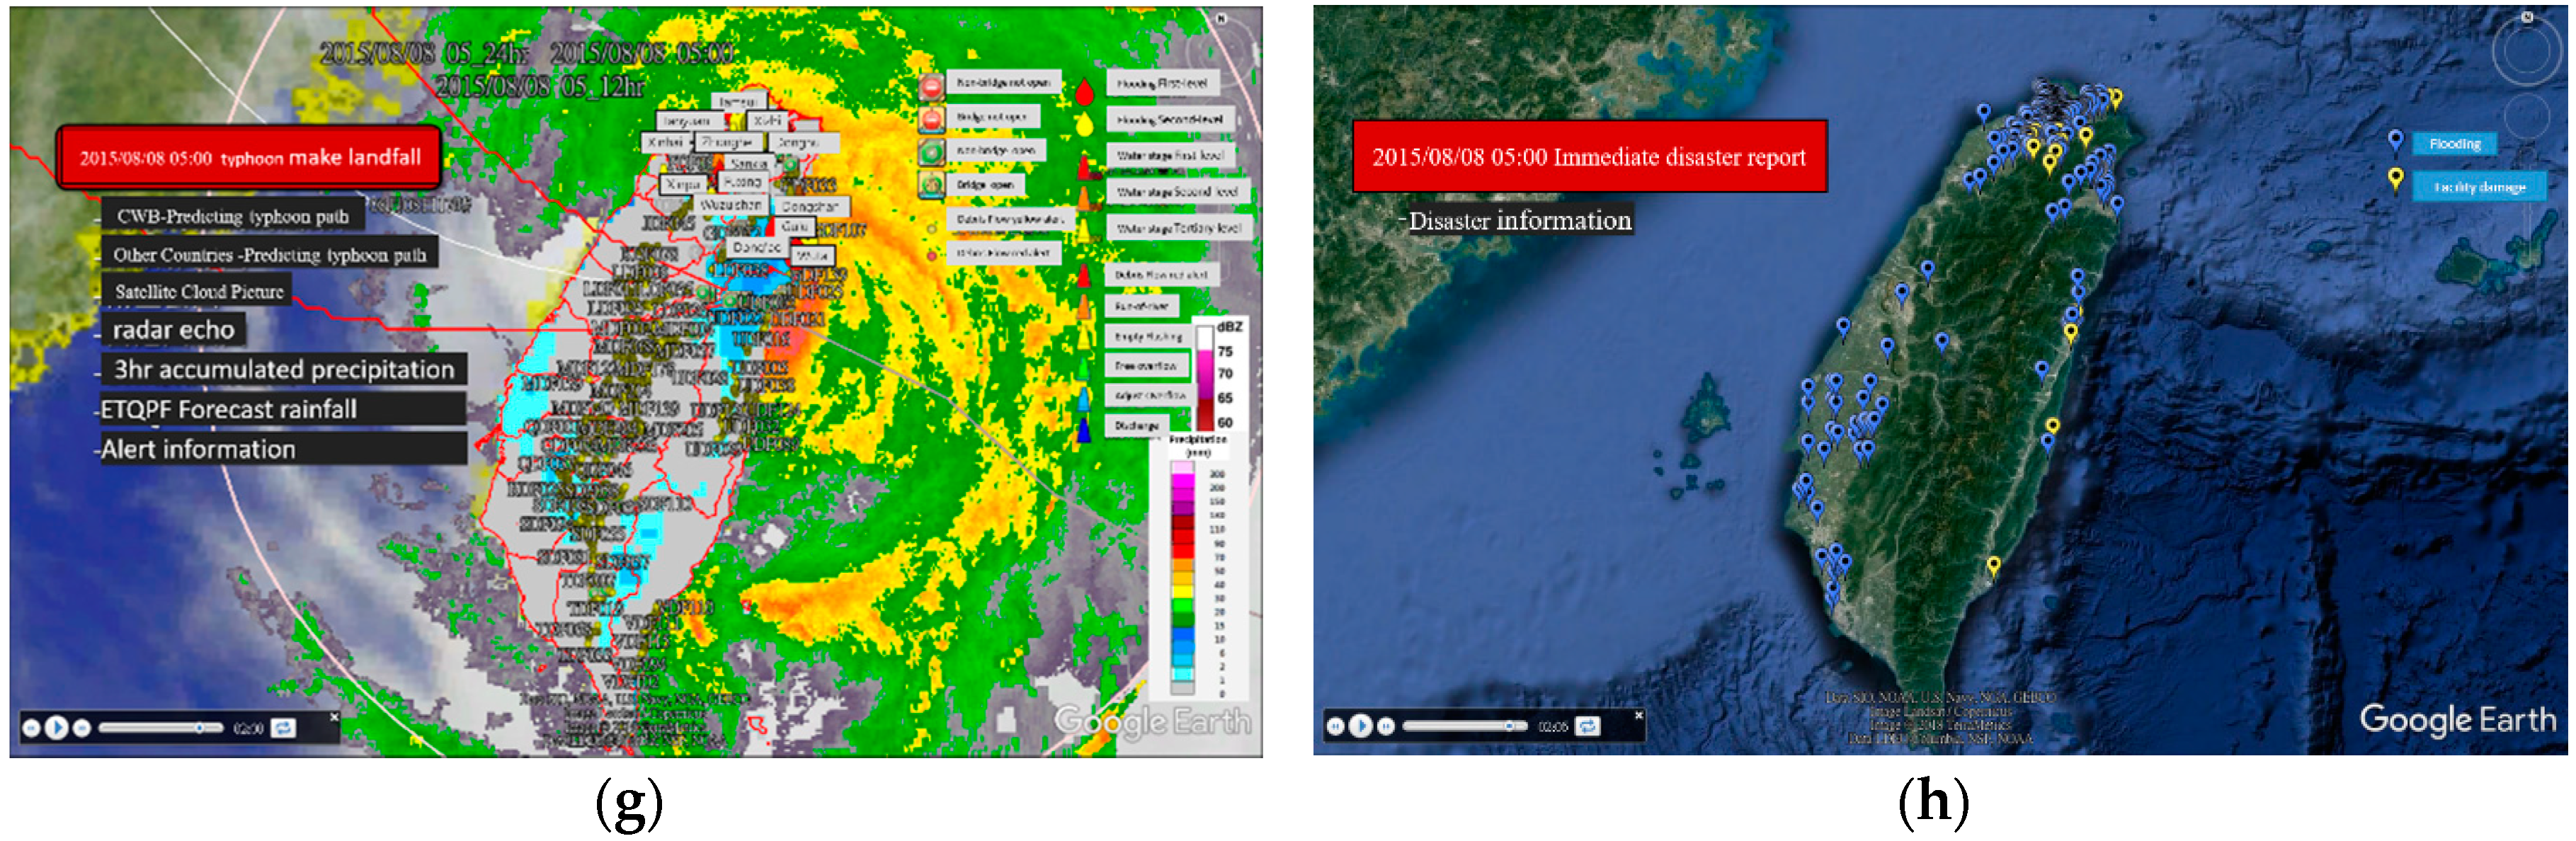
Figure 10e). As Soudelor was moving across the northern part of Taiwan, multiple disasters were reported to the local governments. This was the busiest and most stressful time for the WHMC of the WRA, because all information and requests related to floods were forwarded and integrated there. The WHMC had to coordinate various departments and agencies, make recommendations according to the available resources, and follow each case of reported disasters. Thanks to the user-friendly functions implemented in FPERS, a large number of geospatial data/layers and real-time monitoring data were integrated after landfall, including ETQPF (
Figure 10f), alert information (
Figure 10g), and real-time disaster reports (
Figure 10h). The key information was quickly acquired from the screen using the tools developed for FPERS. Note that the hot spots at this stage were the water resource facilities, such as water gates, levees, dams, and so on. They were monitored by FPERS conveniently because not only were the real-time data of water levels linked, but also the streaming of real-time CCTV video was displayed in either the single-window or the multi-window mode. The inundated areas derived from the SAR image of I-Lan were completed and posted on FPERS at about 17:00 on 8 August, when the sea alert had not yet been lifted.
Typhoon Soudelor moved out to sea at about 11:00 and kept moving northwest. Later that day at about 22:00, it made landfall in Fujian, China. Both the land warning and sea alert were lifted at 08:30 the next day. However, the WHMC still kept an eye on the southwesterly airstream induced by the passage of Soudelor, for it could bring downpours even if the typhoon had left. For the case of Typhoon Soudelor, several landslides were triggered in Wulai, and the water of Nanshi River was contaminated and soon mixed with the primary water source in the Taipei-Keelung metropolitan area. As a result, the regional purification system was overwhelmed, and the water supply to Taipei was polluted for the next few days. To gain an overview of the entire Wulai area, the Formosat-2 images acquired before and after Typhoon Soudelor were compared, and the total areas and distribution of the landslides were mapped and posted on FPERS. The animation of virtual flight with a synchronous comparison of Formosat-2 before- and after-Soudelor images is available in the
Supplementary Materials.
4. Discussion
FPERS powered by GEE provided an innovative platform that enabled us to integrate a huge amount of geospatial data, resolving the data accessibility issue. From a practical point of view, however, manipulating more than five layers simultaneously is not very helpful for decision making. Instead, referring to the right data at the right time is much more important, particularly for timely responses to an urgent event. Determining the right data and the right time requires domain knowledge for different types of disasters. Therefore, in this work, a set of SOPs was proposed for the pre-, during-, and post-flood stages to ensure that all important data were properly displayed and reviewed as time progressed. At the pre-flood stage, the huge amount of geospatial data were categorized as typhoon forecast and archive, disaster prevention and warning, disaster events and analysis, and basic data and layer. At the during-flood stage, three strategies were implemented to facilitate access to real-time data, present key information, make sound recommendations, and support decision-making. At the post-flood stage, various remote sensing imageries were integrated, including Formosat-2 optical imagery to detect and monitor barrier lakes, the synthetic aperture radar imagery to derive an inundation map, and the high-spatial-resolution photographs taken by unmanned aerial vehicles to evaluate the damage to river channels and structures. The prevention and urgent response experiences gained from FPERS can be applied to other types of urgent events, such as sediment-related or earthquake-related disasters.
One advantage of GEE is that petabyte-scale data (mostly images) are prepared and updated by Google for scientific analysis and visualization. Apart from the high-spatial-resolution of aerial photographs and satellite images for densely populated areas, the latest Landsat-8 images are included for the less populated areas, but only at a frequency of about half a year using cloudless scenes. Therefore, there might have been a lag of a few months on the Landsat-8 images provided by GEE. Thanks to the success of the Sentinel-2 mission and the Copernicus program adopting a free and open data policy, all Sentinel-2 high-spatial-resolution (10 m) data are available for free to all registered users on a five-day basis. They serve as an ideal, cost-effective data source to be included by GEE. For Taiwan, the standard Level-1C products of Sentinel-2 imagery processed and provided by the Copernicus Open Access Hub have been mosaicked, contrast-enhanced, converted to a set of pyramid image tiles, and distributed to the general public through the Open Access Satellite Image Service (OASIS,
http://oasis.ncku.edu.tw) [
15]. They can be integrated into FPERS as alternatives for base images, but this raises the issue of archiving and analyzing a very large number of satellite images. As the main concern is the changes among images rather than the images themselves, an efficient solution would be to archive and display only the changes, which would require a reliable, automatic approach to change detection.
Another advantage of GEE is that the global topographic data has already been incorporated, and all geospatial data can be displayed in 3D through the Internet. Google uses a range of digital elevation model (DEM) data sources to derive the terrain layer, such as the USGS National Elevation Dataset, Shuttle Radar Topography Mission data, and the NOAA Global Land One-km Base Elevation Project dataset. However, the default 3D GEE globe is not replaceable. Even though the Google Earth Enterprise product allows developers to create maps and 3D globes for private use, that cannot be done on the fly. Considering the fact that variations in relief features are always the primary interest and that there are many ways to collect the most updated topographic data, it is preferable to have the capability of switching among different topographic models. For practical application to flood prevention and emergency responses, for example, a quick way to assess the status of water a resource facility is to compare the regional DEMs collected before- and after-flood using UAV. These valuable data are available, but not able to be displayed in the current version of FPERS.
The lack of flexibility in managing or searching for a huge geospatial database by GEE has become increasingly more apparent as more geospatial data are being integrated in FPERS. Taking Google Earth as an example, users have to select the data/layer first and then display or analyze the selected ones. This implies the users must know the existence, content, or type of the data/layer, and make the selections one by one on their own. This is not practical for a system like FPERS, which has integrated a huge geospatial database. The logical and reasonable order is to narrow down the entire database first with some specified conditions, such as the time frame, spatial extent, and data type. Then, the final selection can be made accordingly. This method requires a powerful database with a special consideration of geospatial attributes. All data and collections for FPERS should be added and curated through this geospatial database.
After the release of Google Earth API in 2008, FPERS and many other web-based geospatial systems were developed and powered by GEE to support a variety of management decisions [
16,
17,
18]. As experiences were gained and systems were improved gradually, innovative and reliable services were created and implemented. However, the Google Earth API was depreciated as of 15 December 2014 and remained supported until 15 December 2015. Google Chrome also ended support for the Netscape Plugin API (which the Google Earth API relies on) at the end of 2016. As a result, all systems, including FPERS, were forced to be depreciated or downgraded to use Google Map API, which is a 2D platform that does not support 3D displays. Although Google decided to make all codes behind the Google Earth Enterprise available on GitHub in March 2017, Google has not open-sourced the implementations for Google Earth Enterprise Client, Google Maps JavaScript API, and Google Earth API. The depreciation of Google Earth Enterprise and Google Earth API in 2014 inevitably affected government agencies’ confidence and their willingness to rely on only one commercial platform.
As a result of these changes, the WRA decided to terminate the development and maintenance of FPERS in late 2015; the online service of FPERS was also removed. The old version of Google Chrome V4.6 (Google LLC, Mountain View, California, U.S.) that supported the Netscape Plugin API and Google Earth API, together with the entire FPERS, has been saved in one compressed file. This file can be downloaded to the user’s personal computer and executed to launch the old version of Google Chrome to run FPERS with the full set of functions. On the other hand, some similar, yet fully open solutions, such as OpenLayers, have also become available. Despite the fact that more effort is required to put everything together in these open solutions compared with GEE, their capability and potential have been proven. Based on the experiences gained in developing FPERS, a new version of FPERS powered by OpenLayers is being planned.
5. Conclusions
Flooding caused by typhoons and torrential rainfalls is one of the major disasters that leads to severe damage and significant loss of lives and property. Supporting a variety of management decisions, particularly a timely response to an urgent event, requires a sound approach to identify, collect, integrate, process, analyze, distribute, and visualize a huge amount of data rapidly through the Internet. This was not possible until the Google Earth API was released on 28 May 2008. Powered by GEE, FPERS was successfully developed and employed to support flood prevention and emergency responses in 19 typhoons or torrential rain events from 2013 to 2016, including the example of Typhoon Soudelor presented in this paper. This work proposes a set of SOPs for the pre-, during-, and post-flood stages to ensure all important data are properly displayed and reviewed over time. Apart from integrating a huge amount of geospatial data, FPERS enabled us to refer to the right data at the right time. The capability of switching among different topographic models and the flexibility of managing and searching the data through a geospatial database were also shown to be main features of the system. Experiences gained from FPERS would benefit the application of prevention work and urgent response to other types of catastrophic events, such as sediment-related or earthquake-related disasters.


