remotesensing-logo

Journal Browser

Journal Browser

Google Earth Engine Applications

Printed Edition Available!
A printed edition of this Special Issue is available here.

Editors


E-Mail Website
Collection Editor
East Coast Geospatial Consultants, Armidale, NSW 2350, Australia
Interests: environmental modelling; spatial ecology; climate change impacts; remote sensing; GIS; spatial modelling
Special Issues, Collections and Topics in MDPI journals

E-Mail Website
Collection Editor
School of Agricultural, Earth and Environmental Sciences, University of Kwazulu-Natal, Durban, South Africa
Interests: remote sensing; land use; environment; vegetation; hyperspectral remote sensing; ecosystem ecology; spatial analysis; climate change impact analysist; vegetation mapping
Special Issues, Collections and Topics in MDPI journals

Topical Collection Information

Dear Colleagues,

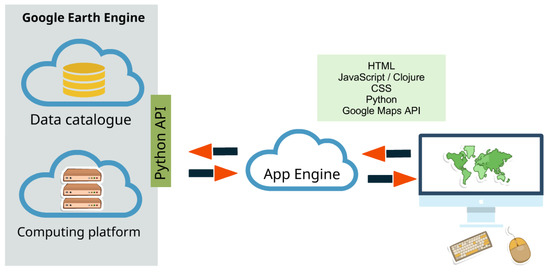
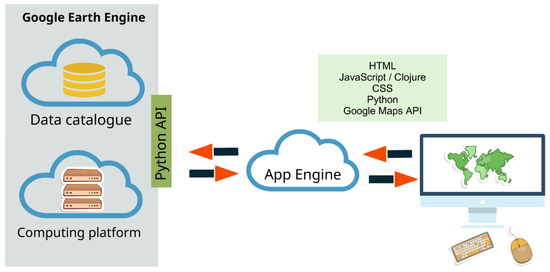
The Google Earth Engine (GEE) platform contains petabyte-scale data for scientific analysis and visualization. After the Landsat image series were made freely available in 2008, Google consolidated this very large and useful data set and linked it to its cloud computing resources to make available to the scientific community one of the largest datasets for studying the earth’s resources. GEE now includes satellite datasets from a number of other platforms, as well as many vector-based datasets.

The easily accessible and user-friendly front-end provides a convenient environment for interactive data and algorithm development. Users are also able to add and curate their own data and collections, while using Google’s cloud resources to undertake all the processing. The end result is that this now allows scientists, independent researchers, hobbyists and nations to mine this massive warehouse of data for change detection, map trends and quantify resources on the Earth's surface like never before. One does not need large processing powers of the latest computers or the latest software, meaning that resource poor researchers in the poorest nations of the world have the same ability to undertake analysis as those in the most advanced nations.

Applications of GEE include, but are not limited to: mapping forest cover, detecting deforestation, classifying land cover, estimating forest biomass and carbon, mapping urban area expansion, population mapping, changes in agricultural production and forecasting, and rangeland dynamics.

This collection calls for example applications of GEE all over the world and in all disciplines. We particularly encourage articles from developing nations on how the availability of GEE data and processing has enabled new research that was difficult or impossible before. We also encourage papers on issues about using GEE, processing shortcomings, programming, and difficulties in handling data in the cloud atmosphere. Anything to do with GEE is suitable for this collection.

Prof. Dr. Lalit Kumar
Prof. Dr. Onisimo Mutanga
Collection Editors

Manuscript Submission Information

Manuscripts should be submitted online at www.mdpi.com by registering and logging in to this website. Once you are registered, click here to go to the submission form. Manuscripts can be submitted until the deadline. All submissions that pass pre-check are peer-reviewed. Accepted papers will be published continuously in the journal (as soon as accepted) and will be listed together on the collection website. Research articles, review articles as well as short communications are invited. For planned papers, a title and short abstract (about 100 words) can be sent to the Editorial Office for announcement on this website.

Submitted manuscripts should not have been published previously, nor be under consideration for publication elsewhere (except conference proceedings papers). All manuscripts are thoroughly refereed through a single-blind peer-review process. A guide for authors and other relevant information for submission of manuscripts is available on the Instructions for Authors page. Remote Sensing is an international peer-reviewed open access semimonthly journal published by MDPI.

Please visit the Instructions for Authors page before submitting a manuscript. The Article Processing Charge (APC) for publication in this open access journal is 2700 CHF (Swiss Francs). Submitted papers should be well formatted and use good English. Authors may use MDPI's English editing service prior to publication or during author revisions.

Keywords

  • Google Earth Engine
  • Landsat
  • Change detection
  • Agricultural mapping
  • Urban changes
  • MODIS
  • Sentinel-2
  • Cloud processing
  • Google Compute Engine

Published Papers (40 papers)

2022

Jump to: 2021, 2020, 2019, 2018, 2017

13 pages, 3455 KiB  
Article
Real-Time Software for the Efficient Generation of the Clumping Index and Its Application Based on the Google Earth Engine
by Yu Li and Hongliang Fang
Remote Sens. 2022, 14(15), 3837; https://doi.org/10.3390/rs14153837 - 08 Aug 2022
Cited by 3 | Viewed by 2142
Abstract
Canopy clumping index (CI) is a key structural parameter related to vegetation phenology and the absorption of radiation, and it is usually retrieved from remote sensing data based on an empirical relationship with the Normalized Difference between Hotspot and Darkspot (NDHD) index. A [...] Read more.
Canopy clumping index (CI) is a key structural parameter related to vegetation phenology and the absorption of radiation, and it is usually retrieved from remote sensing data based on an empirical relationship with the Normalized Difference between Hotspot and Darkspot (NDHD) index. A rapid production software was developed to implement the CI algorithm based on the Google Earth Engine (GEE) to update current CI products and promote the application of CI in different fields. Daily, monthly, and yearly global CI products are continuously generated and updated in real-time by the software. Users can directly download the product or work with CI without paying attention to data generation. For the application case study, a change detection algorithm, LandTrendr, was implemented on the GEE to examine the global CI trend from 2000 to 2020. The results indicate that the area of increase trend (28.7%, ΔCI > 0.02) is greater than that of the decrease trend (17.1%, ΔCI < −0.02). Our work contributes toward the retrieval, application, and validation of CI. Full article
Show Figures

Graphical abstract

21 pages, 7815 KiB  
Article
A Fusion Method for Multisource Land Cover Products Based on Superpixels and Statistical Extraction for Enhancing Resolution and Improving Accuracy
by Qi Jin, Erqi Xu and Xuqing Zhang
Remote Sens. 2022, 14(7), 1676; https://doi.org/10.3390/rs14071676 - 31 Mar 2022
Cited by 5 | Viewed by 2085
Abstract
The discrepancies in existing land cover data are relatively high, indicating low local precision and application limitations. Multisource data fusion is an effective way to solve this problem; however, the fusion procedure often requires resampling to unify the spatial resolution, causing a lower [...] Read more.
The discrepancies in existing land cover data are relatively high, indicating low local precision and application limitations. Multisource data fusion is an effective way to solve this problem; however, the fusion procedure often requires resampling to unify the spatial resolution, causing a lower spatial resolution. To solve this problem, this study proposes a multisource product fusion mapping method of filtering training samples and product correction at a fine resolution. Based on the Superpixel algorithm, principal component analysis (PCA), and statistical extraction techniques, combined with the Google Earth Engine (GEE) platform, reliable land cover data were acquired. GEE and machine-learning algorithms correct the unreliable information of multiple products into a new land cover fusion result. Compared to the common method of extracting consistent pixels from existing products, our proposed method effectively removes nearly 38.75% of them, with a high probability of classification error. The overall accuracy of fusion in this study reached 85.80%, and the kappa coefficient reached 0.82, with an overall accuracy improvement of 11.75–24.17% and a kappa coefficient improvement of 0.16 to 0.3 compared to other products. For existing single-category products, we corrected the phenomenon of overinterpretation in inconsistent areas; the overall accuracy improvement ranged from 2.99% to 20.71%, while the kappa coefficient improvement ranged from 0.22 to 0.56. Thus, our proposed method can combine information from multiple products and serve as an effective method for large areas and even as a global land cover fusion product. Full article
Show Figures

Figure 1

2021

Jump to: 2022, 2020, 2019, 2018, 2017

19 pages, 7780 KiB  
Article
Application of Spectral Index-Based Logistic Regression to Detect Inland Water in the South Caucasus
by James Worden, Kirsten M. de Beurs, Jennifer Koch and Braden C. Owsley
Remote Sens. 2021, 13(24), 5099; https://doi.org/10.3390/rs13245099 - 15 Dec 2021
Cited by 5 | Viewed by 2951
Abstract
The Caucasus is a diverse region with many climate zones that range from subtropical lowlands to mountainous alpine areas. The region is marked by irrigated croplands fed by irrigation canals, heavily vegetated wetlands, lakes, and reservoirs. In this study, we demonstrate the development [...] Read more.
The Caucasus is a diverse region with many climate zones that range from subtropical lowlands to mountainous alpine areas. The region is marked by irrigated croplands fed by irrigation canals, heavily vegetated wetlands, lakes, and reservoirs. In this study, we demonstrate the development of an improved surface water map based on a global water dataset to get a better understanding of the spatial distribution of small water bodies. First, we used the global water product from the European Commission Joint Research Center (JRC) to generate training data points by stratified random sampling. Next, we applied the optimal probability cut-off logistic regression model to develop surface water datasets for the entire Caucasus region, covering 19 Landsat tiles from May to October 2019. Finally, we used 6745 manually classified points (3261 non-water, 3484 water) to validate both the newly developed water dataset and the JRC global surface water dataset using an estimated proportion of area error matrix to evaluate accuracy. Our approach produced surface water extent maps with higher accuracy (89.2%) and detected 392 km2 more water than the global product (86.7% accuracy). We demonstrate that the newly developed method enables surface water detection of small ponds and lakes, flooded agricultural fields, and narrow irrigation channels, which are particularly important for mosquito-borne diseases. Full article
Show Figures

Graphical abstract

16 pages, 4636 KiB  
Article
Texture Is Important in Improving the Accuracy of Mapping Photovoltaic Power Plants: A Case Study of Ningxia Autonomous Region, China
by Xunhe Zhang, Mojtaba Zeraatpisheh, Md Mizanur Rahman, Shujian Wang and Ming Xu
Remote Sens. 2021, 13(19), 3909; https://doi.org/10.3390/rs13193909 - 30 Sep 2021
Cited by 23 | Viewed by 3451
Abstract
Photovoltaic (PV) technology is becoming more popular due to climate change because it allows for replacing fossil-fuel power generation to reduce greenhouse gas emissions. Consequently, many countries have been attempting to generate electricity through PV power plants over the last decade. Monitoring PV [...] Read more.
Photovoltaic (PV) technology is becoming more popular due to climate change because it allows for replacing fossil-fuel power generation to reduce greenhouse gas emissions. Consequently, many countries have been attempting to generate electricity through PV power plants over the last decade. Monitoring PV power plants through satellite imagery, machine learning models, and cloud-based computing systems that may ensure rapid and precise locating with current status on a regional basis are crucial for environmental impact assessment and policy formulation. The effect of fusion of the spectral, textural with different neighbor sizes, and topographic features that may improve machine learning accuracy has not been evaluated yet in PV power plants’ mapping. This study mapped PV power plants using a random forest (RF) model on the Google Earth Engine (GEE) platform. We combined textural features calculated from the Grey Level Co-occurrence Matrix (GLCM), reflectance, thermal spectral features, and Normalized Difference Vegetation Index (NDVI), Normalized Difference Built-up Index (NDBI), and Modified Normalized Difference Water Index (MNDWI) from Landsat-8 imagery and elevation, slope, and aspect from Shuttle Radar Topography Mission (SRTM) as input variables. We found that the textural features from GLCM prominent enhance the accuracy of the random forest model in identifying PV power plants where a neighbor size of 30 pixels showed the best model performance. The addition of texture features can improve model accuracy from a Kappa statistic of 0.904 ± 0.05 to 0.938 ± 0.04 and overall accuracy of 97.45 ± 0.14% to 98.32 ± 0.11%. The topographic and thermal features contribute a slight improvement in modeling. This study extends the knowledge of the effect of various variables in identifying PV power plants from remote sensing data. The texture characteristics of PV power plants at different spatial resolutions deserve attention. The findings of our study have great significance for collecting the geographic information of PV power plants and evaluating their environmental impact. Full article
Show Figures

Figure 1

27 pages, 35146 KiB  
Article
A Spatio-Temporal Local Association Query Algorithm for Multi-Source Remote Sensing Big Data
by Lilu Zhu, Xiaolu Su, Yanfeng Hu, Xianqing Tai and Kun Fu
Remote Sens. 2021, 13(12), 2333; https://doi.org/10.3390/rs13122333 - 14 Jun 2021
Cited by 1 | Viewed by 2537
Abstract
It is extremely important to extract valuable information and achieve efficient integration of remote sensing data. The multi-source and heterogeneous nature of remote sensing data leads to the increasing complexity of these relationships, and means that the processing mode based on data ontology [...] Read more.
It is extremely important to extract valuable information and achieve efficient integration of remote sensing data. The multi-source and heterogeneous nature of remote sensing data leads to the increasing complexity of these relationships, and means that the processing mode based on data ontology cannot meet requirements any more. On the other hand, the multi-dimensional features of remote sensing data bring more difficulties in data query and analysis, especially for datasets with a lot of noise. Therefore, data quality has become the bottleneck of data value discovery, and a single batch query is not enough to support the optimal combination of global data resources. In this paper, we propose a spatio-temporal local association query algorithm for remote sensing data (STLAQ). Firstly, we design a spatio-temporal data model and a bottom-up spatio-temporal correlation network. Then, we use the method of partition-based clustering and the method of spectral clustering to measure the correlation between spatio-temporal correlation networks. Finally, we construct a spatio-temporal index to provide joint query capabilities. We carry out local association query efficiency experiments to verify the feasibility of STLAQ on multi-scale datasets. The results show that the STLAQ weakens the barriers between remote sensing data, and improves their application value effectively. Full article
Show Figures

Figure 1

26 pages, 9817 KiB  
Article
Detecting Offshore Drilling Rigs with Multitemporal NDWI: A Case Study in the Caspian Sea
by Hui Zhu, Gongxu Jia, Qingling Zhang, Shan Zhang, Xiaoli Lin and Yanmin Shuai
Remote Sens. 2021, 13(8), 1576; https://doi.org/10.3390/rs13081576 - 19 Apr 2021
Cited by 8 | Viewed by 4069
Abstract
Offshore drilling rigs are the foundation of oil and gas exploitation in water areas. Their spatial and temporal distribution, state attributes and other information directly reflect the exploitation level of regional oil and gas resources. Therefore, it is very important to build an [...] Read more.
Offshore drilling rigs are the foundation of oil and gas exploitation in water areas. Their spatial and temporal distribution, state attributes and other information directly reflect the exploitation level of regional oil and gas resources. Therefore, it is very important to build an automatic detecting method for offshore drilling rigs with good performance to accurately capture the temporal and spatial distribution and state of oil and gas exploitation activities. At present, there are two main groups of methods for offshore drilling rigs: invariant feature-based methods and nighttime firelight-based methods. Methods based on invariant location are more subjective in terms of their parameter settings and require intensive computation. Nighttime light-based methods are largely unable to identify offshore drilling rigs without associated waste gas ignition. Furthermore, multiple offshore drilling rigs in close proximity to one another cannot be effectively distinguished with low spatial resolution imagery. To address these shortcomings, we propose a new method for the automatic identification of offshore drilling rigs based on Landsat-7 ETM+ images from 2018 to 2019, taking the Caspian Sea as the research area. We build a nominal annual cloud and cloud shadow-free Normalized Difference Water Index (NDWI) composite by designing an optimal NDWI compositing method based of the influence of cloud and cloud shadow on the NDWI values of water, bare land (island) and offshore drilling rigs. The classification of these objects is simultaneously done during the compositing process, with the following rules: water body (Max_NDWI > 0.55), bare land (island) (Min_NDWI < −0.05) and offshore drilling rig (0 < Mean_NDWI < 0.4). A threshold segmentation and postprocessing were carried out to further refine the results. Using this method, 497 offshore platforms were automatically identified using a nominal annual cloud and cloud shadow-free NDWI composite image and Google Earth Engine. Validation using Sentinel-2 Multispectral Imager (MSI) and Google Earth images demonstrated that the correct rate of offshore drilling rig detection in the Caspian Sea is 90.2%, the missing judgment rate is 5.3% and the wrong judgment rate is 4.5%, proving the performance of the proposed method. This method can be used to identify offshore drilling rigs within a large water surface area relatively quickly, which is of great significance for exploring the exploitation status of offshore oil and gas resources. It can also be extended to finer spatial resolution optical remote sensing images; thus small-size drilling rigs can be effectively detected. Full article
Show Figures

Graphical abstract

23 pages, 8433 KiB  
Article
A High-Dimensional Indexing Model for Multi-Source Remote Sensing Big Data
by Lilu Zhu, Xiaolu Su and Xianqing Tai
Remote Sens. 2021, 13(7), 1314; https://doi.org/10.3390/rs13071314 - 30 Mar 2021
Cited by 3 | Viewed by 2584
Abstract
With continuous improvement of earth observation technology, source, and volume of remote sensing data are gradually enriched. It is critical to realize unified organization and to form data sharing service capabilities for massive remote sensing data effectively. We design a hierarchical multi-dimensional hybrid [...] Read more.
With continuous improvement of earth observation technology, source, and volume of remote sensing data are gradually enriched. It is critical to realize unified organization and to form data sharing service capabilities for massive remote sensing data effectively. We design a hierarchical multi-dimensional hybrid indexing model (HMDH), to address the problems in underlying organization and management, and improve query efficiency. Firstly, we establish remote sensing data grid as the smallest unit carrying and processing spatio-temporal information. We implement the construction of the HMDH in two steps, data classification based on fuzzy clustering algorithm, and classification optimization based on recursive neighborhood search algorithm. Then, we construct a hierarchical “cube” structure, filled with continuous space filling curves, to complete the coding of the HMDH. The HMDH reduces the amount of data to 6–17% and improves the accuracy to more than eight times than traditional grid model. Moreover, it can reduce the query time to 25% in some query scenarios than algorithms selected as the baseline in this paper. The HMDH model proposed can be used to solve the efficiency problems of fast and joint retrieval of remote sensing data. It extends the pattens of data sharing service and has a high application value. Full article
Show Figures

Figure 1

23 pages, 5999 KiB  
Article
Accuracy Improvements to Pixel-Based and Object-Based LULC Classification with Auxiliary Datasets from Google Earth Engine
by Le’an Qu, Zhenjie Chen, Manchun Li, Junjun Zhi and Huiming Wang
Remote Sens. 2021, 13(3), 453; https://doi.org/10.3390/rs13030453 - 28 Jan 2021
Cited by 51 | Viewed by 6077
Abstract
The monitoring and assessment of land use/land cover (LULC) change over large areas are significantly important in numerous research areas, such as natural resource protection, sustainable development, and climate change. However, accurately extracting LULC only using the spectral features of satellite images is [...] Read more.
The monitoring and assessment of land use/land cover (LULC) change over large areas are significantly important in numerous research areas, such as natural resource protection, sustainable development, and climate change. However, accurately extracting LULC only using the spectral features of satellite images is difficult owing to landscape heterogeneities over large areas. To improve the accuracy of LULC classification, numerous studies have introduced other auxiliary features to the classification model. The Google Earth Engine (GEE) not only provides powerful computing capabilities, but also provides a large amount of remote sensing data and various auxiliary datasets. However, the different effects of various auxiliary datasets in the GEE on the improvement of the LULC classification accuracy need to be elucidated along with methods that can optimize combinations of auxiliary datasets for pixel- and object-based classification. Herein, we comprehensively analyze the performance of different auxiliary features in improving the accuracy of pixel- and object-based LULC classification models with medium resolution. We select the Yangtze River Delta in China as the study area and Landsat-8 OLI data as the main dataset. Six types of features, including spectral features, remote sensing multi-indices, topographic features, soil features, distance to the water source, and phenological features, are derived from auxiliary open-source datasets in GEE. We then examine the effect of auxiliary datasets on the improvement of the accuracy of seven pixels-based and seven object-based random forest classification models. The results show that regardless of the types of auxiliary features, the overall accuracy of the classification can be improved. The results further show that the object-based classification achieves higher overall accuracy compared to that obtained by the pixel-based classification. The best overall accuracy from the pixel-based (object-based) classification model is 94.20% (96.01%). The topographic features play the most important role in improving the overall accuracy of classification in the pixel- and object-based models comprising all features. Although a higher accuracy is achieved when the object-based method is used with only spectral data, small objects on the ground cannot be monitored. However, combined with many types of auxiliary features, the object-based method can identify small objects while also achieving greater accuracy. Thus, when applying object-based classification models to mid-resolution remote sensing images, different types of auxiliary features are required. Our research results improve the accuracy of LULC classification in the Yangtze River Delta and further provide a benchmark for other regions with large landscape heterogeneity. Full article
Show Figures

Figure 1

21 pages, 5195 KiB  
Article
A Classification of Tidal Flat Wetland Vegetation Combining Phenological Features with Google Earth Engine
by Nan Wu, Runhe Shi, Wei Zhuo, Chao Zhang, Bingchan Zhou, Zilong Xia, Zhu Tao, Wei Gao and Bo Tian
Remote Sens. 2021, 13(3), 443; https://doi.org/10.3390/rs13030443 - 27 Jan 2021
Cited by 35 | Viewed by 4683
Abstract
The composition and distribution of wetland vegetation is critical for ecosystem diversity and sustainable development. However, tidal flat wetland environments are complex, and obtaining effective satellite imagery is challenging due to the high cloud coverage. Moreover, it is difficult to acquire phenological feature [...] Read more.
The composition and distribution of wetland vegetation is critical for ecosystem diversity and sustainable development. However, tidal flat wetland environments are complex, and obtaining effective satellite imagery is challenging due to the high cloud coverage. Moreover, it is difficult to acquire phenological feature data and extract species-level wetland vegetation information by using only spectral data or individual images. To solve these limitations, statistical features, temporal features, and phenological features of multiple Landsat 8 time-series images obtained via the Google Earth Engine (GEE) platform were compared to extract species-level wetland vegetation information from Chongming Island, China. The results indicated that (1) a harmonic model obtained the phenological characteristics of wetland vegetation better than the raw vegetation index (VI) and the Savitzky–Golay (SG) smoothing method; (2) classification based on the combination of the three features provided the highest overall accuracy (85.54%), and the phenological features (represented by the amplitude and phase of the harmonic model) had the greatest impact on the classification; and (3) the classification result from the senescence period was more accurate than that from the green period, but the annual mapping result on all seasons was the most accurate. The method described in this study can be applied to overcome the impacts of the complex environment in tidal flat wetlands and to effectively classify wetland vegetation species using GEE. This study could be used as a reference for the analysis of the phenological features of other areas or vegetation types. Full article
Show Figures

Graphical abstract

2020

Jump to: 2022, 2021, 2019, 2018, 2017

27 pages, 9105 KiB  
Article
Spatial and Temporal Changes in the Normalized Difference Vegetation Index and Their Driving Factors in the Desert/Grassland Biome Transition Zone of the Sahel Region of Africa
by Shupu Wu, Xin Gao, Jiaqiang Lei, Na Zhou and Yongdong Wang
Remote Sens. 2020, 12(24), 4119; https://doi.org/10.3390/rs12244119 - 16 Dec 2020
Cited by 19 | Viewed by 4688
Abstract
The ecological system of the desert/grassland biome transition zone is fragile and extremely sensitive to climate change and human activities. Analyzing the relationships between vegetation, climate factors (precipitation and temperature), and human activities in this zone can inform us about vegetation succession rules [...] Read more.
The ecological system of the desert/grassland biome transition zone is fragile and extremely sensitive to climate change and human activities. Analyzing the relationships between vegetation, climate factors (precipitation and temperature), and human activities in this zone can inform us about vegetation succession rules and driving mechanisms. Here, we used Landsat series images to study changes in the normalized difference vegetation index (NDVI) over this zone in the Sahel region of Africa. We selected 6315 sampling points for machine-learning training, across four types: desert, desert/grassland biome transition zone, grassland, and water bodies. We then extracted the range of the desert/grassland biome transition zone using the random forest method. We used Global Inventory Monitoring and Modelling Studies (GIMMS) data and the fifth-generation atmospheric reanalysis of the European Centre for Medium-Range Weather Forecasts (ERA5) meteorological assimilation data to explore the spatiotemporal characteristics of NDVI and climatic factors (temperature and precipitation). We used the multiple regression residual method to analyze the contributions of human activities and climate change to NDVI. The cellular automation (CA)-Markov model was used to predict the spatial position of the desert/grassland biome transition zone. From 1982 to 2015, the NDVI and temperature increased; no distinct trend was found for precipitation. The climate change and NDVI change trends both showed spatial stratified heterogeneity. Temperature and precipitation had a significant impact on NDVI in the desert/grassland biome transition zone; precipitation and NDVI were positively correlated, and temperature and NDVI were negatively correlated. Both human activities and climate factors influenced vegetation changes. The contribution rates of human activities and climate factors to the increase in vegetation were 97.7% and 48.1%, respectively. Human activities and climate factors together contributed 47.5% to this increase. The CA-Markov model predicted that the area of the desert/grassland biome transition zone in the Sahel region will expand northward and southward in the next 30 years. Full article
Show Figures

Figure 1

17 pages, 12259 KiB  
Article
Object-Oriented LULC Classification in Google Earth Engine Combining SNIC, GLCM, and Machine Learning Algorithms
by Andrea Tassi and Marco Vizzari
Remote Sens. 2020, 12(22), 3776; https://doi.org/10.3390/rs12223776 - 17 Nov 2020
Cited by 161 | Viewed by 22974
Abstract
Google Earth Engine (GEE) is a versatile cloud platform in which pixel-based (PB) and object-oriented (OO) Land Use–Land Cover (LULC) classification approaches can be implemented, thanks to the availability of the many state-of-art functions comprising various Machine Learning (ML) algorithms. OO approaches, including [...] Read more.
Google Earth Engine (GEE) is a versatile cloud platform in which pixel-based (PB) and object-oriented (OO) Land Use–Land Cover (LULC) classification approaches can be implemented, thanks to the availability of the many state-of-art functions comprising various Machine Learning (ML) algorithms. OO approaches, including both object segmentation and object textural analysis, are still not common in the GEE environment, probably due to the difficulties existing in concatenating the proper functions, and in tuning the various parameters to overcome the GEE computational limits. In this context, this work is aimed at developing and testing an OO classification approach combining the Simple Non-Iterative Clustering (SNIC) algorithm to identify spatial clusters, the Gray-Level Co-occurrence Matrix (GLCM) to calculate cluster textural indices, and two ML algorithms (Random Forest (RF) or Support Vector Machine (SVM)) to perform the final classification. A Principal Components Analysis (PCA) is applied to the main seven GLCM indices to synthesize in one band the textural information used for the OO classification. The proposed approach is implemented in a user-friendly, freely available GEE code useful to perform the OO classification, tuning various parameters (e.g., choose the input bands, select the classification algorithm, test various segmentation scales) and compare it with a PB approach. The accuracy of OO and PB classifications can be assessed both visually and through two confusion matrices that can be used to calculate the relevant statistics (producer’s, user’s, overall accuracy (OA)). The proposed methodology was broadly tested in a 154 km2 study area, located in the Lake Trasimeno area (central Italy), using Landsat 8 (L8), Sentinel 2 (S2), and PlanetScope (PS) data. The area was selected considering its complex LULC mosaic mainly composed of artificial surfaces, annual and permanent crops, small lakes, and wooded areas. In the study area, the various tests produced interesting results on the different datasets (OA: PB RF (L8 = 72.7%, S2 = 82%, PS = 74.2), PB SVM (L8 = 79.1%, S2 = 80.2%, PS = 74.8%), OO RF (L8 = 64%, S2 = 89.3%, PS = 77.9), OO SVM (L8 = 70.4, S2 = 86.9%, PS = 73.9)). The broad code application demonstrated very good reliability of the whole process, even though the OO classification process resulted, sometimes, too demanding on higher resolution data, considering the available computational GEE resources. Full article
Show Figures

Graphical abstract

18 pages, 6746 KiB  
Article
SnowCloudMetrics: Snow Information for Everyone
by Ryan L. Crumley, Ross T. Palomaki, Anne W. Nolin, Eric A. Sproles and Eugene J. Mar
Remote Sens. 2020, 12(20), 3341; https://doi.org/10.3390/rs12203341 - 13 Oct 2020
Cited by 11 | Viewed by 5461
Abstract
Snow is a critical component of the climate system, provides fresh water for millions of people globally, and affects forest and wildlife ecology. Snowy regions are typically data sparse, especially in mountain environments. Remotely-sensed snow cover data are available globally but are challenging [...] Read more.
Snow is a critical component of the climate system, provides fresh water for millions of people globally, and affects forest and wildlife ecology. Snowy regions are typically data sparse, especially in mountain environments. Remotely-sensed snow cover data are available globally but are challenging to convert into accessible, actionable information. SnowCloudMetrics is a web portal for on-demand production and delivery of snow information including snow cover frequency (SCF) and snow disappearance date (SDD) using Google Earth Engine (GEE). SCF and SDD are computed using the Moderate Resolution Imaging Spectroradiometer (MODIS) Snow Cover Binary 500 m (MOD10A1) product. The SCF and SDD metrics are assessed using 18 years of Snow Telemetry records at more than 750 stations across the Western U.S. SnowCloudMetrics provides users with the capacity to quickly and efficiently generate local-to-global scale snow information. It requires no user-side data storage or computing capacity, and needs little in the way of remote sensing expertise. SnowCloudMetrics allows users to subset by year, watershed, elevation range, political boundary, or user-defined region. Users can explore the snow information via a GEE map interface and, if desired, download scripts for access to tabular and image data in non-proprietary formats for additional analyses. We present global and hemispheric scale examples of SCF and SDD. We also provide a watershed example in the transboundary, snow-dominated Amu Darya Basin. Our approach represents a new, user-driven paradigm for access to snow information. SnowCloudMetrics benefits snow scientists, water resource managers, climate scientists, and snow related industries providing SCF and SDD information tailored to their needs, especially in data sparse regions. Full article
Show Figures

Graphical abstract

18 pages, 7429 KiB  
Article
Land Use/Land Cover Changes and Their Driving Factors in the Northeastern Tibetan Plateau Based on Geographical Detectors and Google Earth Engine: A Case Study in Gannan Prefecture
by Chenli Liu, Wenlong Li, Gaofeng Zhu, Huakun Zhou, Hepiao Yan and Pengfei Xue
Remote Sens. 2020, 12(19), 3139; https://doi.org/10.3390/rs12193139 - 24 Sep 2020
Cited by 99 | Viewed by 8388
Abstract
As an important production base for livestock and a unique ecological zone in China, the northeast Tibetan Plateau has experienced dramatic land use/land cover (LULC) changes with increasing human activities and continuous climate change. However, extensive cloud cover limits the ability of optical [...] Read more.
As an important production base for livestock and a unique ecological zone in China, the northeast Tibetan Plateau has experienced dramatic land use/land cover (LULC) changes with increasing human activities and continuous climate change. However, extensive cloud cover limits the ability of optical remote sensing satellites to monitor accurately LULC changes in this area. To overcome this problem in LULC mapping in the Ganan Prefecture, 2000–2018, we used the dense time stacking of multi-temporal Landsat images and random forest algorithm based on the Google Earth Engine (GEE) platform. The dynamic trends of LULC changes were analyzed, and geographical detectors quantitatively evaluated the key driving factors of these changes. The results showed that (1) the overall classification accuracy varied between 89.14% and 91.41%, and the kappa values were greater than 86.55%, indicating that the classification results were reliably accurate. (2) The major LULC types in the study area were grassland and forest, and their area accounted for 50% and 25%, respectively. During the study period, the grassland area decreased, while the area of forest land and construction land increased to varying degrees. The land-use intensity presents multi-level intensity, and it was higher in the northeast than that in the southwest. (3) Elevation and population density were the major driving factors of LULC changes, and economic development has also significantly affected LULC. These findings revealed the main factors driving LULC changes in Gannan Prefecture and provided a reference for assisting in the development of sustainable land management and ecological protection policy decisions. Full article
Show Figures

Graphical abstract

20 pages, 11788 KiB  
Article
Monitoring the Ice Phenology of Qinghai Lake from 1980 to 2018 Using Multisource Remote Sensing Data and Google Earth Engine
by Miaomiao Qi, Shiyin Liu, Xiaojun Yao, Fuming Xie and Yongpeng Gao
Remote Sens. 2020, 12(14), 2217; https://doi.org/10.3390/rs12142217 - 10 Jul 2020
Cited by 21 | Viewed by 3846
Abstract
Lake ice, one of the most direct lake physical characteristics affected by climate change, can reflect small-scale environmental changes caused by the atmosphere and hydrology, as well as large-scale climate changes such as global warming. This study uses National Oceanic and Atmospheric Administration, [...] Read more.
Lake ice, one of the most direct lake physical characteristics affected by climate change, can reflect small-scale environmental changes caused by the atmosphere and hydrology, as well as large-scale climate changes such as global warming. This study uses National Oceanic and Atmospheric Administration, Advanced Very High Resolution Radiometer (NOAA AVHRR), MOD09GQ surface reflectance products, and Landsat surface reflectance Tier 1 products, which comprehensively used RS and GIS technology to study lake ice phenology (LIP) and changes in Qinghai Lake. Over the past 38 years, freeze-up start and freeze-up end dates were gradually delayed by a rate of 0.16 d/a and 0.19 d/a, respectively, with a total delay by 6.08 d and 7.22 d. The dates of break-up start and break-up end showed advancing trends by −0.36 d/a and −0.42 d/a, respectively, which shifted them earlier by 13.68 d and 15.96 d. Overall, ice coverage duration, freeze duration, and complete freeze duration showed decreasing trends of −0.58 d/a, −0.60 d/a, and −0.52 d/a, respectively, and overall decreased by 22.04 d, 22.81 d, and 9.76 d between 1980 and 2018. The spatial pattern in the freeze–thaw of Qinghai Lake can be divided into two areas; the west of the lake area has similar spatial patterns of freezing and ablation, while, in the east of the lake area, freezing and ablation patterns are opposite. Climate factors were closely related to LIP, especially the accumulated freezing degree-day (AFDD) from October to April of the following year. Furthermore, freeze-up start time was more sensitive to changes in wind speed and precipitation. Full article
Show Figures

Graphical abstract

21 pages, 9492 KiB  
Article
Google Earth Engine Open-Source Code for Land Surface Temperature Estimation from the Landsat Series
by Sofia L. Ermida, Patrícia Soares, Vasco Mantas, Frank-M. Göttsche and Isabel F. Trigo
Remote Sens. 2020, 12(9), 1471; https://doi.org/10.3390/rs12091471 - 06 May 2020
Cited by 270 | Viewed by 433399
Abstract
Land Surface Temperature (LST) is increasingly important for various studies assessing land surface conditions, e.g., studies of urban climate, evapotranspiration, and vegetation stress. The Landsat series of satellites have the potential to provide LST estimates at a high spatial resolution, which is particularly [...] Read more.
Land Surface Temperature (LST) is increasingly important for various studies assessing land surface conditions, e.g., studies of urban climate, evapotranspiration, and vegetation stress. The Landsat series of satellites have the potential to provide LST estimates at a high spatial resolution, which is particularly appropriate for local or small-scale studies. Numerous studies have proposed LST retrieval algorithms for the Landsat series, and some datasets are available online. However, those datasets generally require the users to be able to handle large volumes of data. Google Earth Engine (GEE) is an online platform created to allow remote sensing users to easily perform big data analyses without increasing the demand for local computing resources. However, high spatial resolution LST datasets are currently not available in GEE. Here we provide a code repository that allows computing LSTs from Landsat 4, 5, 7, and 8 within GEE. The code may be used freely by users for computing Landsat LST as part of any analysis within GEE. Full article
Show Figures

Graphical abstract

17 pages, 4385 KiB  
Article
Responses of Seasonal Indicators to Extreme Droughts in Southwest China
by Peiyu Lai, Miao Zhang, Zhongxi Ge, Binfei Hao, Zengjing Song, Jing Huang, Mingguo Ma, Hong Yang and Xujun Han
Remote Sens. 2020, 12(5), 818; https://doi.org/10.3390/rs12050818 - 03 Mar 2020
Cited by 24 | Viewed by 4616
Abstract
Significant impact of extreme droughts on human society and ecosystem has occurred in many places of the world, for example, Southwest China (SWC). Considerable research concentrated on analyzing causes and effects of droughts in SWC, but few studies have examined seasonal indicators, such [...] Read more.
Significant impact of extreme droughts on human society and ecosystem has occurred in many places of the world, for example, Southwest China (SWC). Considerable research concentrated on analyzing causes and effects of droughts in SWC, but few studies have examined seasonal indicators, such as variations of surface water and vegetation phenology. With the ongoing satellite missions, more and more earth observation data become available to environmental studies. Exploring the responses of seasonal indicators from satellite data to drought is helpful for the future drought forecast and management. This study analyzed the seasonal responses of surface water and vegetation phenology to drought in SWC using the multi-source data including Seasonal Water Area (SWA), Permanent Water Area (PWA), Start of Season (SOS), End of Season (EOS), Length of Season (LOS), precipitation, temperature, solar radiation, evapotranspiration, the Palmer Drought Severity Index (PDSI), the Normalized Difference Vegetation Index (NDVI), the Enhanced Vegetation Index (EVI), Gross Primary Productivity (GPP) and data from water conservancy construction. The results showed that SWA and LOS effectively revealed the development and recovery of droughts. There were two obvious drought periods from 2000 to 2017. In the first period (from August 2003 to June 2007), SWA decreased by 11.81% and LOS shortened by 5 days. They reduced by 21.04% and 9 days respectively in the second period (from September 2009 to June 2014), which indicated that there are more severe droughts in the second period. The SOS during two drought periods delayed by 3~6 days in spring, while the EOS advanced 1~3 days in autumn. All of PDSI, SWA and LOS could reflect the period of droughts in SWC, but the LOS and PDSI were very sensitive to the meteorological events, such as precipitation and temperature, while the SWA performed a more stable reaction to drought and could be a good indicator for the drought periodicity. This made it possible for using SWA in drought forecast because of the strong correlation between SWA and drought. Our results improved the understanding of seasonal responses to extreme droughts in SWC, which will be helpful to the drought monitoring and mitigation for different seasons in this ecologically fragile region. Full article
Show Figures

Graphical abstract

2019

Jump to: 2022, 2021, 2020, 2018, 2017

16 pages, 29148 KiB  
Article
Statistical Analysis of Changes in Sentinel-1 Time Series on the Google Earth Engine
by Morton J. Canty, Allan A. Nielsen, Knut Conradsen and Henning Skriver
Remote Sens. 2020, 12(1), 46; https://doi.org/10.3390/rs12010046 - 20 Dec 2019
Cited by 31 | Viewed by 19100
Abstract
Time series analysis of Sentinel-1 SAR imagery made available by the Google Earth Engine (GEE) is described. Advantage is taken of a recent modification of a sequential complex Wishart-based algorithm which is applicable to the dual polarization intensity data archived on the GEE. [...] Read more.
Time series analysis of Sentinel-1 SAR imagery made available by the Google Earth Engine (GEE) is described. Advantage is taken of a recent modification of a sequential complex Wishart-based algorithm which is applicable to the dual polarization intensity data archived on the GEE. Both the algorithm and a software interface to the GEE Python API for convenient data exploration and analysis are presented; the latter can be run from a platform independent Docker container and the source code is available on GitHub. Application examples are given involving the monitoring of anthropogenic activity (shipping, uranium mining, deforestation) and disaster assessment (flash floods). These highlight the advantages of the good temporal resolution resulting from cloud cover independence, short revisit times and near real time data availability. Full article
Show Figures

Graphical abstract

4 pages, 171 KiB  
Editorial
Google Earth Engine Applications
by Onisimo Mutanga and Lalit Kumar
Remote Sens. 2019, 11(5), 591; https://doi.org/10.3390/rs11050591 - 12 Mar 2019
Cited by 252 | Viewed by 25273
Abstract
The Google Earth Engine (GEE) is a cloud computing platform designed to store and process huge data sets (at petabyte-scale) for analysis and ultimate decision making [...] Full article

2018

Jump to: 2022, 2021, 2020, 2019, 2017

27 pages, 31644 KiB  
Article
The First Wetland Inventory Map of Newfoundland at a Spatial Resolution of 10 m Using Sentinel-1 and Sentinel-2 Data on the Google Earth Engine Cloud Computing Platform
by Masoud Mahdianpari, Bahram Salehi, Fariba Mohammadimanesh, Saeid Homayouni and Eric Gill
Remote Sens. 2019, 11(1), 43; https://doi.org/10.3390/rs11010043 - 28 Dec 2018
Cited by 206 | Viewed by 19179
Abstract
Wetlands are one of the most important ecosystems that provide a desirable habitat for a great variety of flora and fauna. Wetland mapping and modeling using Earth Observation (EO) data are essential for natural resource management at both regional and national levels. However, [...] Read more.
Wetlands are one of the most important ecosystems that provide a desirable habitat for a great variety of flora and fauna. Wetland mapping and modeling using Earth Observation (EO) data are essential for natural resource management at both regional and national levels. However, accurate wetland mapping is challenging, especially on a large scale, given their heterogeneous and fragmented landscape, as well as the spectral similarity of differing wetland classes. Currently, precise, consistent, and comprehensive wetland inventories on a national- or provincial-scale are lacking globally, with most studies focused on the generation of local-scale maps from limited remote sensing data. Leveraging the Google Earth Engine (GEE) computational power and the availability of high spatial resolution remote sensing data collected by Copernicus Sentinels, this study introduces the first detailed, provincial-scale wetland inventory map of one of the richest Canadian provinces in terms of wetland extent. In particular, multi-year summer Synthetic Aperture Radar (SAR) Sentinel-1 and optical Sentinel-2 data composites were used to identify the spatial distribution of five wetland and three non-wetland classes on the Island of Newfoundland, covering an approximate area of 106,000 km2. The classification results were evaluated using both pixel-based and object-based random forest (RF) classifications implemented on the GEE platform. The results revealed the superiority of the object-based approach relative to the pixel-based classification for wetland mapping. Although the classification using multi-year optical data was more accurate compared to that of SAR, the inclusion of both types of data significantly improved the classification accuracies of wetland classes. In particular, an overall accuracy of 88.37% and a Kappa coefficient of 0.85 were achieved with the multi-year summer SAR/optical composite using an object-based RF classification, wherein all wetland and non-wetland classes were correctly identified with accuracies beyond 70% and 90%, respectively. The results suggest a paradigm-shift from standard static products and approaches toward generating more dynamic, on-demand, large-scale wetland coverage maps through advanced cloud computing resources that simplify access to and processing of the “Geo Big Data.” In addition, the resulting ever-demanding inventory map of Newfoundland is of great interest to and can be used by many stakeholders, including federal and provincial governments, municipalities, NGOs, and environmental consultants to name a few. Full article
Show Figures

Graphical abstract

15 pages, 3424 KiB  
Article
Google Earth Engine Applications Since Inception: Usage, Trends, and Potential
by Lalit Kumar and Onisimo Mutanga
Remote Sens. 2018, 10(10), 1509; https://doi.org/10.3390/rs10101509 - 20 Sep 2018
Cited by 419 | Viewed by 23018
Abstract
The Google Earth Engine (GEE) portal provides enhanced opportunities for undertaking earth observation studies. Established towards the end of 2010, it provides access to satellite and other ancillary data, cloud computing, and algorithms for processing large amounts of data with relative ease. However, [...] Read more.
The Google Earth Engine (GEE) portal provides enhanced opportunities for undertaking earth observation studies. Established towards the end of 2010, it provides access to satellite and other ancillary data, cloud computing, and algorithms for processing large amounts of data with relative ease. However, the uptake and usage of the opportunity remains varied and unclear. This study was undertaken to investigate the usage patterns of the Google Earth Engine platform and whether researchers in developing countries were making use of the opportunity. Analysis of published literature showed that a total of 300 journal papers were published between 2011 and June 2017 that used GEE in their research, spread across 158 journals. The highest number of papers were in the journal Remote Sensing, followed by Remote Sensing of Environment. There were also a number of papers in premium journals such as Nature and Science. The application areas were quite varied, ranging from forest and vegetation studies to medical fields such as malaria. Landsat was the most widely used dataset; it is the biggest component of the GEE data portal, with data from the first to the current Landsat series available for use and download. Examination of data also showed that the usage was dominated by institutions based in developed nations, with study sites mainly in developed nations. There were very few studies originating from institutions based in less developed nations and those that targeted less developed nations, particularly in the African continent. Full article
Show Figures

Figure 1

21 pages, 8989 KiB  
Article
Monitoring the Impact of Land Cover Change on Surface Urban Heat Island through Google Earth Engine: Proposal of a Global Methodology, First Applications and Problems
by Roberta Ravanelli, Andrea Nascetti, Raffaella Valeria Cirigliano, Clarissa Di Rico, Giovanni Leuzzi, Paolo Monti and Mattia Crespi
Remote Sens. 2018, 10(9), 1488; https://doi.org/10.3390/rs10091488 - 18 Sep 2018
Cited by 83 | Viewed by 12925
Abstract
All over the world, the rapid urbanization process is challenging the sustainable development of our cities. In 2015, the United Nation highlighted in Goal 11 of the SDGs (Sustainable Development Goals) the importance to “Make cities inclusive, safe, resilient and sustainable”. In order [...] Read more.
All over the world, the rapid urbanization process is challenging the sustainable development of our cities. In 2015, the United Nation highlighted in Goal 11 of the SDGs (Sustainable Development Goals) the importance to “Make cities inclusive, safe, resilient and sustainable”. In order to monitor progress regarding SDG 11, there is a need for proper indicators, representing different aspects of city conditions, obviously including the Land Cover (LC) changes and the urban climate with its most distinct feature, the Urban Heat Island (UHI). One of the aspects of UHI is the Surface Urban Heat Island (SUHI), which has been investigated through airborne and satellite remote sensing over many years. The purpose of this work is to show the present potential of Google Earth Engine (GEE) to process the huge and continuously increasing free satellite Earth Observation (EO) Big Data for long-term and wide spatio-temporal monitoring of SUHI and its connection with LC changes. A large-scale spatio-temporal procedure was implemented under GEE, also benefiting from the already established Climate Engine (CE) tool to extract the Land Surface Temperature (LST) from Landsat imagery and the simple indicator Detrended Rate Matrix was introduced to globally represent the net effect of LC changes on SUHI. The implemented procedure was successfully applied to six metropolitan areas in the U.S., and a general increasing of SUHI due to urban growth was clearly highlighted. As a matter of fact, GEE indeed allowed us to process more than 6000 Landsat images acquired over the period 1992–2011, performing a long-term and wide spatio-temporal study on SUHI vs. LC change monitoring. The present feasibility of the proposed procedure and the encouraging obtained results, although preliminary and requiring further investigations (calibration problems related to LST determination from Landsat imagery were evidenced), pave the way for a possible global service on SUHI monitoring, able to supply valuable indications to address an increasingly sustainable urban planning of our cities. Full article
Show Figures

Figure 1

21 pages, 11789 KiB  
Article
BULC-U: Sharpening Resolution and Improving Accuracy of Land-Use/Land-Cover Classifications in Google Earth Engine
by Jacky Lee, Jeffrey A. Cardille and Michael T. Coe
Remote Sens. 2018, 10(9), 1455; https://doi.org/10.3390/rs10091455 - 12 Sep 2018
Cited by 28 | Viewed by 9332
Abstract
Remote sensing is undergoing a fundamental paradigm shift, in which approaches interpreting one or two images are giving way to a wide array of data-rich applications. These include assessing global forest loss, tracking water resources across Earth’s surface, determining disturbance frequency across decades, [...] Read more.
Remote sensing is undergoing a fundamental paradigm shift, in which approaches interpreting one or two images are giving way to a wide array of data-rich applications. These include assessing global forest loss, tracking water resources across Earth’s surface, determining disturbance frequency across decades, and many more. These advances have been greatly facilitated by Google Earth Engine, which provides both image access and a platform for advanced analysis techniques. Within the realm of land-use/land-cover (LULC) classifications, Earth Engine provides the ability to create new classifications and to access major existing data sets that have already been created, particularly at global extents. By overlaying global LULC classifications—the 300-m GlobCover 2009 LULC data set for example—with sharper images like those from Landsat, one can see the promise and limits of these global data sets and platforms to fuse them. Despite the promise in a global classification covering all of the terrestrial surface, GlobCover 2009 may be too coarse for some applications. We asked whether the LULC labeling provided by GlobCover 2009 could be combined with the spatial granularity of the Landsat platform to produce a hybrid classification having the best features of both resources with high accuracy. Here we apply an improvement of the Bayesian Updating of Land Cover (BULC) algorithm that fused unsupervised Landsat classifications to GlobCover 2009, sharpening the result from a 300-m to a 30-m classification. Working with four clear categories in Mato Grosso, Brazil, we refined the resolution of the LULC classification by an order of magnitude while improving the overall accuracy from 69.1 to 97.5%. This “BULC-U” mode, because it uses unsupervised classifications as inputs, demands less region-specific knowledge from analysts and may be significantly easier for non-specialists to use. This technique can provide new information to land managers and others interested in highly accurate classifications at finer scales. Full article
Show Figures

Graphical abstract

20 pages, 10691 KiB  
Review
Flood Prevention and Emergency Response System Powered by Google Earth Engine
by Cheng-Chien Liu, Ming-Chang Shieh, Ming-Syun Ke and Kung-Hwa Wang
Remote Sens. 2018, 10(8), 1283; https://doi.org/10.3390/rs10081283 - 14 Aug 2018
Cited by 40 | Viewed by 11622
Abstract
This paper reviews the efforts made and experiences gained in developing the Flood Prevention and Emergency Response System (FPERS) powered by Google Earth Engine, focusing on its applications at the three stages of floods. At the post-flood stage, FPERS integrates various remote sensing [...] Read more.
This paper reviews the efforts made and experiences gained in developing the Flood Prevention and Emergency Response System (FPERS) powered by Google Earth Engine, focusing on its applications at the three stages of floods. At the post-flood stage, FPERS integrates various remote sensing imageries, including Formosat-2 optical imagery to detect and monitor barrier lakes, synthetic aperture radar imagery to derive an inundation map, and high-spatial-resolution photographs taken by unmanned aerial vehicles to evaluate damage to river channels and structures. At the pre-flood stage, a huge amount of geospatial data are integrated in FPERS and are categorized as typhoon forecast and archive, disaster prevention and warning, disaster events and analysis, or basic data and layers. At the during-flood stage, three strategies are implemented to facilitate the access of the real-time data: presenting the key information, making a sound recommendation, and supporting the decision-making. The example of Typhoon Soudelor in August of 2015 is used to demonstrate how FPERS was employed to support the work of flood prevention and emergency response from 2013 to 2016. The capability of switching among different topographic models and the flexibility of managing and searching data through a geospatial database are also explained, and suggestions are made for future works. Full article
Show Figures

Graphical abstract

15 pages, 2368 KiB  
Article
SnowCloudHydro—A New Framework for Forecasting Streamflow in Snowy, Data-Scarce Regions
by Eric A. Sproles, Ryan L. Crumley, Anne W. Nolin, Eugene Mar and Juan Ignacio Lopez Moreno
Remote Sens. 2018, 10(8), 1276; https://doi.org/10.3390/rs10081276 - 13 Aug 2018
Cited by 19 | Viewed by 6218
Abstract
We tested the efficacy and skill of SnowCloud, a prototype web-based, cloud-computing framework for snow mapping and hydrologic modeling. SnowCloud is the overarching framework that functions within the Google Earth Engine cloud-computing environment. SnowCloudMetrics is a sub-component of SnowCloud that provides users with [...] Read more.
We tested the efficacy and skill of SnowCloud, a prototype web-based, cloud-computing framework for snow mapping and hydrologic modeling. SnowCloud is the overarching framework that functions within the Google Earth Engine cloud-computing environment. SnowCloudMetrics is a sub-component of SnowCloud that provides users with spatially and temporally composited snow cover information in an easy-to-use format. SnowCloudHydro is a simple spreadsheet-based model that uses Snow Cover Frequency (SCF) output from SnowCloudMetrics as a key model input. In this application, SnowCloudMetrics rapidly converts NASA’s Moderate Resolution Imaging Spectroradiometer (MODIS) daily snow cover product (MOD10A1) into a monthly snow cover frequency for a user-specified watershed area. SnowCloudHydro uses SCF and prior monthly streamflow to forecast streamflow for the subsequent month. We tested the skill of SnowCloudHydro in three snow-dominated headwaters that represent a range of precipitation/snowmelt runoff categories: the Río Elqui in Northern Chile; the John Day River, in the Northwestern United States; and the Río Aragón in Northern Spain. The skill of the SnowCloudHydro model directly corresponded to snowpack contributions to streamflow. Watersheds with proportionately more snowmelt than rain provided better results (R2 values: 0.88, 0.52, and 0.22, respectively). To test the user experience of SnowCloud, we provided the tools and tutorials in English and Spanish to water resource managers in Chile, Spain, and the United States. Participants assessed their user experience, which was generally very positive. While these initial results focus on SnowCloud, they outline methods for developing cloud-based tools that can function effectively across cultures and languages. Our approach also addresses the primary challenges of science-based computing; human resource limitations, infrastructure costs, and expensive proprietary software. These challenges are particularly problematic in countries where scientific and computational resources are underdeveloped. Full article
Show Figures

Graphical abstract

24 pages, 21658 KiB  
Article
Leveraging the Google Earth Engine for Drought Assessment Using Global Soil Moisture Data
by Nazmus Sazib, Iliana Mladenova and John Bolten
Remote Sens. 2018, 10(8), 1265; https://doi.org/10.3390/rs10081265 - 11 Aug 2018
Cited by 103 | Viewed by 24747
Abstract
Soil moisture is considered to be a key variable to assess crop and drought conditions. However, readily available soil moisture datasets developed for monitoring agricultural drought conditions are uncommon. The aim of this work is to examine two global soil moisture datasets and [...] Read more.
Soil moisture is considered to be a key variable to assess crop and drought conditions. However, readily available soil moisture datasets developed for monitoring agricultural drought conditions are uncommon. The aim of this work is to examine two global soil moisture datasets and a set of soil moisture web-based processing tools developed to demonstrate the value of the soil moisture data for drought monitoring and crop forecasting using the Google Earth Engine (GEE). The two global soil moisture datasets discussed in the paper are generated by integrating the Soil Moisture Ocean Salinity (SMOS) and Soil Moisture Active Passive (SMAP) missions’ satellite-derived observations into a modified two-layer Palmer model using a one-dimensional (1D) ensemble Kalman filter (EnKF) data assimilation approach. The web-based tools are designed to explore soil moisture variability as a function of land cover change and to easily estimate drought characteristics such as drought duration and intensity using soil moisture anomalies and to intercompare them against alternative drought indicators. To demonstrate the utility of these tools for agricultural drought monitoring, the soil moisture products and vegetation- and precipitation-based products were assessed over drought-prone regions in South Africa and Ethiopia. Overall, the 3-month scale Standardized Precipitation Index (SPI) and Normalized Difference Vegetation Index (NDVI) showed higher agreement with the root zone soil moisture anomalies. Soil moisture anomalies exhibited lower drought duration, but higher intensity compared with SPIs. Inclusion of the global soil moisture data into the GEE data catalog and the development of the web-based tools described in the paper enable a vast diversity of users to quickly and easily assess the impact of drought and improve planning related to drought risk assessment and early warning. The GEE also improves the accessibility and usability of the earth observation data and related tools by making them available to a wide range of researchers and the public. In particular, the cloud-based nature of the GEE is useful for providing access to the soil moisture data and scripts to users in developing countries that lack adequate observational soil moisture data or the necessary computational resources required to develop them. Full article
Show Figures

Figure 1

14 pages, 4575 KiB  
Technical Note
Towards Global-Scale Seagrass Mapping and Monitoring Using Sentinel-2 on Google Earth Engine: The Case Study of the Aegean and Ionian Seas
by Dimosthenis Traganos, Bharat Aggarwal, Dimitris Poursanidis, Konstantinos Topouzelis, Nektarios Chrysoulakis and Peter Reinartz
Remote Sens. 2018, 10(8), 1227; https://doi.org/10.3390/rs10081227 - 05 Aug 2018
Cited by 121 | Viewed by 18680
Abstract
Seagrasses are traversing the epoch of intense anthropogenic impacts that significantly decrease their coverage and invaluable ecosystem services, necessitating accurate and adaptable, global-scale mapping and monitoring solutions. Here, we combine the cloud computing power of Google Earth Engine with the freely available Copernicus [...] Read more.
Seagrasses are traversing the epoch of intense anthropogenic impacts that significantly decrease their coverage and invaluable ecosystem services, necessitating accurate and adaptable, global-scale mapping and monitoring solutions. Here, we combine the cloud computing power of Google Earth Engine with the freely available Copernicus Sentinel-2 multispectral image archive, image composition, and machine learning approaches to develop a methodological workflow for large-scale, high spatiotemporal mapping and monitoring of seagrass habitats. The present workflow can be easily tuned to space, time and data input; here, we show its potential, mapping 2510.1 km2 of P. oceanica seagrasses in an area of 40,951 km2 between 0 and 40 m of depth in the Aegean and Ionian Seas (Greek territorial waters) after applying support vector machines to a composite of 1045 Sentinel-2 tiles at 10-m resolution. The overall accuracy of P. oceanica seagrass habitats features an overall accuracy of 72% following validation by an independent field data set to reduce bias. We envision that the introduced flexible, time- and cost-efficient cloud-based chain will provide the crucial seasonal to interannual baseline mapping and monitoring of seagrass ecosystems in global scale, resolving gain and loss trends and assisting coastal conservation, management planning, and ultimately climate change mitigation. Full article
Show Figures

Graphical abstract

14 pages, 5211 KiB  
Letter
Mapping Mining Areas in the Brazilian Amazon Using MSI/Sentinel-2 Imagery (2017)
by Felipe De Lucia Lobo, Pedro Walfir M. Souza-Filho, Evlyn Márcia Leão de Moraes Novo, Felipe Menino Carlos and Claudio Clemente Faria Barbosa
Remote Sens. 2018, 10(8), 1178; https://doi.org/10.3390/rs10081178 - 25 Jul 2018
Cited by 67 | Viewed by 12769
Abstract
Although mining plays an important role for the economy of the Amazon, little is known about its attributes such as area, type, scale, and current status as well as socio/environmental impacts. Therefore, we first propose a low time-consuming and high detection accuracy method [...] Read more.
Although mining plays an important role for the economy of the Amazon, little is known about its attributes such as area, type, scale, and current status as well as socio/environmental impacts. Therefore, we first propose a low time-consuming and high detection accuracy method for mapping the current mining areas within 13 regions of the Brazilian Amazon using Sentinel-2 images. Then, integrating the maps in a GIS (Geography Information System) environment, mining attributes for each region were further assessed with the aid of the DNPM (National Department for Mineral Production) database. Detection of the mining area was conducted in five main steps. (a) MSI (MultiSpectral Instrument)/Sentinel-2A (S2A) image selection; (b) definition of land-use classes and training samples; (c) supervised classification; (d) vector editing for quality control; and (e) validation with high-resolution RapidEye images (Kappa = 0.70). Mining areas derived from validated S2A classification totals 1084.7 km2 in the regions analyzed. Small-scale mining comprises up to 64% of total mining area detected comprises mostly gold (617.8 km2), followed by tin mining (73.0 km2). The remaining 36% is comprised by industrial mining such as iron (47.8), copper (55.5) and manganese (8.9 km2) in Carajás, bauxite in Trombetas (78.4) and Rio Capim (48.5 km2). Given recent events of mining impacts, the large extension of mining areas detected raises a concern regarding its socio-environmental impacts for the Amazonian ecosystems and for local communities. Full article
Show Figures

Graphical abstract

17 pages, 10324 KiB  
Article
Global Estimation of Biophysical Variables from Google Earth Engine Platform
by Manuel Campos-Taberner, Álvaro Moreno-Martínez, Francisco Javier García-Haro, Gustau Camps-Valls, Nathaniel P. Robinson, Jens Kattge and Steven W. Running
Remote Sens. 2018, 10(8), 1167; https://doi.org/10.3390/rs10081167 - 24 Jul 2018
Cited by 73 | Viewed by 13393
Abstract
This paper proposes a processing chain for the derivation of global Leaf Area Index (LAI), Fraction of Absorbed Photosynthetically Active Radiation (FAPAR), Fraction Vegetation Cover (FVC), and Canopy water content (CWC) maps from 15-years of MODIS data exploiting the capabilities of the Google [...] Read more.
This paper proposes a processing chain for the derivation of global Leaf Area Index (LAI), Fraction of Absorbed Photosynthetically Active Radiation (FAPAR), Fraction Vegetation Cover (FVC), and Canopy water content (CWC) maps from 15-years of MODIS data exploiting the capabilities of the Google Earth Engine (GEE) cloud platform. The retrieval chain is based on a hybrid method inverting the PROSAIL radiative transfer model (RTM) with Random forests (RF) regression. A major feature of this work is the implementation of a retrieval chain exploiting the GEE capabilities using global and climate data records (CDR) of both MODIS surface reflectance and LAI/FAPAR datasets allowing the global estimation of biophysical variables at unprecedented timeliness. We combine a massive global compilation of leaf trait measurements (TRY), which is the baseline for more realistic leaf parametrization for the considered RTM, with large amounts of remote sensing data ingested by GEE. Moreover, the proposed retrieval chain includes the estimation of both FVC and CWC, which are not operationally produced for the MODIS sensor. The derived global estimates are validated over the BELMANIP2.1 sites network by means of an inter-comparison with the MODIS LAI/FAPAR product available in GEE. Overall, the retrieval chain exhibits great consistency with the reference MODIS product (R2 = 0.87, RMSE = 0.54 m2/m2 and ME = 0.03 m2/m2 in the case of LAI, and R2 = 0.92, RMSE = 0.09 and ME = 0.05 in the case of FAPAR). The analysis of the results by land cover type shows the lowest correlations between our retrievals and the MODIS reference estimates (R2 = 0.42 and R2 = 0.41 for LAI and FAPAR, respectively) for evergreen broadleaf forests. These discrepancies could be attributed mainly to different product definitions according to the literature. The provided results proof that GEE is a suitable high performance processing tool for global biophysical variable retrieval for a wide range of applications. Full article
Show Figures

Graphical abstract

18 pages, 30944 KiB  
Article
Multitemporal Cloud Masking in the Google Earth Engine
by Gonzalo Mateo-García, Luis Gómez-Chova, Julia Amorós-López, Jordi Muñoz-Marí and Gustau Camps-Valls
Remote Sens. 2018, 10(7), 1079; https://doi.org/10.3390/rs10071079 - 06 Jul 2018
Cited by 94 | Viewed by 17839
Abstract
The exploitation of Earth observation satellite images acquired by optical instruments requires an automatic and accurate cloud detection. Multitemporal approaches to cloud detection are usually more powerful than their single scene counterparts since the presence of clouds varies greatly from one acquisition to [...] Read more.
The exploitation of Earth observation satellite images acquired by optical instruments requires an automatic and accurate cloud detection. Multitemporal approaches to cloud detection are usually more powerful than their single scene counterparts since the presence of clouds varies greatly from one acquisition to another whereas surface can be assumed stationary in a broad sense. However, two practical limitations usually hamper their operational use: the access to the complete satellite image archive and the required computational power. This work presents a cloud detection and removal methodology implemented in the Google Earth Engine (GEE) cloud computing platform in order to meet these requirements. The proposed methodology is tested for the Landsat-8 mission over a large collection of manually labeled cloud masks from the Biome dataset. The quantitative results show state-of-the-art performance compared with mono-temporal standard approaches, such as FMask and ACCA algorithms, yielding improvements between 4–5% in classification accuracy and 3–10% in commission errors. The algorithm implementation within the Google Earth Engine and the generated cloud masks for all test images are released for interested readers. Full article
Show Figures

Figure 1

14 pages, 1036 KiB  
Article
Mapping Vegetation and Land Use Types in Fanjingshan National Nature Reserve Using Google Earth Engine
by Yu Hsin Tsai, Douglas Stow, Hsiang Ling Chen, Rebecca Lewison, Li An and Lei Shi
Remote Sens. 2018, 10(6), 927; https://doi.org/10.3390/rs10060927 - 12 Jun 2018
Cited by 115 | Viewed by 18289
Abstract
Fanjinshan National Nature Reserve (FNNR) is a biodiversity hotspot in China that is part of a larger, multi-use landscape where farming, grazing, tourism, and other human activities occur. The steep terrain and persistent cloud cover pose challenges to robust vegetation and land use [...] Read more.
Fanjinshan National Nature Reserve (FNNR) is a biodiversity hotspot in China that is part of a larger, multi-use landscape where farming, grazing, tourism, and other human activities occur. The steep terrain and persistent cloud cover pose challenges to robust vegetation and land use mapping. Our objective is to develop satellite image classification techniques that can reliably map forest cover and land use while minimizing the cloud and terrain issues, and provide the basis for long-term monitoring. Multi-seasonal Landsat image composites and elevation ancillary layers effectively minimize the persistent cloud cover and terrain issues. Spectral vegetation index (SVI) products and shade/illumination normalization approaches yield significantly higher mapping accuracies, compared to non-normalized spectral bands. Advanced machine learning image classification routines are implemented through the cloud-based Google Earth Engine platform. Optimal classifier parameters (e.g., number of trees and number of features for random forest classifiers) were achieved by using tuning techniques. Accuracy assessment results indicate consistent and effective overall classification (i.e., above 70% mapping accuracies) can be achieved using multi-temporal SVI composites with simple illumination normalization and elevation ancillary data, despite the fact limited training and reference data are available. This efficient and open-access image analysis workflow provides a reliable methodology to remotely monitor forest cover and land use in FNNR and other mountainous forested, cloud prevalent areas. Full article
Show Figures

Graphical abstract

19 pages, 5886 KiB  
Article
Historical and Operational Monitoring of Surface Sediments in the Lower Mekong Basin Using Landsat and Google Earth Engine Cloud Computing
by Kel N. Markert, Calla M. Schmidt, Robert E. Griffin, Africa I. Flores, Ate Poortinga, David S. Saah, Rebekke E. Muench, Nicholas E. Clinton, Farrukh Chishtie, Kritsana Kityuttachai, Paradis Someth, Eric R. Anderson, Aekkapol Aekakkararungroj and David J. Ganz
Remote Sens. 2018, 10(6), 909; https://doi.org/10.3390/rs10060909 - 08 Jun 2018
Cited by 54 | Viewed by 13698
Abstract
Reservoir construction and land use change are altering sediment transport within river systems at a global scale. Changes in sediment transport can impact river morphology, aquatic ecosystems, and ultimately the growth and retreat of delta environments. The Lower Mekong Basin is crucial to [...] Read more.
Reservoir construction and land use change are altering sediment transport within river systems at a global scale. Changes in sediment transport can impact river morphology, aquatic ecosystems, and ultimately the growth and retreat of delta environments. The Lower Mekong Basin is crucial to five neighboring countries for transportation, energy production, sustainable water supply, and food production. In response, countries have coordinated to develop programs for regional scale water quality monitoring that including surface sediment concentrations (SSSC); however, these programs are based on a limited number of point measurements and due to resource limitations, cannot provide comprehensive insights into sediment transport across all strategic locations within the Lower Mekong Basin. To augment in situ SSSC data from the current monitoring program, we developed an empirical model to estimate SSSC across the Lower Mekong Basin from Landsat observations. Model validation revealed that remotely sensed SSSC estimates captured the spatial and temporal dynamics in a range of aquatic environments (main stem of Mekong river, tributary systems, Mekong Floodplain, and reservoirs) while, on average, slightly underestimating SSSC by about 2 mg·L1 across all settings. The operational SSSC model was developed and implemented using Google Earth Engine and Google App Engine was used to host an online application that allows users, without any knowledge of remote sensing, to access SSSC data across the region. Expanded access to SSSC data should be particularly helpful for resource managers and other stakeholders seeking to understand the dynamics between surface sediment concentrations and land use conversions, water policy, and energy production in a globally strategic region. Full article
Show Figures

Graphical abstract

15 pages, 1498 KiB  
Technical Note
Mean Composite Fire Severity Metrics Computed with Google Earth Engine Offer Improved Accuracy and Expanded Mapping Potential
by Sean A. Parks, Lisa M. Holsinger, Morgan A. Voss, Rachel A. Loehman and Nathaniel P. Robinson
Remote Sens. 2018, 10(6), 879; https://doi.org/10.3390/rs10060879 - 05 Jun 2018
Cited by 103 | Viewed by 15924 | Correction
Abstract
Landsat-based fire severity datasets are an invaluable resource for monitoring and research purposes. These gridded fire severity datasets are generally produced with pre- and post-fire imagery to estimate the degree of fire-induced ecological change. Here, we introduce methods to produce three Landsat-based fire [...] Read more.
Landsat-based fire severity datasets are an invaluable resource for monitoring and research purposes. These gridded fire severity datasets are generally produced with pre- and post-fire imagery to estimate the degree of fire-induced ecological change. Here, we introduce methods to produce three Landsat-based fire severity metrics using the Google Earth Engine (GEE) platform: The delta normalized burn ratio (dNBR), the relativized delta normalized burn ratio (RdNBR), and the relativized burn ratio (RBR). Our methods do not rely on time-consuming a priori scene selection but instead use a mean compositing approach in which all valid pixels (e.g., cloud-free) over a pre-specified date range (pre- and post-fire) are stacked and the mean value for each pixel over each stack is used to produce the resulting fire severity datasets. This approach demonstrates that fire severity datasets can be produced with relative ease and speed compared to the standard approach in which one pre-fire and one post-fire scene are judiciously identified and used to produce fire severity datasets. We also validate the GEE-derived fire severity metrics using field-based fire severity plots for 18 fires in the western United States. These validations are compared to Landsat-based fire severity datasets produced using only one pre- and post-fire scene, which has been the standard approach in producing such datasets since their inception. Results indicate that the GEE-derived fire severity datasets generally show improved validation statistics compared to parallel versions in which only one pre-fire and one post-fire scene are used, though some of the improvements in some validations are more or less negligible. We provide code and a sample geospatial fire history layer to produce dNBR, RdNBR, and RBR for the 18 fires we evaluated. Although our approach requires that a geospatial fire history layer (i.e., fire perimeters) be produced independently and prior to applying our methods, we suggest that our GEE methodology can reasonably be implemented on hundreds to thousands of fires, thereby increasing opportunities for fire severity monitoring and research across the globe. Full article
Show Figures

Graphical abstract

18 pages, 15796 KiB  
Technical Note
Estimating Satellite-Derived Bathymetry (SDB) with the Google Earth Engine and Sentinel-2
by Dimosthenis Traganos, Dimitris Poursanidis, Bharat Aggarwal, Nektarios Chrysoulakis and Peter Reinartz
Remote Sens. 2018, 10(6), 859; https://doi.org/10.3390/rs10060859 - 01 Jun 2018
Cited by 149 | Viewed by 23717
Abstract
Bathymetry mapping forms the basis of understanding physical, economic, and ecological processes in the vastly biodiverse coastal fringes of our planet which are subjected to constant anthropogenic pressure. Here, we pair recent advances in cloud computing using the geospatial platform of the Google [...] Read more.
Bathymetry mapping forms the basis of understanding physical, economic, and ecological processes in the vastly biodiverse coastal fringes of our planet which are subjected to constant anthropogenic pressure. Here, we pair recent advances in cloud computing using the geospatial platform of the Google Earth Engine (GEE) with optical remote sensing technology using the open Sentinel-2 archive, obtaining low-cost in situ collected data to develop an empirical preprocessing workflow for estimating satellite-derived bathymetry (SDB). The workflow implements widely used and well-established algorithms, including cloud, atmospheric, and sun glint corrections, image composition and radiometric normalisation to address intra- and inter-image interferences before training, and validation of four SDB algorithms in three sites of the Aegean Sea in the Eastern Mediterranean. Best accuracy values for training and validation were R2 = 0.79, RMSE = 1.39 m, and R2 = 0.9, RMSE = 1.67 m, respectively. The increased accuracy highlights the importance of the radiometric normalisation given spatially independent calibration and validation datasets. Spatial error maps reveal over-prediction over low-reflectance and very shallow seabeds, and under-prediction over high-reflectance (<6 m) and optically deep bottoms (>17 m). We provide access to the developed code, allowing users to map bathymetry by customising the time range based on the field data acquisition dates and the optical conditions of their study area. Full article
Show Figures

Figure 1

13 pages, 2812 KiB  
Article
An Operational Before-After-Control-Impact (BACI) Designed Platform for Vegetation Monitoring at Planetary Scale
by Ate Poortinga, Nicholas Clinton, David Saah, Peter Cutter, Farrukh Chishtie, Kel N. Markert, Eric R. Anderson, Austin Troy, Mark Fenn, Lan Huong Tran, Brian Bean, Quyen Nguyen, Biplov Bhandari, Gary Johnson and Peeranan Towashiraporn
Remote Sens. 2018, 10(5), 760; https://doi.org/10.3390/rs10050760 - 15 May 2018
Cited by 36 | Viewed by 10052
Abstract
In this study, we develop a vegetation monitoring framework which is applicable at a planetary scale, and is based on the BACI (Before-After, Control-Impact) design. This approach utilizes Google Earth Engine, a state-of-the-art cloud computing platform. A web-based application for users named EcoDash [...] Read more.
In this study, we develop a vegetation monitoring framework which is applicable at a planetary scale, and is based on the BACI (Before-After, Control-Impact) design. This approach utilizes Google Earth Engine, a state-of-the-art cloud computing platform. A web-based application for users named EcoDash was developed. EcoDash maps vegetation using Enhanced Vegetation Index (EVI) from Moderate Resolution Imaging Spectroradiometer (MODIS) products (the MOD13A1 and MYD13A1 collections) from both Terra and Aqua sensors from the years 2000 and 2002, respectively. to detect change in vegetation, we define an EVI baseline period, and then draw results at a planetary scale using the web-based application by measuring improvement or degradation in vegetation based on the user-defined baseline periods. We also used EcoDash to measure the impact of deforestation and mitigation efforts by the Vietnam Forests and Deltas (VFD) program for the Nghe An and Thanh Hoa provinces in Vietnam. Using the period before 2012 as a baseline, we found that as of March 2017, 86% of the geographical area within the VFD program shows improvement, compared to only a 24% improvement in forest cover for all of Vietnam. Overall, we show how using satellite imagery for monitoring vegetation in a cloud-computing environment could be a cost-effective and useful tool for land managers and other practitioners Full article
Show Figures

Figure 1

18 pages, 5198 KiB  
Article
A Cloud-Based Multi-Temporal Ensemble Classifier to Map Smallholder Farming Systems
by Rosa Aguilar, Raul Zurita-Milla, Emma Izquierdo-Verdiguier and Rolf A. de By
Remote Sens. 2018, 10(5), 729; https://doi.org/10.3390/rs10050729 - 09 May 2018
Cited by 48 | Viewed by 8435
Abstract
Smallholder farmers cultivate more than 80% of the cropland area available in Africa. The intrinsic characteristics of such farms include complex crop-planting patterns, and small fields that are vaguely delineated. These characteristics pose challenges to mapping crops and fields from space. In this [...] Read more.
Smallholder farmers cultivate more than 80% of the cropland area available in Africa. The intrinsic characteristics of such farms include complex crop-planting patterns, and small fields that are vaguely delineated. These characteristics pose challenges to mapping crops and fields from space. In this study, we evaluate the use of a cloud-based multi-temporal ensemble classifier to map smallholder farming systems in a case study for southern Mali. The ensemble combines a selection of spatial and spectral features derived from multi-spectral Worldview-2 images, field data, and five machine learning classifiers to produce a map of the most prevalent crops in our study area. Different ensemble sizes were evaluated using two combination rules, namely majority voting and weighted majority voting. Both strategies outperform any of the tested single classifiers. The ensemble based on the weighted majority voting strategy obtained the higher overall accuracy (75.9%). This means an accuracy improvement of 4.65% in comparison with the average overall accuracy of the best individual classifier tested in this study. The maximum ensemble accuracy is reached with 75 classifiers in the ensemble. This indicates that the addition of more classifiers does not help to continuously improve classification results. Our results demonstrate the potential of ensemble classifiers to map crops grown by West African smallholders. The use of ensembles demands high computational capability, but the increasing availability of cloud computing solutions allows their efficient implementation and even opens the door to the data processing needs of local organizations. Full article
Show Figures

Graphical abstract

14 pages, 42138 KiB  
Article
Assessing the Spatial and Occupation Dynamics of the Brazilian Pasturelands Based on the Automated Classification of MODIS Images from 2000 to 2016
by Leandro Parente and Laerte Ferreira
Remote Sens. 2018, 10(4), 606; https://doi.org/10.3390/rs10040606 - 14 Apr 2018
Cited by 52 | Viewed by 10395
Abstract
The pasturelands areas of Brazil constitute an important asset for the country, as the main food source for the world’s largest commercial herd, representing the largest stock of open land in the country, occupying ~21% of the national territory. Understanding the spatio-temporal dynamics [...] Read more.
The pasturelands areas of Brazil constitute an important asset for the country, as the main food source for the world’s largest commercial herd, representing the largest stock of open land in the country, occupying ~21% of the national territory. Understanding the spatio-temporal dynamics of these areas is of fundamental importance for the goal of promoting improved territorial governance, emission mitigation and productivity gains. To this effect, this study mapped, through objective criteria and automatic classification methods (Random Forest) applied to MODIS (Moderate Resolution Imaging Spectroradiometer) images, the totality of the Brazilian pastures between 2000 and 2016. Based on 90 spectro-temporal metrics derived from the Red, NIR and SWIR1 bands and distinct vegetation indices, distributed between dry and wet seasons, a total of 17 pasture maps with an approximate overall accuracy of 80% were produced with cloud-computing (Google Earth Engine). During this period, the pasture area varied from ~152 (2000) to ~179 (2016) million hectares. This expansion pattern was consistent with the bovine herd variation and mostly occurred in the Amazon, which increased its total pasture area by ~15 million hectares between 2000 and 2005, while the Cerrado, Caatinga and Pantanal biomes showed an increase of ~8 million hectares in this same period. The Atlantic Forest was the only biome in which there was a retraction of pasture areas throughout this series. In general, the results of this study suggest the existence of two relevant moments for the Brazilian pasture land uses. The first, strongly supported by the opening of new grazing areas, prevailed between 2000 and 2005 and mostly occurred in the Deforestation Arc and in the Matopiba regions. From 2006 on, the total pasture area in Brazil showed a trend towards stabilization, indicating a slight intensification of livestock activity in recent years. Full article
Show Figures

Graphical abstract

21 pages, 11006 KiB  
Article
Regional Crop Gross Primary Productivity and Yield Estimation Using Fused Landsat-MODIS Data
by Mingzhu He, John S. Kimball, Marco P. Maneta, Bruce D. Maxwell, Alvaro Moreno, Santiago Beguería and Xiaocui Wu
Remote Sens. 2018, 10(3), 372; https://doi.org/10.3390/rs10030372 - 28 Feb 2018
Cited by 96 | Viewed by 14707
Abstract
Accurate crop yield assessments using satellite remote sensing-based methods are of interest for regional monitoring and the design of policies that promote agricultural resiliency and food security. However, the application of current vegetation productivity algorithms derived from global satellite observations is generally too [...] Read more.
Accurate crop yield assessments using satellite remote sensing-based methods are of interest for regional monitoring and the design of policies that promote agricultural resiliency and food security. However, the application of current vegetation productivity algorithms derived from global satellite observations is generally too coarse to capture cropland heterogeneity. The fusion of data from different sensors can provide enhanced information and overcome many of the limitations of individual sensors. In thitables study, we estimate annual crop yields for seven important crop types across Montana in the continental USA from 2008–2015, including alfalfa, barley, maize, peas, durum wheat, spring wheat and winter wheat. We used a satellite data-driven light use efficiency (LUE) model to estimate gross primary productivity (GPP) over croplands at 30-m spatial resolution and eight-day time steps using a fused NDVI dataset constructed by blending Landsat (5 or 7) and Terra MODIS reflectance data. The fused 30-m NDVI record showed good consistency with the original Landsat and MODIS data, but provides better spatiotemporal delineations of cropland vegetation growth. Crop yields were estimated at 30-m resolution as the product of estimated GPP accumulated over the growing season and a crop-specific harvest index (HIGPP). The resulting GPP estimates capture characteristic cropland productivity patterns and seasonal variations, while the estimated annual crop production results correspond favorably with reported county-level crop production data (r = 0.96, relative RMSE = 37.0%, p < 0.05) from the U.S. Department of Agriculture (USDA). The performance of estimated crop yields at a finer (field) scale was generally lower, but still meaningful (r = 0.42, relative RMSE = 50.8%, p < 0.05). Our methods and results are suitable for operational applications of crop yield monitoring at regional scales, suggesting the potential of using global satellite observations to improve agricultural management, policy decisions and regional/global food security. Full article
Show Figures

Graphical abstract

2017

Jump to: 2022, 2021, 2020, 2019, 2018

3930 KiB  
Article
High Spatial Resolution Visual Band Imagery Outperforms Medium Resolution Spectral Imagery for Ecosystem Assessment in the Semi-Arid Brazilian Sertão
by Ran Goldblatt, Alexis Rivera Ballesteros and Jennifer Burney
Remote Sens. 2017, 9(12), 1336; https://doi.org/10.3390/rs9121336 - 20 Dec 2017
Cited by 21 | Viewed by 10007
Abstract
Semi-arid ecosystems play a key role in global agricultural production, seasonal carbon cycle dynamics, and longer-run climate change. Because semi-arid landscapes are heterogeneous and often sparsely vegetated, repeated and large-scale ecosystem assessments of these regions have to date been impossible. Here, we assess [...] Read more.
Semi-arid ecosystems play a key role in global agricultural production, seasonal carbon cycle dynamics, and longer-run climate change. Because semi-arid landscapes are heterogeneous and often sparsely vegetated, repeated and large-scale ecosystem assessments of these regions have to date been impossible. Here, we assess the potential of high-spatial resolution visible band imagery for semi-arid ecosystem mapping. We use WorldView satellite imagery at 0.3–0.5 m resolution to develop a reference data set of nearly 10,000 labeled examples of three classes—trees, shrubs/grasses, and bare land—across 1000 km 2 of the semi-arid Sertão region of northeast Brazil. Using Google Earth Engine, we show that classification with low-spectral but high-spatial resolution input (WorldView) outperforms classification with the full spectral information available from Landsat 30 m resolution imagery as input. Classification with high spatial resolution input improves detection of sparse vegetation and distinction between trees and seasonal shrubs and grasses, two features which are lost at coarser spatial (but higher spectral) resolution input. Our total tree cover estimates for the study area disagree with recent estimates using other methods that may underestimate treecover because they confuse trees with seasonal vegetation (shrubs and grasses). This distinction is important for monitoring seasonal and long-run carbon cycle and ecosystem health. Our results suggest that newer remote sensing products that promise high frequency global coverage at high spatial but lower spectral resolution may offer new possibilities for direct monitoring of the world’s semi-arid ecosystems, and we provide methods that could be scaled to do so. Full article
Show Figures

Graphical abstract

13160 KiB  
Article
Nominal 30-m Cropland Extent Map of Continental Africa by Integrating Pixel-Based and Object-Based Algorithms Using Sentinel-2 and Landsat-8 Data on Google Earth Engine
by Jun Xiong, Prasad S. Thenkabail, James C. Tilton, Murali K. Gumma, Pardhasaradhi Teluguntla, Adam Oliphant, Russell G. Congalton, Kamini Yadav and Noel Gorelick
Remote Sens. 2017, 9(10), 1065; https://doi.org/10.3390/rs9101065 - 19 Oct 2017
Cited by 273 | Viewed by 28390
Abstract
A satellite-derived cropland extent map at high spatial resolution (30-m or better) is a must for food and water security analysis. Precise and accurate global cropland extent maps, indicating cropland and non-cropland areas, are starting points to develop higher-level products such as crop [...] Read more.
A satellite-derived cropland extent map at high spatial resolution (30-m or better) is a must for food and water security analysis. Precise and accurate global cropland extent maps, indicating cropland and non-cropland areas, are starting points to develop higher-level products such as crop watering methods (irrigated or rainfed), cropping intensities (e.g., single, double, or continuous cropping), crop types, cropland fallows, as well as for assessment of cropland productivity (productivity per unit of land), and crop water productivity (productivity per unit of water). Uncertainties associated with the cropland extent map have cascading effects on all higher-level cropland products. However, precise and accurate cropland extent maps at high spatial resolution over large areas (e.g., continents or the globe) are challenging to produce due to the small-holder dominant agricultural systems like those found in most of Africa and Asia. Cloud-based geospatial computing platforms and multi-date, multi-sensor satellite image inventories on Google Earth Engine offer opportunities for mapping croplands with precision and accuracy over large areas that satisfy the requirements of broad range of applications. Such maps are expected to provide highly significant improvements compared to existing products, which tend to be coarser in resolution, and often fail to capture fragmented small-holder farms especially in regions with high dynamic change within and across years. To overcome these limitations, in this research we present an approach for cropland extent mapping at high spatial resolution (30-m or better) using the 10-day, 10 to 20-m, Sentinel-2 data in combination with 16-day, 30-m, Landsat-8 data on Google Earth Engine (GEE). First, nominal 30-m resolution satellite imagery composites were created from 36,924 scenes of Sentinel-2 and Landsat-8 images for the entire African continent in 2015–2016. These composites were generated using a median-mosaic of five bands (blue, green, red, near-infrared, NDVI) during each of the two periods (period 1: January–June 2016 and period 2: July–December 2015) plus a 30-m slope layer derived from the Shuttle Radar Topographic Mission (SRTM) elevation dataset. Second, we selected Cropland/Non-cropland training samples (sample size = 9791) from various sources in GEE to create pixel-based classifications. As supervised classification algorithm, Random Forest (RF) was used as the primary classifier because of its efficiency, and when over-fitting issues of RF happened due to the noise of input training data, Support Vector Machine (SVM) was applied to compensate for such defects in specific areas. Third, the Recursive Hierarchical Segmentation (RHSeg) algorithm was employed to generate an object-oriented segmentation layer based on spectral and spatial properties from the same input data. This layer was merged with the pixel-based classification to improve segmentation accuracy. Accuracies of the merged 30-m crop extent product were computed using an error matrix approach in which 1754 independent validation samples were used. In addition, a comparison was performed with other available cropland maps as well as with LULC maps to show spatial similarity. Finally, the cropland area results derived from the map were compared with UN FAO statistics. The independent accuracy assessment showed a weighted overall accuracy of 94%, with a producer’s accuracy of 85.9% (or omission error of 14.1%), and user’s accuracy of 68.5% (commission error of 31.5%) for the cropland class. The total net cropland area (TNCA) of Africa was estimated as 313 Mha for the nominal year 2015. The online product, referred to as the Global Food Security-support Analysis Data @ 30-m for the African Continent, Cropland Extent product (GFSAD30AFCE) is distributed through the NASA’s Land Processes Distributed Active Archive Center (LP DAAC) as (available for download by 10 November 2017 or earlier): https://doi.org/10.5067/MEaSUREs/GFSAD/GFSAD30AFCE.001 and can be viewed at https://croplands.org/app/map. Causes of uncertainty and limitations within the crop extent product are discussed in detail. Full article
Show Figures

Graphical abstract

19550 KiB  
Technical Note
A Dynamic Landsat Derived Normalized Difference Vegetation Index (NDVI) Product for the Conterminous United States
by Nathaniel P. Robinson, Brady W. Allred, Matthew O. Jones, Alvaro Moreno, John S. Kimball, David E. Naugle, Tyler A. Erickson and Andrew D. Richardson
Remote Sens. 2017, 9(8), 863; https://doi.org/10.3390/rs9080863 - 21 Aug 2017
Cited by 174 | Viewed by 24933
Abstract
Satellite derived vegetation indices (VIs) are broadly used in ecological research, ecosystem modeling, and land surface monitoring. The Normalized Difference Vegetation Index (NDVI), perhaps the most utilized VI, has countless applications across ecology, forestry, agriculture, wildlife, biodiversity, and other disciplines. Calculating satellite derived [...] Read more.
Satellite derived vegetation indices (VIs) are broadly used in ecological research, ecosystem modeling, and land surface monitoring. The Normalized Difference Vegetation Index (NDVI), perhaps the most utilized VI, has countless applications across ecology, forestry, agriculture, wildlife, biodiversity, and other disciplines. Calculating satellite derived NDVI is not always straight-forward, however, as satellite remote sensing datasets are inherently noisy due to cloud and atmospheric contamination, data processing failures, and instrument malfunction. Readily available NDVI products that account for these complexities are generally at coarse resolution; high resolution NDVI datasets are not conveniently accessible and developing them often presents numerous technical and methodological challenges. We address this deficiency by producing a Landsat derived, high resolution (30 m), long-term (30+ years) NDVI dataset for the conterminous United States. We use Google Earth Engine, a planetary-scale cloud-based geospatial analysis platform, for processing the Landsat data and distributing the final dataset. We use a climatology driven approach to fill missing data and validate the dataset with established remote sensing products at multiple scales. We provide access to the composites through a simple web application, allowing users to customize key parameters appropriate for their application, question, and region of interest. Full article
Show Figures

Graphical abstract

Back to TopTop