Article

Cross-Pol Transponder with Frequency Shifter for Bistatic Ground-Based Synthetic Aperture Radar

by
Massimiliano Pieraccini
* and
Lapo Miccinesi
Department of Information Engineering, University of Florence, via Santa Marta, 3, 50139 Firenze, Italy
*
Author to whom correspondence should be addressed.
Remote Sens. 2018, 10(9), 1364; https://doi.org/10.3390/rs10091364
Submission received: 28 June 2018 / Revised: 9 August 2018 / Accepted: 25 August 2018 / Published: 28 August 2018

Abstract

:
Ground-based synthetic aperture radar (GBSAR) systems are popular remote sensing instruments for detecting the ground changes of landslides, glaciers, and open pits as well as for detecting small displacements of large structures, such as bridges and dams. Recently (2017), a novel mono/bistatic GBSAR configuration was proposed to acquire two different components of displacement of the targets in the field of view. This bistatic configuration relies on a transponder that consists—in its basic implementation—of just two antennas and an amplifier. The aim of this article was to design and experimentally test an improved transponder with cross-polarized antennas and frequency shifter that is able to prevent possible oscillations even at very high gain, as required in long-range applications. The transponder was successfully field-tested, and its measured gain was 91 dB gain.

Graphical Abstract

1. Introduction

Ground-based synthetic aperture radar (GBSAR) systems are popular remote sensing instruments for detecting the ground changes of landslides [1], glaciers [2], and open pits [3] as well as for detecting small displacements of large structures, such as bridges [4] and dams [5]. These radars are able to provide displacement maps but have a major limitation: They only detect the displacement component along the range direction. Recently, in a piece published in the IEEE Geoscience and Remote Sensing Letters [6], the authors of this paper proposed a novel mono/bistatic GBSAR configuration for retrieving two components of the displacement vector using a transponder. The transponder proposed in that paper consisted of two co-polarized horn antennas and an amplifier. However, this solution had two possible problems: (1) The gain is limited by the poor isolation between the two co-pol antennas operating at the same frequency. (2) As monostatic and bistatic signals are in the same polarization and in the same frequency, large targets behind the transponder can give monostatic signals mixed to bistatic signals that produce artifacts in the bistatic image [6].
The aim of this article is to propose an enhanced transponder that is able to operate at very high gain without triggering self-oscillations. It has the following features: (1) the transmitting and receiving antennas are cross-polarized, and (2) a frequency shifter decouples the transmitted and received signals of the transponder.

2. Materials and Methods

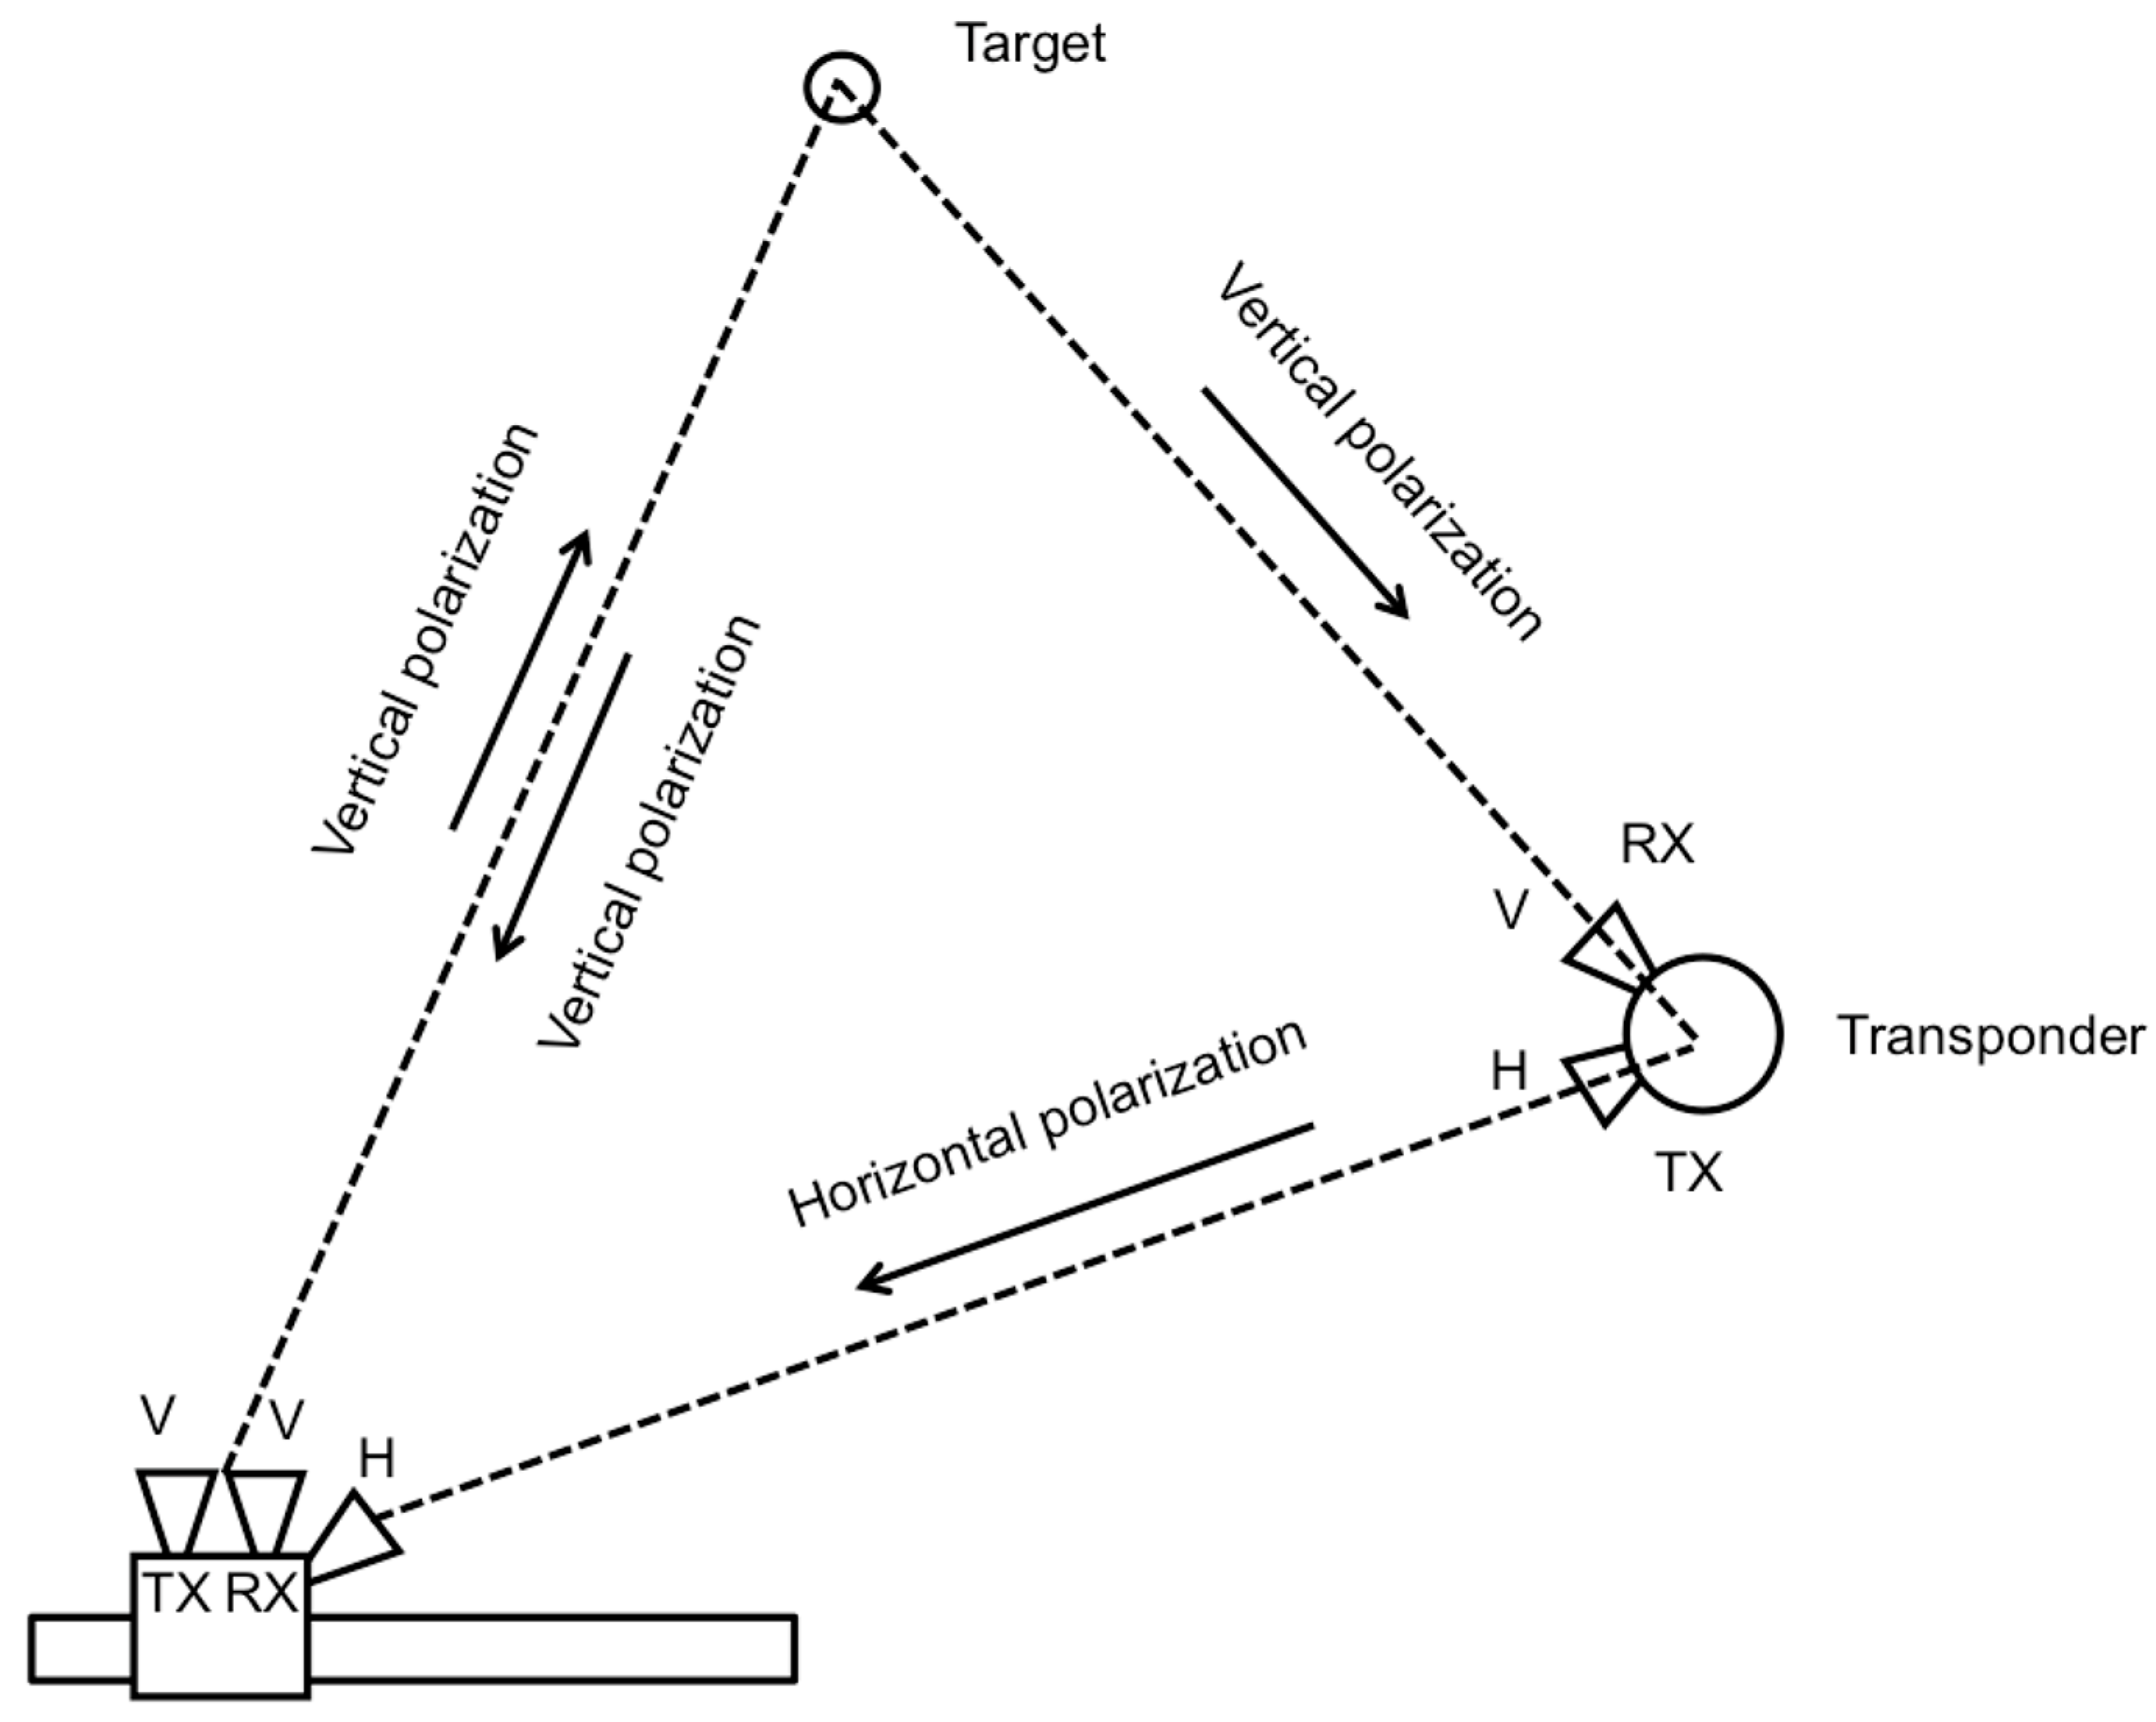
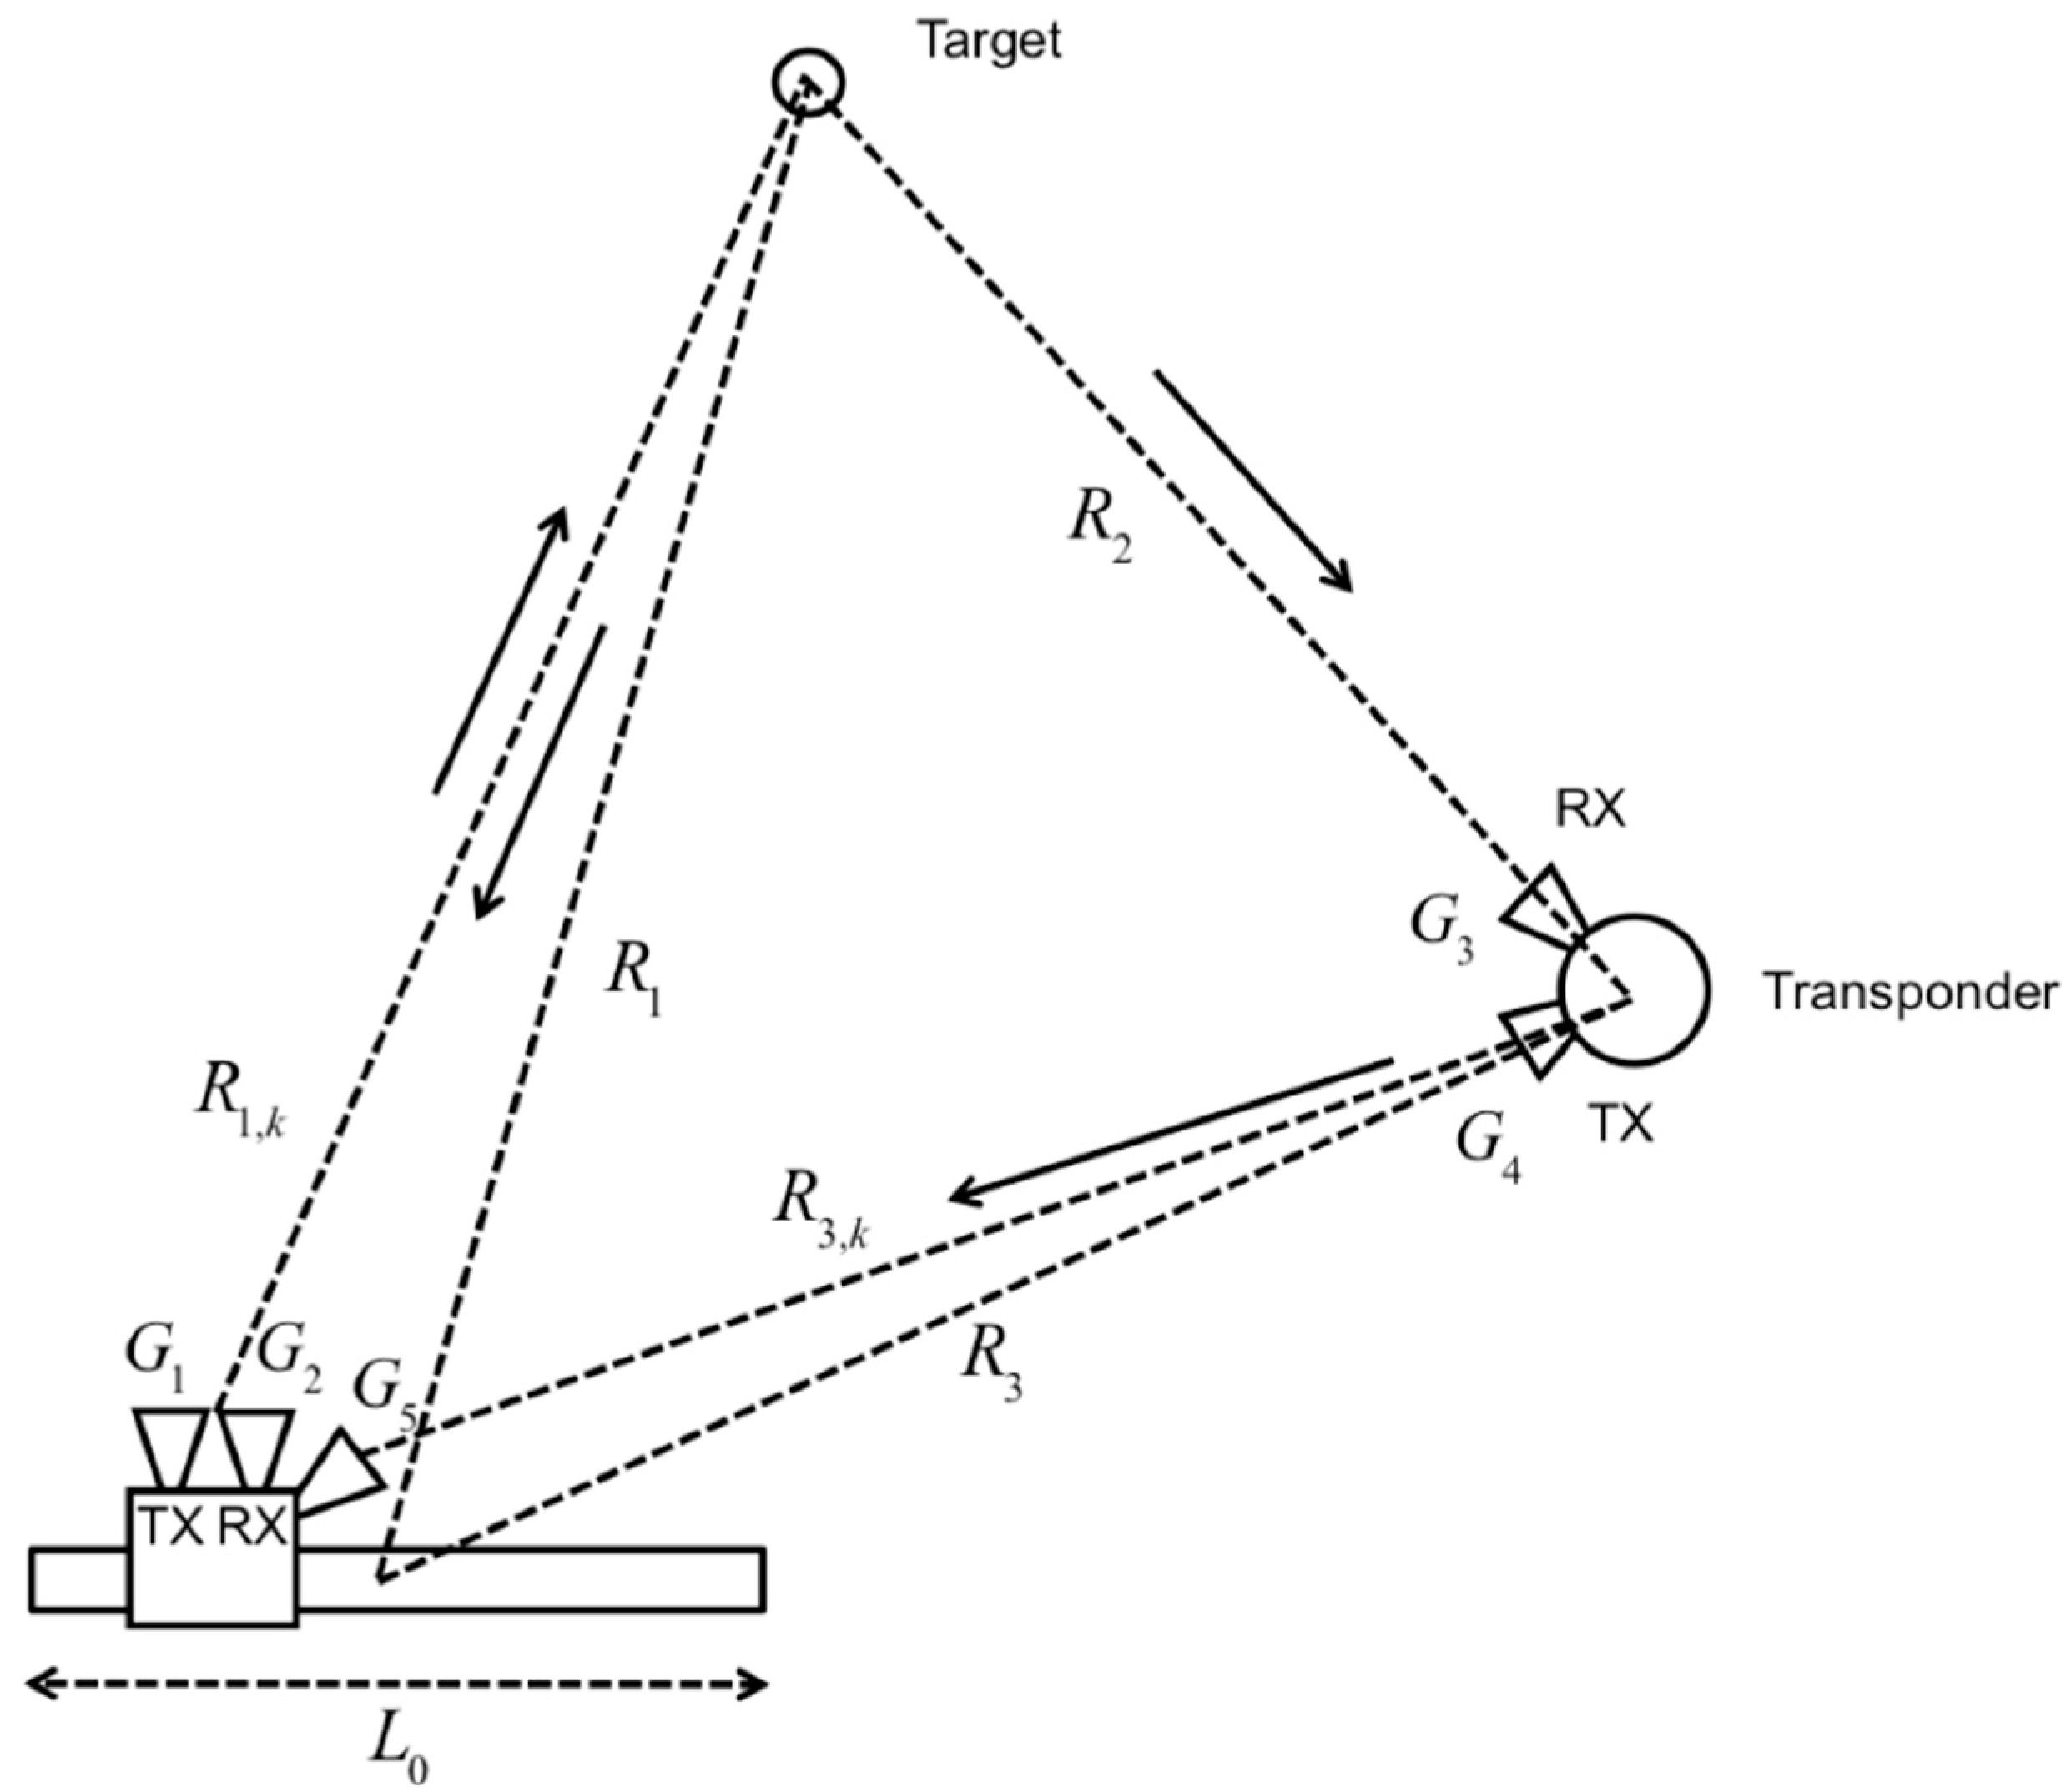
2.1. Working Principle of Monostatic/Bistatic GBSAR

The working principle of a GBSAR that is able to acquire monostatic and bistatic images using a transponder is shown in Figure 1. A linear GBSAR acquires a (monostatic) image of the targets in its own field of view. Using a third antenna, it acquires a second image of the same targets exploiting the bouncing of the signal through a transponder. The simplest transponder consists of a couple of antennas and an amplifier.
By applying the radar equation [7] in monostatic and bistatic configurations, we obtain the following equations, respectively:
P rx ( mono ) = P tx G 1 1 4 π R 1 , k 2 σ ( mono ) 1 4 π R 1 , k 2 G 2 λ 2 4 π
P rx ( bist ) = P tx G 1 1 4 π R 1 , k 2 σ ( bist ) 1 4 π R 2 2 G 3 λ 2 4 π A G 4 1 4 π R 3 , k 2 G 5 λ 2 4 π
where Ptx is the transmitted power; G1, G2, G3, G4, G5 are the gains of the five antennas; R1,k is the distance between the radar head at the k-position along the mechanical guide and the target; R1 is the distance between the center of the mechanical guide and the target; R2 is the distance between the target and the transponder; A is the gain of the amplifier of the transponder; R3,k is the distance between the radar head at the k-position along the mechanical guide and the transponder; R3 is the distance between the center of the mechanical guide and the transponder; σ(mono) is the radar cross section in monostatic configuration; σ(bist) is the radar cross section in bistatic configuration; and λ is the wavelength.
In practical deployments, the following assumptions are reasonable: (1) All the antennas have the same gain, so G1 = G2 = G3 = G4 = G5 = G. (2) The length (L0) of mechanical guide is much smaller than the radar–target and target–transponder, so R1,k = R1 and R3,k = R3. (3) Although R1 and R3 are not equal, they can be reasonably similar, so we assume R1 = R3. (4) We assume σ(mono) = σ(bist). The last assumption is rather hard, but it can be done when the aim of the calculation is just a rough estimate of the received power. With these assumptions, we can write the following:
P rx ( bist ) P rx ( mono ) = A ( G λ 4 π R 3 ) 2
Hence, in order to compensate the loss due to the path transponder–radar, the gain of the transponder should be as follows:
A = ( 4 π R 3 G λ ) 2
This gain value compensates the loss; however, with this value of gain, the noise figure of the transponder is added to the noise figure of the first amplifier of the radar head. In order to improve the noise figure, the gain has to be increased. Indeed, as it is well known, the noise figure of the whole system is equal to the only noise figure of the transponder amplifier (i.e., the first stage of the receiver chain) if the gain of this is much greater than the loss of the path. In practice, a reasonable rule of thumb for the gain of the transponder could be the following:
A 10 ( 4 π R 3 G λ ) 2
For obtaining good displacement measurements in both directions with the bistatic configuration, L should be in the order of magnitude of the distance between radar and target [6].
The operative distance of a GBSAR can reach up to 5 km. However, a value between 50 m and 500 m is reasonable in most applications. Therefore, by considering an antenna gain (G) of 15 dB and a wavelength of 3 cm (10 GHz), we obtain that the transponder gain (A) could range between 66 dB and 86 dB, with L ranging between 50 m and 500 m.

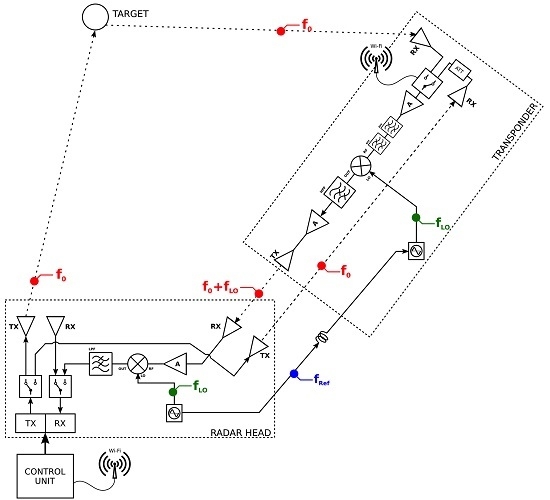
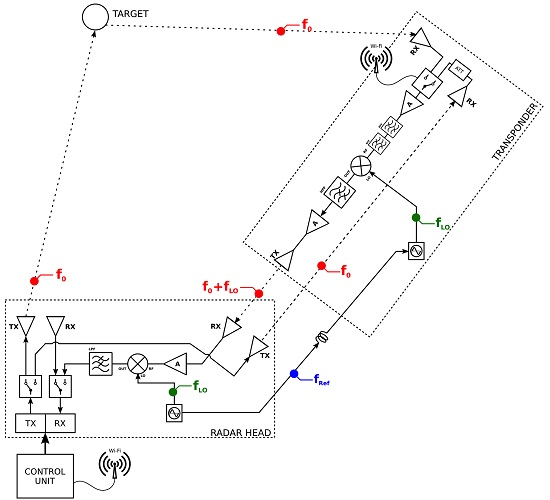
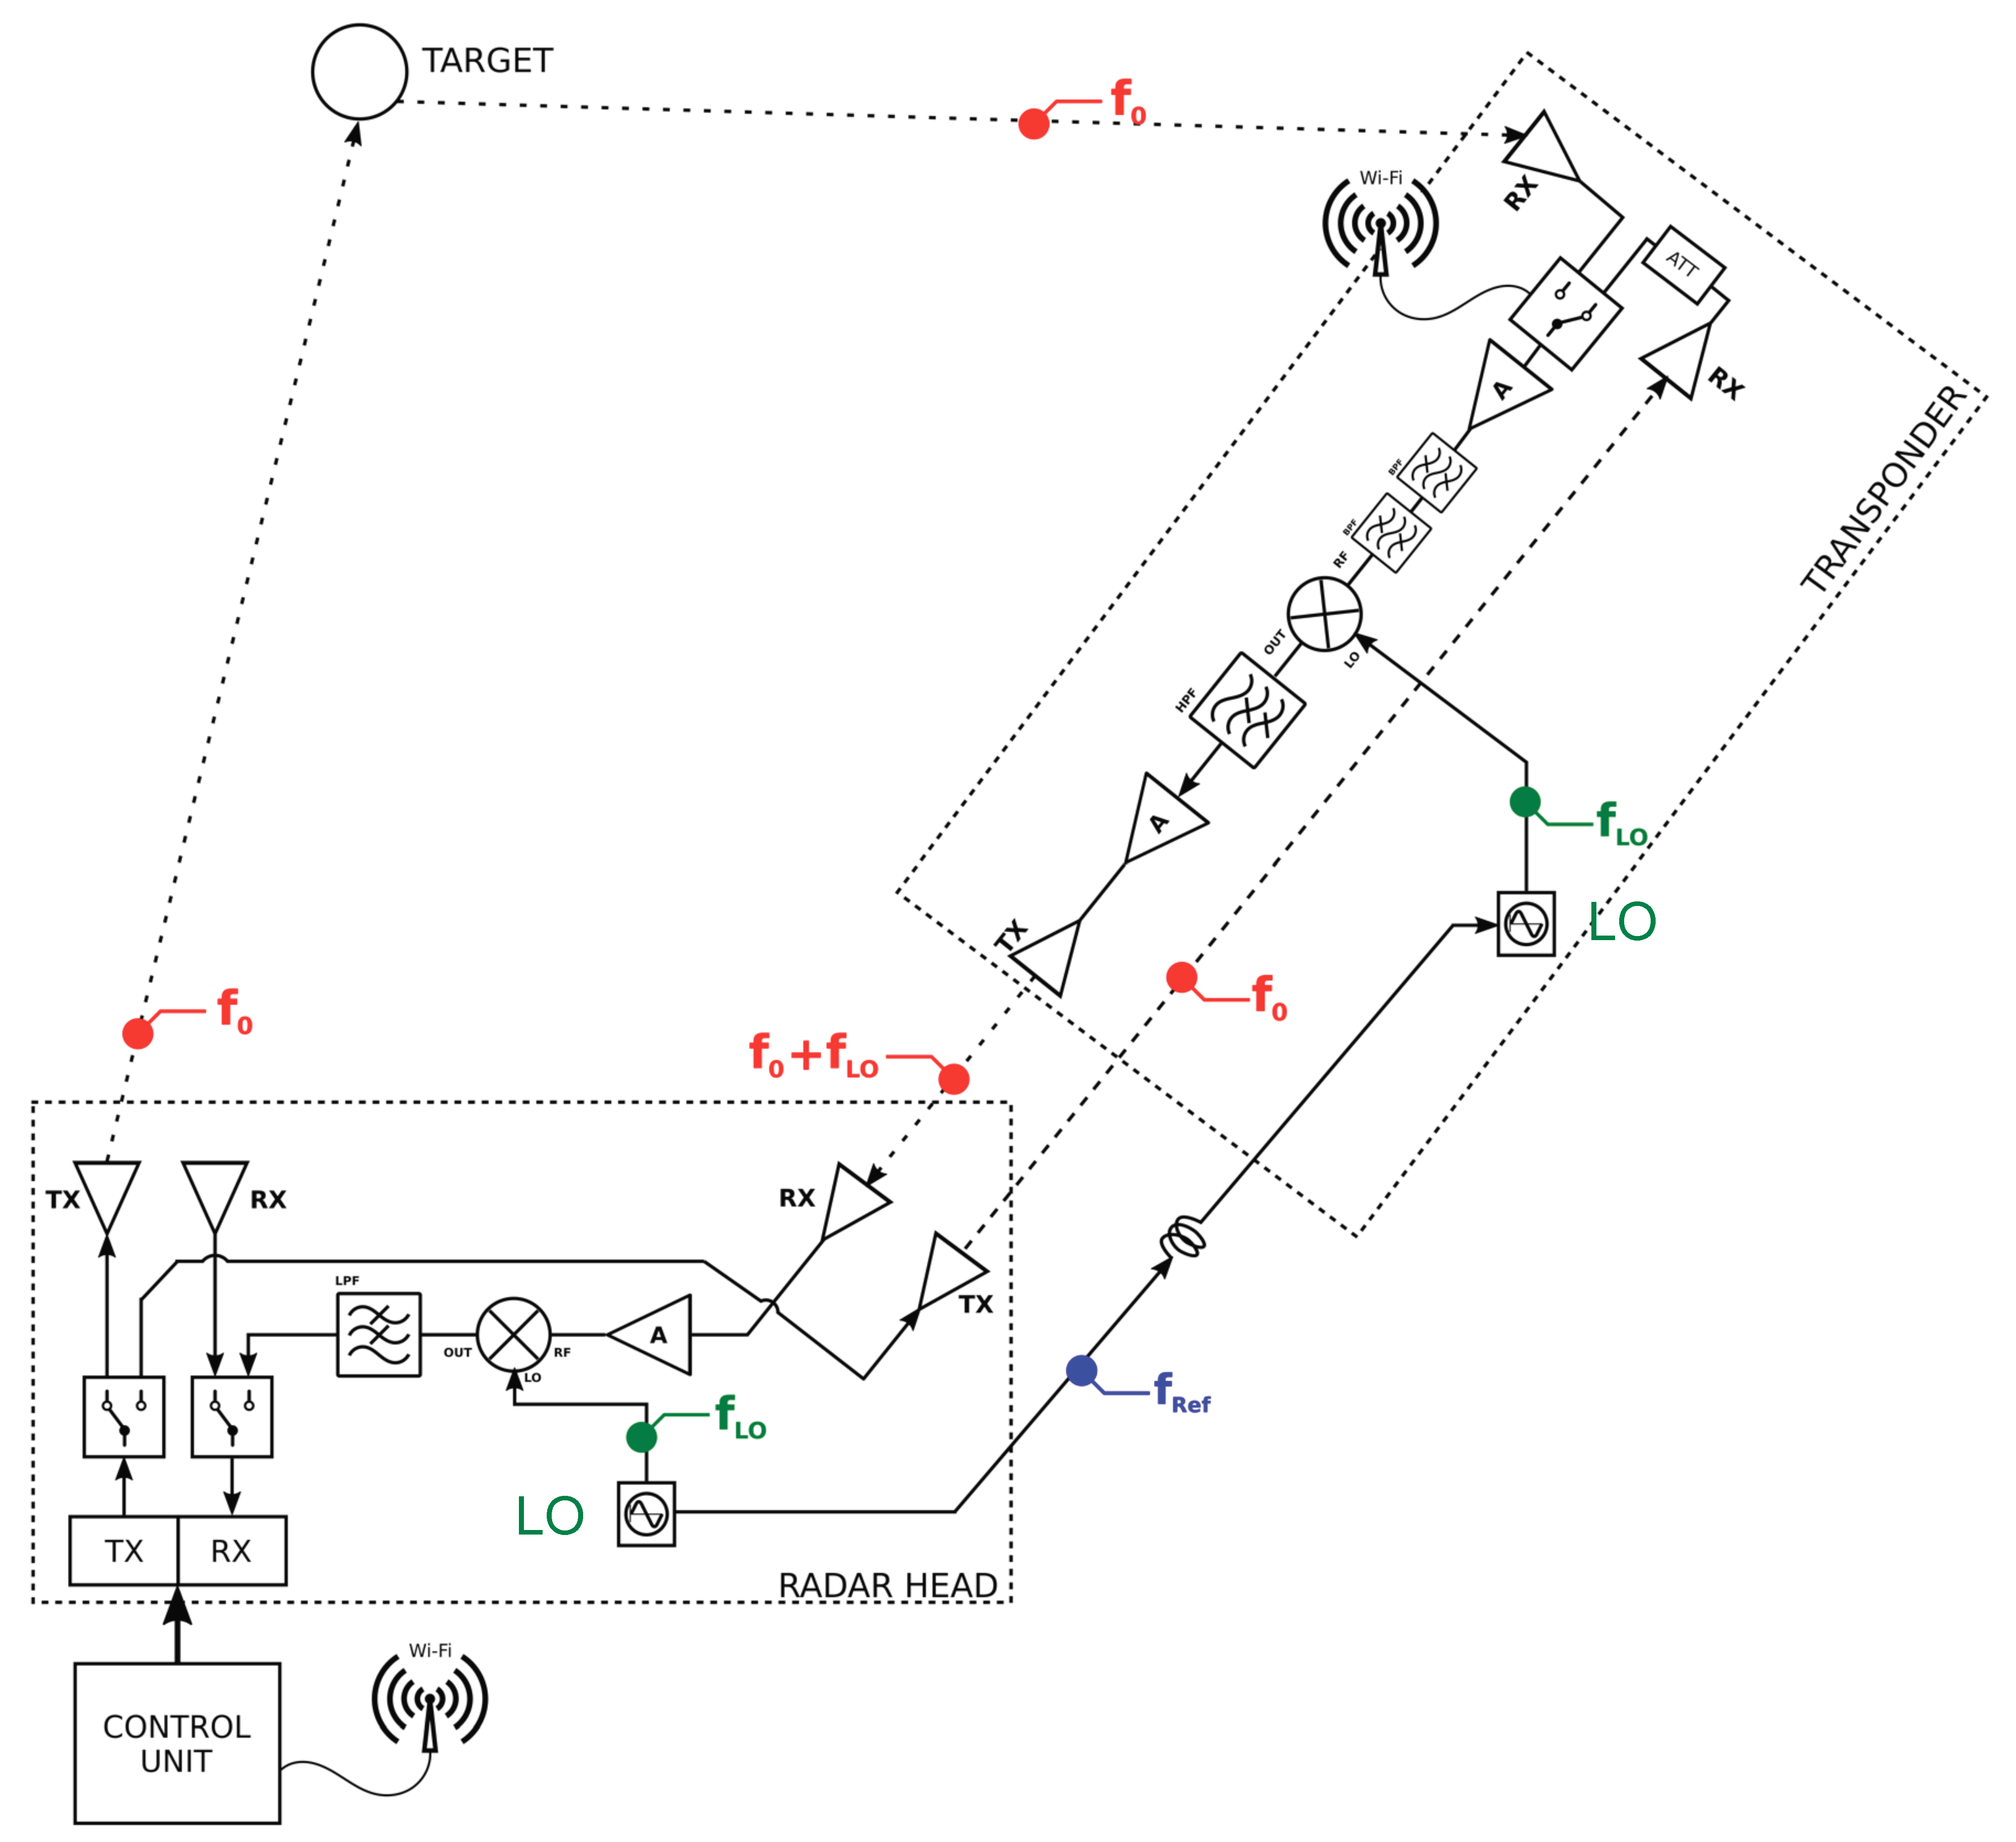
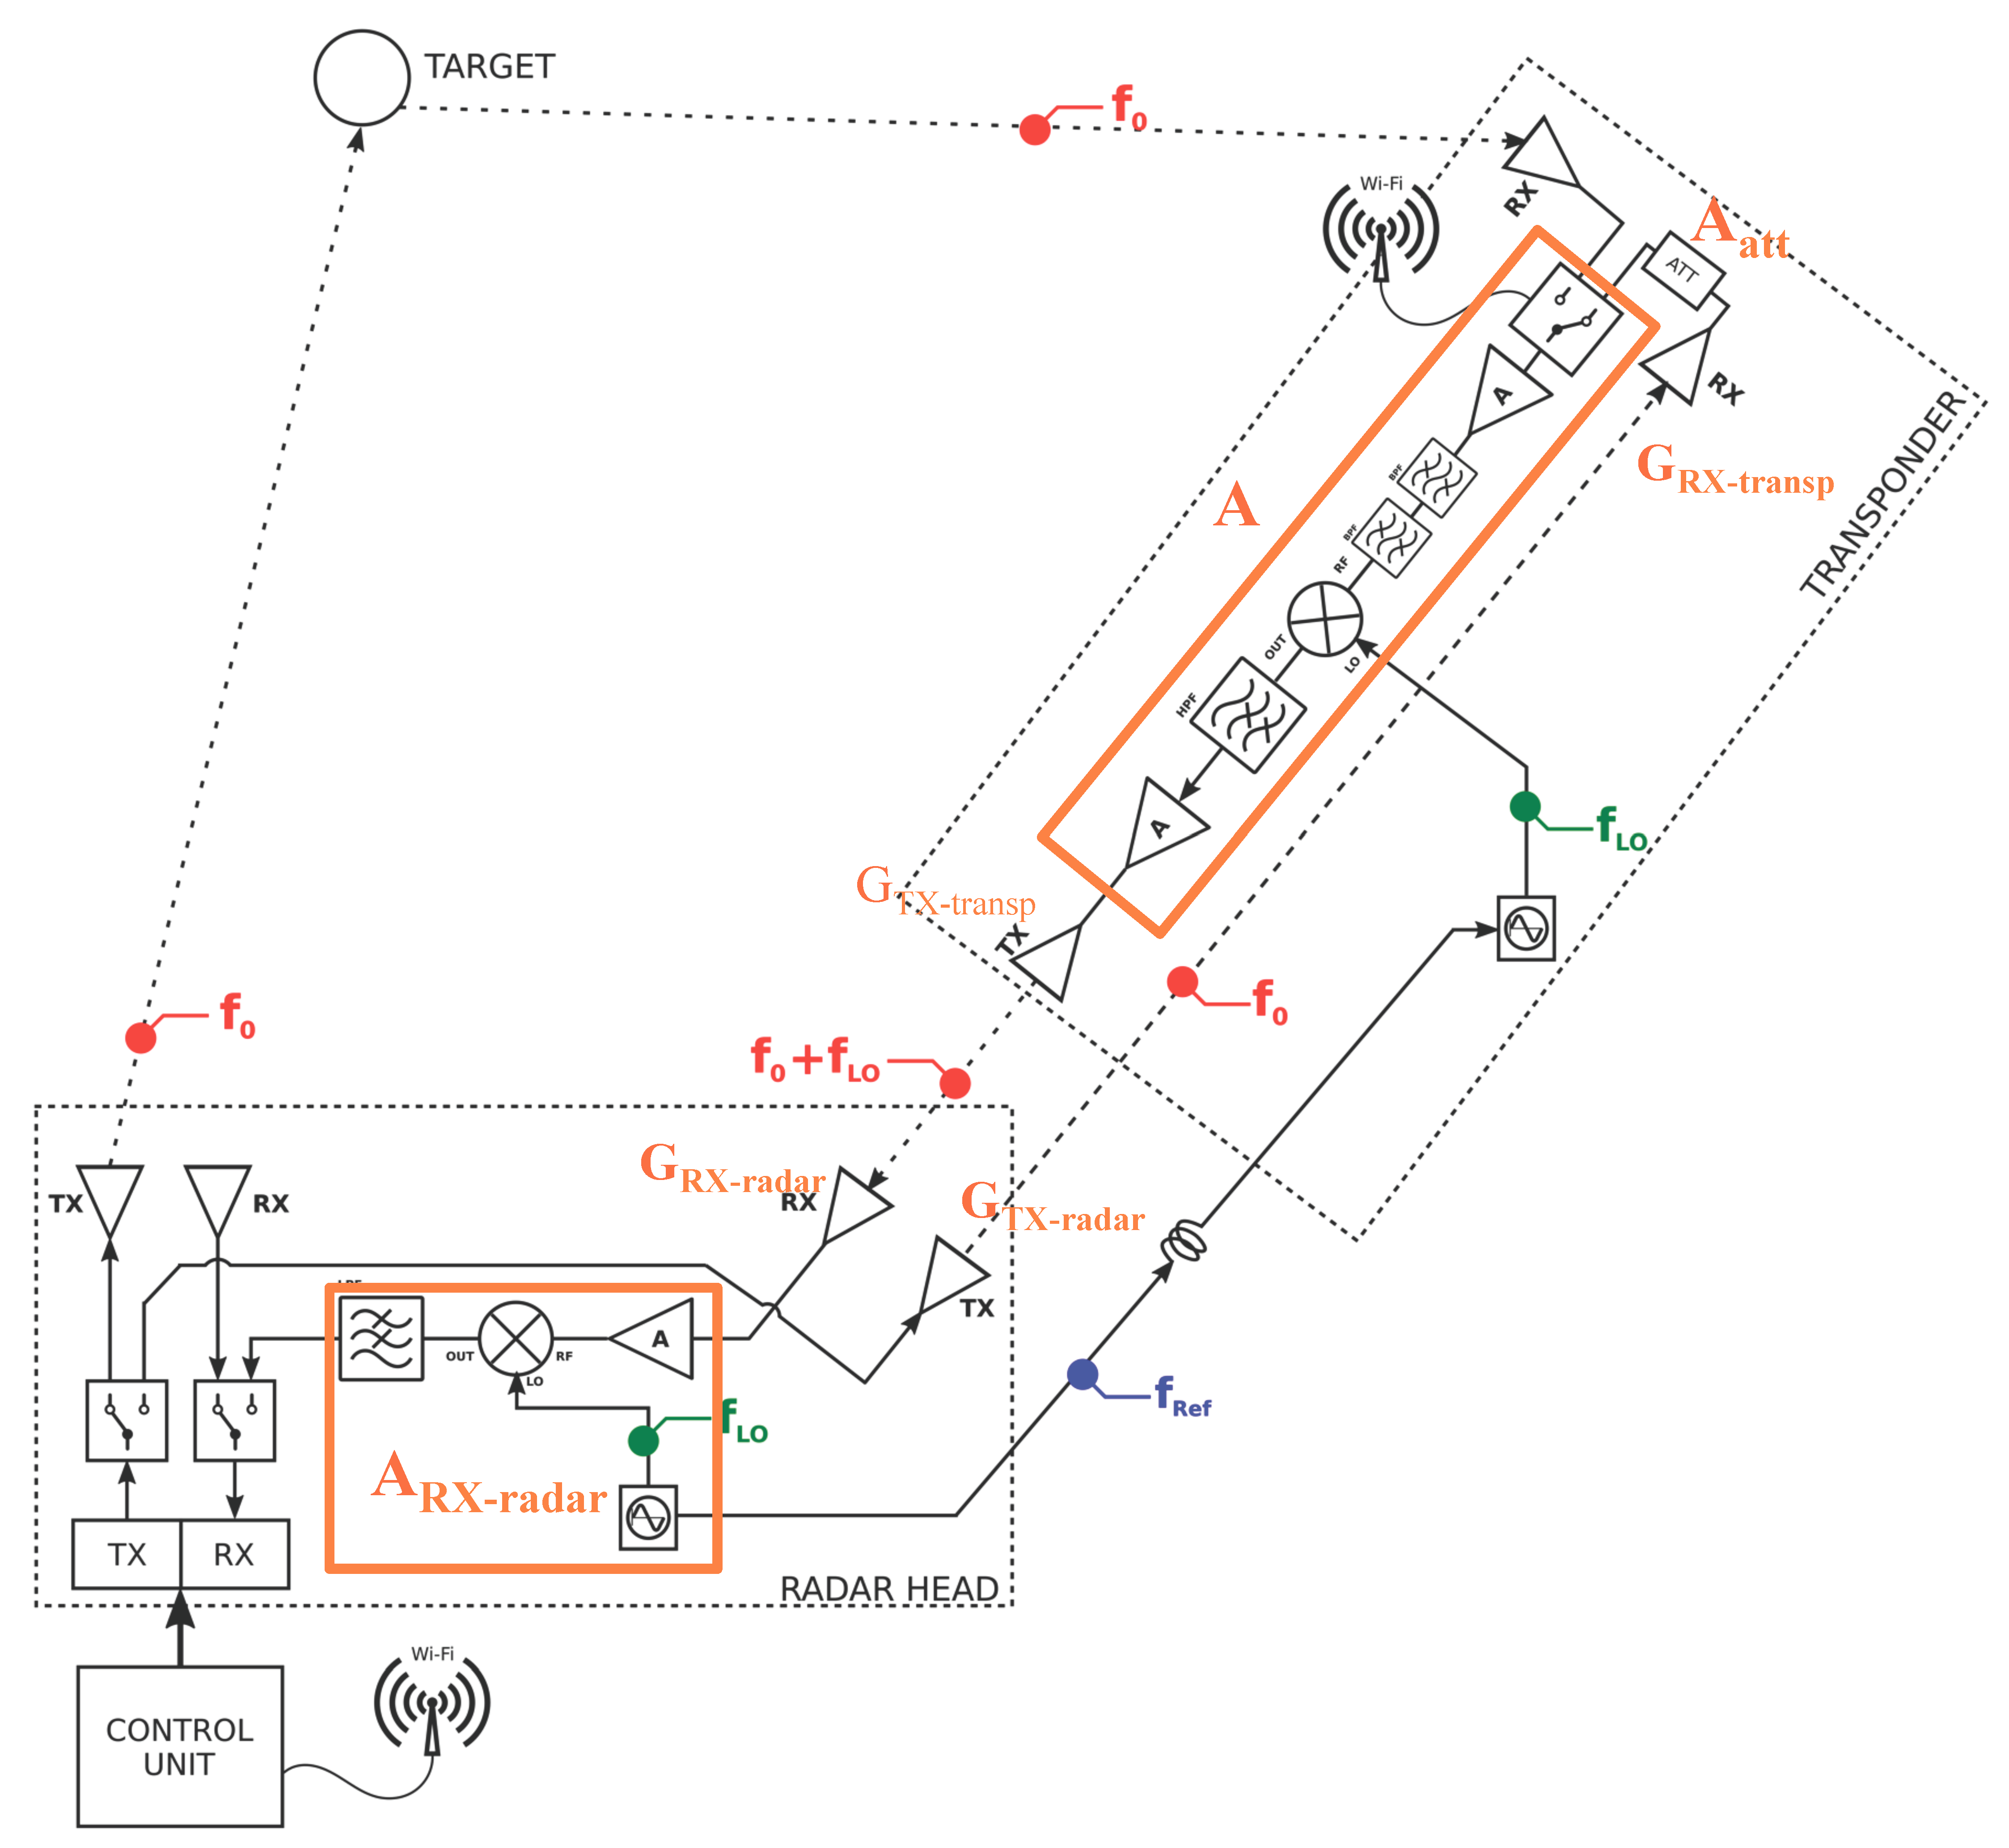
2.2. The Cross-Pol Transponder with Frequency Shifter

As described in Reference [6], the simplest transponder consists of only two antennas and an amplifier. However, a major problem of any transponder is its possible oscillation. In particular, the isolation between the two antennas has to be higher than the gain in order to avoid the oscillation.
A way to increase the isolation between two linearly polarized antennas is to rotate one of them by 90°. For real antennas, the cross-polarization can provide an isolation of 20–30 dB in addition to the co-polarized isolation (see for example Reference [8]). In the specific case of the transponder described above, the cross-polarization of the antenna pointing at the radar does not affect the bistatic operation if the second receiving antenna of the radar head is cross-polarized with respect to the transmitting antenna (see Figure 2). A further advantage of the cross-polarization is that monostatic and bistatic signals have different polarizations, so possible artifacts (described in Reference [6]) due to the mixing of bistatic and monostatic signals are greatly mitigated.
Another effective way to avoid the oscillation of a high gain transponder is to shift the output frequency using a suitable frequency shifter. Figure 3 shows the scheme of a bistatic radar that uses a transponder with frequency shifter. The radar operates at central frequency f0. The transponder has its own local oscillator (LO). A mixer and a high-pass filter operates as upconverter and shift the central frequency, so the frequency of the signal transmitted from the transponder to the radar head is f0 + fLO. In the radar head, a downconverter (a mixer and a low-pass filter) brings the signal back to frequency f0. The two LOs have to be coherent and synchronized, so a reference signal at low frequency fREF is shared with a cable. As the cable could move during the movement of the radar head along its mechanical guide, a calibration path is necessary to compensate possible phase shift of the reference signal. Moreover, the calibration provides long-term phase stability and compensates possible phase changes that can occur when the equipment is switched off and on again. Therefore, the radar head has a second transmit channel (selected by a Radio Frequency switch) that provides a calibration signal directly transmitted to the transponder. The transponder has two receiving antennas (one pointed at the target and the other one pointed at the radar). A RF switch, controlled by a Wi-Fi device, selects between the two antennas (measurement and calibration).

3. Results

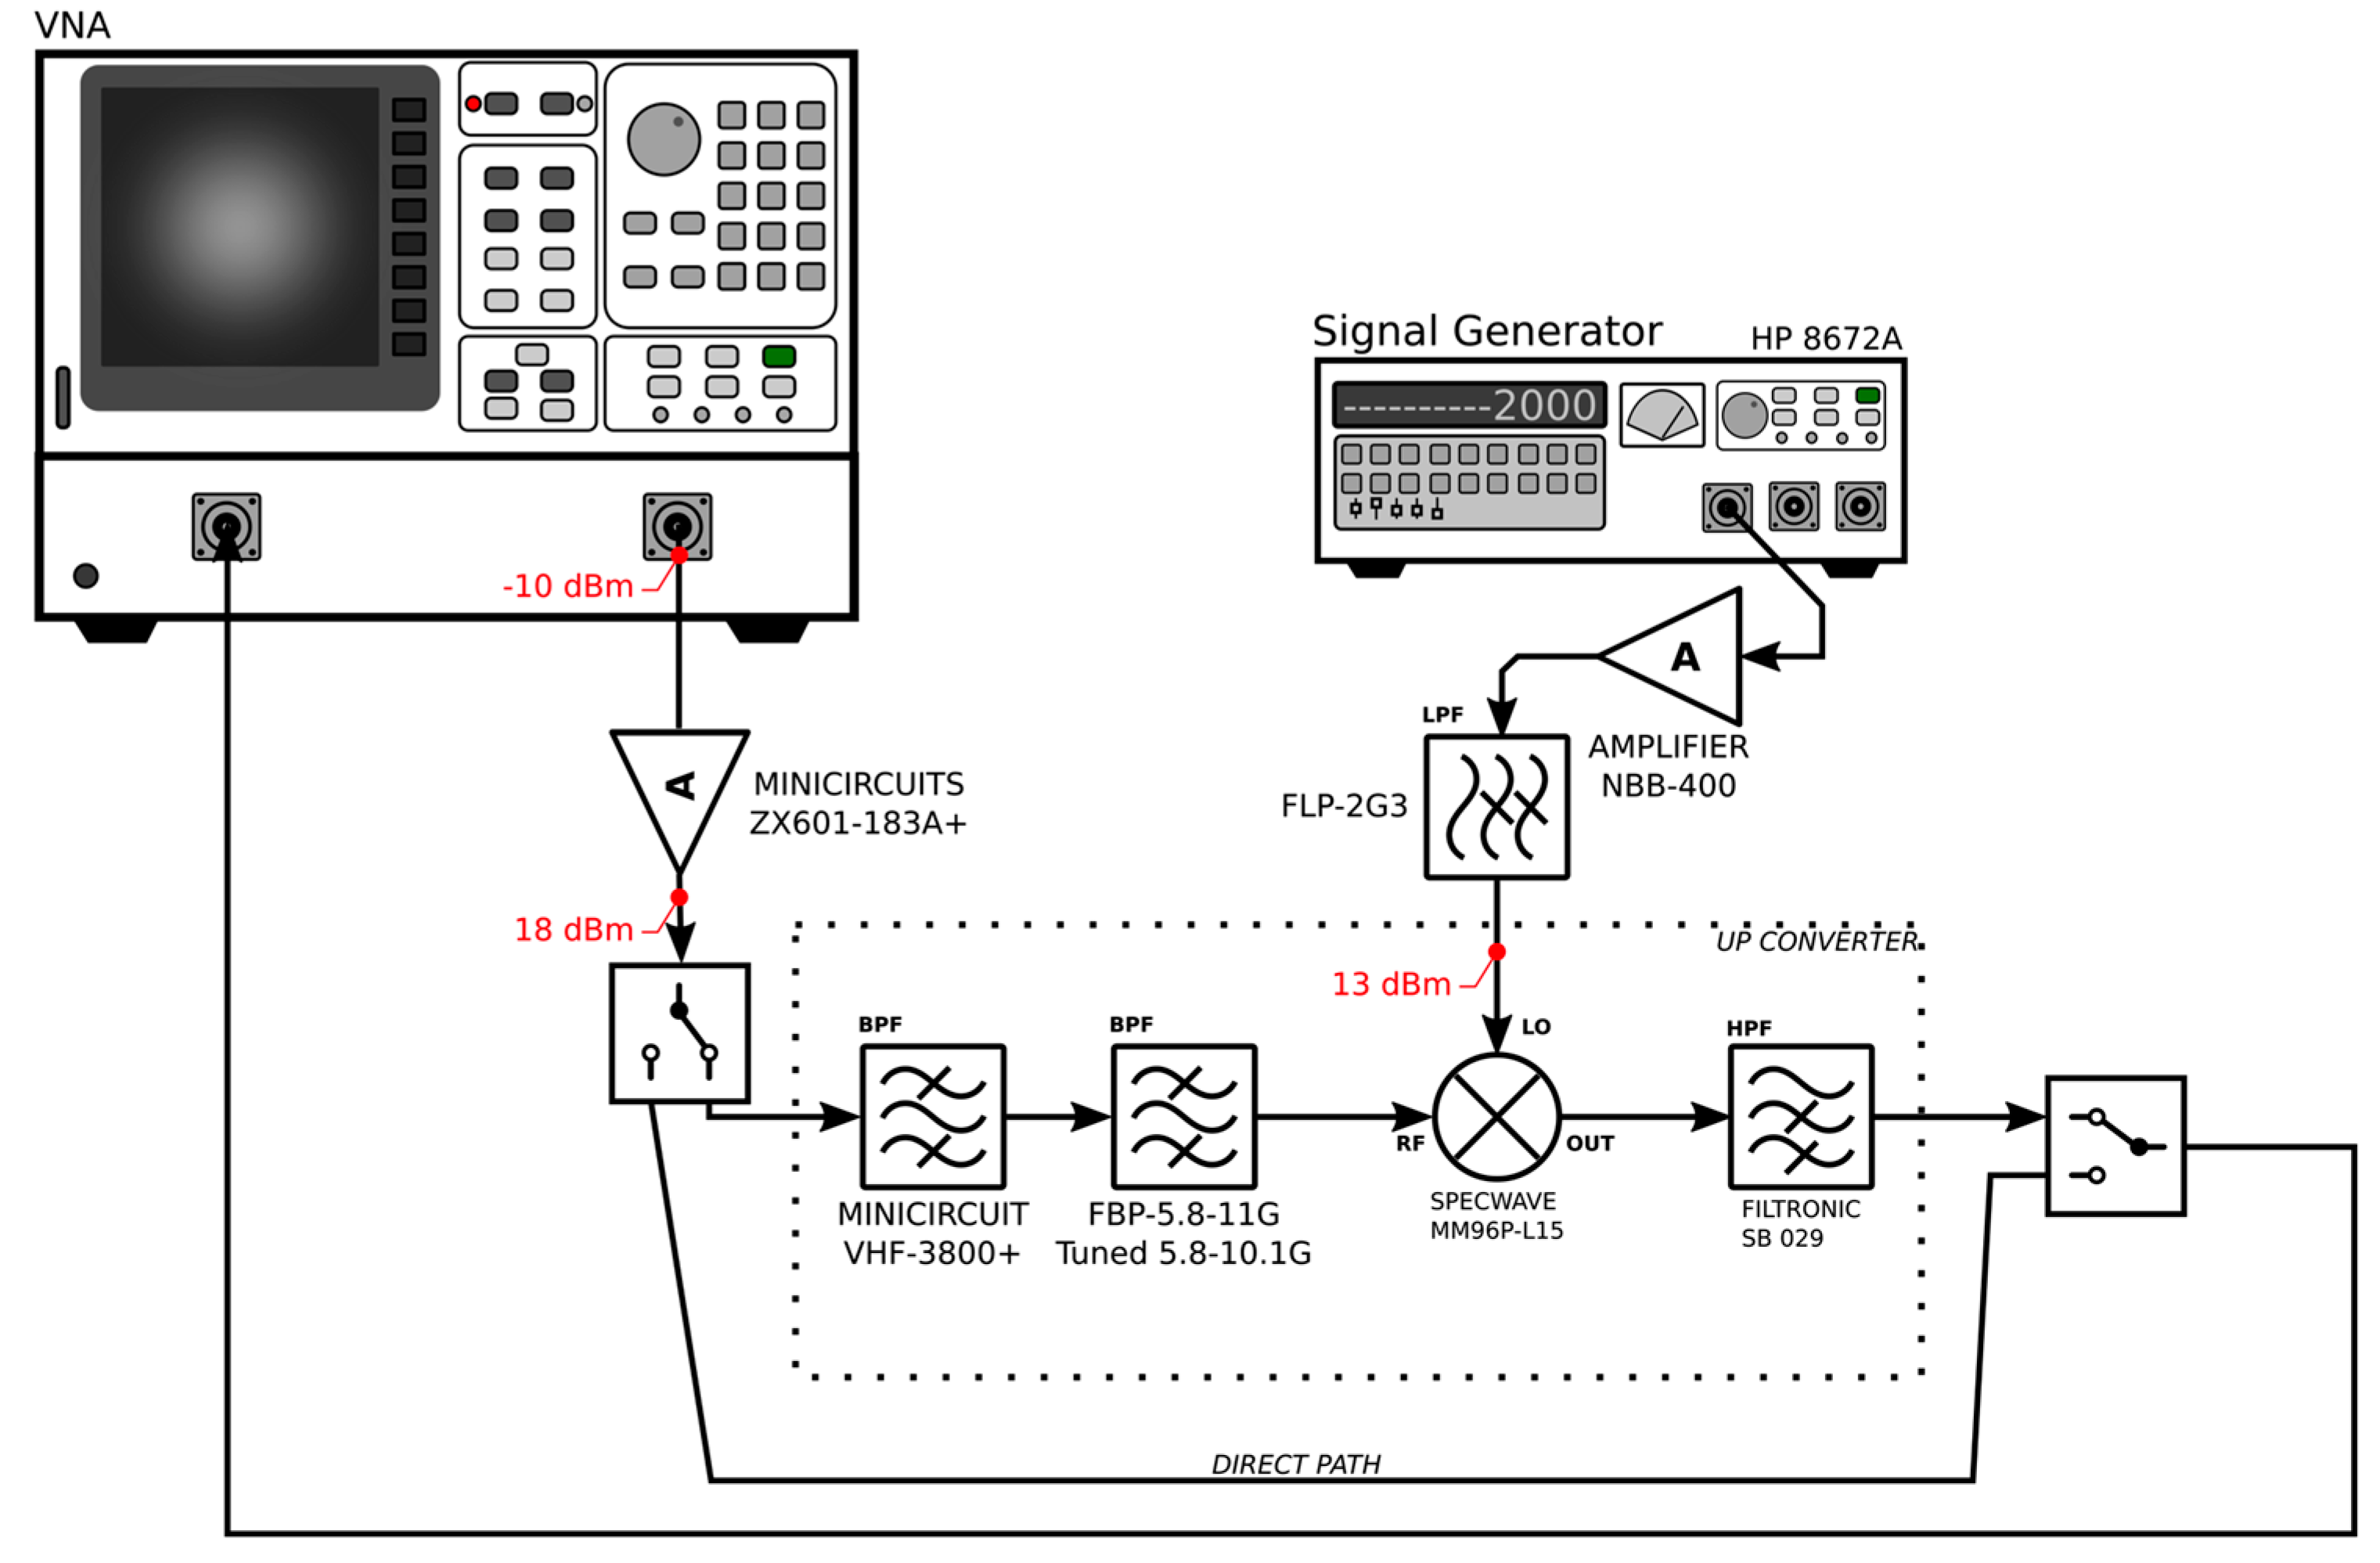
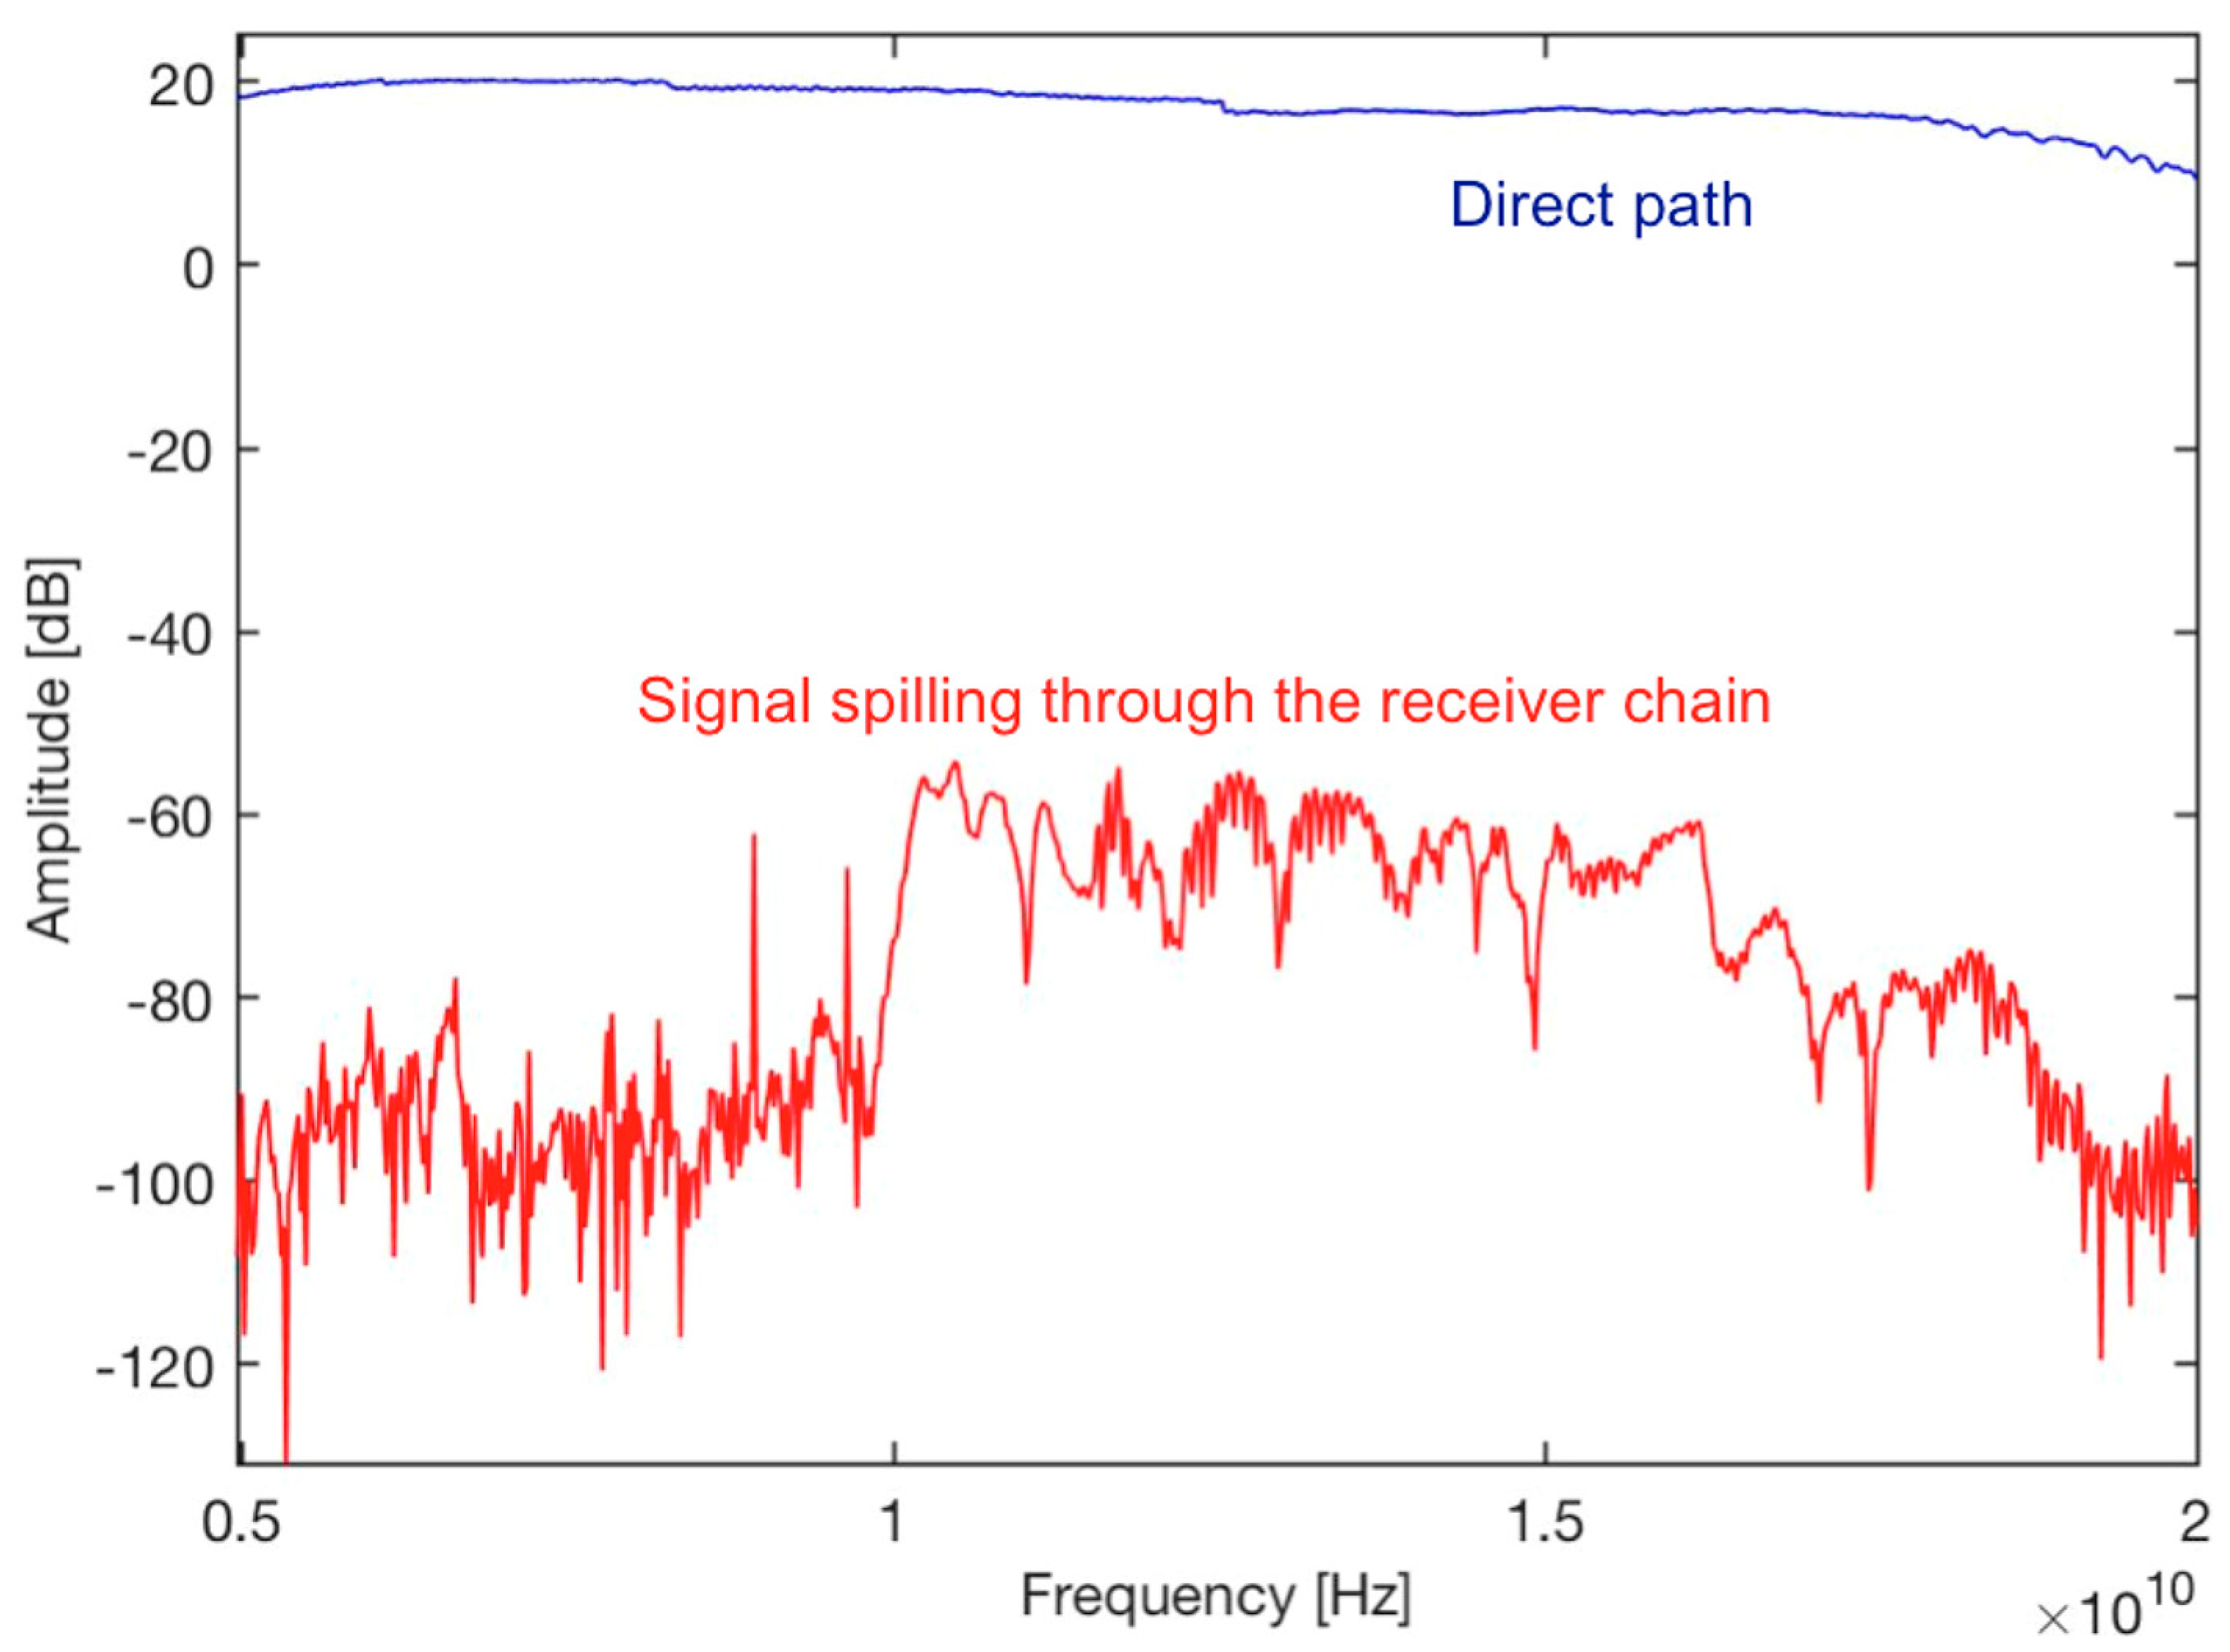
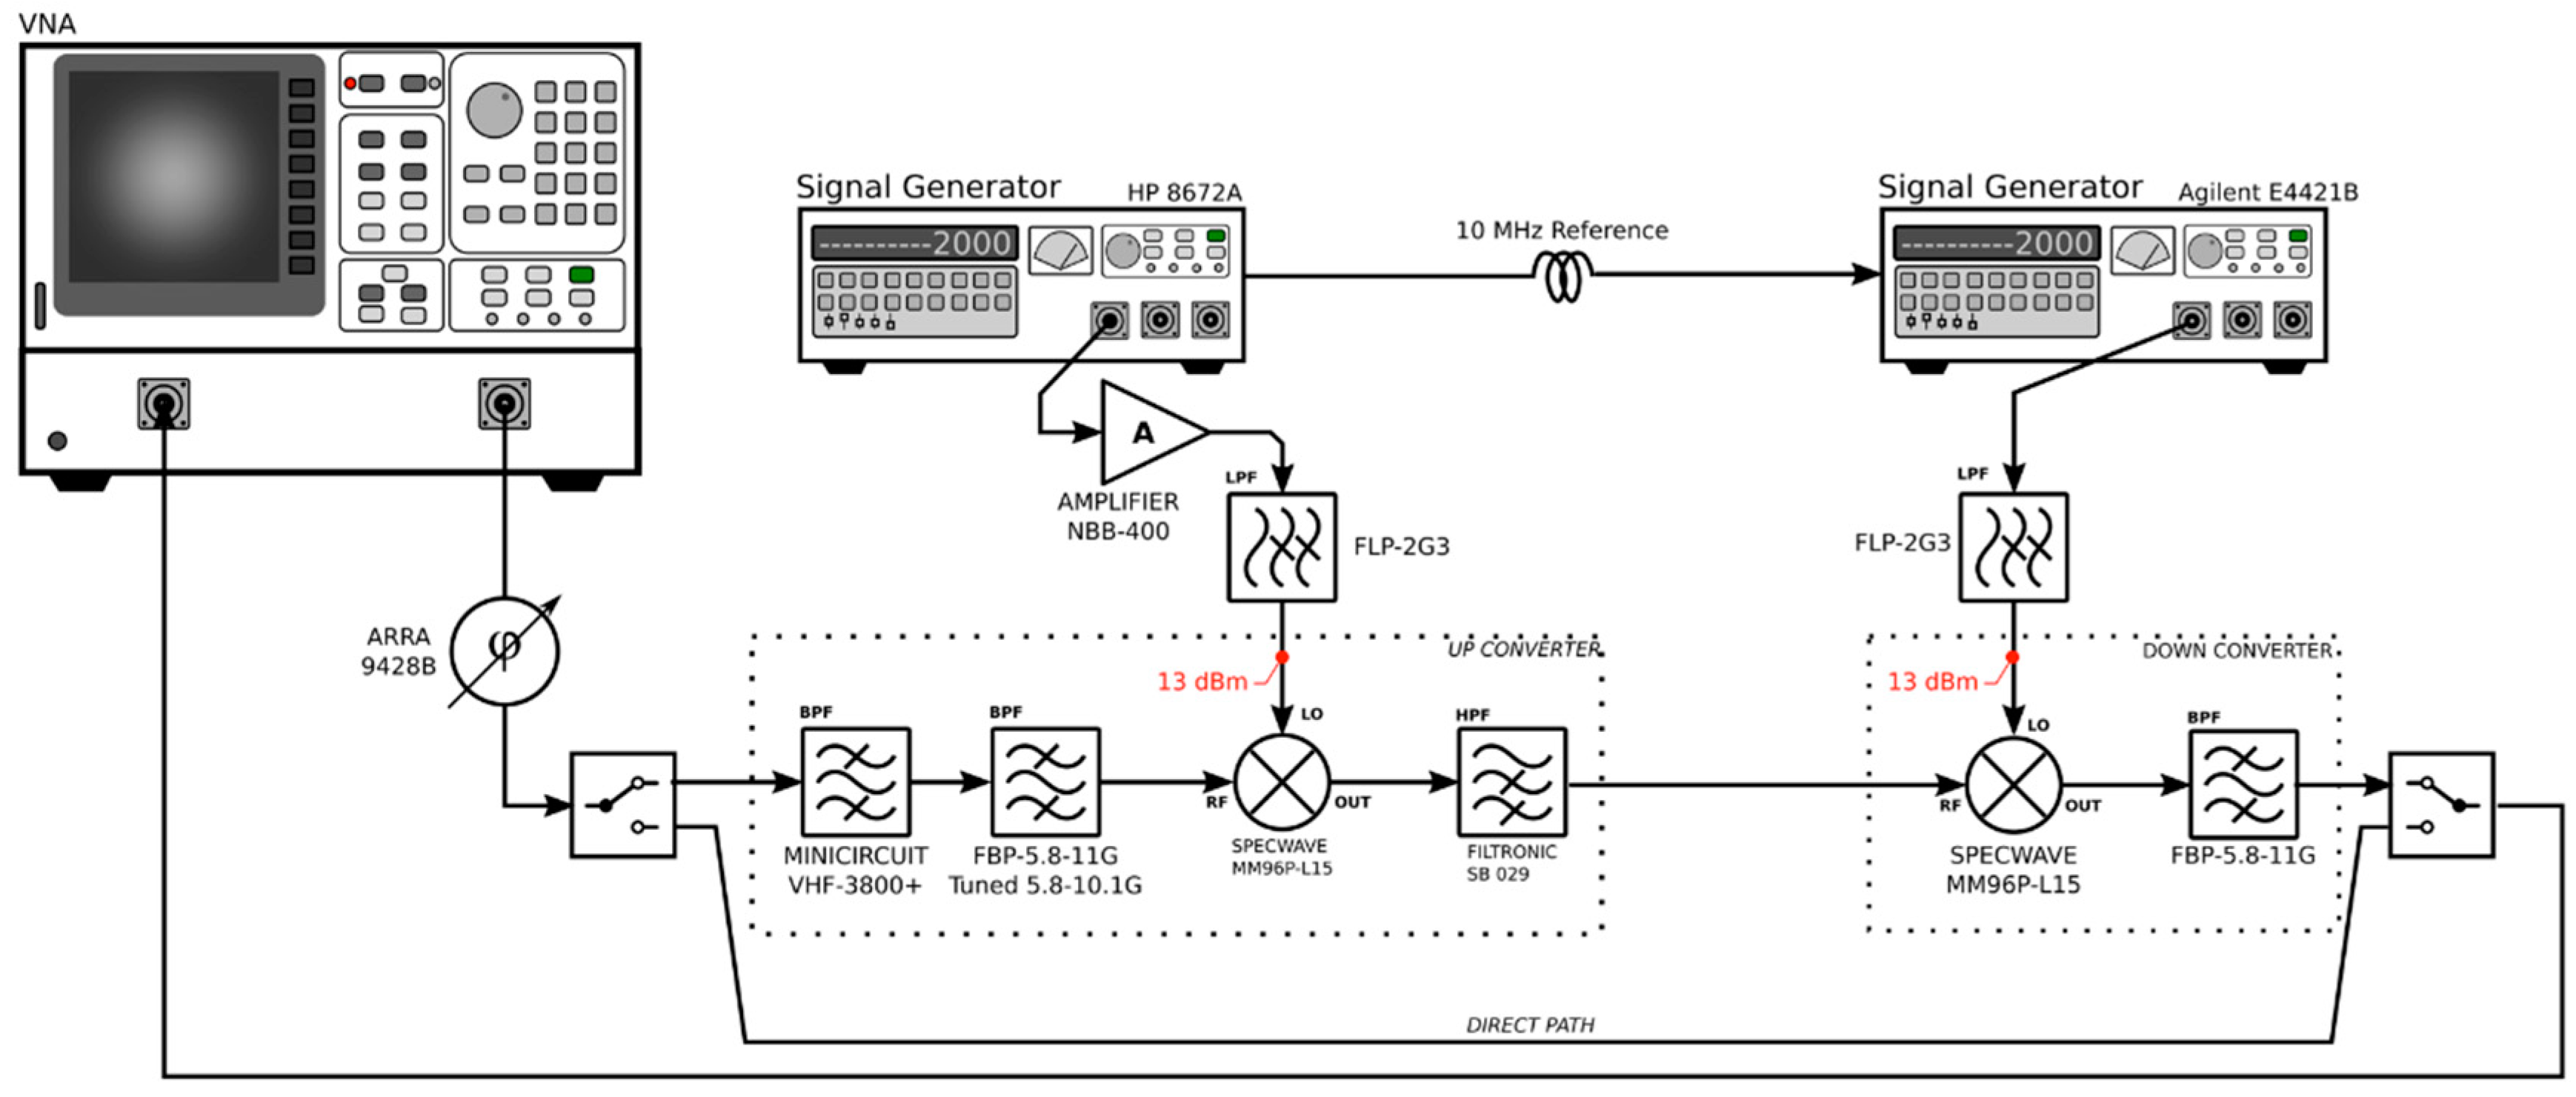
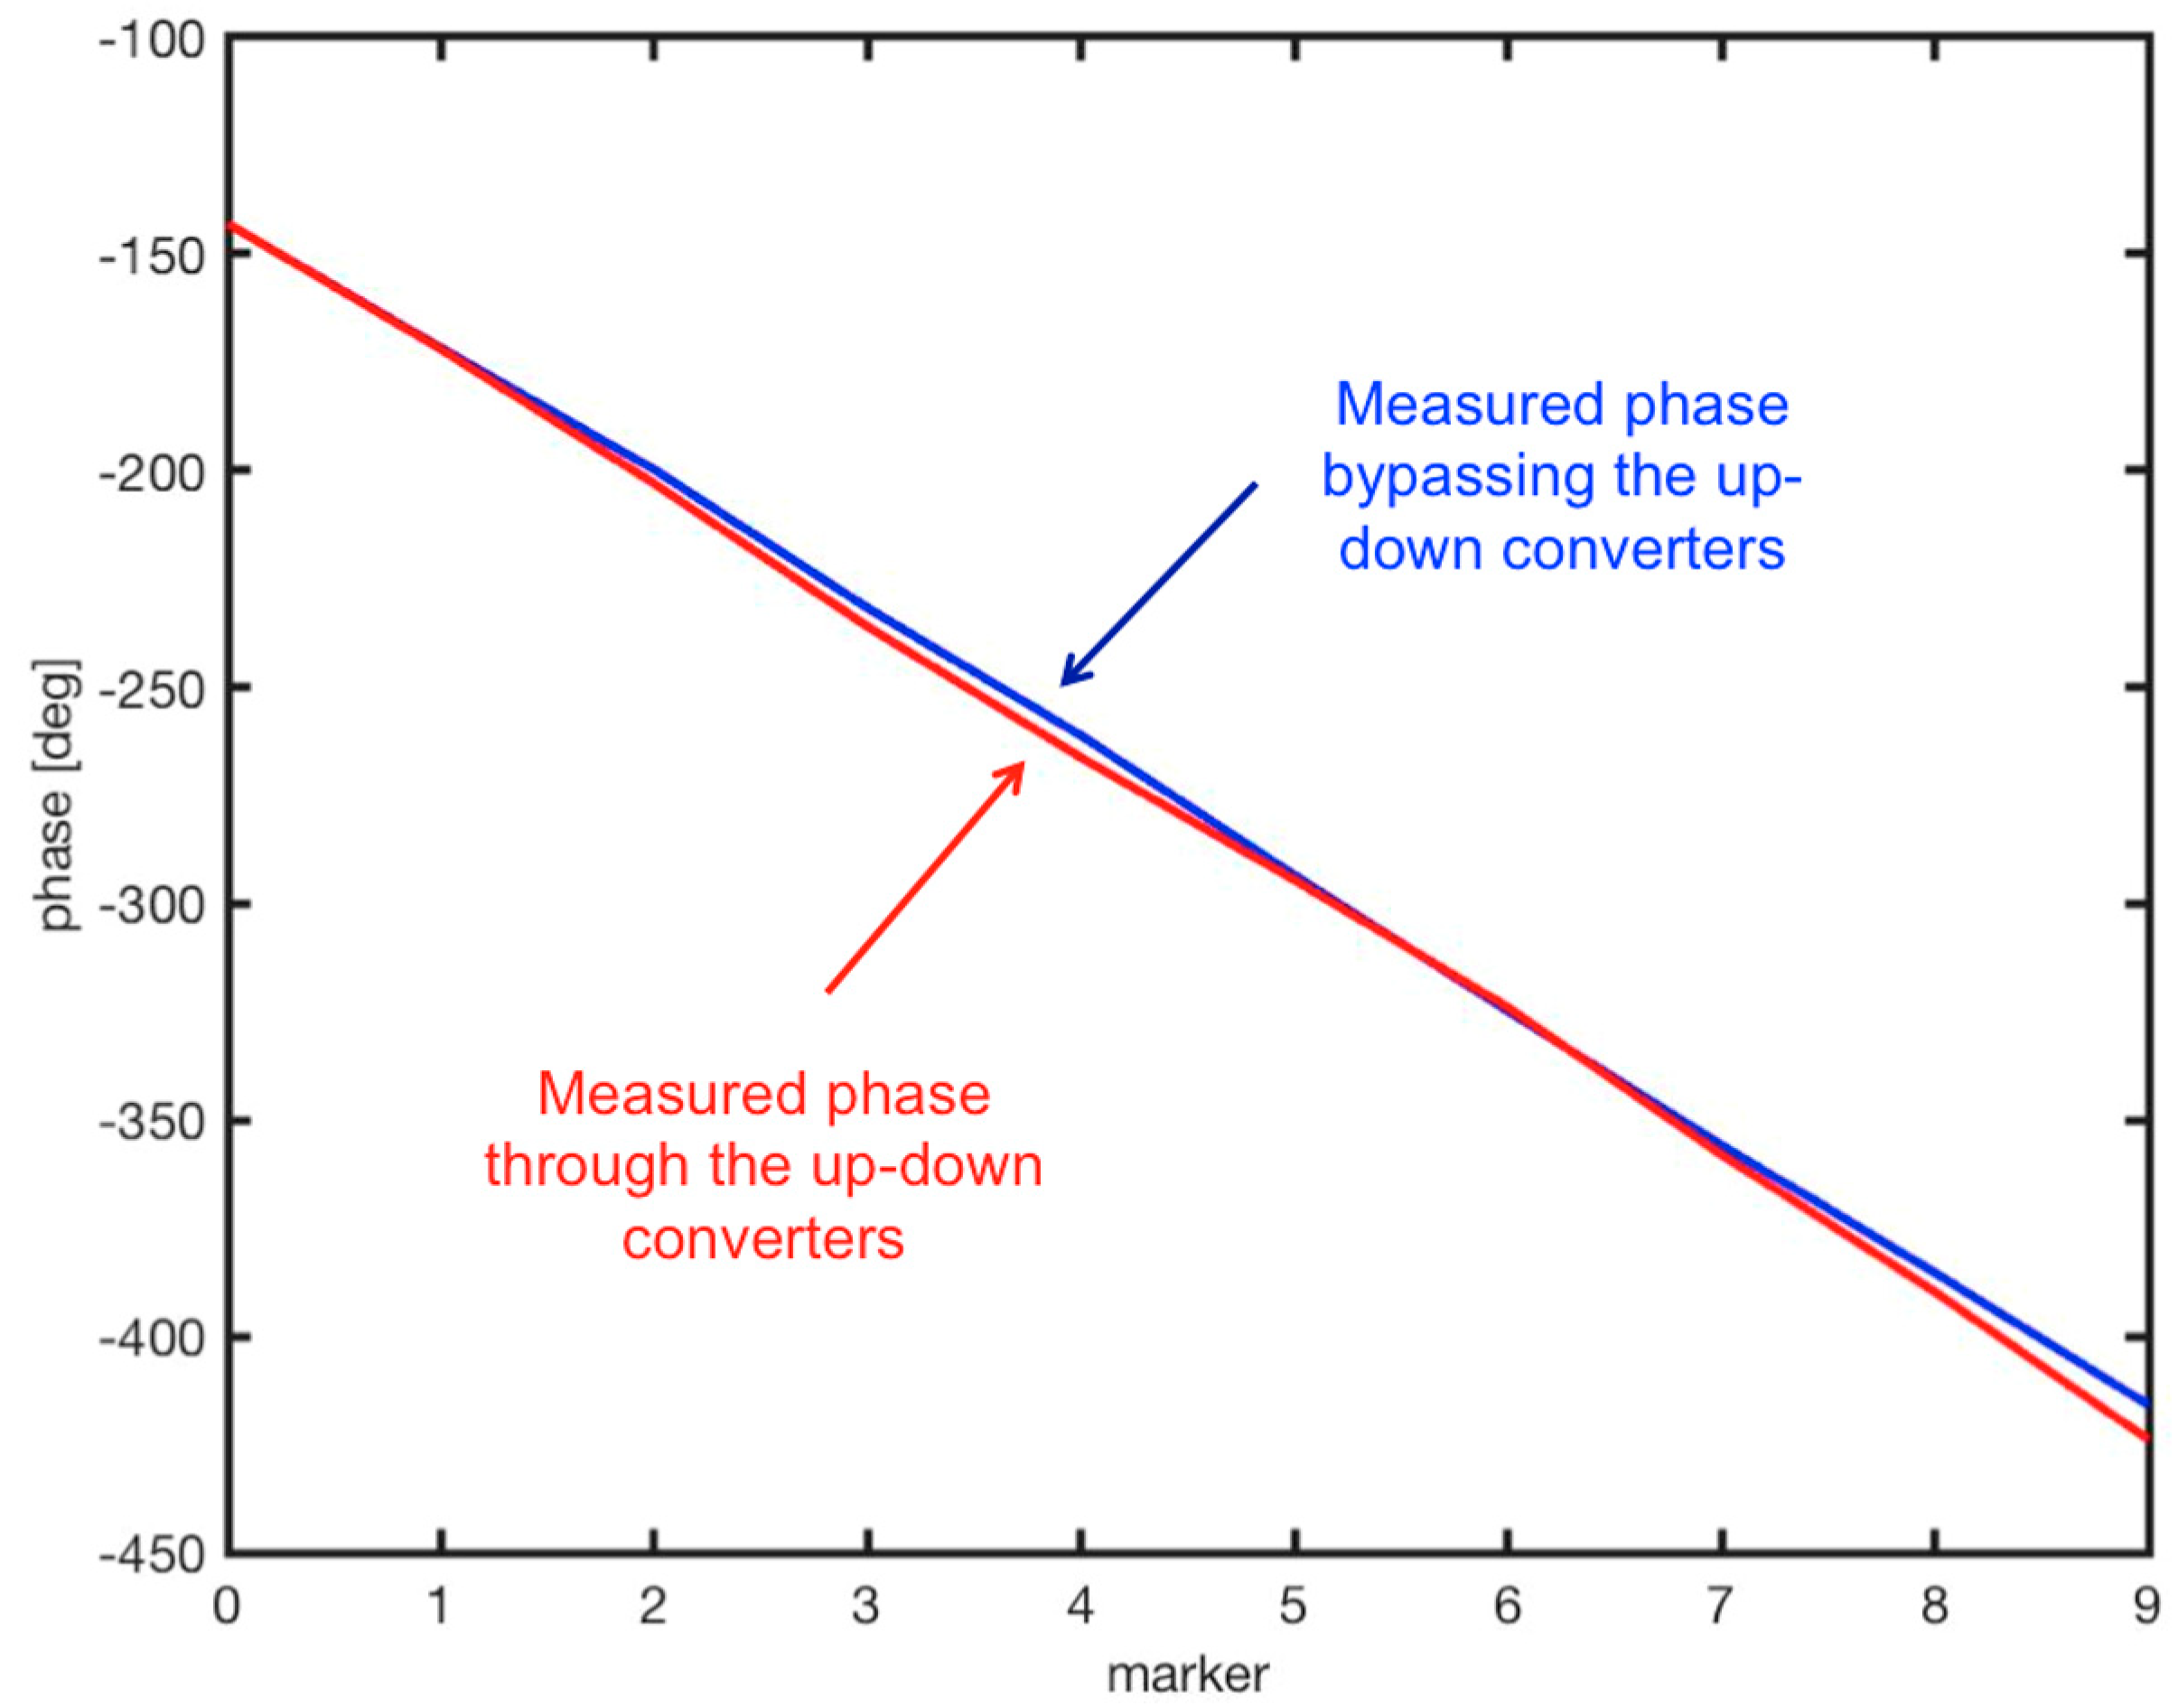
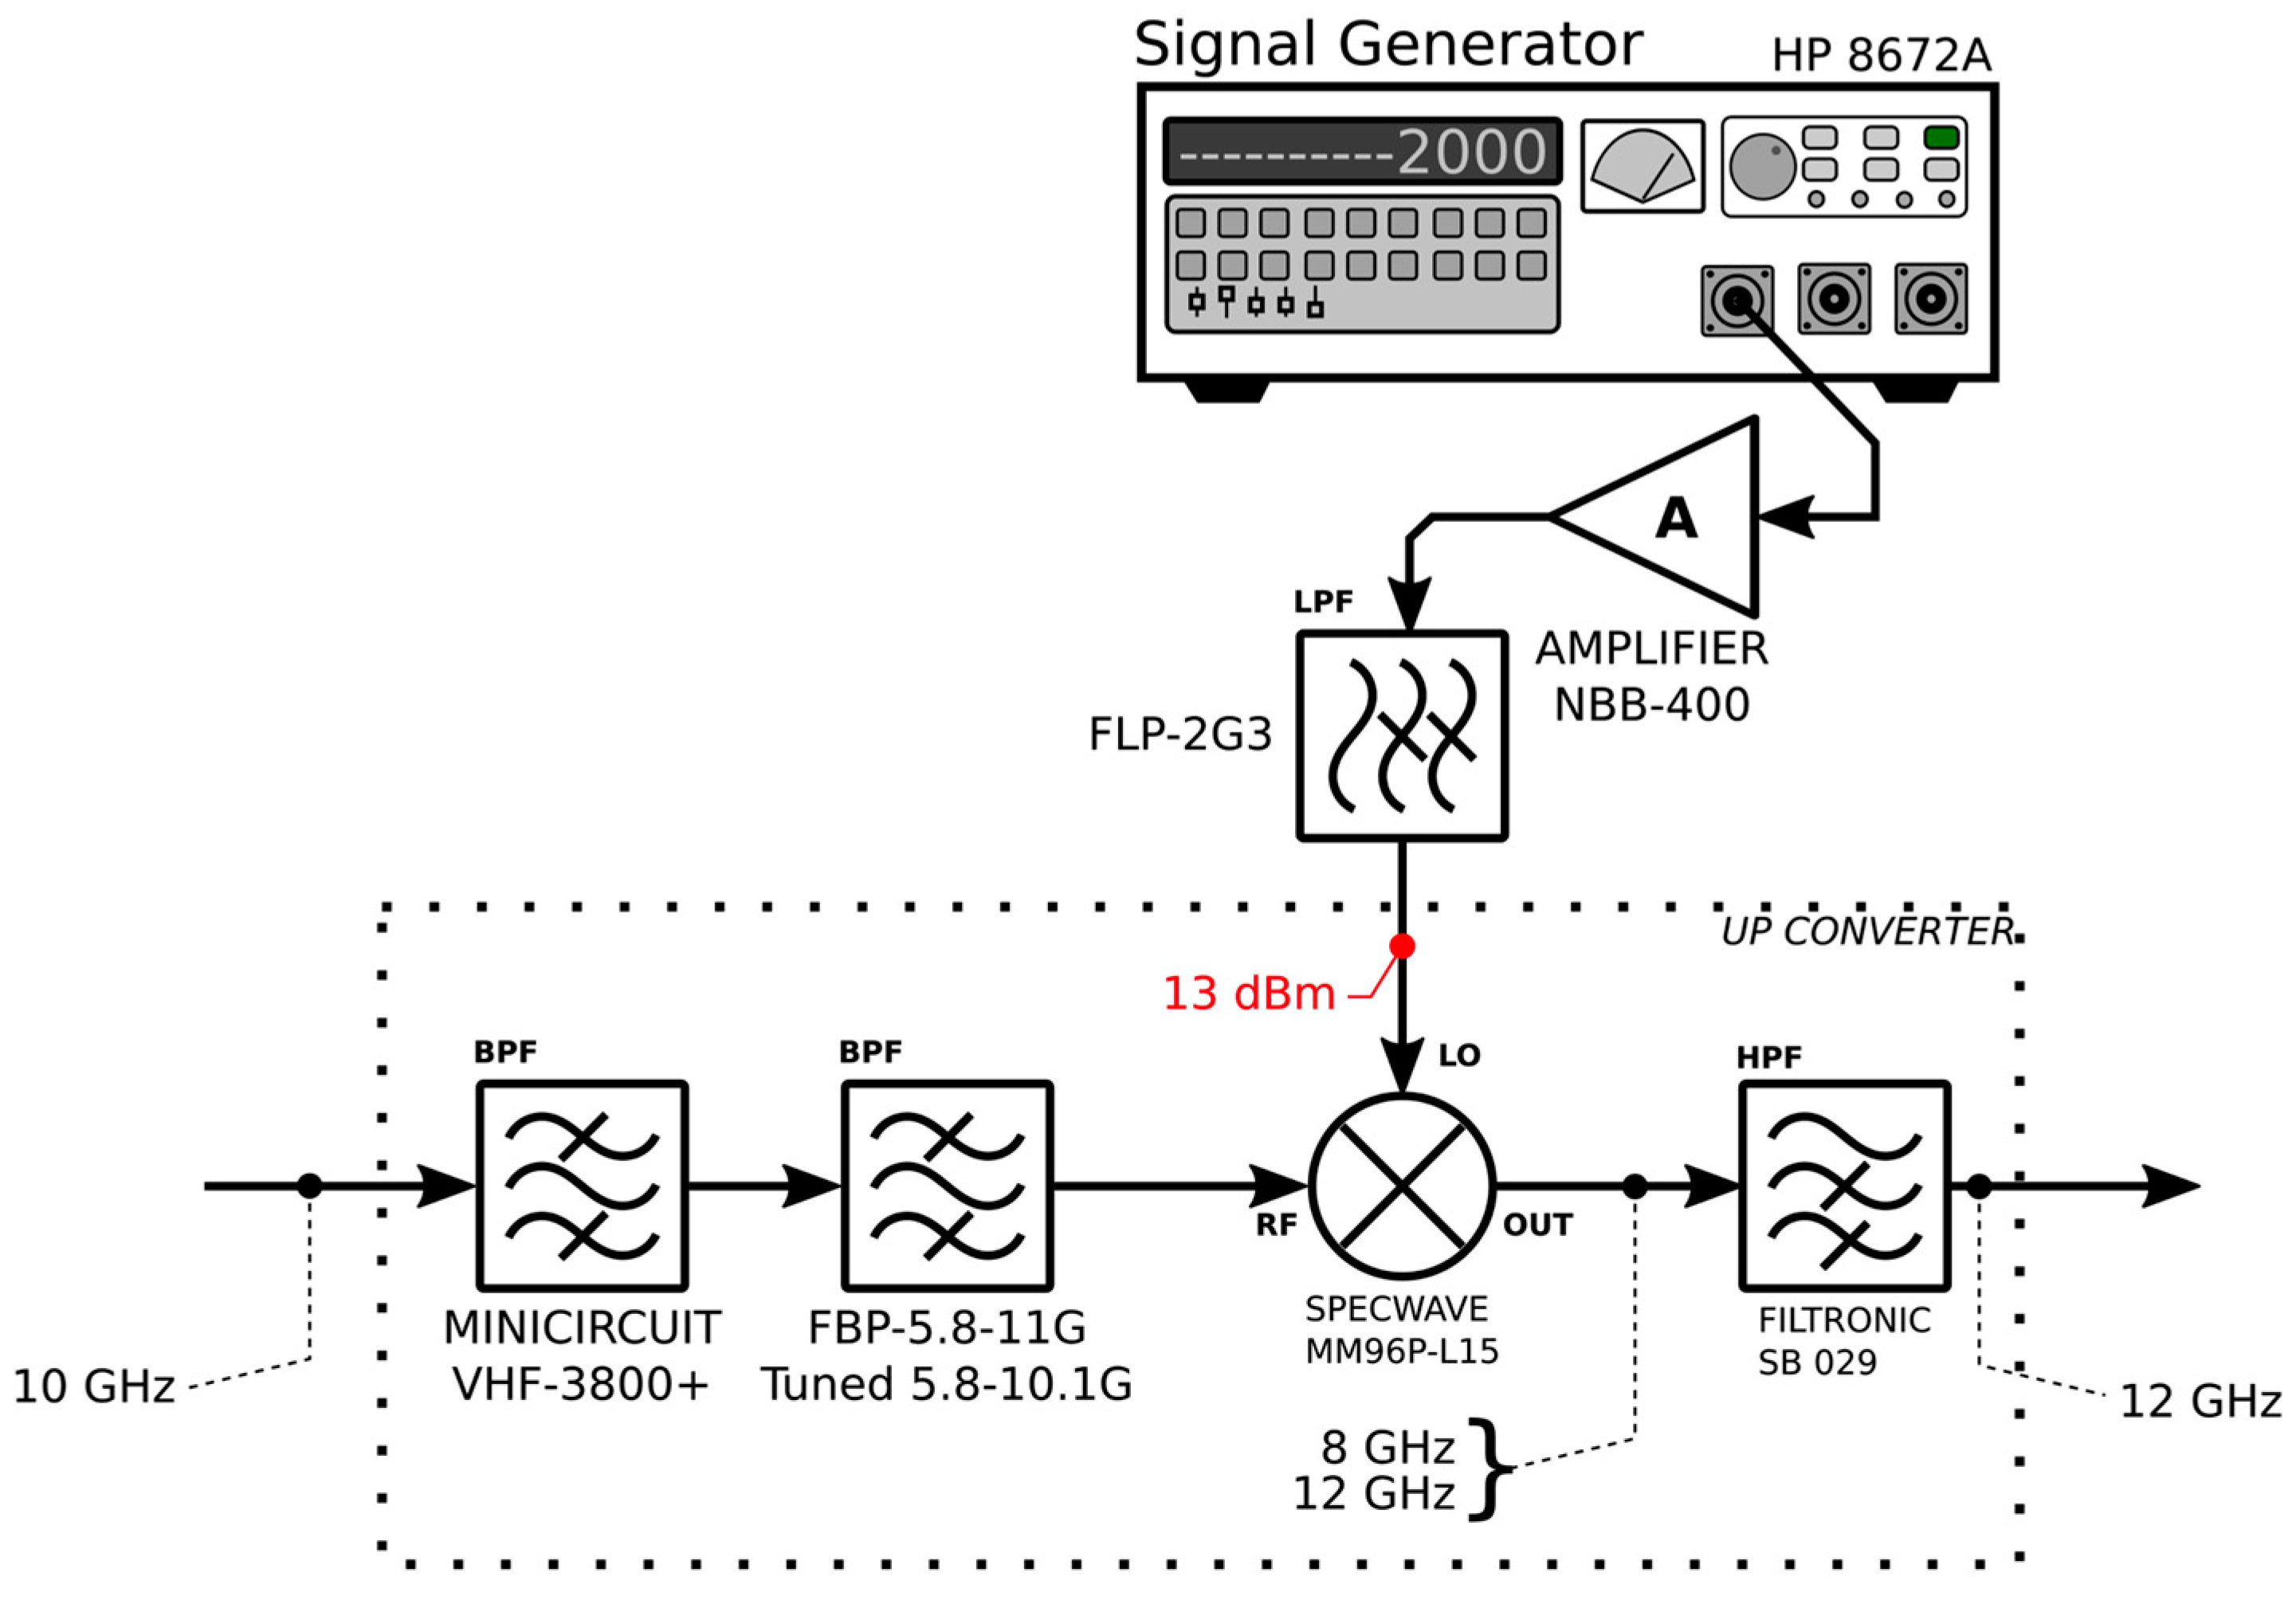
3.1. Test Bench of the System
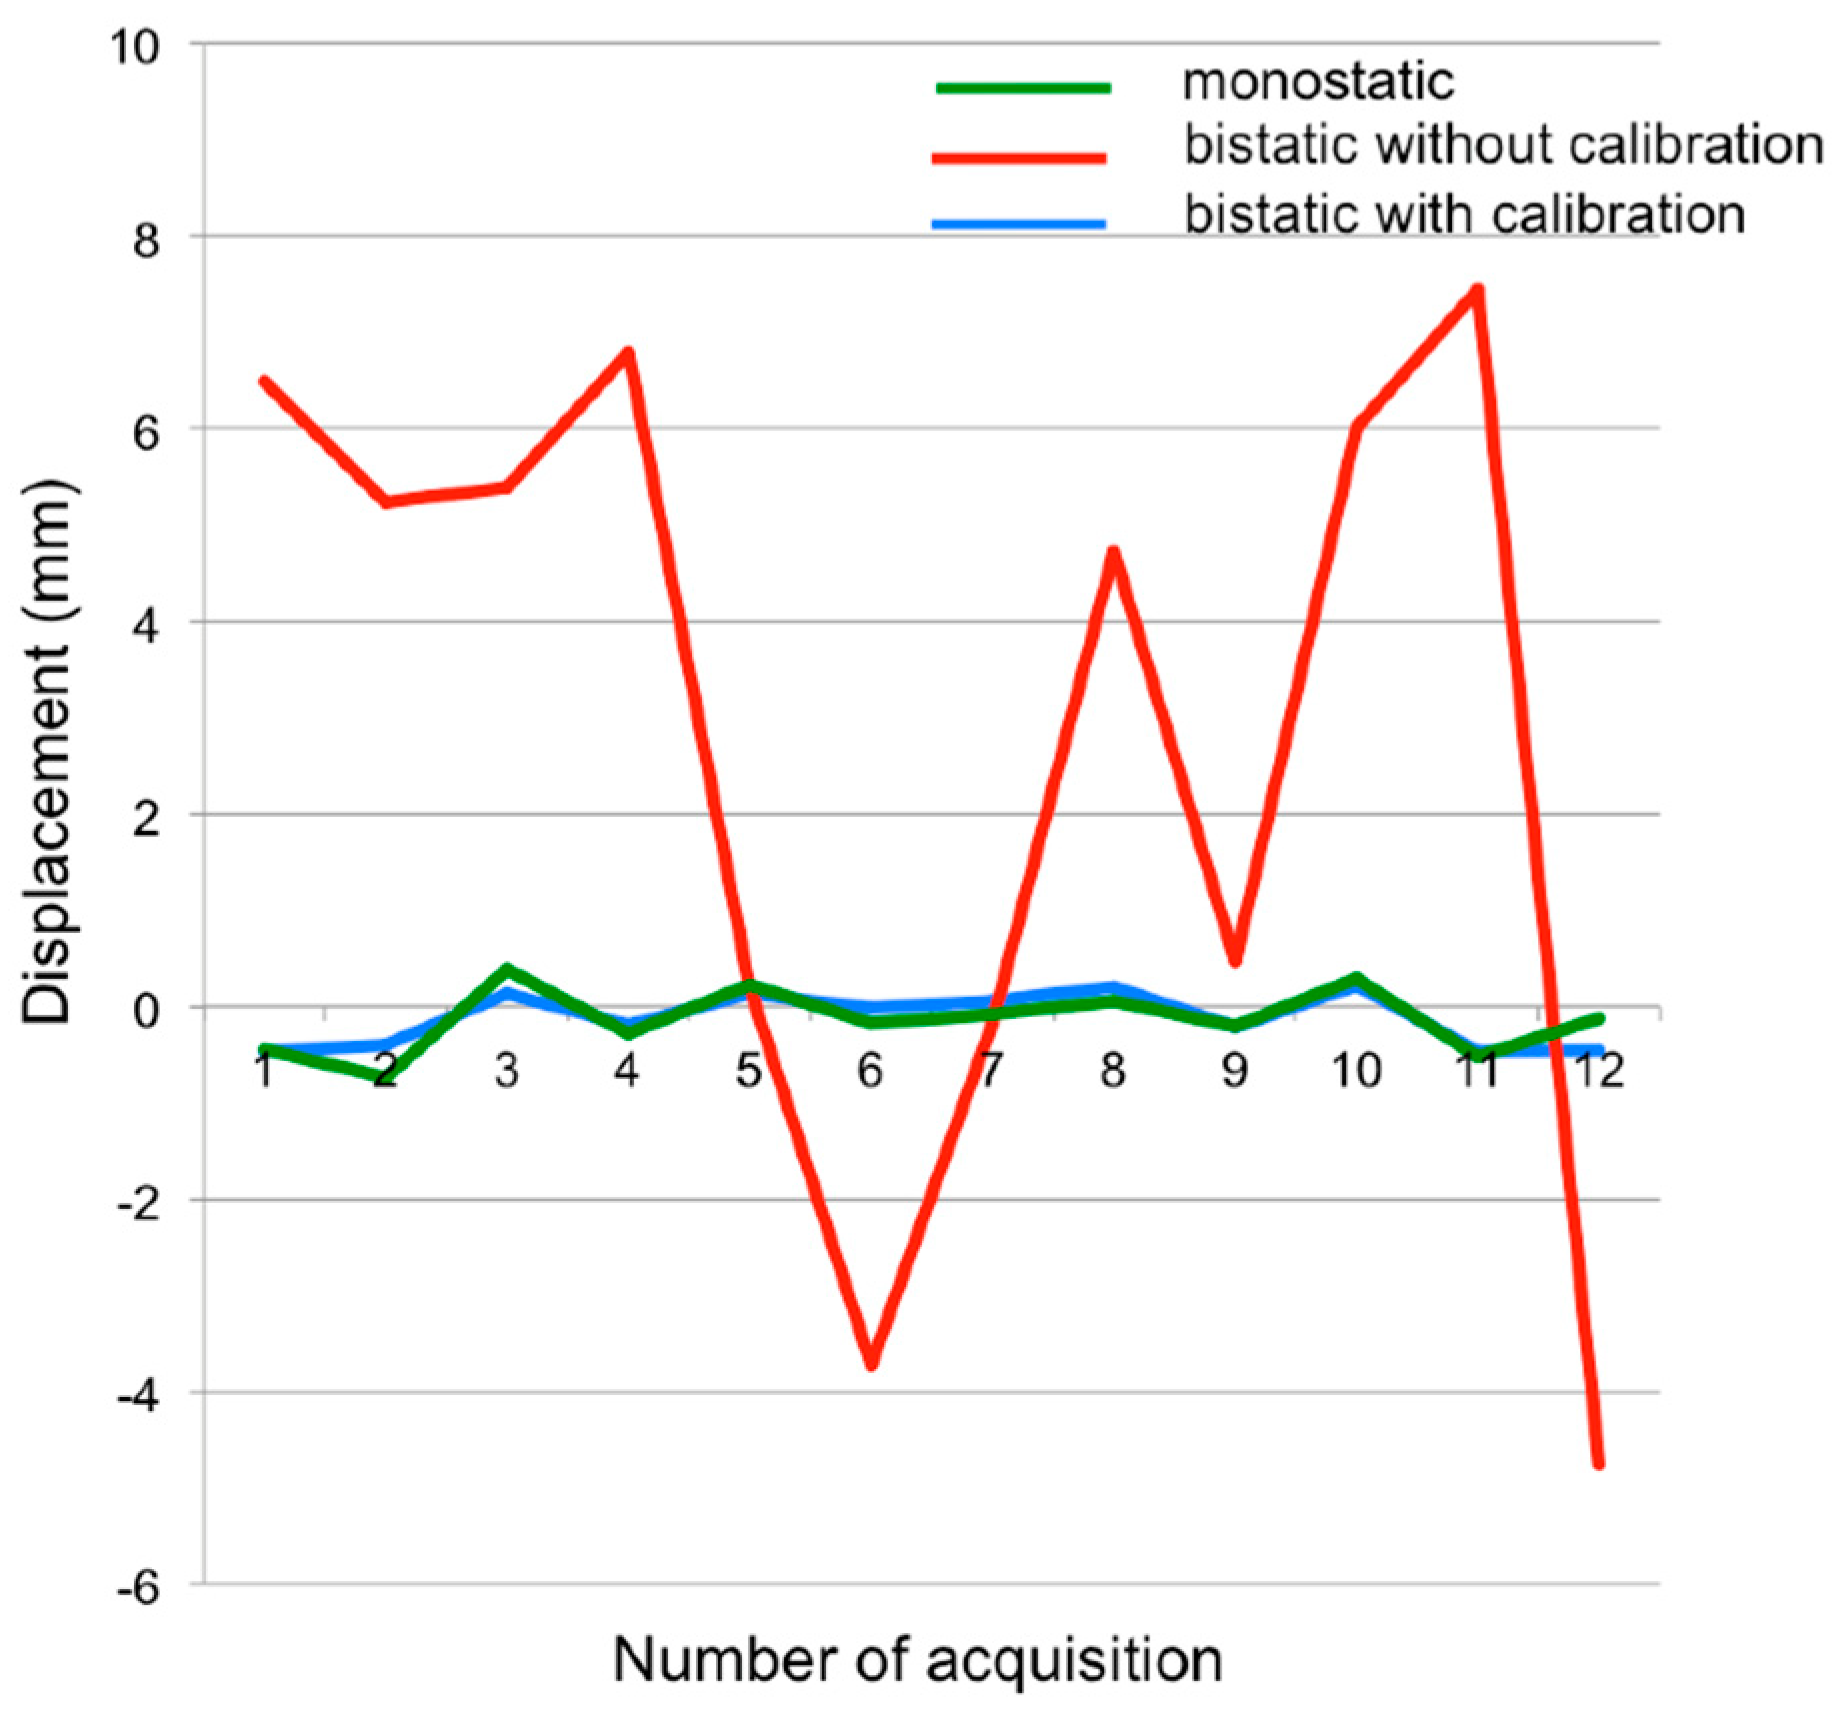
Figure 4 shows the implementation of a upconverter realized with a mixer (SPECWAVE MM96P-L15), a LO at 2.0 GHz (HP 8672A), and a high-pass RF filter (FILTRONIC SB 029). Two band-pass filters (MINICIRCUITS VHF-3800+ and FBP-5.8-11G tuned in the band 5.8 GHz–10.1 GHz) are used for limiting the input band.
The isolation of the transponder with the upconverter was measured with the test bench depicted in Figure 5.
Figure 6 shows the amplitude plot in frequency of the signal before the upconverter (“direct path” in Figure 6) and after. The minimum isolation resulted in 71.90 dB, which was enough to prevent the oscillation of an amplifier with gain up to 50–60 dB.
The upconverter requires a downconverter at the radar head. In order to test the capability of the up- and downconverters to correctly detect the phase of the radar signal, we implemented the test bench shown in Figure 7. In order to simulate the measured differential phase of a target, we inserted a manual phase shifter (ARRA 9428B) between the Vector Network Analyzer (VNA) and the upconverter. The two signal generators at 2.0 GHz were locked up with a 50 m coaxial cable that shared the 10 MHz reference signal.
Figure 8 shows the phase measured when the signal passes through the up- and downconverters and the phase measured directly (bypassing the up- and downconverters). The x-axis represents the marker number of the manual roll of the phase shifter (ARRA 9428B).
Figure 9 shows the plot of the differences. The average difference was 2.78 deg. This difference appears to be a systematic error (probably due to nonideality of the mixers and filters), which is compensated by the calibration procedure and which cannot anyway affect the differential measurement of the targets’ displacements in any case.

3.2. Field Test

Figure 10 shows the aerial picture of the test site where we tested the radar equipment. The radar was facing a seven-storey building at 130 m distance. The transponder was at the right side of the radar at 22.2 m distance. Figure 11 shows a picture taken by the radar position.
The radar operated in the band 9.915 GHz–10.075 GHz. The number of frequencies was 801. The length of the mechanical scan (orthogonal to the view direction) was 1.82 m. The number of steps along the scan was 180. The transmitted power was 19 dBm. The measured gain of the transponder (shown in picture in Figure 12) was 91 dB.
Figure 13 shows the obtained monostatic image. The edges of the building marked in the pictures in Figure 9 and Figure 10 are well evident. The amplitude scale of the image is in signal to thermal noise ratio (STNR), which has been calculate as outlined in Reference [9]:
STNR ij = | I ij ( foc ) | 2 P 0 T meas A cal k B T
where Iij(foc) is the radar image focused using the algorithm in [10]; P0 = 19 dBm is the transmitted power; Tmeas is the integration time that is given by the time of a single continuous wave (CW) measurement multiplied by the number of frequency (Nf = 801) and the number of positions (Np = 180); Acal = 40 dB is the attenuation of the internal calibration path of the radar head; kB is the Boltzmann’s constant; T is the absolute temperature (300 K).
In order to test the phase stability of the radar system, we acquired 13 images in 7 h, and we calculated the interferograms between any image and its subsequent image. Figure 14 shows one of these interferograms. The pixels relative to the building appear rather stable in-phase.
The obtained bistatic image is shown in Figure 15. The image quality is comparable with the monostatic image.
The amplitude scale of the image in Figure 14 is STNR calculated using Equation (6), where Acal is not longer the attenuation of the internal calibration path but is the attenuation of the external bistatic calibration path estimated as follows:
A cal = G TX-radar 4 π R 3 2 G RX-transp λ 1 2 4 π A att A G TX-transp 4 π R 3 2 G RX-radar λ 2 2 4 π A RX-radar
With reference to the block scheme in Figure 16, GTX-radar =14 dB is the gain of the transmitting antenna of the radar pointed at the transponder; R3 = 22.2 m is the radar–transponder distance; GRX-radar = 14 dB is the gain of the receiving antenna of the transponder pointed at the radar; λ1 is the wavelength at 10 GHz; Att = −30 dB is the attenuation of the attenuator in the calibration channel of the transponder; A = 91 dB is the gain of the transponder; GTX-transp = 14 dB is the gain of the transmitting antenna of the transponder pointed at the radar; GTX-transp = 14 dB is the gain of the receiving antenna of the radar pointed at the transponder; λ1 is the wavelength at 12 GHz; and ARX-radar = −2 dB is the gain of frequency shifter of the radar.
Even in bistatic configuration, we acquired 13 images. Figure 17 shows one of the interferograms obtained with a couple of calibrated bistatic images.
In order to quantify this phase stability, we selected the point marked with A both in monostatic and bistatic interferograms, and we detected the “apparent” displacement (∆R) calculated as follows:
R = λ 4 π φ
where λ is the wavelength at the central frequency and (∆φ) is the detected phase in the interferogram. As the point marked with A is presumably a stable point, any displacement fluctuation is due to the radar system, atmospheric fluctuation, and environmental temperature changes. Figure 18 shows the time series of the three measured displacements of the point A: monostatic, bistatic without calibration, and bistatic with calibration.
The monostatic displacements had mean value of −0.1238 mm and standard deviation of 0.2753 mm. These values are in agreement with other measurement campaigns with similar equipment [4,11,12]. The calibrated bistatic displacements gave mean value of −0.1361 mm and standard deviation of 0.3378 mm, in perfect agreement with monostatic measurements. This means that the up and down frequency converters did not introduce uncontrolled phase shift. It is important to note that the same values could not be obtained without the calibration path provided by the third antenna of the transponder. Indeed, the bistatic radar image was acceptable even without calibration of the transponder, but the mean value of the displacement of point A resulted in mean value of 2.840 mm with a standard deviation of 4.247 mm, as shown in Figure 18. These values prevented any possible use of the interferograms for detecting displacements. The reason for this phase instability is related to the reference coaxial cable that connects the radar head to the transponder. When the radar head moves along the mechanical guide, the movement of the cable gives uncontrolled phase changes. We verified this experimentally by intentionally moving the cable.

4. Conclusions

In this paper, the authors designed and tested a high gain (91 dB) transponder for operating a GBSAR in bistatic modality. This high gain was obtained by decoupling the transmit and receiving channels by cross-polarization and frequency shift. As the radar needs phase stability both for providing the synthetic aperture and for operating as an interferometer, it was necessary to share the reference signal using a cable and to provide a calibration path between the transponder and the radar head. This solution can possibly be problematic for long-range deployment of the equipment. In order to avoid the cable, a lock-in module in the transponder could use the calibration signal as reference signal; however, this obviously adds further hardware complexity. An alternative solution that can be investigated in future works is to synchronize radar and transponder using the same clock provided by a GPS constellation.
Compared to the transponder reported in Reference [6], this transponder is fairly more complex and expensive; nevertheless, it is able to obtain a gain (91 dB) that is not achievable otherwise. Therefore, we can state that this enhanced transponder is specially designed for long-range applications where very high gain is required.

5. Patents

The bistatic GBSAR with transponder (with and without frequency shifter) has been patented by one of the authors, and the University of Florence has the property. Patent number: n. 102016000102764 filed, 13 October 2016.

Author Contributions

M.P. conceived and designed the experiments; L.M. performed the experiments; M.P. analyzed the data; M.P. wrote the paper.

Funding

This research was partially funded by the private company IDS Georadar srl, Pisa, Italy.

Conflicts of Interest

M.P. has patented the bistatic GBSAR through transponder.

References

  1. Noferini, L.; Takayama, T.; Pieraccini, M.; Mecatti, D.; Macaluso, G.; Luzi, G.; Atzeni, C. Analysis of ground-based SAR data with diverse temporal baselines. IEEE Trans. Geosci. Remote Sens. 2008, 46, 1614–1623. [Google Scholar] [CrossRef]
  2. Luzi, G.; Pieraccini, M.; Mecatti, D.; Noferini, L.; Macaluso, G.; Tamburini, A.; Atzeni, C. Monitoring of an alpine glacier by means of ground-based SAR interferometry. IEEE Geosci. Remote Sens. Lett. 2007, 4, 495–499. [Google Scholar] [CrossRef]
  3. Severin, J.; Eberhardt, E.; Leoni, L.; Fortin, S. Development and application of a pseudo-3D pit slope displacement map derived from ground-based radar. Eng. Geol. 2014, 181, 202–211. [Google Scholar] [CrossRef]
  4. Pieraccini, M.; Tarchi, D.; Rudolf, H.; Leva, D.; Luzi, G.; Bartoli, G.; Atzeni, C. Structural static testing by interferometric synthetic radar. NDT E Int. 2000, 33, 565–570. [Google Scholar] [CrossRef]
  5. Jenkins, W.; Rosenblad, B.; Gomez, F.; Le-garsky, J.; Loehr, E. Deformation measurements of earth dams using a ground based inter-ferometric radar. In Proceedings of the 2012 ASDSO Annual Conference on Dam Safety, Denver, CO, USA, 16–21 September 2012. [Google Scholar]
  6. Pieraccini, M.; Miccinesi, L.; Rojhani, N. A GBSAR Operating in Monostatic and Bistatic Modalities for Retrieving the Displacement Vector. IEEE Geosci. Remote Sens. Lett. 2017, 14, 1494–1498. [Google Scholar] [CrossRef]
  7. Skolnik, M. Introduction to Radar Systems; McGraw-Hill Education: New York, NY, USA, 2002. [Google Scholar]
  8. Zhou, S.G.; Tan, P.K.; Chio, T.H. Low-profile, wideband dual-polarized antenna with high isolation and low cross polarization. Antennas Wirel. Propag. Lett. 2012, 11, 1032–1035. [Google Scholar] [CrossRef]
  9. Pieraccini, M. Noise Performance Comparison Between Continuous Wave and Stroboscopic Pulse Ground Penetrating Radar. IEEE Geosci. Remote Sens. Lett. 2018, 15, 222–226. [Google Scholar] [CrossRef]
  10. Pieraccini, M.; Miccinesi, L. ArcSAR: Theory, simulations, and experimental verification. IEEE Trans. Microw. Theory Tech. 2017, 65, 293–301. [Google Scholar] [CrossRef]
  11. Dei, D.; Pieraccini, M.; Fratini, M.; Atzeni, C.; Bartoli, G. Detection of vertical bending and torsional movements of a bridge using a coherent radar. NDT E Int. 2009, 42, 741–747. [Google Scholar] [CrossRef]
  12. Pieraccini, M.; Tarchi, D.; Rudolf, H.; Leva, D.; Luzi, G.; Atzeni, C. Interferometric radar for remote monitoring of building deformations. Electron. Lett. 2000, 36, 569–570. [Google Scholar] [CrossRef]
Figure 1. Monostatic/bistatic ground-based synthetic aperture radar (GBSAR) with transponder.
Remotesensing 10 01364 g001
Figure 2. Monostatic/bistatic GBSAR with cross-pol transponder.
Remotesensing 10 01364 g002
Figure 3. Monostatic/bistatic GBSAR with frequency shifter transponder.
Remotesensing 10 01364 g003
Figure 4. Upconverter operating at 10 GHz with 2 GHz frequency shifter.
Remotesensing 10 01364 g004
Figure 5. Test bench for measuring the isolation of a upconverter operating at 10 GHz with 2 GHz frequency shift.
Remotesensing 10 01364 g005
Figure 6. Plot in frequency. Red represents the amplitude of the signal through the chain with up- and downconverters; blue represents the amplitude of the signal that bypass the chain through the “direct path”.
Remotesensing 10 01364 g006
Figure 7. Test bench for testing the phase shift detection.
Remotesensing 10 01364 g007
Figure 8. Measured phase by rotating the handle of the manual phase shifter. Red represents the phase measured through the up- and downconverters; blue represents the phase measured bypassing the up- and downconverters.
Remotesensing 10 01364 g008
Figure 9. Difference between the phase measured when the signal passes through the up- and downconverters and the phase measured directly (bypassing the up- and downconverters).
Remotesensing 10 01364 g009
Figure 10. Aerial view of the test site.
Remotesensing 10 01364 g010
Figure 11. Picture taken from the radar position in front of the building in the field of view of the radar.
Remotesensing 10 01364 g011
Figure 12. Picture of the transponder in the field.
Remotesensing 10 01364 g012
Figure 13. Monostatic radar image.
Remotesensing 10 01364 g013
Figure 14. Interferogram between two monostatic radar images.
Remotesensing 10 01364 g014
Figure 15. Bistatic radar image.
Remotesensing 10 01364 g015
Figure 16. Bistatic block scheme.
Remotesensing 10 01364 g016
Figure 17. Interferogram between two calibrated bistatic radar images.
Remotesensing 10 01364 g017
Figure 18. Time series of the three measured displacements: monostatic, bistatic without calibration, and bistatic with calibration.
Remotesensing 10 01364 g018

