Article

A Study on the Assessment of Multi-Source Satellite Soil Moisture Products and Reanalysis Data for the Tibetan Plateau

1
Laboratory for Atmospheric Observation and Climate Environment Research, School of Earth and Space Sciences, University of Science and Technology of China, Hefei 230026, China
2
CAS Center for Excellence in Comparative Planetology, Hefei 230026, China
3
Jiangsu Collaborative Innovation Center for Climate Change, Nanjing 210023, China
4
Key Laboratory of Tibetan Environment Changes and Land Surface Processes, Institute of Tibetan Plateau Research, Chinese Academy of Science, Beijing 100101, China
5
CAS Center for Excellence in Tibetan Plateau Earth Sciences, Beijing 100101, China
6
College of Earth and Planetary Sciences, University of Chinese Academy of Science, Beijing 100049, China
*
Author to whom correspondence should be addressed.
These authors contributed equally to this study and shared first authorship.
Remote Sens. 2019, 11(10), 1196; https://doi.org/10.3390/rs11101196
Submission received: 20 March 2019 / Revised: 15 May 2019 / Accepted: 17 May 2019 / Published: 20 May 2019
(This article belongs to the Special Issue Observations, Modeling, and Impacts of Climate Extremes)

Abstract

:
Soil moisture is a key variable in the process of land–atmosphere energy and water exchange. Currently, there are a large number of operational satellite-derived soil moisture products and reanalysis soil moisture products available. However, due to the lack of in situ soil moisture measurements over the Tibetan Plateau (TP), their accuracy and applicability are unclear. Based on the in situ measurements of the soil moisture observing networks established at Maqu, Naqu, Ali, and Shiquanhe (Sq) by the Institute of Tibetan Plateau Research, the Chinese Academy of Sciences, the Northwest Institute of Eco-Environmental Resources, the Chinese Academy of Sciences and the University of Twente over the TP, the accuracy and reliability of the European Space Agency Climate Change Initiative Soil Moisture version 4.4 (ESA CCI SM v4.4) soil moisture products and the European Centre for Medium-Range Weather Forecasts Reanalysis 5 (ERA5) soil moisture product were evaluated. The spatiotemporal distributions and interannual variations of the soil moisture were analyzed. Further, the climatological soil moisture changing trends across the TP were explored. The results show that with regard to the whole plateau, the combined product performs the best (unbiased root-mean-square error (ubRMSE) = 0.043 m3/m3, R = 0.66), followed by the active product (ubRMSE = 0.048 m3/m3, R = 0.62), the passive product (ubRMSE = 0.06 m3/m3, R = 0.61), and the ERA5 soil moisture product (ubRMSE = 0.067 m3/m3, R = 0.52). Considering the good spatiotemporal data continuity of the ERA5 soil moisture product, the ERA5 soil moisture data from 1979 to 2018 were used to analyze the climatological soil moisture changing trend for the entire TP surface. It was found that there was an increasing trend of soil moisture across the TP, which was consistent with the overall trends of increasing precipitation and decreasing evaporation. Moreover, the shrinkage of the cryosphere in conjunction with the background TP warming presumably contribute to soil moisture change.

1. Introduction

The Tibetan Plateau (TP), known as the ‘Third Pole of the Earth’, is the highest and most extensive plateau in the world, with a mean elevation of more than 4000 m above sea level. The thermal and dynamic effects of the TP have an extremely drastic impact on Asian monsoon patterns, global atmospheric circulation, and climate change [1]. Soil moisture is one of the most important parameters in the process of land–atmosphere energy and water exchange. Consequently, an accurate soil moisture observation dataset is expected to provide crucial information and initial input data for climate change analysis and numerical simulation over the TP [2,3]. However, due to the extreme geographical environment and harsh climatic conditions, in situ measurements are restricted to a very small spatial scale and only cover a limited temporal range. Therefore, there has been a lack of soil moisture measurements in the ’Third Pole’ region for a long time, which is insufficient to meet the needs of plateau climate change research.
Microwave satellite remote sensing technology is an effective tool to fill this gap. Soil dielectric properties are closely related to soil moisture. In general, as the soil moisture increases, the soil dielectric constant increases. Additionally, the satellite microwave remote sensing signal has a certain penetrating ability with respect to clouds, vegetation, and soil. Consequently, satellite microwave remote sensing can be used to obtain the surface soil moisture by detecting the soil dielectric properties [4]. To date, various microwave satellites/sensors for soil moisture observation have been developed, including the Advanced Microwave Scanning Radiometer—Earth Observing System (AMSR-E), the Scanning Multichannel Microwave Radiometer (SMMR), the Special Sensor Microwave/Image (SSM/I), the Microwave Imager (TMI) onboard the Tropical Rainfall Measuring Mission (TRMM), the Advanced Scatterometer (ASCAT), the WindSat, and the Soil Moisture and Ocean Salinity (SMOS) satellite [5,6,7,8]. Satellites can continuously monitor soil moisture over a wide range and can be used to retrieve soil moisture products with high temporal resolution over large regions. These satellite products are ideal alternatives to in situ soil moisture measurements. Additionally, reanalysis soil moisture products have the advantages of long time series, wide coverage, and good spatiotemporal continuity. These reanalysis products are also widely used as alternatives to in situ soil moisture measurements, such as the European Centre for Medium-Range Weather Forecast (ECMWF) Reanalysis Interim (ERA-Interim) soil moisture products, the National Centers for Environmental Prediction/the National Center for Atmospheric Research(NCEP/NCAR) soil moisture products from the National Oceanic and Atmospheric Administration’s Cooperative Institute for Research in Environmental Sciences in the United States of America, etc. [9]. Although satellite and reanalysis soil moisture products are used to solve the problem of scarce data, there are still some shortcomings, such as coarse spatial resolutions and significant quality differences at different spatiotemporal scales. Moreover, the applicability and reliability of these products for the TP have not been systematically evaluated. Their spatial and temporal representativeness and accuracy also cannot be determined.
In recent years, researchers have compared some soil moisture products over the TP with sporadic in situ measurements. Su et al. [10] assessed the ECMWF reanalysis soil moisture products using observations from Naqu and Maqu. Chen et al. [11] evaluated the Global Land Data Assimilation Systems (GLDAS) soil moisture products in the central TP using in situ measurements from the Naqu observation network. Liu et al. [12] adopted the soil moisture observations from seven stations and one region (Naqu) across the TP to validate two reanalysis products and six land surface model products. However, because these studies rely on data from limited sites and these sites are located in the central and eastern plateau, some uncertainties exist regarding the evaluated results. Recently, the European Space Agency (ESA) released the latest version of microwave soil moisture products, the European Space Agency Climate Change Initiative Soil Moisture version 4.4 (ESA CCI SM v4.4). ESA CCI SM v4.4 extends the temporal coverage and includes two new sensors of SMOS and ASCAT, the latter of which is onboard the Meteorological Operational Satellite (MetOp-A). The level of accuracy and reliability of ESA CCI SM v4.4 over the TP is still not clear. Therefore, the latest version urgently needs to be validated over the TP.
The main objective of this study is to determine the accuracy of the latest ESA CCI SM v4.4 soil moisture products and the ECMWF Reanalysis 5 (ERA5) soil moisture product over the TP and to further identify the soil moisture changing trends and their relationship with precipitation and evaporation over the TP under the background of climate change. For this reason, a detailed evaluation of three microwave satellite soil moisture products (ESA CCI SM v4.4) and one reanalysis soil moisture product (ERA5) was carried out by using four soil moisture observing networks. Furthermore, the climatological soil moisture changing trends across the TP were explored.

2. Materials and Methods

2.1. Materials

In this paper, we utilized three kinds of soil moisture datasets, including a ground-based soil moisture dataset, a microwave satellite soil moisture dataset, and a reanalysis soil moisture dataset.
The ground-based soil moisture dataset was derived from four soil moisture observing networks at Maqu, Naqu, Ali, and Shiquanhe (Sq) (Figure 1), which represent different climatic and vegetation conditions. The Maqu and Naqu networks are covered uniformly by short grasslands and alpine meadows and are located in a cold humid climate zone and a cold semiarid climate zone, respectively. The Ali and Sq networks are located in a semiarid climate zone, typically characterized by a land cover of sparse grassland and bare land. At Maqu, the capacitance EC-TM ECH2O probes were used to measure the dielectric permittivity of the soil and obtained volumetric soil moisture with the standard calibration equation at different depths from 5 to 80 cm below the surface every 15 min [13,14]. At Naqu, the impedance ECH2O probes, which were installed horizontally at different depths from 2.5 to 60 cm below the surface, were used to monitor the soil moisture dynamics every 15 min. At Ali and Sq, the probes were installed horizontally at different depths from 5 to 80 cm below the surface, and the routine recording was set to every 15 min. More detailed information regarding the four networks can be found in the study by Su et al. [15]. Microwave soil moisture data can only reflect the soil moisture conditions of the top surface layer within a few centimeters. Therefore, considering the in situ data continuity, soil moisture data at 5 cm from 2010 were selected for comparison.
The microwave satellite soil moisture dataset used in this study was ESA CCI SM v4.4, released in November 2018. Compared with ESA CCI SM v3.3, ESA CCI SM v4.4 includes two new sensors—SMOS and ASCAT, the latter of which is onboard the MetOp-A. Moreover, ESA CCI SM v4.4 extends the temporal coverage of ESA CCI SM v3.3 to the end of June 2018. The dataset consists of three soil moisture products (an active product, a passive product, and a combined product) and provides daily surface soil moisture data with a spatial resolution of 0.25°. The active product is a merger of the Level 2 (L2) active microwave observations from the Active Microwave Instrument (AMI) C-band wind scatterometer and ASCAT. The L2 passive microwave observations from SMMR, SSM/I, TRMM, TMI, AMSR-E, WindSat, the Advanced Microwave Scanning Radiometer 2 (AMSR2), and SMOS are merged into the passive product. The combined product is generated by fusing the abovementioned L2 active and passive microwave observations. Applying a cumulative distribution function (CDF) matching approach, all L2 active and passive observations are rescaled with the respective corresponding reference dataset, i.e., ASCAT observations for active observations and AMSR-E observations for passive observations. In particular, the Noah-simulated soil moisture is considered to be the reference dataset for the combined product [16]. For the merging process, first the CDF curves of the Noah and L2 active and passive microwave observations were obtained. Then, the CDF curves were divided into 12 segments at 5% intervals and a linear regression analysis for each segment performed. Subsequently, the linear equations were used to rescale data for different segments. Ultimately, the rescaled active and passive microwave observations were fused into a combined product based on the weighted average of the error variance estimates for the rescaled individual observations [17,18]. The combined and passive products are provided in volumetric units [m3/m3], while the units of active product are degree of saturation [%]. As the absolute volumetric soil moisture can be obtained by multiplying the relative soil moisture and soil porosity [1,19], in order to be compatible with the other two products and in situ measurements, the active product was rescaled to volumetric soil moisture by adopting the soil porosity data from the Land Surface Atmospheric Boundary Interaction Product Ancillary Soil Moisture data L3 V1 (LANDMET_ANC_SM). LANDMET_ANC_SM data can be downloaded from the National Aeronautics and Space Administration (NASA)’s Goddard Earth Sciences Data and Information Services Center (GES DISC) (https://disc.gsfc.nasa.gov/datasets).
ERA5 is the fifth and latest global climate reanalysis dataset produced by ECMWF (after the First Global Atmospheric Research Program (GARP) Global Experiment (FGGE), the ECMWF Reanalysis 15 (ERA15), the ECMWF Reanalysis 40 (ERA40), and ERA-Interim). The ERA5 is currently available for the period from 1979 to the present, providing many atmospheric, land-surface, and sea-state parameters on an hourly basis. Compared with ERA-Interim, the ERA5 4D-Var data assimilation system in the Integrated Forecasting System (IFS Cycle 41r2) was improved with many modifications, representing a decade of research and development in modeling and data assimilation. The ECMWF IFS model consists of soil moisture (units: m3/m3) for four layers with different depths (0–7, 7–21, 21–72, and 72–189 cm) [9,20]. Only the upper layer (0–7 cm) of soil moisture was used for comparison in this study.
We also used the Finer Resolution Observation and Monitoring of Global Land Cover (FROM-GLC) maps released by Tsinghua University in September 2018 to draw Figure 2. The FROM-GLC maps have a fine spatial resolution of 30 m produced by using Landsat Thematic Mapper (TM) and Enhanced Thematic Mapper Plus (ETM+) data. A unique land cover classification system developed for the FROM-GLC can be cross-walked to the United Nations Food and Agriculture Organization (FAO) and the International Geosphere-Biosphere Programme (IGBP) land cover classification systems. More detailed information for the FROM-GLC maps can be found in the study of Gong et al. [21].

2.2. Methods

Trend correlation analysis and the Mann–Kendall (M–K) nonparametric test were used in this paper. The details are given below.
To investigate interannual change of soil moisture, a tendency correlation analysis was applied to evaluate the tendency correlation by the correlation coefficient rxt between soil moisture and time in the plateau [22].
r xt = i = 1 n ( x i x ¯ ) ( i t ¯ ) i = 1 n ( x i x ¯ ) i = 1 n ( i t ¯ )
where n is the total number of years, xi is the value of the soil moisture in the ith year, and x ¯ = 1 n i = 1 n x i ,   i = 1 , 2 , 3 , , n ; t ¯ = 1 n i = 1 n i . When rxt is positive, the soil moisture tends to increase linearly, and vice versa.
For the time series trend analysis, the trend test applied in this study was the M–K nonparametric test, which is a rank-based procedure suitable for detecting nonlinear trends. Here, the M–K analysis was performed at the station to detect soil moisture changing trends, as defined below [23].
First, for a time series X with n samples, to construct an order column,
S k = i = 1 k r i   , k = 2 , 3 n .
where r i = { 1 , x i > x j 0 , e l s e ,   j = 1 , 2 i . Sk is a cumulative number of values at the ith time higher than at the jth time.
Assuming that the time series are randomly independent, the statistics are defined as follows:
UF k = s k E ( s k ) V a r ( s k ) ,   k = 1 , 2 n .
where UF 1 = 0 ,   E ( s k ) = n ( n + 1 ) 4 ,   V a r ( s k ) = n ( n 1 ) ( 2 n + 5 ) 72 .
Then, the time series X is arranged in reverse order and calculated according to the above Equations (2) and (3); the series is defined below:
{ U B k = U F k k = n + 1 k ,   k = 1 , 2 n .
If UFk is positive (negative), the sequence exhibits an upward (downward) trend. Given the level of significance α, if |UFk| > Uα, the sequence trend changes remarkably. UBk is used to assist UFk in judging the abrupt change point.
To characterize the accuracy of different soil moisture products, three error metrics, the mean bias error (MBE), the correlation coefficient (R), and the ratio of the standard deviation (σ), were used in this paper, as defined below [24].
MBE = i = 1 i = N ( M i O i ) N ,
R = 1 N i = 1 N ( M i M ¯ ) ( O i O ¯ ) 1 N i = 1 N ( M i M ¯ ) 2 1 N i = 1 N ( O i O ¯ ) 2 ,
σ = ( i = 1 i = N ( M i M ¯ ) 2 N 1 ) 1 / 2 ,
where N is the total number of days, Mi is remote sensing or reanalysis soil moisture, Oi is the in situ soil moisture, and M ¯ = i = 1 N M ,   O ¯ = i N O ,   i = 1 , 2 , 3 ,   , N .
The Taylor diagram can represent three different statistical results (σ, R, and unbiased root-mean-square error (ubRMSE)) and accordingly was used to show the degree of deviation between satellite or reanalysis soil moisture products and the in situ observations in different observing networks. The in situ observation is regarded as the reference point on the x-axis, and the distance to this point is the ubRMSE, as defined below [25].
ubRMSE = σ M 2 + σ O 2 2 σ M σ O R
It should be noted that the differences in the sample size can influence the correlation coefficients and the validation results for different soil moisture products. Hence, we evaluated the four soil moisture products under the premise of keeping the sample size equal.

3. Results

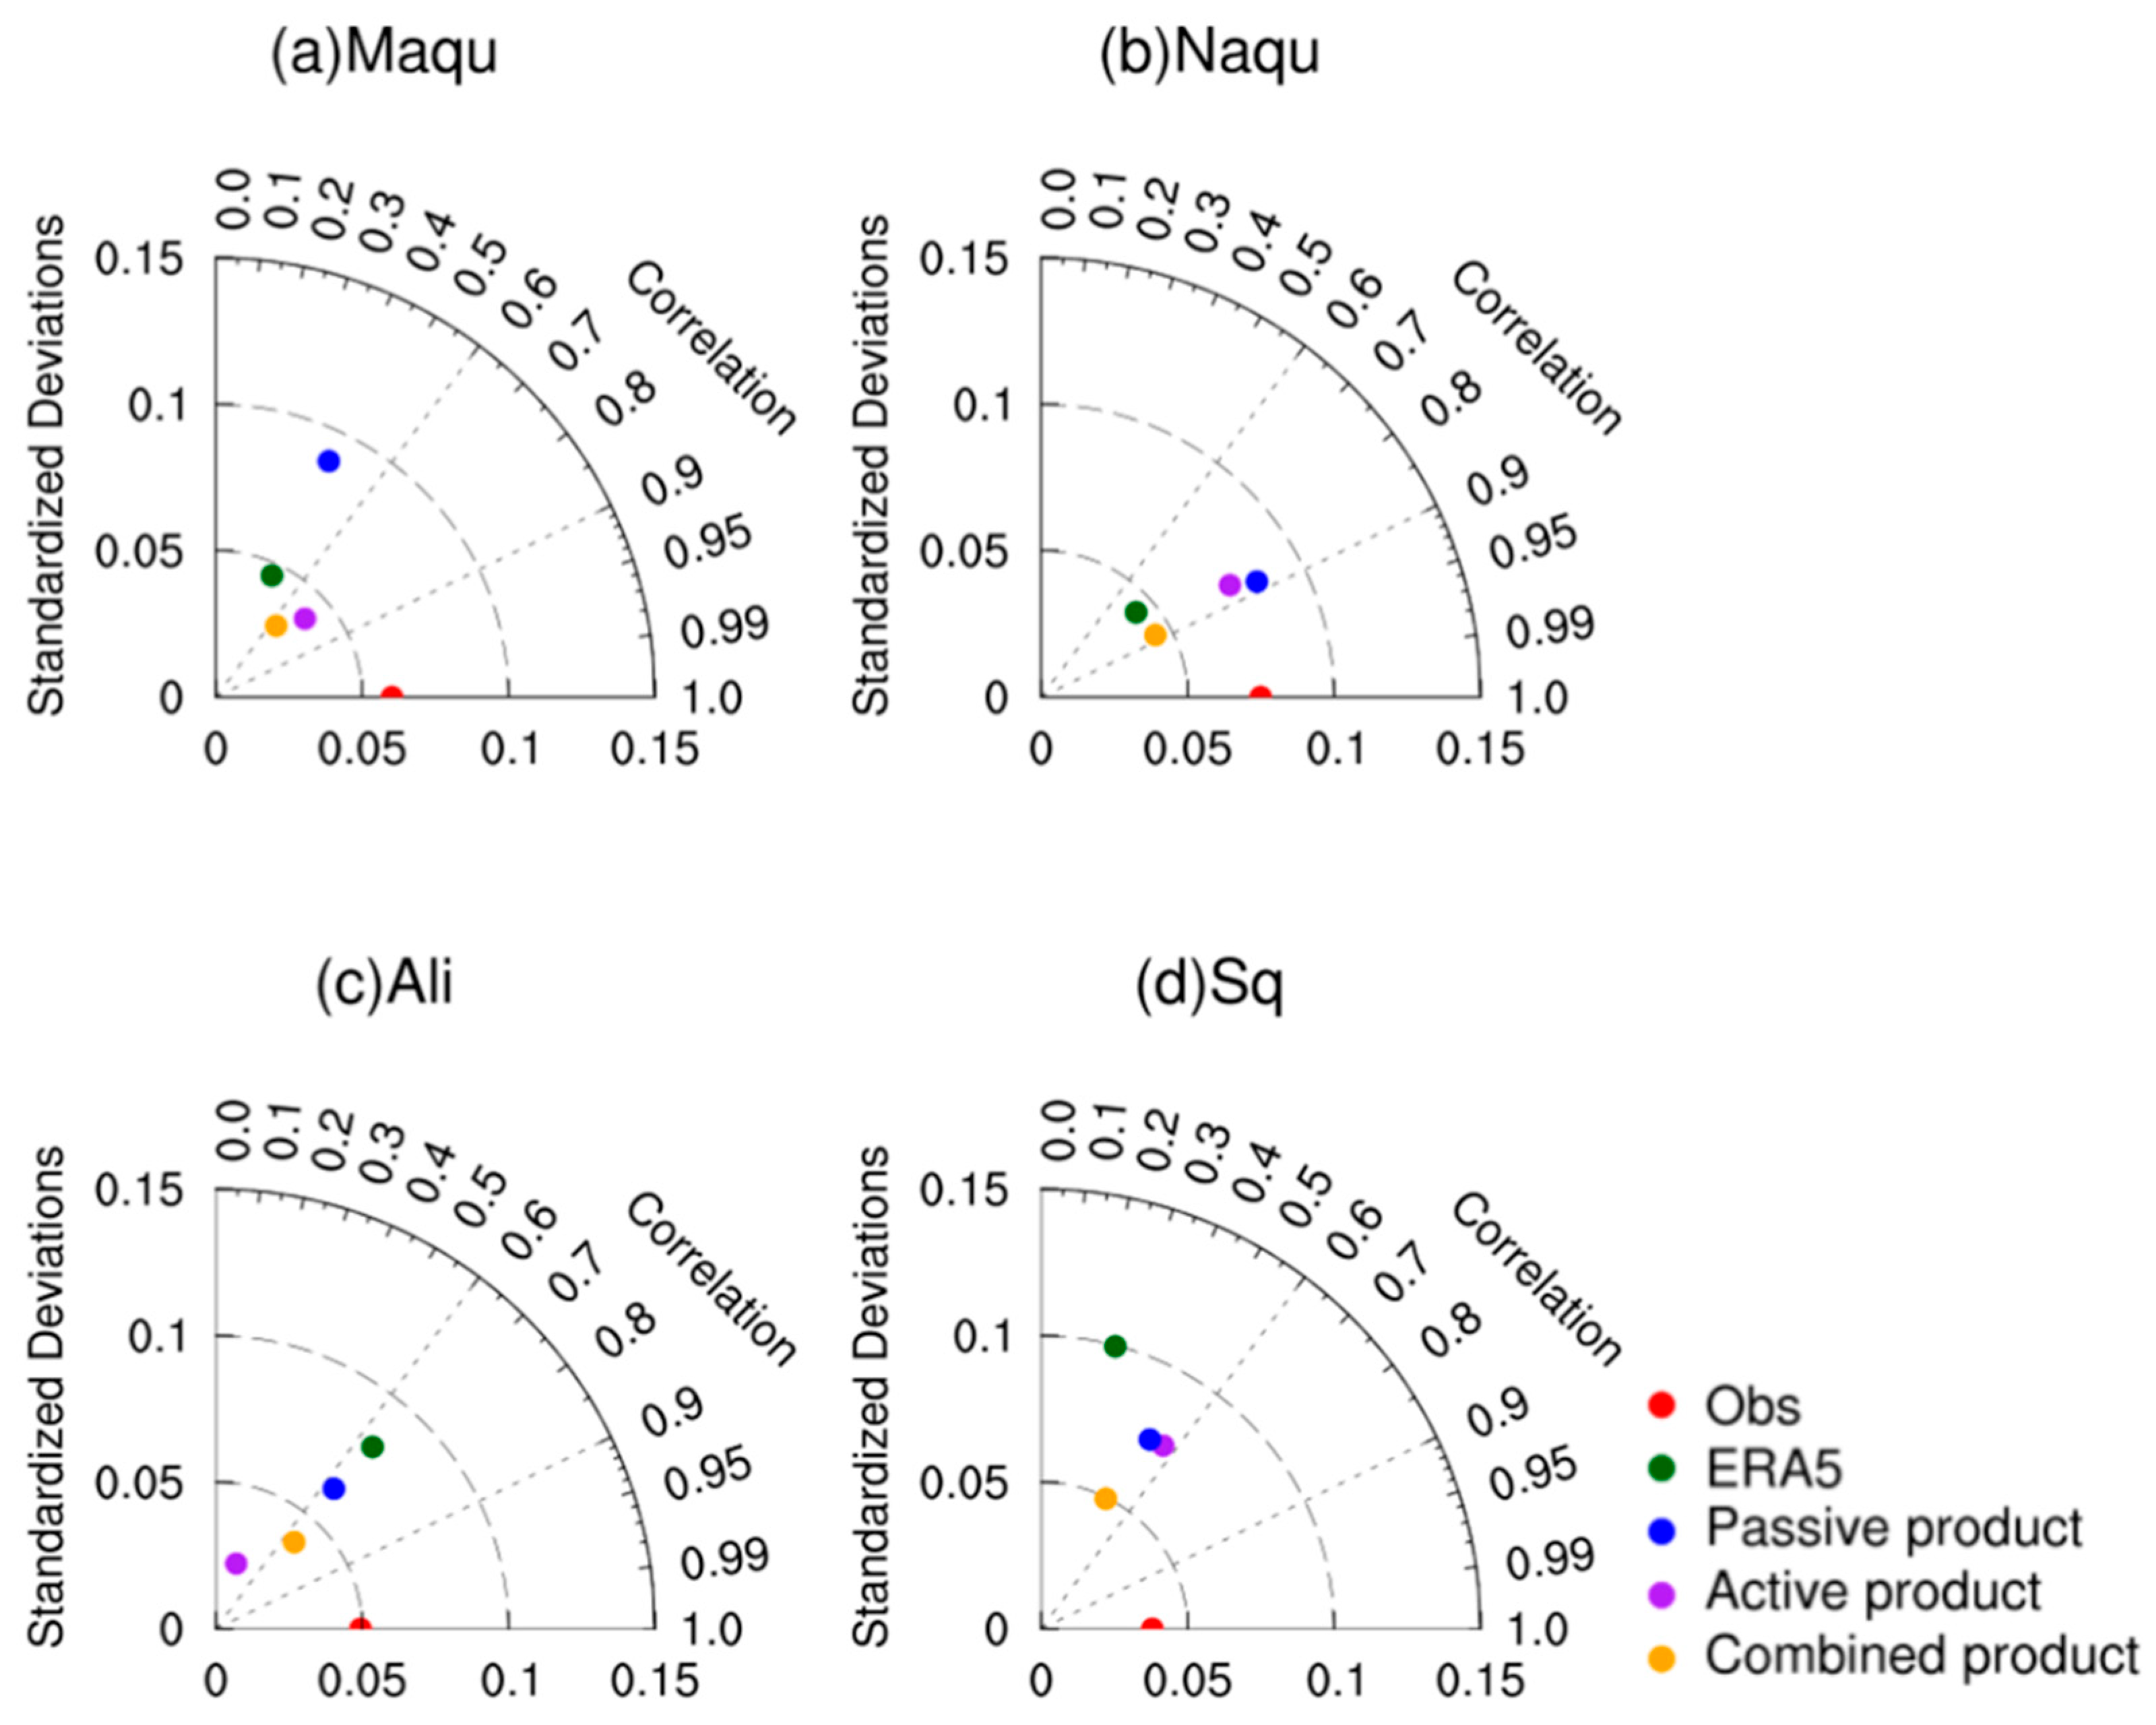
3.1. Precision Verification

Because of the different temporal resolutions of the ground-based, satellite-based, and reanalyzed soil moisture products, these products were initially processed into daily averages. Additionally, it was necessary to spatially average the in situ measurements inside all pixels to reduce the errors from the scale mismatch. Based on the abovementioned approach, the pixels were numbered from top to bottom and from left to right (Figure 2). Maqu and Sq include 20 stations in 9 pixels and 15 stations in 3 pixels, respectively (Figure 2a,d). Naqu contains 5 sites distributed in 2 pixels (Figure 2b). Ali has a total of 4 sites distributed in 2 pixels (Figure 2c).
The statistical metrics (σ, R, and ubRMSE) were shown in a Taylor diagram (Figure 3). At Maqu, the active and combined products showed strong positive correlations with in situ measurements (R > 0.6), while the ubRMSE of the active product was the smallest (ubRMSE = 0.04 m3/m3) (Figure 3a). This indicates that the active product is superior to the other three products. Previous studies found that the quality of the active product is good in this region covered by short grasslands and alpine meadows [17,26]. At Naqu, four soil moisture products (combined, active, passive, and ERA5) displayed good results in terms of the correlation coefficient (R > 0.7), while the passive product performed the best with the smallest ubRMSE value of 0.039 m3/m3 and the largest R value of 0.88 (Figure 3b). Similarly, at Ali and Sq, the precision of the combined product was optimal, showing the smallest ubRMSE value of 0.037 m3/m3 and 0.047 m3/m3, respectively (Figure 3c,d). It can be observed that the accuracy of the soil moisture product was closely related to the specific observation network. Overall, the combined product performed the best (ubRMSE = 0.043 m3/m3, R = 0.66), followed by the active product (ubRMSE = 0.048 m3/m3, R = 0.62), the passive product (ubRMSE = 0.06 m3/m3, R = 0.61), and the ERA5 soil moisture product (ubRMSE = 0.067 m3/m3, R = 0.52).
To better understand the seasonal soil moisture variation, the temporal behavior and the scatter plots of the four soil moisture products (combined, active, passive, and ERA5) in 2010 were investigated for each network in Figure 4. The error statistics of the four soil moisture products for each network were also listed in Table 1.
At Maqu, the four soil moisture products captured the seasonal variation of surface soil moisture caused by the Asian monsoon well. However, the combined product significantly underestimated the surface soil moisture, which is shown by the negative MBE value in Table 1. The reason for this underestimation is that the soil moisture was underestimated in the Noah model used in the CDF matching process [27]. The ERA5 soil moisture product displayed a significant overestimation of the surface soil moisture in spring and winter. This is because during the frozen period, the ERA5 soil moisture data provide both liquid and solid water content, whereas the in situ sensor only measures liquid water [10]. Compared with the other three products, the active product was closest to the in situ observations with the smallest ubRMSE value of 0.04 m3/m3, as shown in Table 1. Active sensors applied the TU Wien change detection algorithm to convert the backscatter measurements into soil moisture. The TU Wien model corrected the influence of vegetation growth and decay by extracting the vegetation-sensitive signature from the backscatter measurements. As a result, the active product showed good performance at Maqu [5,28] (Figure 4a,b).
At Naqu, similar to Maqu, the combined product underestimated the surface soil moisture, as shown by the negative MBE value in Table 1, and this underestimation was similarly caused by the underestimation of the soil moisture in the Noah model [11]. The overestimation of the ERA5 soil moisture product was also observed in winter, though the magnitude of overestimation was slighter than that at Maqu. Overall, the four soil moisture products were able to capture the seasonal variation pattern of the surface soil moisture, which is in good agreement with the results showing that the R values were between 0.746 and 0.882, as shown in Table 1 (Figure 4c,d).
At Ali, the active product underestimated the surface soil moisture, with negative MBE values of −0.129 m3/m3 and the lowest R value of 0.299. Dente et al. [1] pointed out that the poor correlation results from the high elevation (4000–5000 m) and long winter period of this network. Additionally, several studies demonstrated that this underestimation may be due to the systematic retrieval error that occurs when the soil is extremely dry [19]. The passive product significantly overestimated the surface soil moisture at Ali and Sq with MBE values of 0.183 m3/m3 and 0.039 m3/m3, respectively. This overestimation is attributed to the inaccurate surface temperature retrieval in the land parameter retrieval model (LPRM) algorithm for passive sensors described by Chen et al. [11] and Su et al. [15]. Different from the underestimation at Maqu and Naqu, the combined product overestimated the soil moisture at Ali and Sq, especially at Ali where the MBE value was as high as 0.108 m3/m3. In the merging process, the weighted average of the passive microwave observations was larger than that of the active observations, whereas the soil moisture was overestimated in the passive microwave observations. In contrast with the overestimation at Maqu and Naqu in winter, the ERA5 soil moisture product was close to the in situ soil moisture at Ali and underestimated the soil moisture at Sq. We speculate that this result is related to the mismatch of the soil sampling depth between ERA5 (0-7 cm) and the in situ soil moisture measurement (5 cm), together with the arid land cover conditions at these two sites (Figure 4e–h). Overall, the ERA5 soil moisture product distinctly outperformed the other three products in terms of data continuity.
Moreover, some high soil moisture values can be found from the satellite and ground measurements at Maqu and Naqu. The soil organic matter content may play a key role in these results. Chen et al. [11] and Su et al. [15] indicated that Maqu and Naqu have high organic matter contents. For example, some stations within the Maqu observing network are located in the wetland where organic matter contents can be higher than 130 g/kg. High soil organic matter contents represent large soil porosity and water holding capacity. Additionally, some high soil moisture values occur because the thawing process of the seasonally frozen soil can also influence the surface soil moisture.
The units of mean bias error (MBE), σ, and the unbiased root-mean-square error (ubRMSE) are m3/m3.

3.2. Spatial Variation

The soil moisture spatial pattern for each product in summer (June, July, and August) of 2010 is shown in Figure 5. All four products were able to capture the general spatial distribution characteristics of soil moisture over the TP. Soil moisture decreased gradually from the southeast to the northwest, which is related to the spatial distribution of precipitation and is in accordance with the underlying land cover types. The precipitation across the TP decreased gradually from the southeast to the northwest (Figure 6). From the perspective of the underlying surface types, the TP has a gradual transition from forest to meadow, grassland, and desert from the southeast to the northwest [22].
In addition, there were considerable discrepancies regarding the soil moisture magnitudes of the four products. The maximum values of the active and combined soil moisture products were approximately 0.5 m3/m3 (Figure 5a,c), while that of the passive and ERA5 soil moisture products could reach approximately 0.7 m3/m3 (Figure 5b,d). One possible reason for this result might be the mismatch between the model top layer depth or the microwave penetration depth and the in situ soil moisture depth (5 cm). In this study, the top layer depth chosen for the ERA5 soil moisture product was 0-7 cm, while the satellite microwave effective soil moisture sampling depth at L-band and C-band was 3–5 cm and 1–2 cm, respectively [29]. With respect to the active product, the soil porosity data used in the unit convert was also an important factor that may have affected the magnitude of the active product. On the whole, the magnitudes of the active and combined soil moisture products were relatively narrower than those of the passive and ERA5 soil moisture products.
Moreover, for the passive product, numerous default values occurred in the northwest and southeast of the TP (Figure 5b). This result is likely related to the frozen soil and vegetation cover in this region. The LPRM adopts an empirical regression model to estimate the land surface temperature, which is used to distinguish unfrozen and frozen conditions. Theoretically, an underestimation of the land surface temperature will result in an overestimation of soil emissivity, further leading to an underestimation of soil moisture [30,31]. Concerning the northwest of the plateau, which was widely distributed with frozen soil, the pixels where the LPRM’s land surface temperature retrievals were observed to be at or below 0 °C, were flagged and assigned as default values. Coupled with the inaccurate land surface temperature retrievals derived from the LPRM over the TP, a large number of default values were likely to occur in this region. This point also demonstrates that the active product was not suitable for use in the frozen soil zones, because it confused the frozen soil with soil moisture. In addition, vegetation also affected the passive microwave observations by attenuating the radiation from the soil and emitting radiation from the vegetation canopy. Thus, when the vegetation cover density reached a certain point, the emitted soil radiation became totally masked. As a result, substantial default values existed under a sufficiently dense canopy in the southeast plateau [32,33].

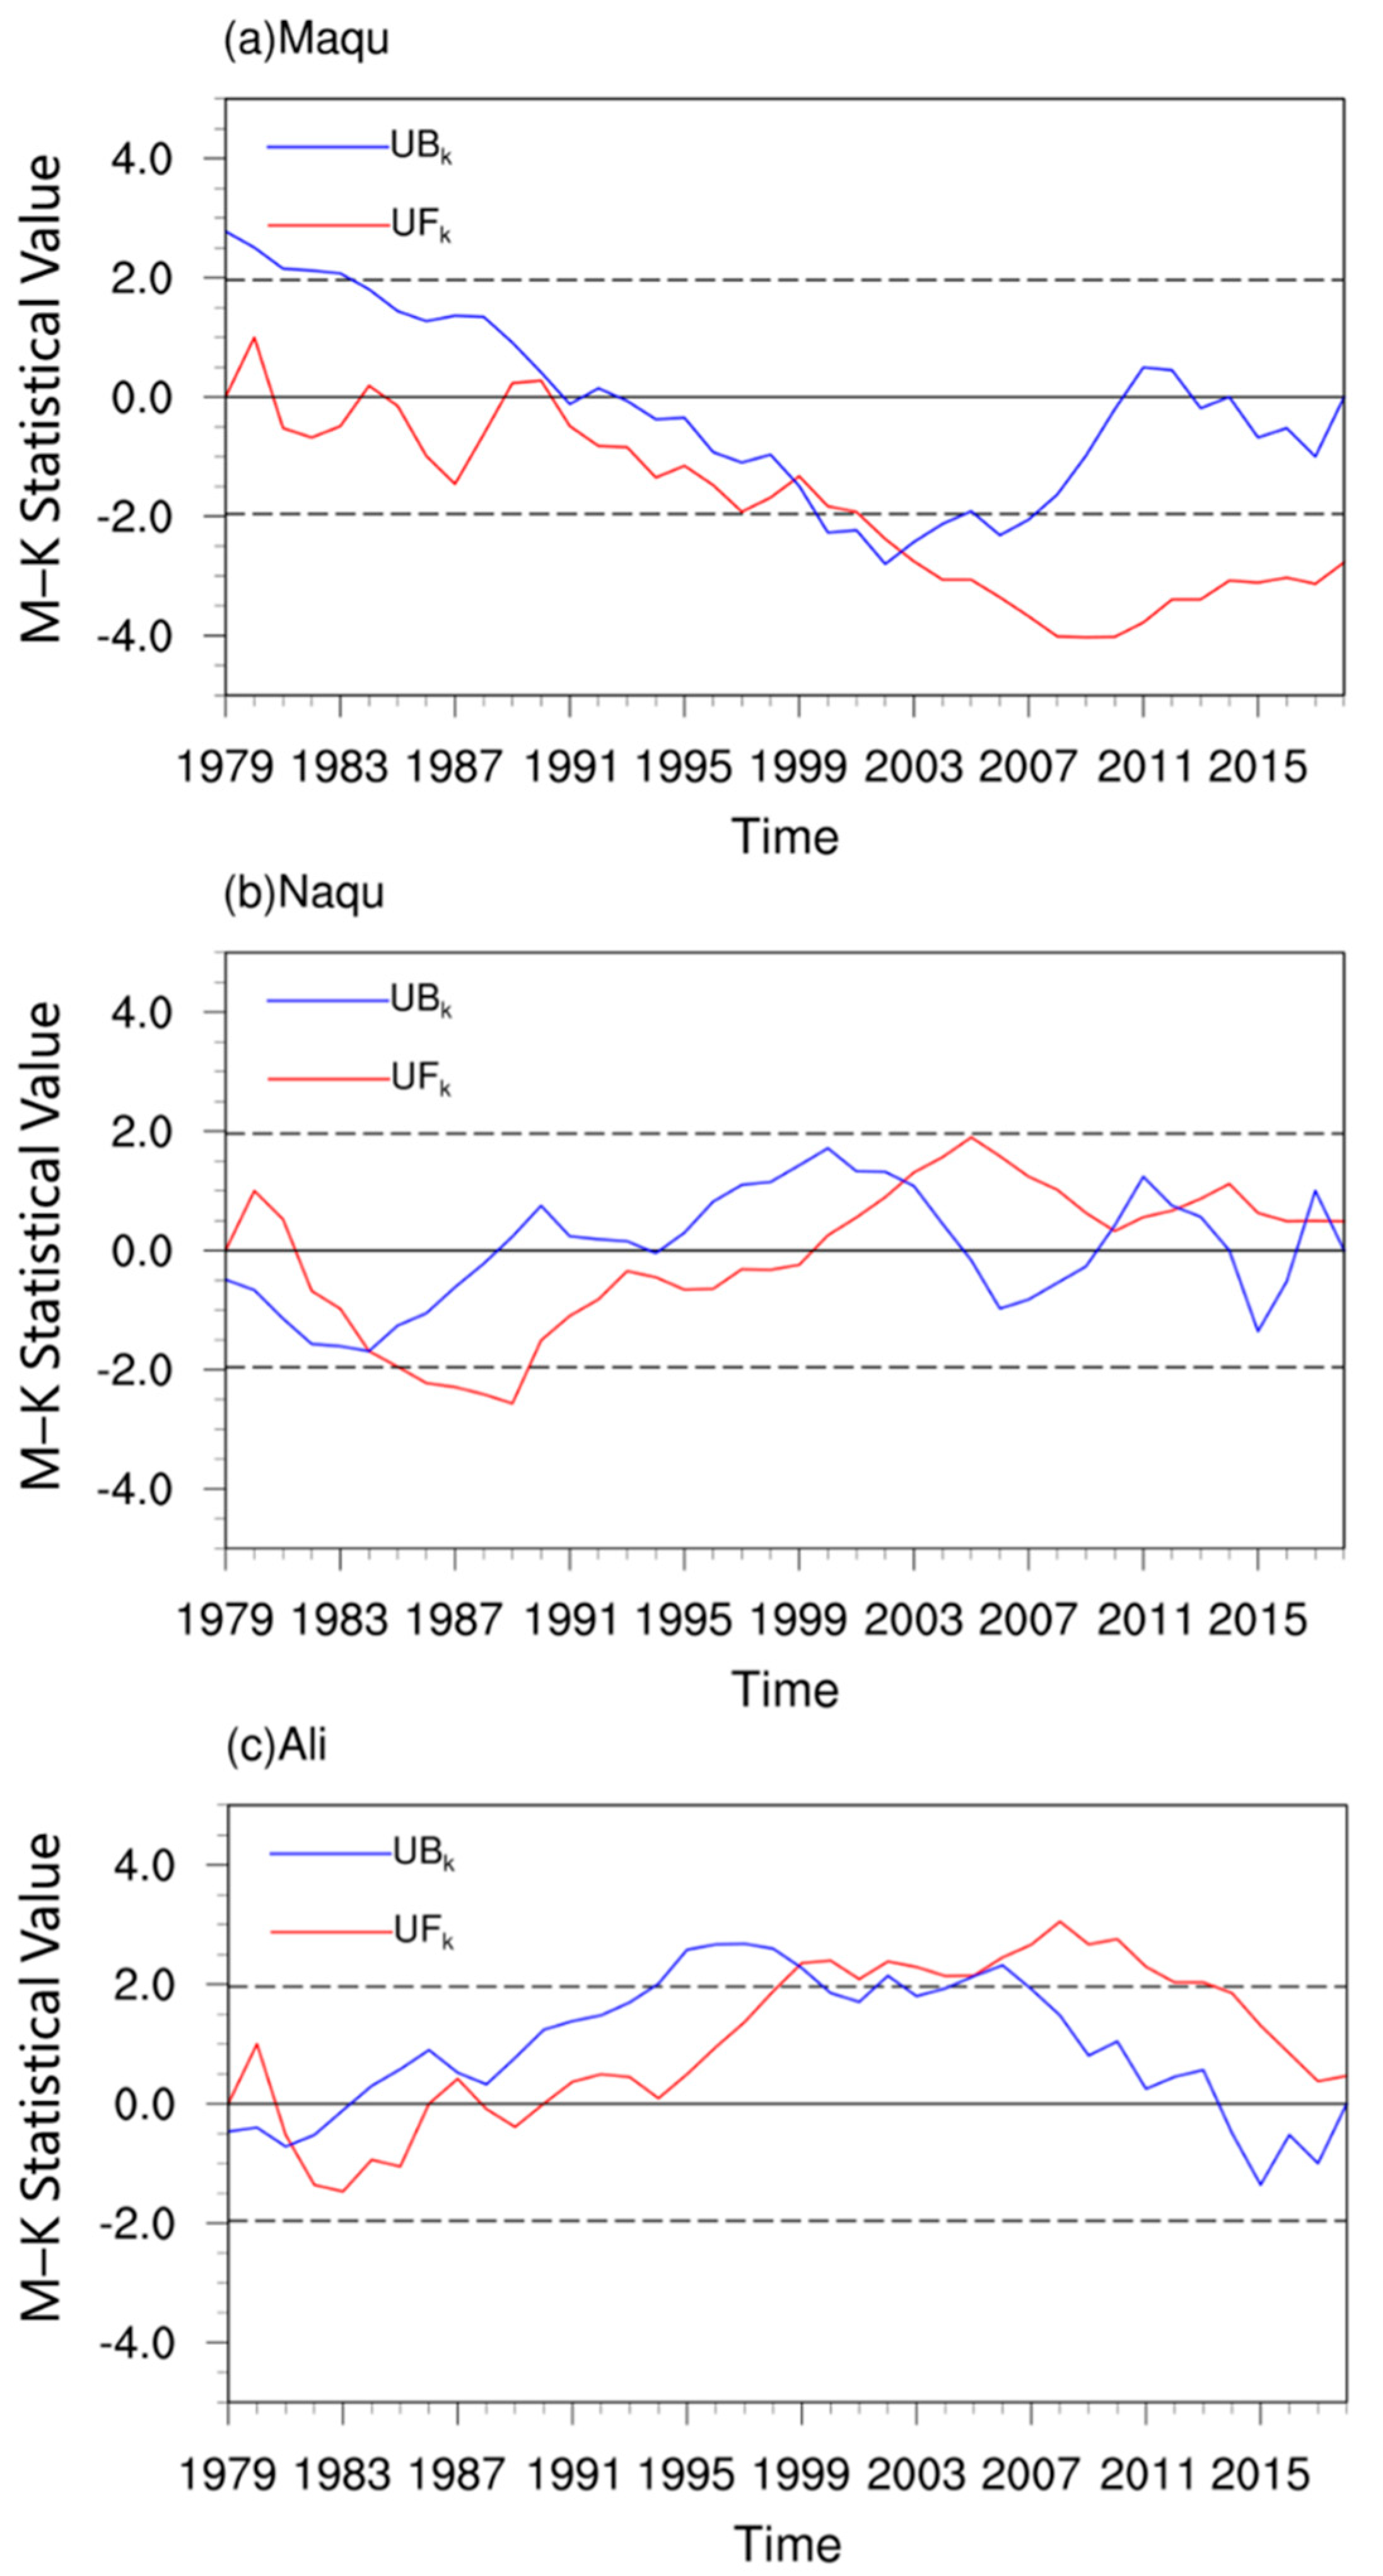
3.3. Long-Term Trend Analysis

The warming and wetting trends of the TP have been reported in the context of global warming. As a key variable in the process of land–atmosphere energy and water exchange, soil moisture plays a key role by influencing the exchanges of water between the atmosphere and land surface and determining the proportion of precipitation between infiltration and runoff. Meanwhile, it also plays a critical role in the surface energy budget by influencing the land–atmosphere sensible heat flux and latent heat flux transfer. However, the long-term changing trend of soil moisture is not clear, and accordingly, its investigation is necessary and important.
Although the precision of the ERA5 soil moisture product is not optimal, taking into account the data continuity over space and time, the ERA5 soil moisture product covering from 1979 to 2018 was selected to investigate the long-term variation trend of soil moisture over the TP by using tendency correlation analysis (Figure 7). Except for the eastern regions and the northwestern tail of the TP with negative correlations, the soil moisture was positively correlated with time in the remaining areas over the TP. According to the statistical results, the soil moisture in 58.72% of the total plateau territory tended to increase, while approximately 41.28% of the total area showed a decreasing trend. In general, the soil moisture over the TP tended to increase. However, it should be noted that the long-term trend result computed from ERA5 reanalysis data can suffer from biases due to the inhomogeneity of the observational system in the assimilation procedure.
The variation trend of soil moisture varies depending on the different climatic and land surface conditions. Therefore, the interannual soil moisture variations were compared in different network regions using the ERA5 soil moisture data from 1979 to 2018. Figure 8 shows the comparison results using a M–K nonparametric test. In humid Maqu, the soil moisture showed a descending trend in general with UFk < 0, which went down significantly after 2001, with UFk < U’α, indicating that Maqu was trending towards a transition from wetness to dryness (Figure 8a). For semiarid Naqu, the soil moisture basically decreased before 2000 and, after that, tended to increase, but both of these trends were not obvious, because the UFk values were generally between U’α and Uα (Figure 8b). In terms of arid Ali, the soil moisture decreased before 1990 and then subsequently increased. Specially, the soil moisture increased rapidly between 1990 and 2014, with UFk > Uα. This finding suggests that Ali was trending towards a transition from dryness to wetness (Figure 8c).
To further explain the spatial heterogeneity of the soil moisture variation, a tendency correlation analysis was carried out for the precipitation and evaporation using the ERA5 precipitation and evaporation data from 1979 to 2018 across the TP (Figure 9). Except for the small eastern and southern areas with weakly negative correlations, the precipitation was positively correlated with time for most areas over the TP, especially for the northwestern plateau. Generally, the precipitation tended to increase (Figure 9a). As shown in Figure 9b, the evaporation was negatively correlated with time in rather large areas of the TP. That means that the evaporation tended to decrease in general.
Further, in contrast with Figure 7, it could be observed that in the regions where the soil moisture increased, the corresponding precipitation increased, whereas the evaporation decreased. That is, the changes in the overall precipitation and evaporation were consistent with the overall soil moisture for the entire TP, indicating that the precipitation and evaporation were the two main factors contributing to the soil moisture variation. Additionally, in the context of global warming, the retreat of the cryosphere is also an unneglectable factor with respect to the soil moisture variation in the ‘Third Pole’ region, where frozen soil is widely distributed. According to statistics, the area of glaciers over the TP and its surrounding regions shrunk by an average of 15% from 1970 to 2008 [34]. At the same time, the thickness of the active layer in the permafrost regions of the TP increased, and the thickness of the permafrost decreased.

4. Discussion

To utilize the ESA CCI SM v4.4 and ERA5 soil moisture products reasonably in the future, it is critical to assess their quality. Furthermore, attention should also be paid to factors that might affect the accuracy of these soil moisture products in order to aid in their improvement and application.
Regarding the combined product, it was observed that the combined product underestimated the surface soil moisture at Maqu and Naqu. This outcome was mostly caused by the underestimation of the simulated soil moisture from the Noah model used in the CDF matching process, which was been reported by Chen et al. [11], Bi et al. [27], and Yang et al. [35]. Given this information, an accurate simulated soil moisture dataset for the TP needs be used in the CDF to achieve a high-quality combined product. Furthermore, it was observed that the combined product had spatial and temporal gaps, which is in accordance with the conclusion drawn by Liu et al. [17], who pointed out that the gaps are primarily attributed to satellite orbits and swath widths. In the coming years, filling these gaps will be a necessity.
Vegetation can influence the radar backscattering signal by absorbing part of the microwave emission from the soil surface and emitting it. With respect to the active product, the active observations are retrieved from the C-band (4–8 GHz). Compared with the optimal L-band (1–2 GHz) microwave range for soil moisture retrieval reported by many studies [5,6,9,29,32], the higher frequency of the C-band corresponds to a shallower soil layer (1–2 cm), as well as greater vegetation attenuation and atmospheric effects, which was reported by Yee et al. [8] and Berger et al. [36]. Therefore, vegetation canopy has a great impact on the active product. The correction of vegetation effects is a key issue for reliable soil moisture retrieval. Additionally, the precision of the soil porosity data used to convert the degree of saturation (%) into volumetric soil moisture (m3/m3) is also an important factor. The soil properties data (the soil porosity, soil texture, the percentages of sand, silt, clay, and so on) are derived from the FAO dataset. These soil properties determine the soil storage capacity and the transport process within the soil [37]. However, some studies have pointed out that the FAO soil properties data have large uncertainties. Bi et al. [27] compared the soil porosity from the FAO data with that from the soil database developed by Wei et al. [38] for the TP. Before comparison, Wei et al. [38] evaluated their soil database by using the Harmonized World Soil Database (HWSD) as a reference and found that their soil database was superior to the HWSD. The result showed that the FAO data are questionable and not applicable to the TP, which is attributed to the fact that, since the 1950s, data from the China national soil surveys have hardly been used in the FAO dataset development. In this study, the active product was converted into volumetric soil moisture by means of adopting the soil porosity data from the LANDMET_ANC_SM data, even though the quality of LANDMET_ANC_SM data are not clear, as this dataset has not been systematically evaluated. Other evaluated porosity datasets, such as the soil database developed by Wei et al. [38], could be considered to convert the active product. However, currently, an accurate and available soil porosity dataset cannot be obtained over the TP even though some efforts to obtain a more accurate soil dataset for the TP have been made.
As for the passive product, the existence of numerous default values over the TP was mainly due to the inaccurate correction for the land surface temperature in the soil moisture retrieval algorithms and dense vegetation cover. For the land surface temperature obtained from the LPRM model, ground measurements mainly from the United States and some European countries were used to establish the LPRM model [39]. As a result, this model may be inapplicable outside these regions, especially for regions such as the TP that has complicated geographical environments and climate conditions. Zeng et al. [39] also demonstrated that the LPRM land surface temperature retrievals over the TP are not very accurate and may introduce large errors. The passive observations are highly susceptible to the land surface temperature. Accordingly, the effects of land surface temperature must be seriously considered for reliable passive soil moisture retrieval in the future [32,40]. In addition, surface roughness has some effects on the passive product. Surface roughness can increase the surface soil emissivity by increasing the surface areas, causing underestimation of the soil moisture [31]. However, the LPRM algorithm for the passive product assumes that surface roughness is constant for the entire TP, which distinctly disagrees with the fact that the variability of surface roughness is large over the TP and accordingly introduces some errors [15]. The correction of surface roughness is a problem that must still be resolved.
Many studies have shown the wide application of soil moisture data. For instance, Zampieri et al. [41] used the ground-based soil moisture data to validate the modified community land model. Qiu et al. [42] exploited the readily available soil moisture dataset from the ESA CCI SM product, ERA-Interim/Land reanalysis, and agro-meteorological network observations to examine the long-term soil moisture trend over China. Zampieri et al. [43] adopted the ESA CCI SM product to compare the standardized precipitation evapotranspiration index and the standardized river discharge index. In future work, we will focus on other possible applications of the soil moisture products, such as climate variability and change assessment, hydrological and land surface modeling, and drought monitoring.
In this paper, many factors, such as the climate zone, underlying surface conditions, and data continuity, were taken into account to make the in situ measurements more representative. Nevertheless, sparse and uneven distributed sites can bring some uncertainties, especially over the TP, with its very complex topography. Differences in the sampling time and discrepancies in the soil depth represented by the microwave satellite and reanalysis soil moisture products may introduce deviation to a certain extent [44]. In future studies, from the conversion of the point scale into the pixel scale or grid scale, the weighted spatial average of the in situ soil moisture can be used as a ground reference to minimize errors [45]. At the same time, strengthening the construction of the soil moisture observation networks for the TP is also a top priority.

5. Conclusions

In this study, based on the soil moisture data from observation networks at Maqu, Naqu, Ali, and Sq, the accuracy and reliability of three satellite-derived soil moisture products (ESA CCI SM v4.4) and one reanalysis soil moisture product (ERA5) were evaluated. The characteristics of spatial distribution and long-term changing trends in soil moisture were explored. The following conclusions can be drawn.
All four soil moisture products (combined, active, passive, and ERA5) reasonably reflected the seasonal variation of soil moisture. The ERA5 soil moisture product was superior to satellite-derived products in terms of data continuity. From the perspective of spatial distribution, all four products generally captured the spatial characteristics of soil moisture—soil moisture gradually decreased from southeast to northwest across the TP. The magnitudes of the active and combined products were relatively narrower than those of the passive and ERA5 soil moisture products.
On the whole, the combined product performed the best (ubRMSE = 0.043 m3/m3, R = 0.66), followed by the active product (ubRMSE = 0.048 m3/m3, R = 0.62), the passive product (ubRMSE = 0.06 m3/m3, R = 0.61), and the ERA5 soil moisture product (ubRMSE = 0.067 m3/m3, R = 0.52). The combined product outperformed the active and passive products. This result confirms that merging the active and passive soil moisture products for the TP is an effective way to enhance a single microwave satellite soil moisture product. Additional soil moisture products, such as the Soil Moisture Active Passive mission and the Chinese Fengyun-3B mission, can be used to improve and extend the combined product in the future. The inclusion of these additional products could be beneficial for understanding the land–atmosphere interactions of the TP, as the ESA CCI SM product can provide soil moisture observations over a span of nearly 40 years.
According to time series analysis of the ERA5 soil moisture product, the soil moisture across the TP tended to increase in general, which matched with the overall increasing precipitation and decreasing evaporation. In addition, the shrinkage of the cryosphere may affect the soil moisture change and requires further investigation in future studies.

Author Contributions

Conceptualization: M.C., L.Z., and Y.M.; methodology: M.C.; software: M.C. and L.Z.; validation: M.C., L.Z., and M.Z.; formal analysis: M.C. and N.G.; investigation: X.W.; resources: L.Z.; data curation: Y.H.; writing—original draft preparation: M.C.; writing—review and editing: L.Z. and Y.M.; visualization: M.C. and M.Z.; supervision: M.C. and N.G; project administration: L.Z.; and funding acquisition: L.Z.

Funding

This research was jointly funded by the Strategic Priority Research Program of the Chinese Academy of Sciences (grant no. XDA20060101), the National Natural Science Foundation of China (grant nos. 41875031, 41522501, 41275028, 41661144043, 91837208), the Chinese Academy of Sciences (grant no. QYZDJ-SSW-DQC019), CLIMATE-TPE (ID 32070) in the framework of the ESA-MOST Dragon 4 Programme and Jiangsu Collaborative Innovation Center for Climate Change.

Acknowledgments

The ERA5 soil moisture product is available at https://apps.ecmwf.int/data-catalogues/era5/?class=ea. The ESA CCI SM v4.4 soil moisture product can be obtained at https://www.esa-soilmoisture-cci.org. The global land cover maps of 30-m resolution can be downloaded at http://data.ess.tsinghua.edu.cn/. The authors would like to acknowledge ESA and ECMWF for providing the soil moisture datasets and Tsinghua University for providing the land cover maps. Meanwhile, the authors would like to thank the Institute of Tibetan Plateau Research, the Chinese Academy of Sciences, the Northwest Institute of Eco-Environmental Resources, the Chinese Academy of Sciences, and the University of Twente for providing the in situ soil moisture observations.

Conflicts of Interest

The authors declare no conflicts of interest.

References

  1. Dente, L.; Vekerdy, Z.; Wen, J.; Su, Z. Maqu network for validation of satellite-derived soil moisture products. Int. J. Appl. Earth Obs. 2012, 17, 55–65. [Google Scholar] [CrossRef]
  2. Dorigo, W.A.; Gruber, A.; De Jeu, R.A.M.; Wagner, W.; Stacke, T.; Loew, A.; Albergel, C.; Brocca, L.; Chung, D.; Parinussa, R.M.; et al. Evaluation of the ESA CCI soil moisture product using ground-based observations. Remote Sens. Environ. 2015, 162, 380–395. [Google Scholar] [CrossRef]
  3. Karthikeyan, L.; Pan, M.; Wanders, N.; Kumar, D.N.; Wood, E.F. Four decades of microwave satellite soil moisture observations: Part 1. A review of retrieval algorithms. Adv. Water Resour. 2017, 109, 106–120. [Google Scholar] [CrossRef]
  4. Owe, M.; de Jeu, R.; Holmes, T. Multisensor historical climatology of satellite-derived global land surface moisture. J. Geophys. Res. 2008, 113, F01002. [Google Scholar] [CrossRef]
  5. Parrens, M.; Zakharova, E.; Lafont, S.; Calvet, J.C.; Kerr, Y.; Wagner, W.; Wigneron, J.P. Comparing soil moisture retrievals from SMOS and ASCAT over France. Hydrol. Earth Syst. Sci. Discuss. 2011, 8, 8565–8607. [Google Scholar] [CrossRef]
  6. Dente, L.; Su, Z.; Wen, J. Validation of SMOS soil moisture products over the Maqu and Twente Regions. Sens. 2012, 12, 9965–9986. [Google Scholar] [CrossRef] [PubMed]
  7. Albergel, C.; de Rosnay, P.; Gruhier, C.; Muñoz-Sabater, J.; Hasenauer, S.; Isaksen, L.; Kerr, Y.; Wagner, W. Evaluation of remotely sensed and modelled soil moisture products using global ground-based in situ observations. Remote Sens. Environ. 2012, 118, 215–226. [Google Scholar] [CrossRef]
  8. Yee, M.S.; Walker, J.P.; Rüdiger, C.; Parinussa, R.M.; Koike, T.; Kerr, Y.H. A comparison of SMOS and AMSR2 soil moisture using representative sites of the OzNet monitoring network. Remote Sens. Environ. 2017, 195, 297–312. [Google Scholar] [CrossRef]
  9. Albergel, C.; Dorigo, W.; Reichle, R.H.; Balsamo, G.; de Rosnay, P.; Muñoz-Sabater, J.; Isaksen, L.; de Jeu, R.; Wagner, W. Skill and global trend analysis of soil moisture from reanalyses and microwave remote sensing. J. Hydrometeor. 2013, 14, 1259–1277. [Google Scholar] [CrossRef]
  10. Su, Z.; de Rosnay, P.; Wen, J.; Wang, L.; Zeng, Y. Evaluation of ECMWF’s soil moisture analyses using observations on the Tibetan Plateau. J. Geophys. Res. Atmos. 2013, 118, 5304–5318. [Google Scholar] [CrossRef]
  11. Chen, Y.; Yang, K.; Qin, J.; Zhao, L.; Tang, W.; Han, M. Evaluation of AMSR-E retrievals and GLDAS simulations against observations of a soil moisture network on the central Tibetan Plateau. J. Geophys. Res. Atmos. 2013, 118, 4466–4475. [Google Scholar] [CrossRef] [Green Version]
  12. Liu, C.; Yu, Y.; Xie, J. Applicability of soil temperature and moisture in several datasets over Qinghai-Xizang Plateau. Pleteau Meteor. 2015, 34, 653–665. [Google Scholar] [CrossRef]
  13. Gebregiorgis, M.F.; Savage, M.J. Field, laboratory and estimated soil-water content limits. Water Resour. Res. 2006, 32, 155–162. [Google Scholar] [CrossRef]
  14. Zhao, L.; Yang, K.; Qin, J.; Chen, Y.; Tang, W.; Montzka, C.; Wu, H.; Lin, C.; Han, M.; Vereecken, H. Spatiotemporal analysis of soil moisture observations within a Tibetan mesoscale area and its implication to regional soil moisture measurements. J. Hydrol. 2013, 482, 92–104. [Google Scholar] [CrossRef]
  15. Su, Z.; Wen, J.; Dente, L.; van der Velde, R.; Wang, L.; Ma, Y.; Yang, K.; Hu, Z. The Tibetan Plateau observatory of plateau scale soil moisture and soil temperature (Tibet-Obs) for quantifying uncertainties in coarse resolution satellite and model products. Hydrol. Earth Syst. Sci. 2011, 15, 2303–2316. [Google Scholar] [CrossRef] [Green Version]
  16. Dorigo, W.; Wagner, W.; Albergel, C.; Albrecht, F.; Balsamo, G.; Chung, D.; Ertl, M.; Forkel, M.; Gruber, A.; et al. ESA CCI Soil Moisture for improved Earth system understanding: State-of-the art and future directions. Remote Sens. Environ. 2017, 203, 185–215. [Google Scholar] [CrossRef]
  17. Liu, Y.Y.; Parinussa, R.M.; Dorigo, W.A.; De Jeu, R.A.M.; Wagner, W.; van Dijk, A.I.J.M.; McCabe, M.F.; Evans, J.P. Developing an improved soil moisture dataset by blending passive and active microwave satellite-based retrievals. Hydrol. Earth Syst. Sci. 2011, 15, 425–436. [Google Scholar] [CrossRef] [Green Version]
  18. Wagner, W.; Dorigo, W.; Jeu, R.D. Fusion of active and passive microwave observations to create an essential climate variable data record on soil moisture. In Proceedings of the ISPRS XXII ISPRS Congress, Melbourne, Australia, 25 August–1 September 2012; pp. 315–321. [Google Scholar]
  19. Wagner, W.; Hahn, S.; Kidd, R.; Melzer, T.; Bartalis, Z.; Hasenauer, S.; Figa-Saldaña, J.; de Rosnay, P.; Jann, A.; Schneider, S.; et al. The ASCAT soil moisture product: A review of its specifications, validation results, and emerging applications. Meteorol. Z. 2013, 22, 5–33. [Google Scholar] [CrossRef]
  20. Dee, D.P.; Uppala, S.M.; Simmons, A.J.; Berrisford, P.; Poli, P.; Kobayashi, S.; Andrae, U.; Balmaseda, M.A.; Balsamo, G.; Bauer, P.; et al. The ERA-Interim reanalysis: Configuration and performance of the data assimilation system. Q. J. R. Meteor. Soc. 2011, 137, 553–597. [Google Scholar] [CrossRef]
  21. Gong, P.; Ma, J.; Wang, J.; Yu, L.; Zhao, Y.C.; Zhao, Y.Y.; Liang, L.; Niu, Z.G.; Huang, X.M.; Fu, H.H.; et al. Finer resolution observation and monitoring of global land cover: First mapping results with Landsat TM and ETM+ data. Int. J. Remote Sens. 2013, 34, 2607–2654. [Google Scholar] [CrossRef]
  22. Zhong, L.; Ma, Y.; Salama, M.S.; Su, Z. Assessment of vegetation dynamics and their response to variations in precipitation and temperature in the Tibetan Plateau. Clim. Change. 2010, 103, 519–535. [Google Scholar] [CrossRef]
  23. Su, B.D.; Jiang, T.; Jin, W.B. Recent trends in observed temperature and precipitation extremes in the Yangtze River basin, China. Theor. Appl. Climatol. 2006, 83, 139–151. [Google Scholar] [CrossRef]
  24. Ullah, W.; Wang, G.; Gao, Z.; Hagan, D.F.T.; Lou, D. Comparisons of remote sensing and reanalysis soil moisture products over the Tibetan Plateau, China. Cold Reg. Sci. Technol. 2018, 146, 110–121. [Google Scholar] [CrossRef]
  25. Taylor, K.E. Summarizing multiple aspects of model performance in a single diagram. J. Geophys. Res. Atmos. 2001, 106, 7183–7192. [Google Scholar] [CrossRef] [Green Version]
  26. Dorigo, W.A.; Scipal, K.; Parinussa, R.M.; Liu, Y.Y.; Wagner, W.; de Jeu, R.A.M.; Naeimi, V. Error characterisation of global active and passive microwave soil moisture data sets. Hydrol. Earth Syst. Sci. Discuss. 2010, 7, 5621–5645. [Google Scholar] [CrossRef]
  27. Bi, H.; Ma, J.; Zheng, W.; Zeng, J. Comparison of soil moisture in GLDAS model simulations and in situ observations over the Tibetan Plateau. J. Geophys. Res. Atmos. 2016, 121, 2658–2678. [Google Scholar] [CrossRef]
  28. Qiu, J.; Mo, X.; Liu, S.; Lin, Z.; Yang, L.; Song, X.; Zhang, G.; Naeimi, V.; Wagner, W. Intercomparison of microwave remote-sensing soil moisture data sets based on distributed eco-hydrological model simulation and in situ measurements over the North China Plain. Int. J. Remote Sens. 2013, 34, 6587–6610. [Google Scholar] [CrossRef]
  29. Leroux, D.J.; Kerr, Y.H.; Richaume, P.; Fieuzal, R. Spatial distribution and possible sources of SMOS errors at the global scale. Remote Sens. Environ. 2013, 133, 240–250. [Google Scholar] [CrossRef] [Green Version]
  30. Njoku, E.G.; Jackson, T.J.; Lakshmi, V.; Chan, T.K.; Nghiem, S.V. Soil moisture retrieval from AMSR-E. IEEE Trans. Geosci. Remote Sens. 2003, 41, 215–229. [Google Scholar] [CrossRef]
  31. Njoku, E.; Chan, S. Vegetation and surface roughness effects on AMSR-E land observations. Remote Sens. Environ. 2006, 100, 190–199. [Google Scholar] [CrossRef]
  32. Cui, C.; Xu, J.; Zeng, J.; Chen, K.; Bai, X.; Lu, H.; Chen, Q.; Zhao, T. Soil Moisture Mapping from Satellites: An Intercomparison of SMAP, SMOS, FY3B, AMSR2, and ESA CCI over Two Dense Network Regions at Different Spatial Scales. Remote Sens. 2018, 10, 33. [Google Scholar] [CrossRef]
  33. Owe, M.; Jeu, R.D.; Walker, J.P. A methodology for surface soil moisture and vegetation optical depth retrieval using the microwave polarization difference index. IEEE Trans. Geosci. Remote Sens. 2001, 39, 1643–1654. [Google Scholar] [CrossRef] [Green Version]
  34. Yao, T.; Thompson, L.; Yang, W.; Yu, W.; Gao, Y.; Guo, X.; Yang, X.; Duan, K.; Zhao, H.; Xu, B.; et al. Different glacier status with atmospheric circulations in Tibetan Plateau and surroundings. Nature Clim. Change 2012, 2, 663–667. [Google Scholar] [CrossRef]
  35. Yang, K.; Chen, Y.Y.; Qin, J. Some practical notes on the land surface modeling in the Tibetan Plateau. Hydrol. Earth Syst. Sci. 2009, 13, 687–701. [Google Scholar] [CrossRef] [Green Version]
  36. Berger, M.; Kerr, Y.; Font, J.; Yu, L.; Wigneron, J.P.; Calvet, J.C.; Saleh, K.; Lopez-Baeza, E.; Simmonds, L.; Waldteufel, P.; et al. Measuring the moisture in the Earth’s soil—Advancing the science with ESA’s SMOS Mission. ESA Bull. 2003, 115, 40–45. [Google Scholar]
  37. Reynolds, C.A.; Jackson, T.J.; Rawls, W.J. Estimating soil water-holding capacities by linking the Food and Agriculture Organization Soil map of the world with global pedon databases and continuous pedotransfer functions. Water Resour. Res. 2000, 36, 3653–3662. [Google Scholar] [CrossRef] [Green Version]
  38. Wei, S.; Dai, Y.J.; Liu, B.Y. A China data set of soil properties for land surface modeling. J. Adv. Model. Earth Syst. 2013, 5, 212–224. [Google Scholar] [CrossRef] [Green Version]
  39. Zeng, J.; Li, Z.; Chen, Q.; Bi, H.; Qiu, J.; Zou, P. Evaluation of remotely sensed and reanalysis soil moisture products over the Tibetan Plateau using in-situ observations. Remote Sens. Environ. 2015, 163, 91–110. [Google Scholar] [CrossRef]
  40. Zeng, Y.; Su, Z.; van der Velde, R.; Wang, L.; Xu, K.; Wang, X.; Wen, J. Blending Satellite Observed, Model Simulated, and in Situ Measured Soil Moisture over Tibetan Plateau. Remote Sens. 2016, 8, 268. [Google Scholar] [CrossRef]
  41. Zampieri, M.; Serpetzoglou, E.; Anagnostou, E.N.; Nikolopoulos, E.I.; Papadopoulos, A. Improving the representation of river–groundwater interactions in land surface modeling at the regional scale: Observational evidence and parameterization applied in the Community Land Model. J. Hydrol. 2012, 420, 72–86. [Google Scholar] [CrossRef]
  42. Qiu, J.; Gao, Q.; Wang, S.; Su, Z. Comparison of temporal trends from multiple soil moisture data sets and precipitation: The implication of irrigation on regional soil moisture trend. Int. J. Appl. Earth Obs. 2016, 48, 17–27. [Google Scholar] [CrossRef] [Green Version]
  43. Zampieri, M.; Carmona, G.G.; Dentener, F.; Gumma, M.; Salamon, P.; Seguini, L.; Toreti, A. Surface freshwater limitation explains worst rice production anomaly in India in 2002. Remote Sens. 2018, 10, 244. [Google Scholar] [CrossRef]
  44. Wang, A.; Zeng, X. Evaluation of multireanalysis products with in situ observations over the Tibetan Plateau. J. Geophys. Res. Atmos. 2012, 117, 1–12. [Google Scholar] [CrossRef]
  45. Crow, W.T.; Berg, A.A.; Cosh, M.H.; Loew, A.; Mohanty, B.P.; Panciera, R.; de Rosnay, P.; Ryu, D.; Walker, J.P. Upscaling sparse ground-based soil moisture observations for the validation of coarse-resolution satellite soil moisture products. Rev. Geophys. 2012, 50, RG2002. [Google Scholar] [CrossRef]
Figure 1. Distributions of four observation networks. The contour colors represent different elevations. Sq: Shiquanhe.
Remotesensing 11 01196 g001
Figure 2. Locations and distributions of the soil moisture observation sites at (a) Maqu, (b) Naqu, (c) Ali, and (d) Sq. The background colors represent different land cover types in observing networks.
Remotesensing 11 01196 g002
Figure 3. Taylor diagram illustrating the statistical metrics between the in situ observations and the multi-source satellite soil moisture products in 2010: (a) Maqu, (b) Naqu, (c) Ali, and (d) Sq. ERA5: the European Centre for Medium-Range Weather Forecasts Reanalysis 5 soil moisture product.
Remotesensing 11 01196 g003
Figure 4. Time series comparisons and scatter distributions of the multi-source satellite soil moisture products with the in situ observations in 2010 (a,b) for Maqu, (c,d) for Naqu, (e,f) for Ali, (g,h) for Sq.
Remotesensing 11 01196 g004
Figure 5. Spatial distribution of the multi-source satellite soil moisture products in summer (JJA) of 2010.
Remotesensing 11 01196 g005
Figure 6. Spatial distribution of the monthly averaged ERA5 precipitation in summer (JJA) of 2010.
Remotesensing 11 01196 g006
Figure 7. Spatial distribution of trend correlation coefficients of the ERA5 soil moisture data from 1979 to 2018 over the Tibetan Plateau (TP).
Remotesensing 11 01196 g007
Figure 8. Comparison of the M–K statistics of the ERA5 soil moisture data from 1979 to 2018 for (a) Maqu, (b) Naqu, and (c) Ali. Note: when α = 0.05, the dashed lines represent Uα = 1.96 and U’α = −1.96, respectively.
Remotesensing 11 01196 g008
Figure 9. Spatial distribution of the trend correlation coefficients of the ERA5 precipitation and evaporation data from 1979 to 2018: (a) precipitation and (b) evaporation.
Remotesensing 11 01196 g009
Table 1. Error statistics of the multi-source satellite soil moisture products and reanalysis data in four network regions.
RegionProductMBERσubRMSE
Maqucombined−0.0830.6460.0320.046
active0.0210.7510.0410.040
passive0.0080.4330.0890.083
ERA50.0340.4190.0460.058
Naqucombined−0.1220.8790.0440.042
active−0.0630.8600.0750.040
passive0.0080.8820.0840.039
ERA5−0.0440.7460.0430.051
Alicombined0.1080.6710.0400.037
active−0.1290.2990.0230.048
passive0.1830.6450.0630.049
ERA50.1030.6530.0820.062
Sqcombined0.0860.4460.0500.047
active0.0080.5550.0750.063
passive0.0390.4980.0740.065
ERA5−0.0030.2540.1000.097

