A PolSAR Change Detection Index Based on Neighborhood Information for Flood Mapping


1
Department of Electrical and Computer Engineering, Memorial University of Newfoundland, St John’s, NL A1B 3X7, Canada
2
Wood Environment and Infrastructure Solutions, a Division of Wood Canada Limited, St. John’s, NL A1B 1H3, Canada
3
C-CORE, St. John’s, NL A1B 3X5, Canada
4
College of Environmental Science and Forestry (ESF), State University of New York (SUNY), Syracuse, NY 13210, USA
5
The Canada Center for Mapping and Earth Observation, Ottawa, ON K1S 5K2, Canada
*
Author to whom correspondence should be addressed.
Remote Sens. 2019, 11(16), 1854; https://doi.org/10.3390/rs11161854
Submission received: 12 June 2019
/
Revised: 2 August 2019
/
Accepted: 7 August 2019
/
Published: 9 August 2019
(This article belongs to the Special Issue Innovative Remote Sensing for Monitoring and Assessment of Natural Resources)
Abstract
:Change detection using Remote Sensing (RS) techniques is valuable in numerous applications, including environmental management and hazard monitoring. Synthetic Aperture Radar (SAR) images have proven to be even more effective in this regard because of their all-weather, day and night acquisition capabilities. In this study, a polarimetric index based on the ratio of span (total power) values was introduced, in which neighbourhood information was considered. The role of the central pixel and its neighbourhood was adjusted using a weight parameter. The proposed index was applied to detect flooded areas in Dongting Lake, Hunan, China, and was then compared with the Wishart Maximum Likelihood Ratio (MLR) test. Results demonstrated that although the proposed index and the Wishart MLR test yielded similar accuracies (accuracy of 94% and 93%, and Kappa Coefficients of 0.82 and 0.86, respectively), inclusion of neighbourhood information in the proposed index not only increased the connectedness and decreased the noise associated with the objects within the produced map, but also increased the consistency and confidence of the results.
1. Introduction
Flooding is considered one of the major natural hazards in the world [1,2], and it is anticipated to become even more frequent and severe in the near future [1,3,4]. Death and destruction resulting from floods are very serious. For instance, it was reported that from 1986 to 2006, flooding caused nearly 100 billion Euros in damages to Europe alone [1]. Therefore, stakeholders continually seek an efficient way to map and monitor flooding in order to minimize damage [5]. To date, numerous attempts have been made to model and predict flooding on large scales, mainly using hydrological models. For example, high-resolution hydrological models that combine existing models have been reported in [6,7]. Another efficient tool for flood monitoring is Remote Sensing (RS), which provides valuable opportunities for mapping and monitoring flood events in a cost- and time-effective manner. In fact, RS change detection techniques are quick and efficient ways for delineating the areas affected by flooding.
Change detection in RS estimates the amount of change between two images acquired on different dates over the same geographical area. RS change detection has been widely used for assessing the effect of natural hazards, tracking environmental contaminations, monitoring water resources, crops and vegetation, as well as for other applications [8,9,10,11]. Change detection using SAR images is advantageous because of its all-weather, day and night acquisition capability. Furthermore, with the growth in the number of active SAR satellites, the use of multi-temporal images is facilitated. However, SAR change detection demands specific techniques due to the presence of speckle in SAR images and because SAR data contain very different types of information than optical data.
In general, SAR change detection algorithms can be divided into pre-classification and post-classification methods. While post-classification methods are limited to comparing the accuracy of two classified maps [12], in recent years a variety of pre-classification approaches have emerged. Among these, many are applicable to single-channel SAR images. The most basic methods for single-channel SAR change detection includes algebraic operations, such as computing the difference and ratio of the images [13]. Ratio and log-ratio operations are popular for SAR images because they reduce speckle and change the image distribution to Gaussian, respectively. For example, [14] fused the complementary information in the mean-ratio and log-ratio images to generate a difference image in which the changed areas were effectively highlighted. Moreover, Bazi et al. proposed an automatic approach for thresholding the log-ratio image by analyzing a cost function [15]. Other approaches that are also suitable for classifying single- or dual-channel SAR images include Principal Component Analysis (PCA) and Change Vector Analysis (CVA). In Yousif and Ban’s work, for example, PCA was used to reduce the dimension of a neighbourhood feature vector proposed by the authors in the context of change detection [16]. Similarly, in Cheng et al.’s study, PCA was applied on non-overlapping blocks of a difference image before they were projected on eigenvector space [17]. Furthermore, Qi and Yeh combined CVA with a post-classification comparison to detect changes using RADARSAT-2 images [18].
At the same time, several change detection indices derived from the covariance matrix can be utilized for polarimetric change detection. For instance, two indices of Contrast Ratio and Ellipticity were compared with five other measures for a change detection study by Molinier and Rauste [19]. To derive these indices, eigen values of a matrix generated from the covariance matrices of the two dates on which the images were acquired were extracted. Another successful method for polarimetric change detection is the Wishart Maximum Likelihood Ratio (MLR) test proposed by Conradsen et al. [20]. In this method, a test was performed to assess the equality of two matrices with complex Wishart distributions, from which an index was proposed. The index image was then thresholded to highlight the changed areas.
Finally, there are several distance measures that can be used in change detection studies based on the covariance or coherency matrix. As an example, the Wishart-Chernoff distance was utilized in Daboor et al. [21] to investigate the potential of compact polarimetric SAR data for monitoring wetlands. Moreover, Liu et al. introduced a new distance measure entitled Generalized Likelihood Ratio Test (GLRT) distance for detecting changes in urban areas [22].
Most of the aforementioned methods are accurate in change detection studies using SAR images and many of these metrics are actively applied in various environmental monitoring applications. However, the results of change detection studies using SAR data are affected by noise due to the presence of speckle in SAR images. This is a limitation to the operationality of change detection techniques using SAR data. Therefore, to produce noise-free results and make correct managerial decisions, it is crucial to provide change detection maps that are harmonious with real-world objects and do not suffer from a noisy appearance. This goal can be facilitated by taking neighbourhood information into account in the case of SAR images that are blemished by the effect of speckle. Although several studies have considered neighbourhood information in SAR change detection [23,24,25], most ignore this valuable information.
In this paper, a single channel change detection index based on neighbourhood information was applied to Polarimetric SAR (PolSAR) data. This index used span (total power) values and considered the ratio of the minimum to the maximum intensity values between two dates of image acquisition, such that the effect of backscatter variation among different classes, noises, and errors were minimized. In this index, the role of the central pixel and its neighbourhood was adjusted using a weight parameter. This index was then compared with the Wishart MLR index, both quantitatively and qualitatively, in a flood event in Hunan, China. Therefore, the objective of this study was to first extend a single-channel index to the full-polarimetric data, and second to apply this measure for flood mapping and monitoring. To that end, the paper is organized as follows: In Section 2, the dataset and study area as well as the methodology are explained. The results are represented in Section 3, and the discussion is provided in Section 4 before the concluding remarks are given in Section 5.
2. Materials and Methods
2.1. Study Area and Dataset
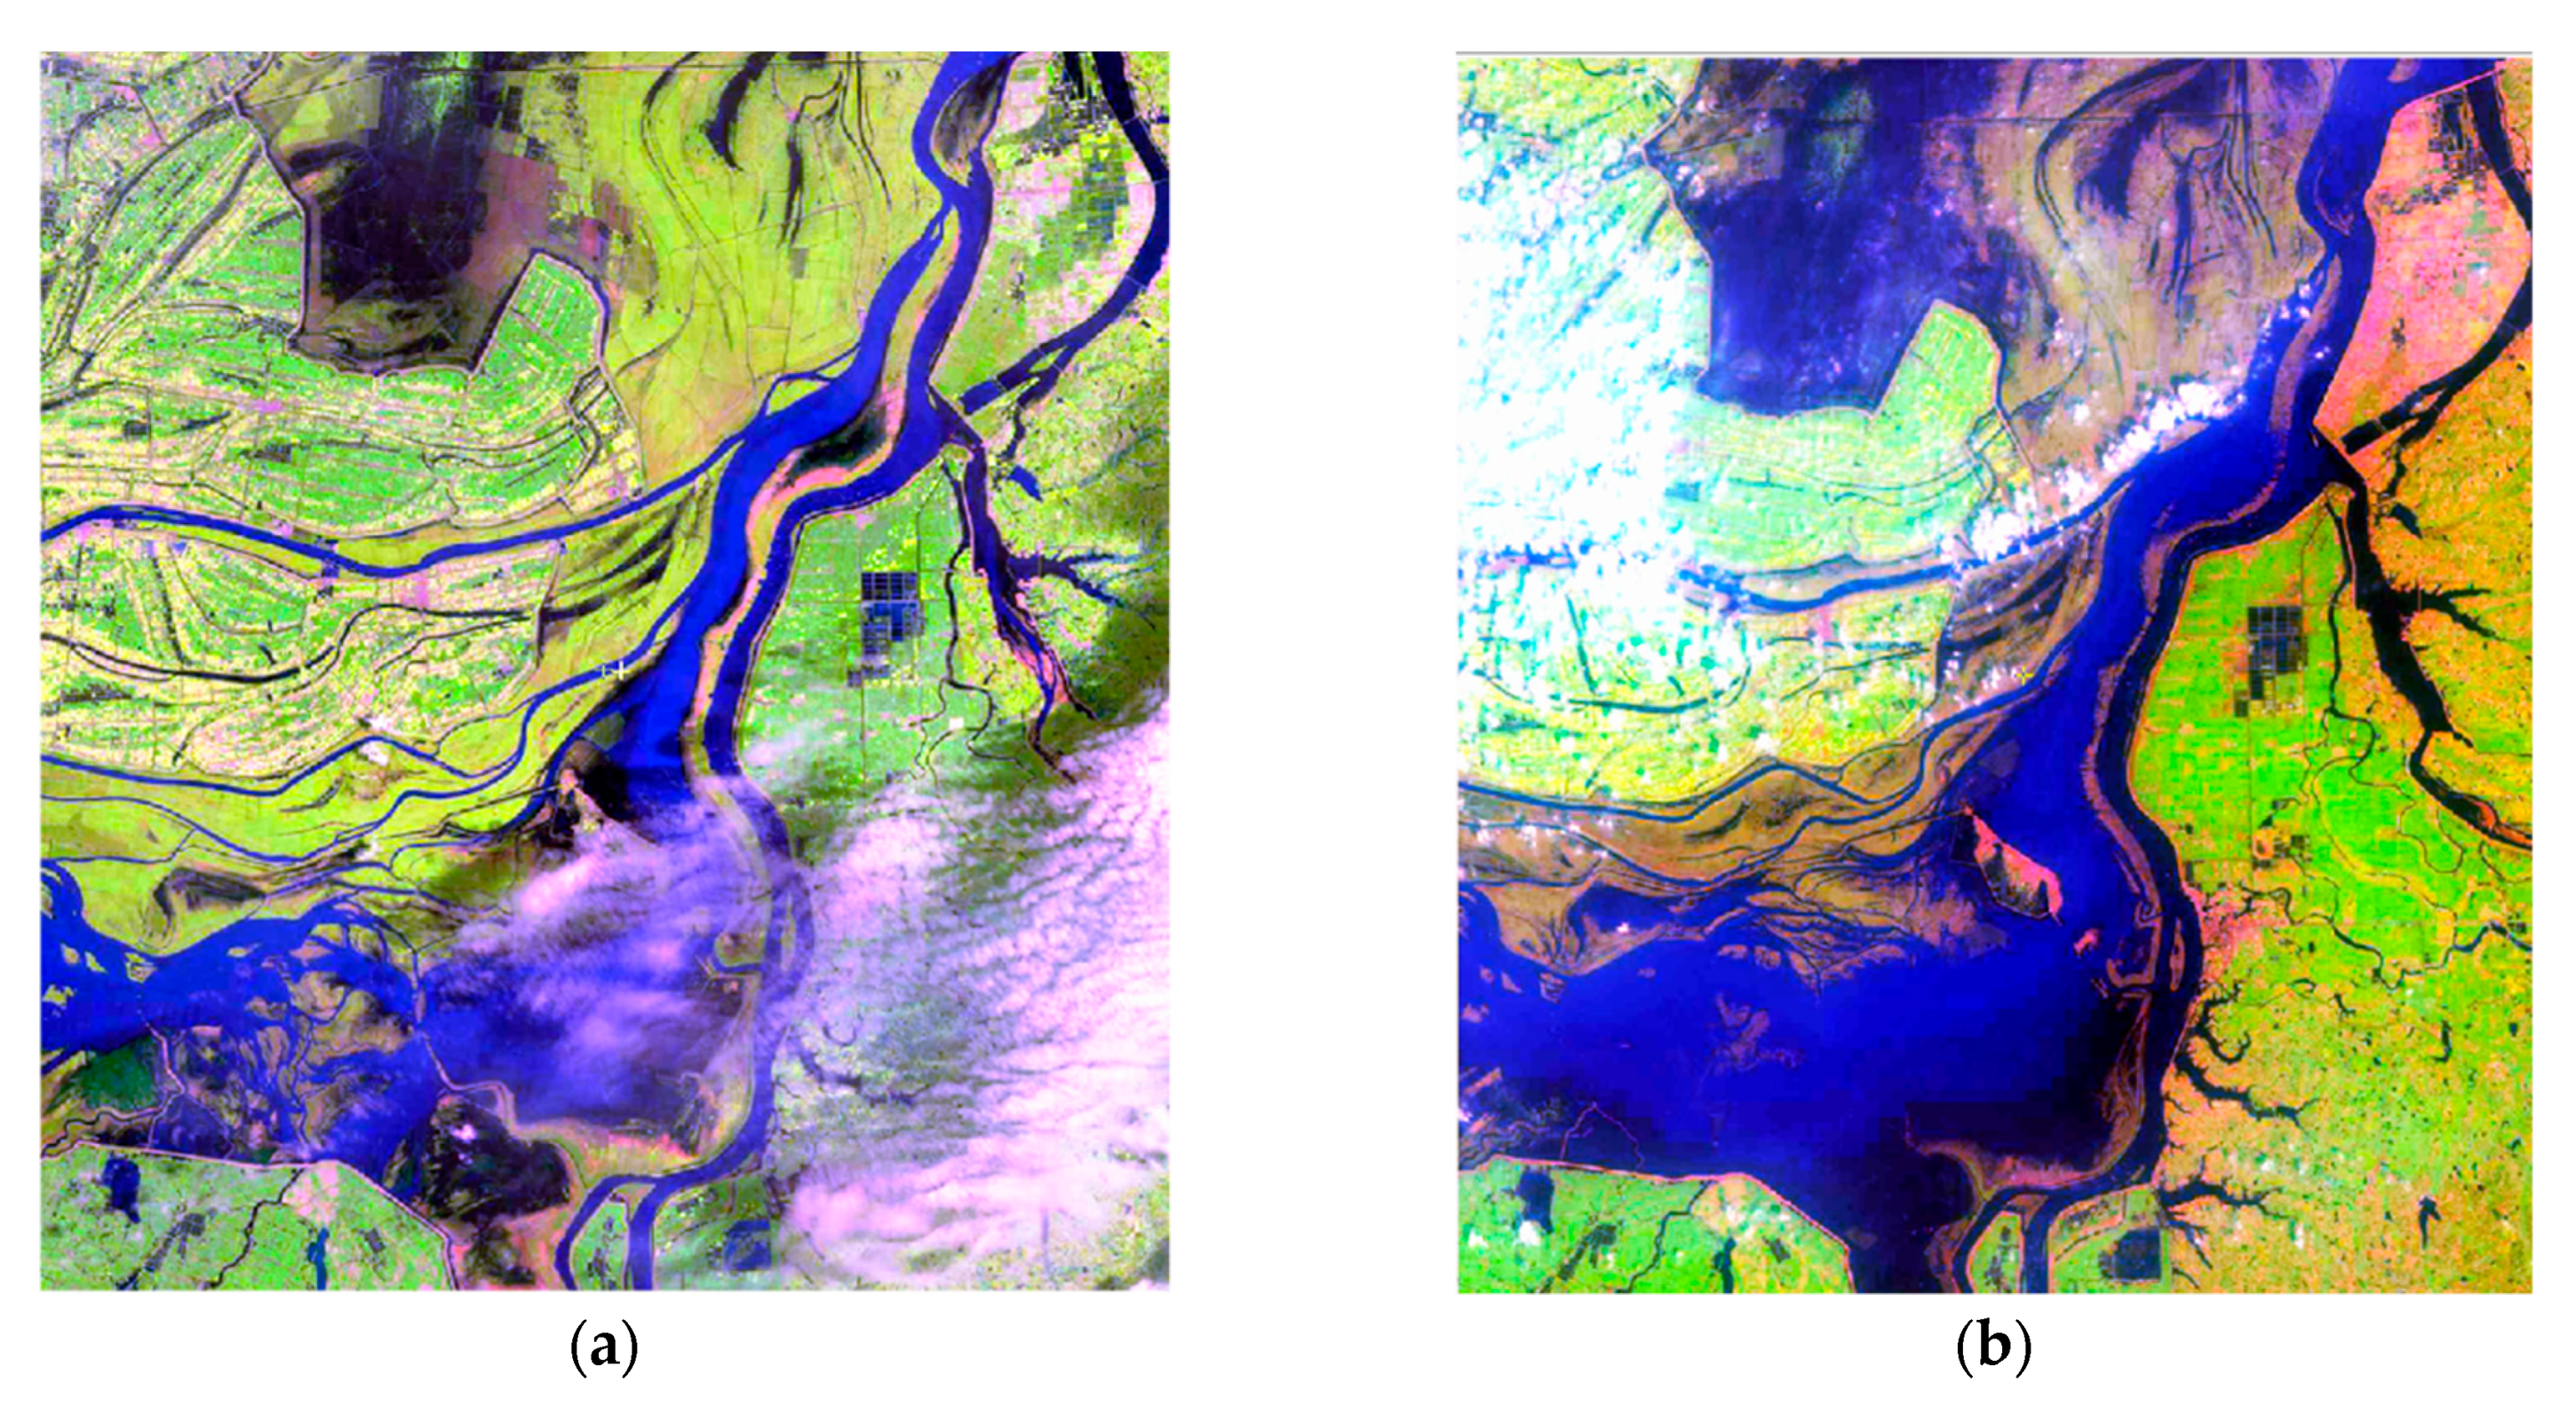
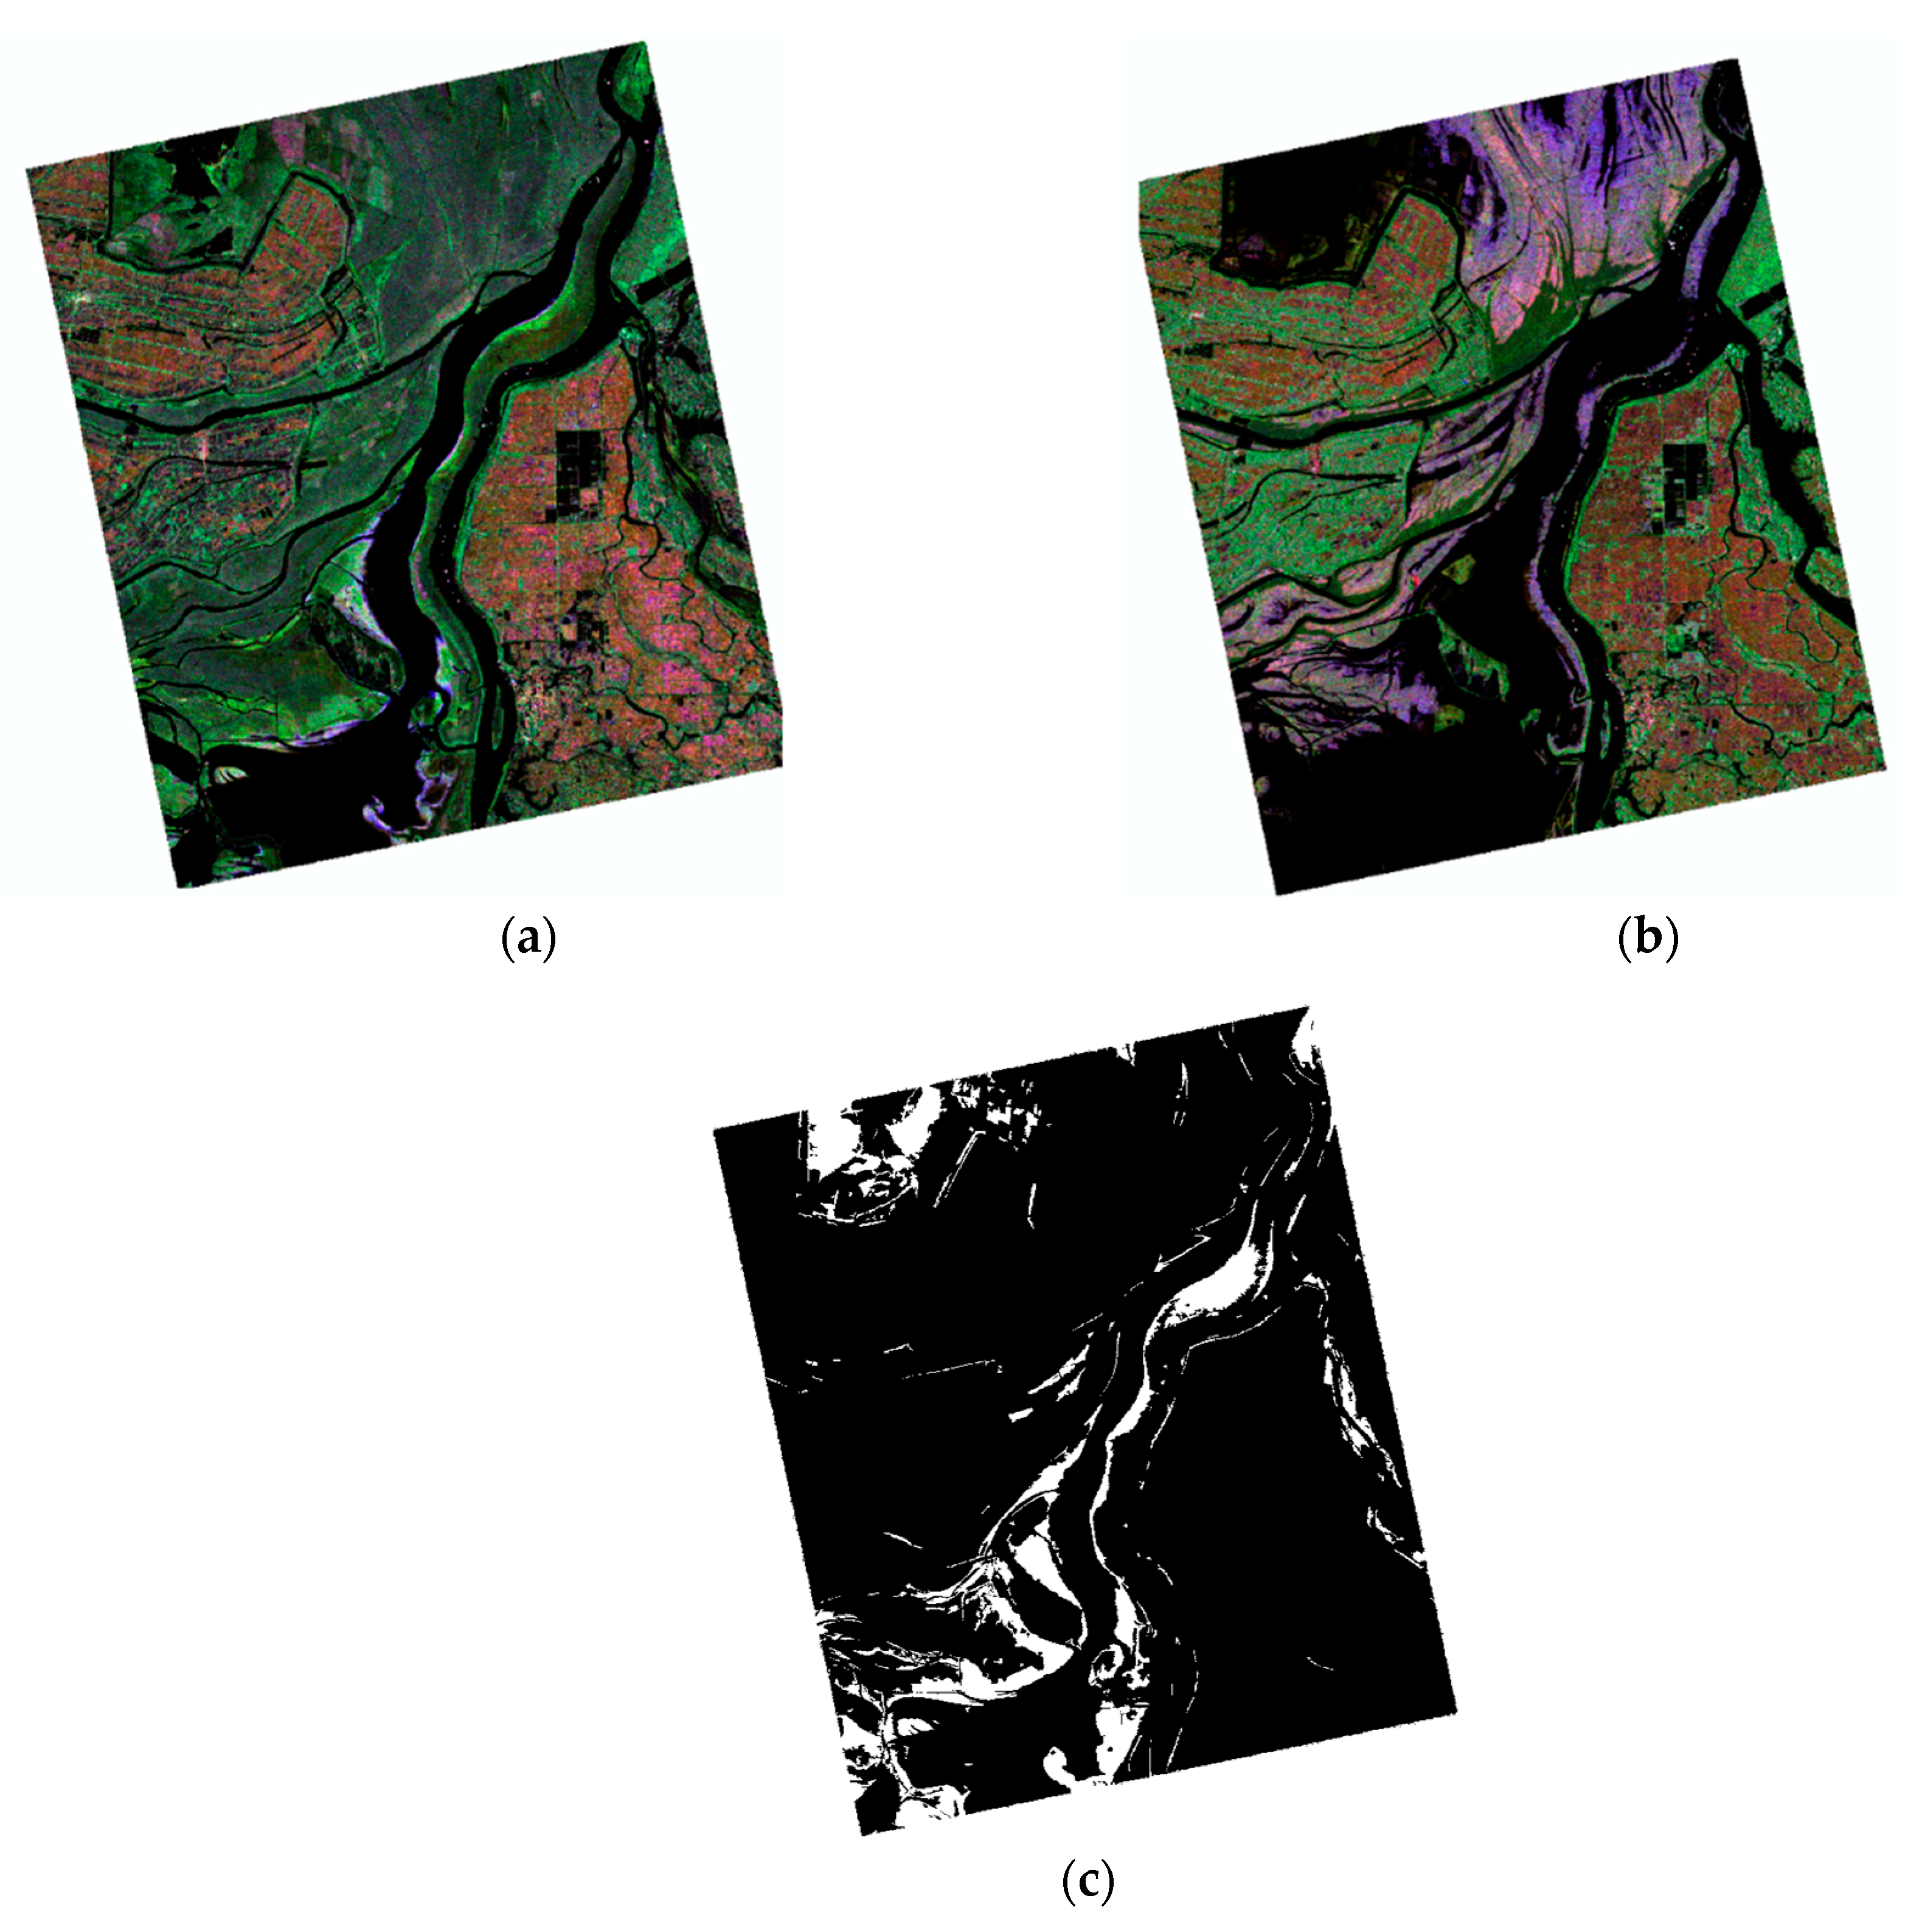
Dongting Lake in the Hunan province of China, located at approximately 29°19′N and 112°57′W, was selected as the study area in this research. This area is prone to flooding from July to September each year, which makes it ideal for change detection studies. Figure 1 shows two Landsat 5 images over the study area before and after a flooding event. As is observed, cloud cover is a common problem of optical images that hinders change detection studies using these images. Full-polarimetric SAR images used in this study are shown in Table 1 and their corresponding colour composite is depicted in Figure 2. The reference image, obtained by visual analysis of the SAR images, is also illustrated in Figure 2c.
2.2. Method
In the first step, the scattering matrix of each full polarimetric SAR image was converted to the covariance matrix to avoid distorting the absolute phase information during processing. Covariance matrices were subsequently filtered by a 7-by-7 PolSAR Lee filter [26] and were terrain-corrected and geocoded using the MapreadyTM toolkit, developed by the Alaska Satellite Facility (ASF). The span image corresponding to each date was then calculated as follows:
where is the element of the scattering matrix recorded for the transmitting polarization of P and receiving polarization of Q.
In the next step, a neighbourhood was considered for each pixel in the SAR image. In this work, a 7-by-7 window was considered for this purpose, but this could change depending on the level of noise in the image. Then, the difference image proposed in [23] could be heuristically extended to the Polarimetric Difference Image (PDI) as follows:
where is the span image for the pixel x in the image, is the neighbourhood of the pixel, and and are the standard deviation and the average of the span image neighbourhood, respectively. is a weight measure that determines the effect of the pixel and its neighbourhood in the measure. When is large, the area is heterogeneous and the role of the central pixel is more important than its neighbourhood. When is small, however, the area is homogeneous and the neighbourhood effect is more significant [23]. Moreover, since the ratio of the minimum to maximum intensity was present in both parts of Equation (2), the effect of the variation of intensity among different classes, the level of noise, and the presence of errors on the change detection map was minimized. After computing the PDI measure, an image was obtained in which the magnitude of each pixel demonstrated the level of similarity between two images. If the change of a specific class is of interest, the image can be thresholded to highlight those changes. The aim of this work was to detect flooded areas and therefore the histogram of the PDI image was thresholded using Otsu’s method [27]. In Otsu’s method, the threshold(s) of the histogram is determined by maximizing between class variance or minimizing within class variance [27].
The proposed measure was compared to the Wishart MLR test [20], as it is a well-known, full-polarimetric measure for SAR change detection studies:
where X and Y are the first and second covariance matrices, respectively, n and m demonstrate the number of looks in the first and second image, respectively, denotes the determinant of a matrix, and P is the size of the matrix, which is 3 in this study. When m = n, which is the case in our work, lnQ can be defined as follows:
As with maps produced by PDI, the lnQ image can also be thresholded using Otsu’s method to emphasize the areas of interest. Then, the measures are compared both quantitatively and qualitatively. For quantitative comparison, the number of False Negatives (FNs), False Positives (FP s), True Negatives (TNs), and True Positives (TP s) were computed. Then, the Overall Error (OE) and the Percentage of Correct Classification (PCC) were obtained by:
and
Moreover, if we consider a confusion matrix with the two classes of change and no change, the Kappa coefficient can be calculated as follows [28]:
where P is the total number of elements in the confusion matrix, is the element in the row and column, is the summation of the elements in the row, and is the summation of the elements in the column. Kappa is another measure of the accuracy assessment that considers values in the range of [0, 1]. A Kappa value of 0 indicates there is no agreement between the produced map and the reference data, while a value of 1 demonstrates the complete agreement between the generated map and the reference data.
3. Results
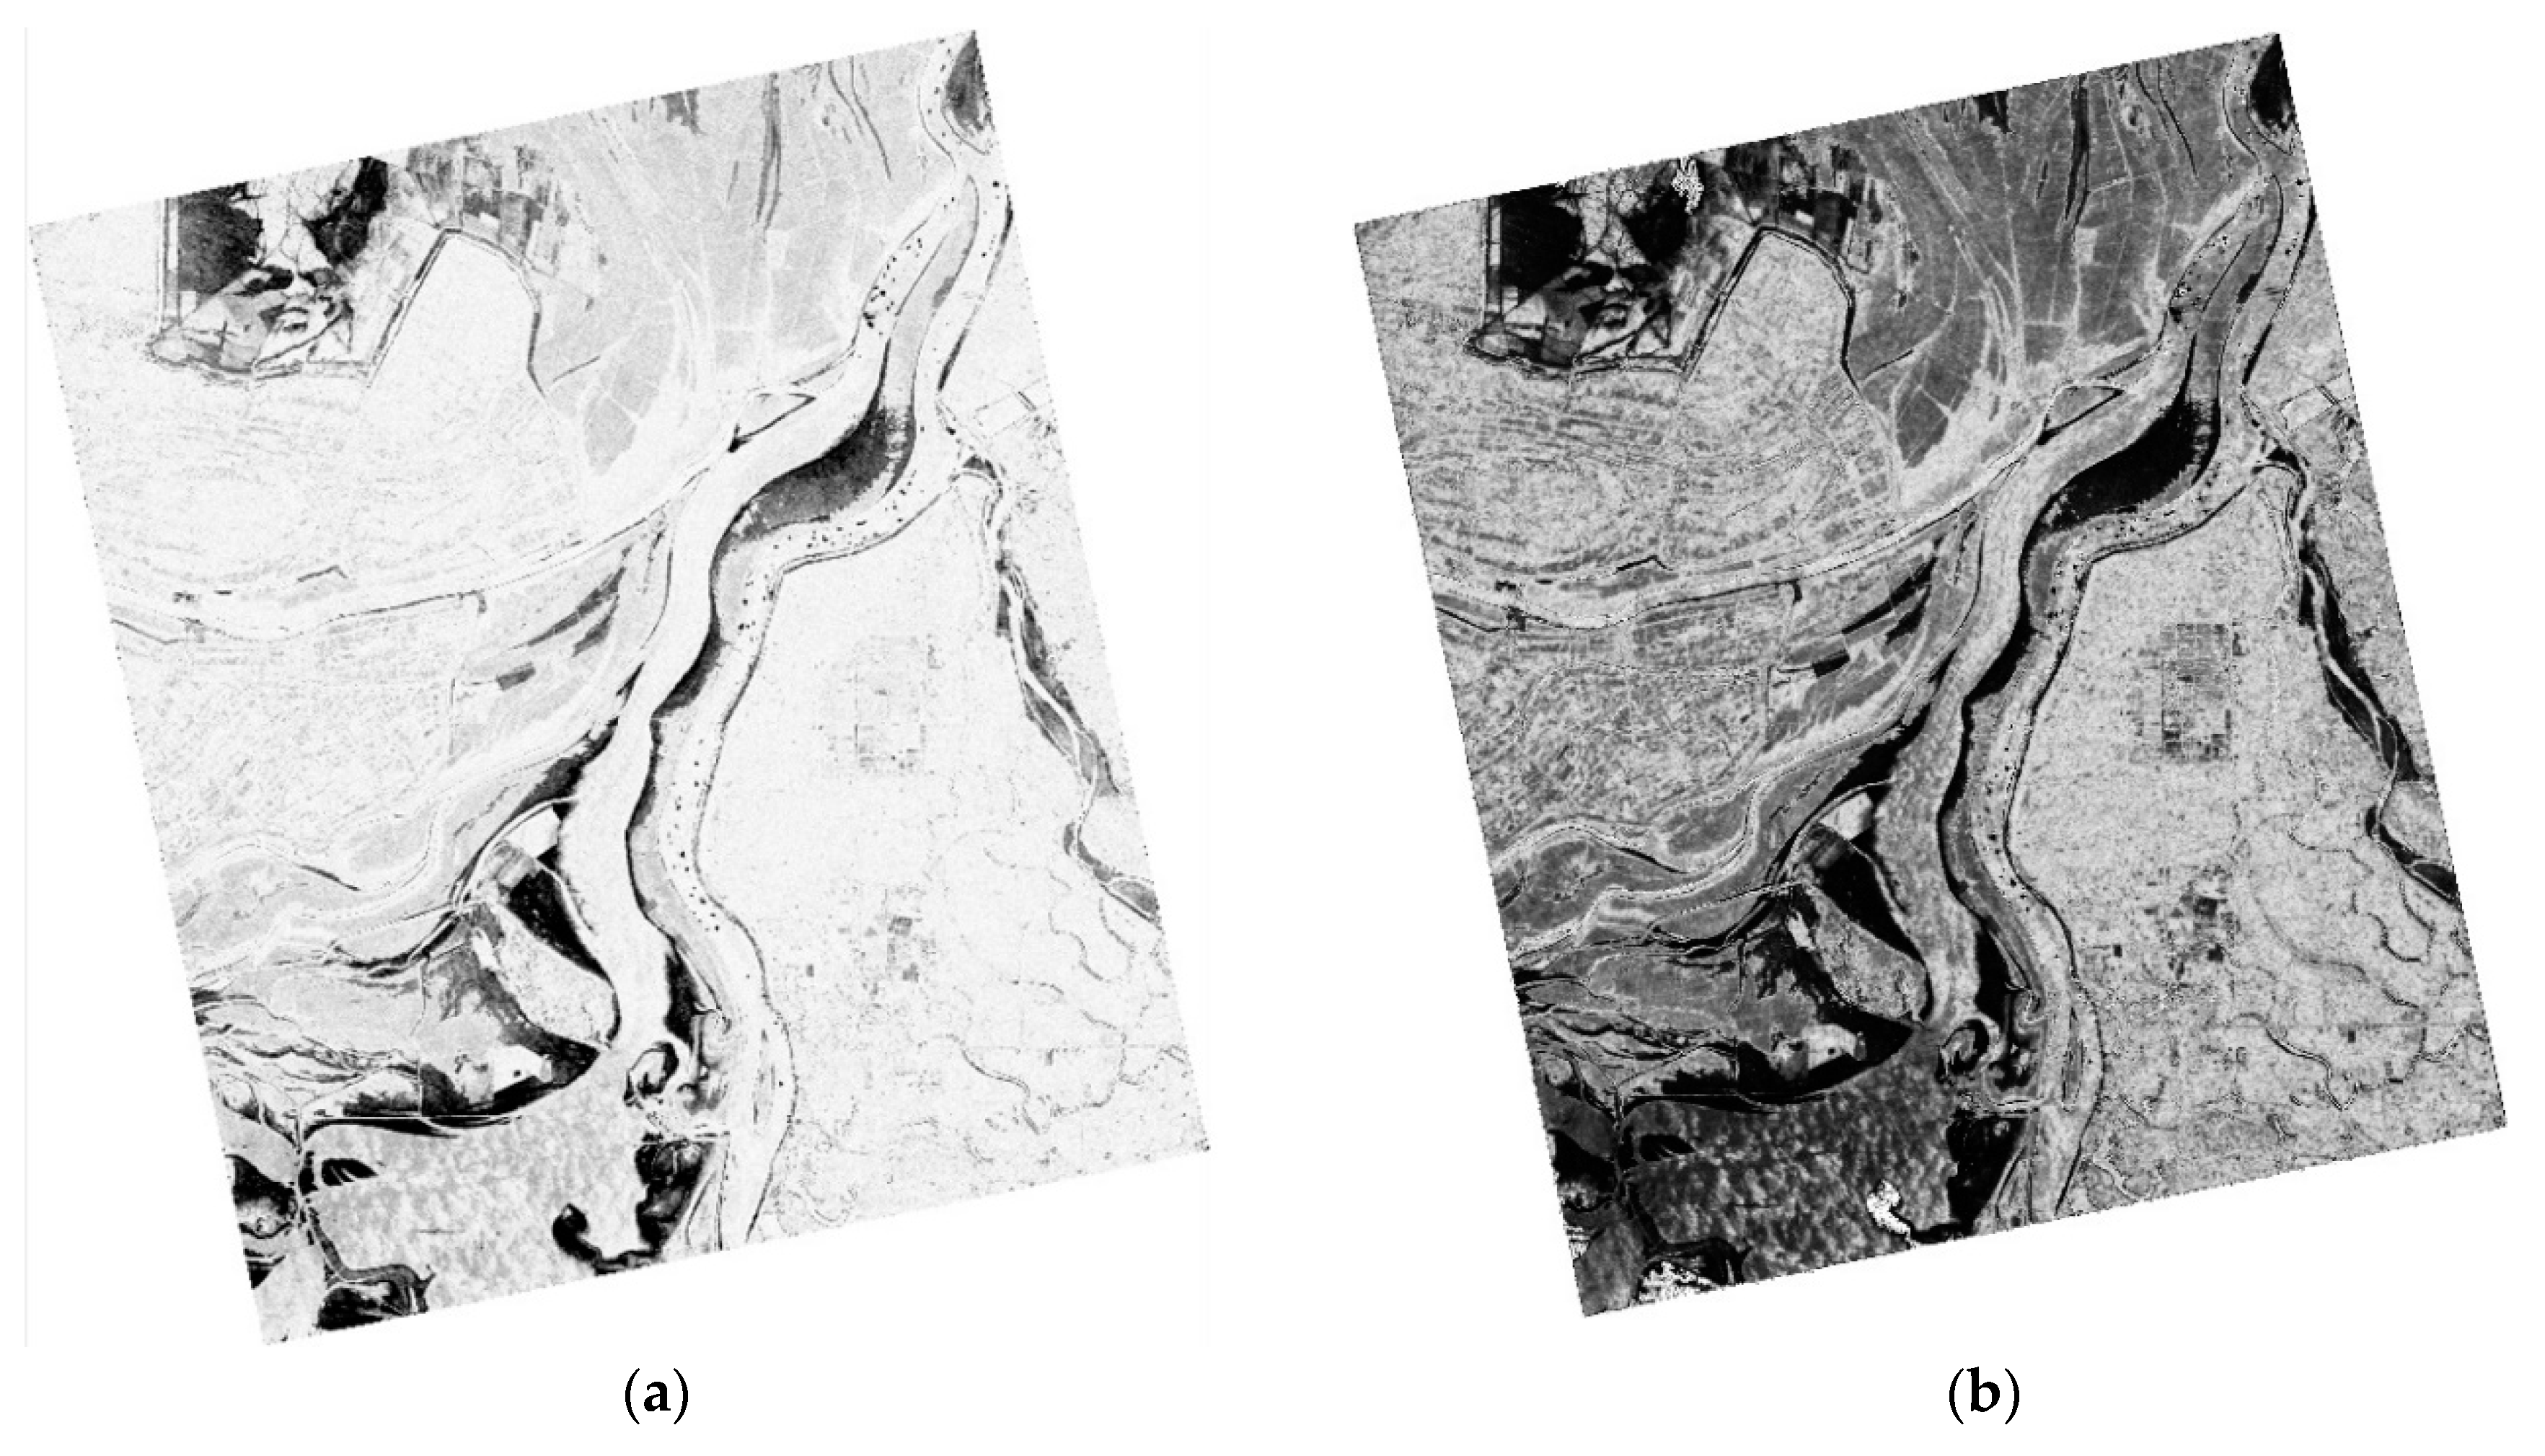
As mentioned in the previous section, PDI is a ratio index in which the role of the ratio of the central pixels versus the ratio of their neighbourhood is determined with heterogeneity or homogeneity of their neighbourhood. LnQ, however, was obtained by conducting a statistical equality test of two covariance matrices for the SAR images of the same area acquired on two different dates. Figure 3 demonstrates the PDI and lnQ maps of Dongting Lake produced in this study. It can be observed that both measures delineated the flooded areas effectively and could be used to accurately locate and estimate flooded regions. However, the quantization of the changes in the PDI image is clearly more detailed than in the lnQ image. For example, the top left of the lnQ image provides a rather homogeneous area that fails to detect minor changes, whereas the same area in the PDI image effectively quantizes different amounts of change. A more important feature of the PDI map is that it provides less speckled objects because it considers neighbourhood information. Conversely, some of the objects within the lnQ map had a noisy appearance. The range of data for the lnQ and PDI images was [1461, 0] and [0, 1], respectively. The thresholds selected for binarizing the images were 160 for the lnQ image and 0.118 for the PDI image. A detailed qualitative and quantitative assessment of the results has been provided in the Discussion section.
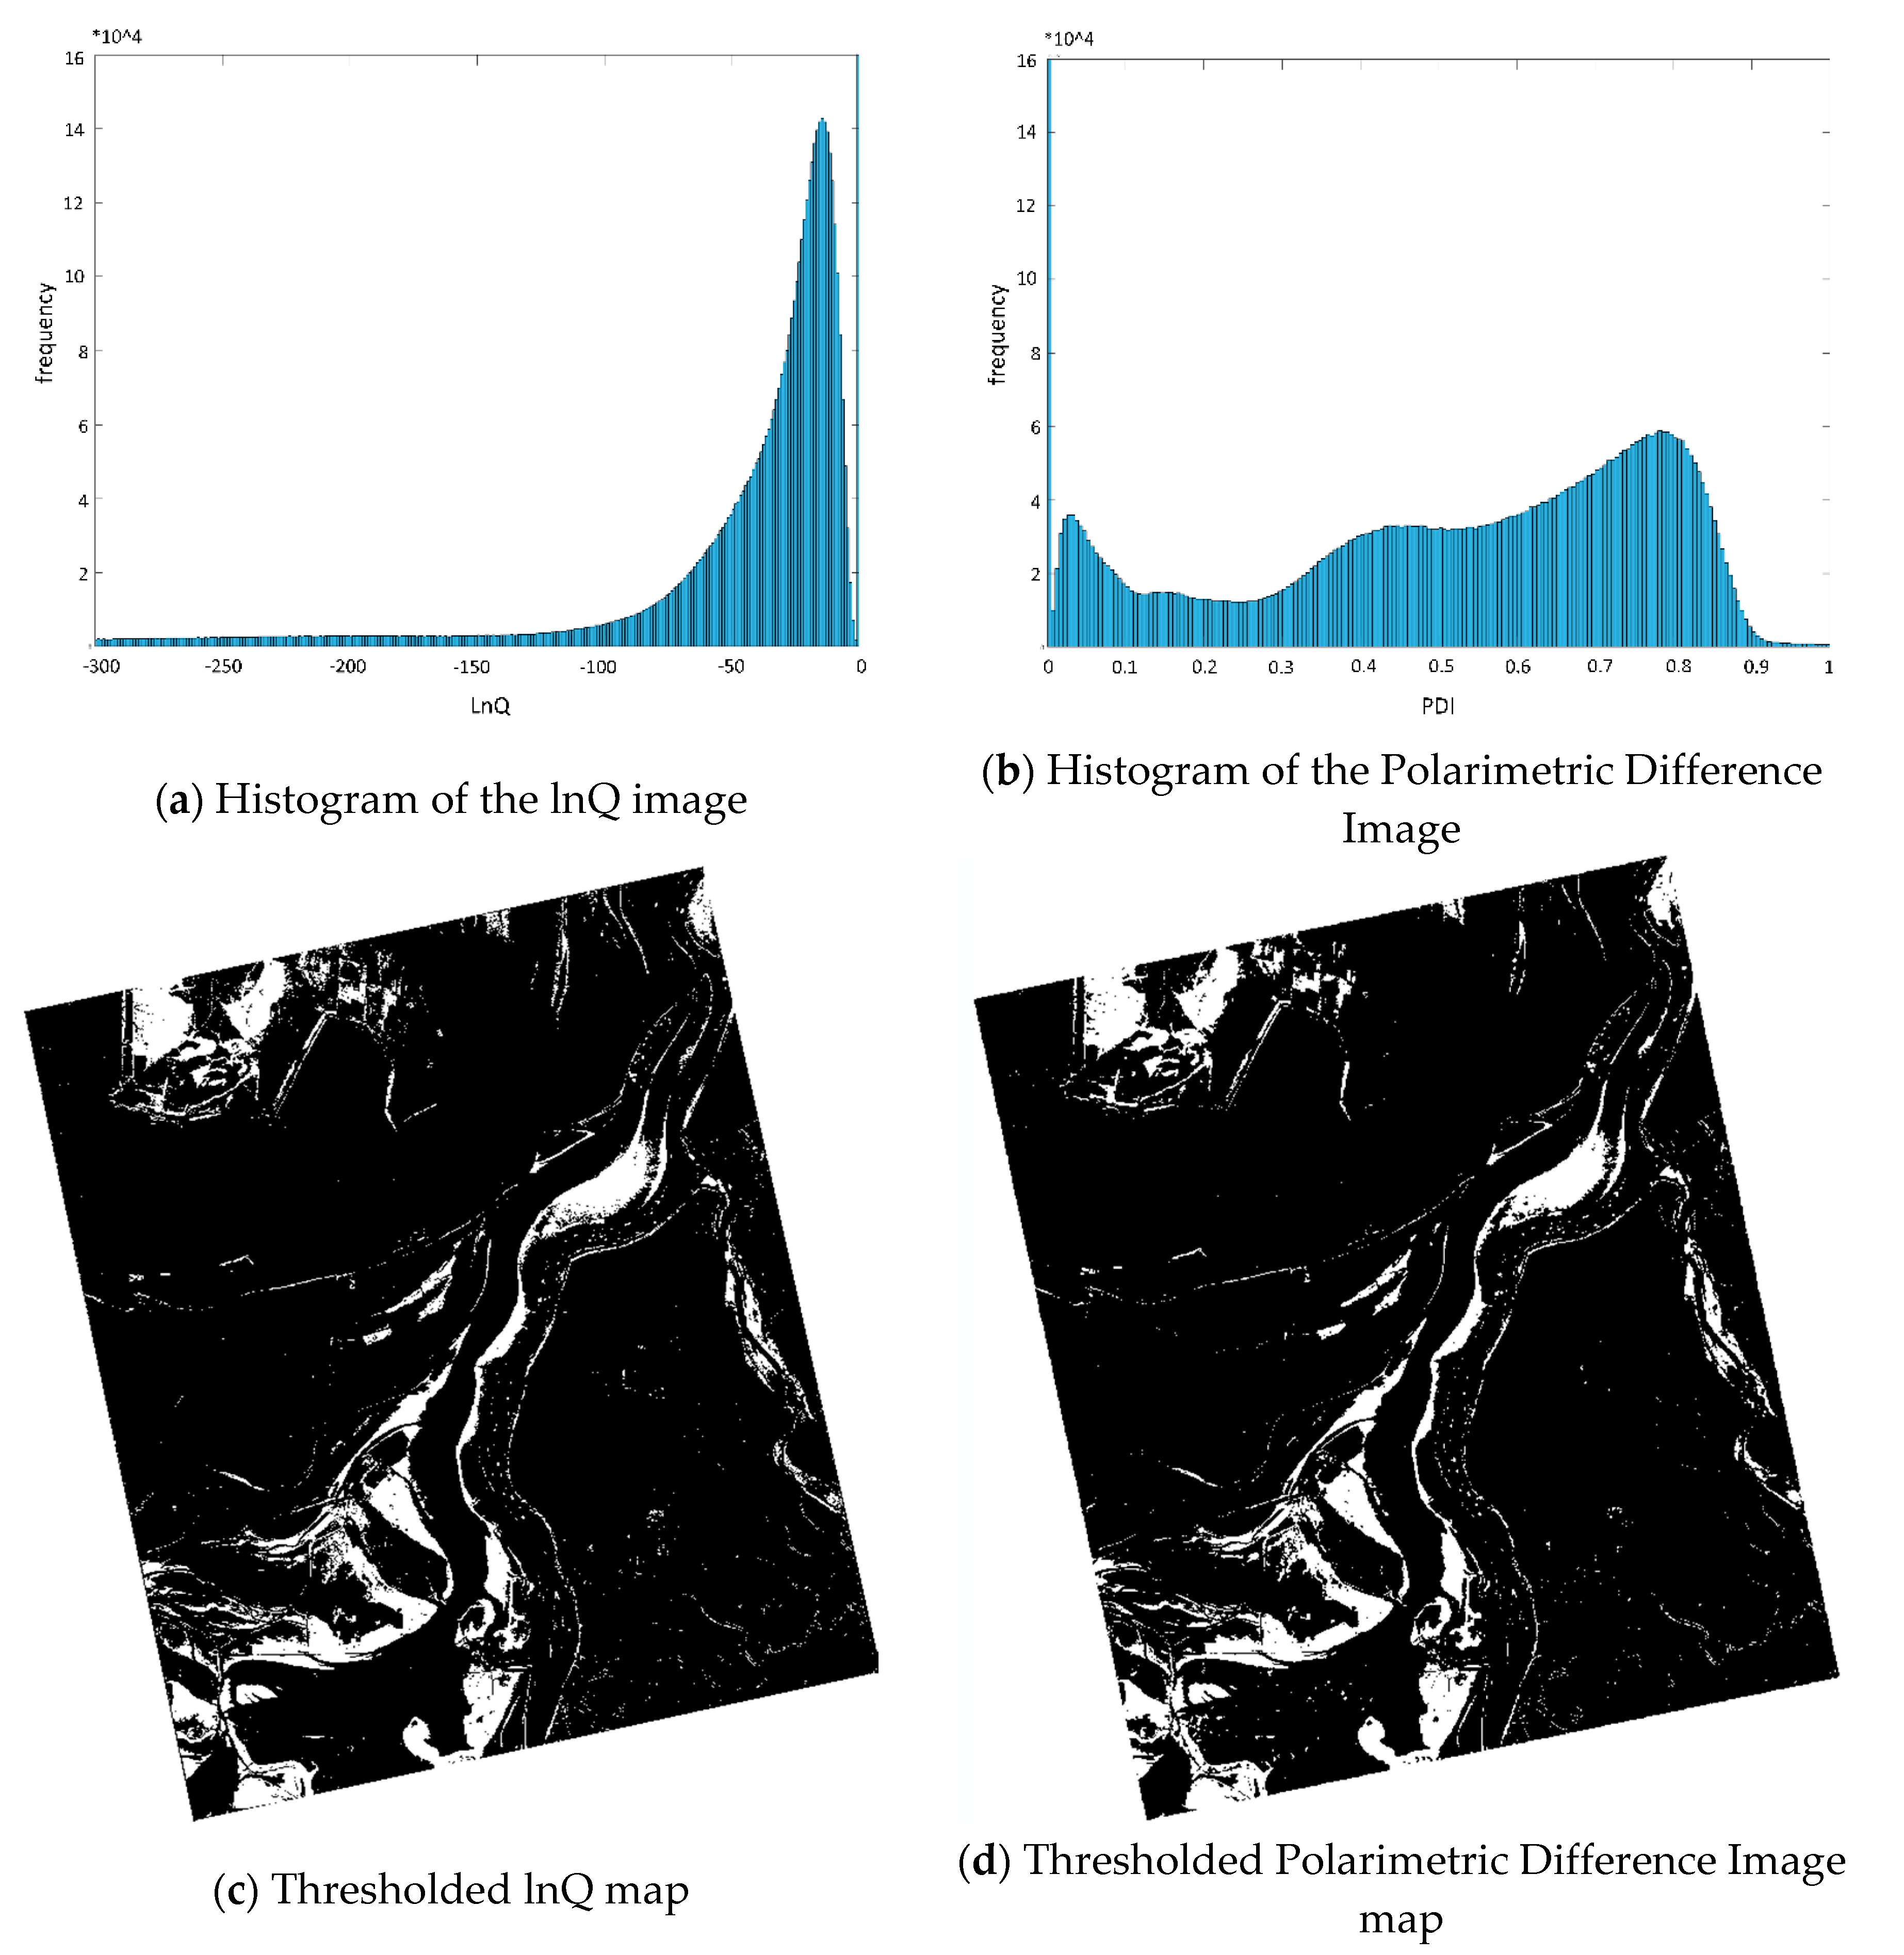
The histogram of the lnQ and PDI maps have been demonstrated in Figure 4a,b. Although both maps provided similar accuracies as presented in the Discussion section, their corresponding histograms were very different from each other. LnQ image has a unimodal histogram, which is difficult to be divided to more than two classes. The histogram corresponding to the PDI image, however, can be easily segmented to several parts, which makes it possible to divide the entire area into several classes of change. This is another advantage that the proposed method provides. The fact that there are more quantizations in the PDI image than the lnQ image is also clear from their histograms as well. Figure 4c,d demonstrates the binarized lnQ and PDI images. At first, both images look similar; however, the objects produced by the lnQ map appeared more speckled and disconnected compared to those in the PDI map. For example, the top left part of the lnQ image between the two large regions is slightly speckled, while this is not the case for the binarized PDI image. A detailed qualitative and quantitative assessment of the results is provided in the Discussion section.
4. Discussion
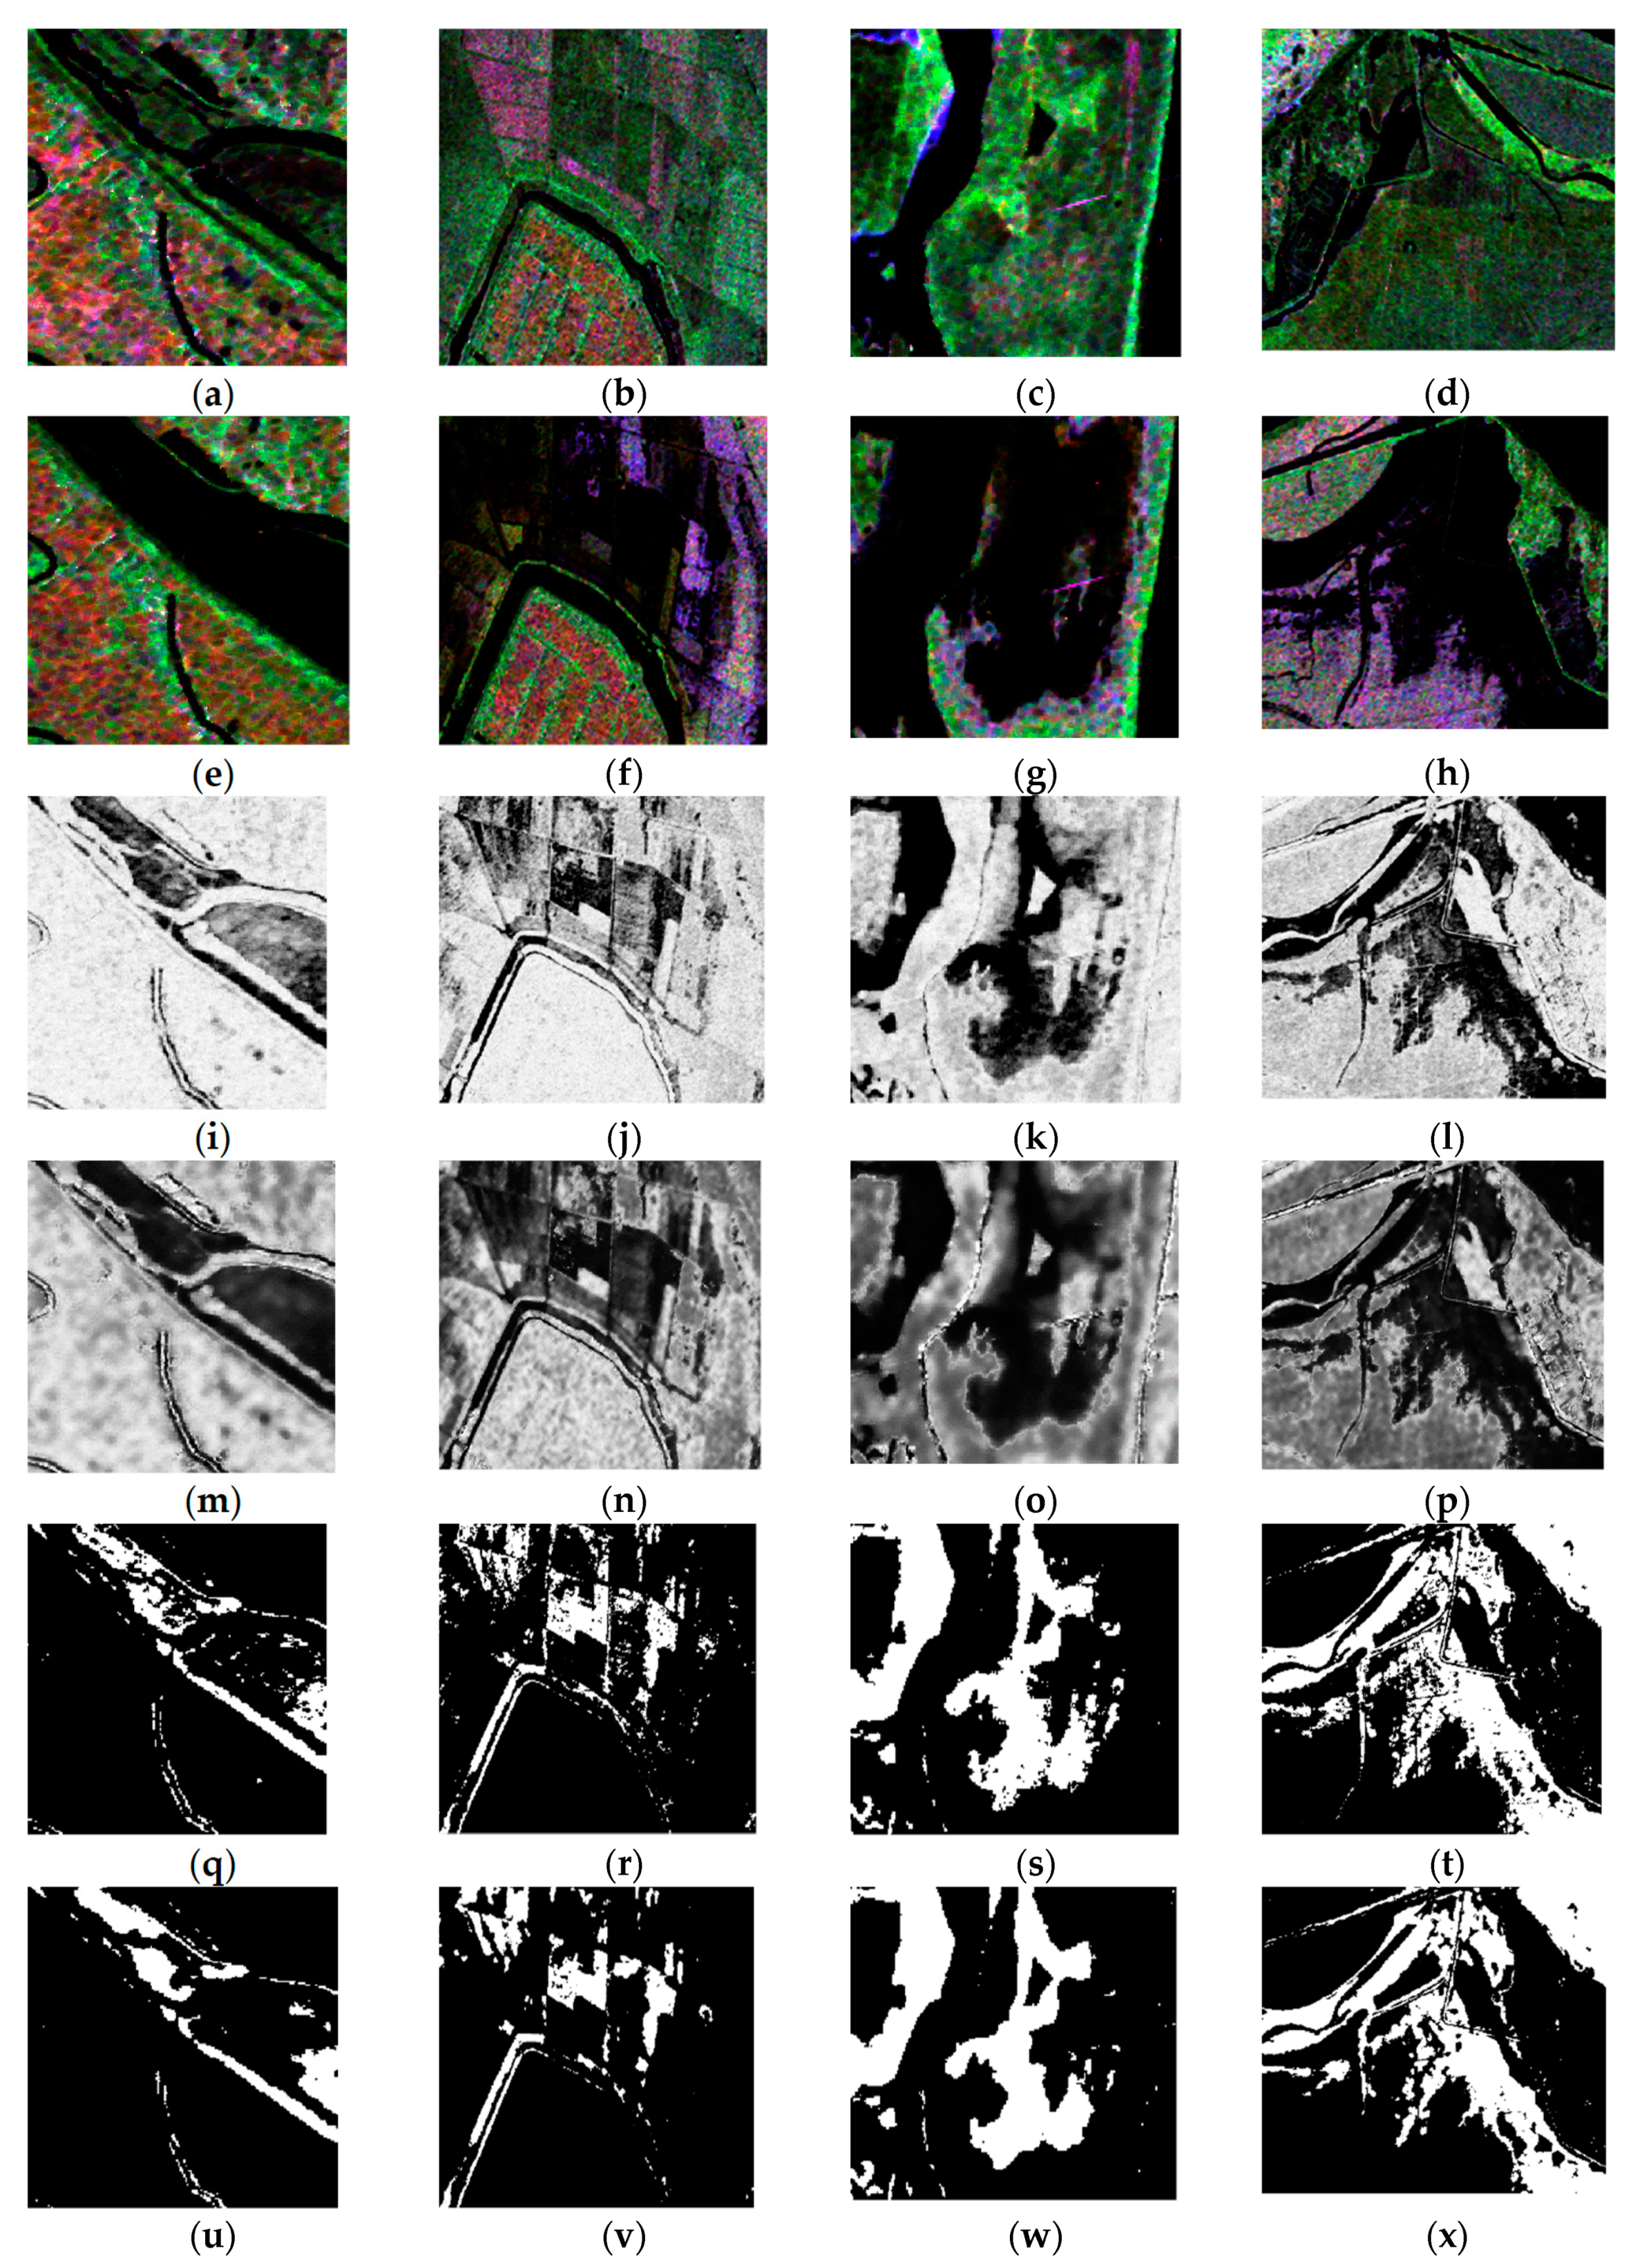
To examine the maps more closely, several subsets of the images were selected and the zoomed areas of the lnQ and PDI images, along with their corresponding binary maps, are depicted in Figure 5. While the zoomed regions in the lnQ map (Figure 5i–l) are slightly speckled, disparate, and unconnected, the corresponding regions in the PDI map (Figure 5m–p) are more homogeneous and linked. This has caused the thresholded lnQ map to contain more discrete and noisy objects (Figure 5q–t), while the binary PDI map provides clean and connected regions (Figure 5u–x).
For a quantitative assessment of both maps, the binarized maps were compared with the reference image (see Table 2). It is clear that both the lnQ and PDI methods generated a highly accurate map, with PCCs of 93% and 94% and Kappa coefficients of 0.82 and 0.86, respectively. However, the accuracies of the PDI map were slightly greater because neighbourhood information was considered. Interestingly, the number of FNs was high in the lnQ map, while the number of FPs was high in the PDI image. This showed that the lnQ index overestimated, while the PDI index underestimated the amount of change.
As observed in this research, including neighbourhood information in change detection studies significantly improves performance, particularly when polarimetric data are used. Therefore, including neighbourhood information in all change detection studies is recommended to produce results that can be adopted for operational purposes. This goal can be achieved for post-classification change detection methods if the classification for both acquisition dates is conducted within an object-based manner, which, in turn, makes the change detection map object-based as well. For pre-classification methods, however, innovative techniques that include neighbourhood information are required. Although such methods increase the computational complexity compared to the metrics in which only the statistics of the individual pixels are considered, this is not detrimental given that change detection is not a real time application and it is the accuracy of the output rather than computational efficiency of the method that is more important. Recently, several state-of-the-art SAR change detection techniques, for example based on the coherency image [29], autoencoders [30], or deep learning techniques [31] have been introduced, which have a superior performance over the traditional methods. Regardless of the applied techniques, including neighborhood information in the SAR change detection process can increase the accuracy of the measure. Therefore, it is recommended to include neighbourhood information in the state-of-the-art SAR techniques, to further improve their performance.
5. Conclusions
In this study, a polarimetric index for change detection was introduced based on the ratio of span (total power), which exploits neighbourhood information in PolSAR images. The index was applied to a flooding event in Dongting Lake, Hunan, China, and was then compared with the Wishart MLR test, another measure for polarimetric change detection. The results demonstrated that although both measures produced change detection maps with comparably high accuracies, the objects produced by the proposed change detection measure were more homogeneous and less noisy. Additionally, the lnQ map overestimated the amount of change, while underestimation occurred in the PDI map. The result of this research demonstrates the importance of including neighbourhood information in change detection analyses. This not only produces more connected and less noisy objects, but also increases the consistency and confidence in the results, which in turn facilitates making managerial decisions. The method applied in this paper could also be extended to other well-known change detection metrics to improve their performance. Overall, the index applied in this paper is a quick, effective, and accurate method for delineating areas affected by flood, which could be utilized operationally to minimize the consequences of flooding while facilitating immediate action following such events.
Author Contributions
Conceptualization, S.M.; data curation, B.B.; formal analysis, S.M.; funding acquisition, B.S., W.H. and B.B.; methodology, S.M.; project administration, B.B.; supervision, B.S. and W.H.; validation, S.M.; visualization, M.A.; writing—original draft, S.M.; Writing—review and editing, M.A. and B.B.
Funding
This project was funded by the federal Department of Environment and Climate Change, and Natural Sciences and Engineering Research Council of Canada (NSERC) under Grants to B. Salehi (NSERC RGPIN-2015-05027). The work of W. Huang was supported by the Natural Sciences and Engineering Research Council of Canada (NSERC) Discovery Grant RGPIN-2017-04508.
Acknowledgments
This project was undertaken with the financial support of the Government of Canada through the federal Department of Environment and Climate Change, and Natural Sciences and Engineering Research Council of Canada (NSERC) under Grants to B. Salehi (NSERC RGPIN-2015-05027). The work of W. Huang was supported by the Natural Sciences and Engineering Research Council of Canada (NSERC) Discovery Grant RGPIN-2017-04508. Brian Brisco was supported by the RSS program at CCMEO.
Conflicts of Interest
The authors declare no conflict of interest.
References
- De Moel, H.; van Alphen, J.; Aerts, J. Flood maps in Europe-methods, availability and use. Nat. Hazards Earth Syst. Sci. 2009, 9, 289–301. [Google Scholar] [CrossRef]
- Du, X.; Hendy, I.; Schimmelmann, A. A 9000-year flood history for Southern California: A revised stratigraphy of varved sediments in Santa Barbara Basin. Mar. Geol. 2018, 397, 29–42. [Google Scholar] [CrossRef]
- Milly, P.C.D.; Wetherald, R.T.; Dunne, K.A.; Delworth, T.L. Increasing risk of great floods in a changing climate. Nature 2002, 415, 514. [Google Scholar] [CrossRef]
- Kundzewicz, Z.W.; Mata, L.J.; Arnell, N.W.; Doll, P.; Kabat, P.; Jimenez, B.; Miller, K.; Oki, T.; Zekai, S.; Shiklomanov, I. Freshwater resources and their management. In Climate Change 2007: Impacts, Adaptation and Vulnerability. Contribution of Working Group II to the Fourth Assessment Report of the Intergovernmental Panel on Climate Change; Parry, M.L., Canziani, O.F., Palutikof, J.P., Eds.; Cambridge University Press: Cambridge, UK, 2007. [Google Scholar]
- Kreibich, H.; Pech, I.; Schröter, K.; Müller, M.; Thieken, A.H. New insights into flood warning and emergency response from the perspective of affected parties. Nat. Hazards Earth Syst. Sci. Discuss. Rev. 2016. [Google Scholar] [CrossRef]
- Follum, M.L.; Tavakoly, A.A.; Niemann, J.D.; Snow, A.D. AutoRAPID: A model for prompt streamflow estimation and flood inundation mapping over regional to continental extents. JAWRA J. Am. Water Resour. Assoc. 2017, 53, 280–299. [Google Scholar] [CrossRef]
- Merwade, V.; Rajib, A.; Liu, Z. An integrated approach for flood inundation modeling on large scales. In Bridging Science and Policy Implication for Managing Climate Extremes; World Scientific Publication Company: Singapore, 2018; Chapter 9; pp. 133–155. [Google Scholar]
- Giustarini, L.; Hostache, R.; Matgen, P.; Schumann, G.J.-P.; Bates, P.D.; Mason, D.C. A change detection approach to flood mapping in urban areas using TerraSAR-X. IEEE Trans. Geosci. Remote Sens. 2012, 51, 2417–2430. [Google Scholar] [CrossRef]
- Huang, S.; Cai, X.; Chen, S.; Liu, D. Change detection method based on fractal model and wavelet transform for multitemporal SAR images. Int. J. Appl. Earth Obs. Geoinf. 2011, 13, 863–872. [Google Scholar] [CrossRef]
- Verbesselt, J.; Hyndman, R.; Zeileis, A.; Culvenor, D. Phenological change detection while accounting for abrupt and gradual trends in satellite image time series. Remote Sens. Environ. 2010, 114, 2970–2980. [Google Scholar] [CrossRef] [Green Version]
- Rokni, K.; Ahmad, A.; Solaimani, K.; Hazini, S. A new approach for surface water change detection: Integration of pixel level image fusion and image classification techniques. Int. J. Appl. Earth Obs. Geoinf. 2015, 34, 226–234. [Google Scholar] [CrossRef]
- Hussain, M.; Chen, D.; Cheng, A.; Wei, H.; Stanley, D. Change detection from remotely sensed images: From pixel-based to object-based approaches. ISPRS J. Photogramm. Remote Sens. 2013, 80, 91–106. [Google Scholar] [CrossRef]
- Rignot, E.J.M.; van Zyl, J.J. Change detection techniques for ERS-1 SAR data. IEEE Trans. Geosci. Remote Sens. 1993, 31, 896–906. [Google Scholar] [CrossRef] [Green Version]
- Ma, J.; Gong, M.; Zhou, Z. Wavelet fusion on ratio images for change detection in SAR images. IEEE Geosci. Remote Sens. Lett. 2012, 9, 1122–1126. [Google Scholar] [CrossRef]
- Bazi, Y.; Bruzzone, L.; Melgani, F. Automatic identification of the number and values of decision thresholds in the log-ratio image for change detection in SAR images. IEEE Geosci. Remote Sens. Lett. 2006, 3, 349–353. [Google Scholar] [CrossRef]
- Yousif, O.; Ban, Y. Improving urban change detection from multitemporal SAR images using PCA-NLM. IEEE Trans. Geosci. Remote Sens. 2013, 51, 2032–2041. [Google Scholar] [CrossRef]
- Cheng, Y.-Q.; Li, H.-C.; Celik, T.; Zhang, F. FRFT-based improved algorithm of unsupervised change detection in SAR images via PCA and K-means clustering. In Proceedings of the 2013 IEEE International Geoscience and Remote Sensing Symposium (IGARSS), Melbourne, Australia, 21–26 July 2013; pp. 1952–1955. [Google Scholar]
- Qi, Z.; Yeh, A.G.-O. Integrating change vector analysis, post-classification comparison, and object-oriented image analysis for land use and land cover change detection using RADARSAT-2 polarimetric SAR images. In Advances in Spatial Data Handling; Springer: Berlin, Germany, 2013; pp. 107–123. [Google Scholar]
- Molinier, M.; Rauste, Y. Comparison and evaluation of polarimetric change detection techniques in aerial SAR data. In Proceedings of the 2007 IEEE International Geoscience and Remote Sensing Symposium, IGARSS 2007, Barcelona, Spain, 23–27 July 2007; pp. 2386–2389. [Google Scholar]
- Conradsen, K.; Nielsen, A.A.; Schou, J.; Skriver, H. A test statistic in the complex Wishart distribution and its application to change detection in polarimetric SAR data. IEEE Trans. Geosci. Remote Sens. 2003, 41, 4–19. [Google Scholar] [CrossRef]
- Dabboor, M.; White, L.; Brisco, B.; Charbonneau, F. Change detection with compact polarimetric SAR for monitoring wetlands. Can. J. Remote Sens. 2015, 41, 408–417. [Google Scholar] [CrossRef]
- Liu, M.; Zhang, H.; Wang, C.; Shan, Z. Urban change detection for high-resolution fully polarimetric SAR using a modified heterogeneous clutter model. In Proceedings of the 9th European Conference on Synthetic Aperture Radar, 2012 EUSAR, Piscataway, NJ, USA, 23–26 April 2012; pp. 87–90. [Google Scholar]
- Gong, M.; Cao, Y.; Wu, Q. A neighborhood-based ratio approach for change detection in SAR images. IEEE Geosci. Remote Sens. Lett. 2012, 9, 307–311. [Google Scholar] [CrossRef]
- Jia, L.; Li, M.; Wu, Y.; Zhang, P.; Chen, H.; An, L. Semisupervised SAR image change detection using a cluster-neighborhood kernel. IEEE Geosci. Remote Sens. Lett. 2014, 11, 1443–1447. [Google Scholar] [CrossRef]
- Jia, L.; Li, M.; Zhang, P.; Wu, Y.; Zhu, H. SAR image change detection based on multiple kernel K-means clustering with local-neighborhood information. IEEE Geosci. Remote Sens. Lett. 2016, 13, 856–860. [Google Scholar] [CrossRef]
- Lee, J.-S.; Grunes, M.R.; de Grandi, G. Polarimetric SAR speckle filtering and its implication for classification. IEEE Trans. Geosci. Remote Sens. 1999, 37, 2363–2373. [Google Scholar]
- Otsu, N. A threshold selection method from gray-level histograms. IEEE Trans. Syst. Man. Cybern. 1979, 9, 62–66. [Google Scholar] [CrossRef]
- Cohen, J. A coefficient of agreement for nominal scales. Educ. Psychol. Meas. 1960, 20, 37–46. [Google Scholar] [CrossRef]
- West, R.D.; Riley, R.M. Polarimetric Interferometric SAR Change Detection Discrimination. IEEE Trans. Geosci. Remote Sens. 2018, 57, 3091–3104. [Google Scholar] [CrossRef]
- Liu, G.; Li, L.; Jiao, L.; Dong, Y.; Li, X. Stacked Fisher Autoencoder for SAR Change Detection. Pattern Recognit. 2019, 96, 106971. [Google Scholar] [CrossRef]
- Lv, N.; Chen, C.; Qiu, T.; Sangaiah, A.K. Deep learning and superpixel feature extraction based on contractive autoencoder for change detection in SAR images. IEEE Trans. Ind. Inform. 2018, 14, 5530–5538. [Google Scholar] [CrossRef]
Figure 1.
Two optical images over the study area, (a) before and (b) after a flood event.

Figure 2.
The color composite of the SAR images (a) before and (b) after the flooding event. Red, green, and blue channels correspond to the HH, HV, and VV intensity images, respectively. (c) The reference image.
Figure 2.
The color composite of the SAR images (a) before and (b) after the flooding event. Red, green, and blue channels correspond to the HH, HV, and VV intensity images, respectively. (c) The reference image.

Figure 3.
Change detection maps obtained by (a) lnQ and (b) Polarimetric Difference Image (PDI) measures.
Figure 3.
Change detection maps obtained by (a) lnQ and (b) Polarimetric Difference Image (PDI) measures.

Figure 4.
Histograms and thresholded change detection maps obtained using lnQ (a,c, respectively) and Polarimetric Difference Image measures (b,d, respectively).
Figure 4.
Histograms and thresholded change detection maps obtained using lnQ (a,c, respectively) and Polarimetric Difference Image measures (b,d, respectively).

Figure 5.
Selected samples of image pairs and their corresponding change detection maps: the colour composite of the image (a–d) before and (e–h) after the flooding event; (i–l) the lnQ map; (m–p) the Polarimetric Difference Image (PDI) map; (q–t) the thresholded lnQ map and (u–x) the thresholded PDI map.


Table 1.
The characteristics of the images used in this study.
| Acquisition Date | Mode | Polarization Type | Incidence Angle Range (degrees) | Nominal Range Resolution (m) |
|---|---|---|---|---|
| 06 June 2008 17 August 2008 | FQ16 | Quad-pol | 35.4–37 | 8.6–9 |
Table 2.
Accuracy assessment of the change detection maps obtained by both methods.
| Measures | lnQ | PDI |
|---|---|---|
| FN | 556,122 | 11,057 |
| FP | 13,325 | 464,162 |
| TN | 5,364,371 | 4,913,534 |
| TP | 1,822,370 | 2,367,435 |
| OE | 569,447 | 475,219 |
| PCC | 0.927 | 0.938 |
| Kappa | 0.816 | 0.863 |
© 2019 by the authors. Licensee MDPI, Basel, Switzerland. This article is an open access article distributed under the terms and conditions of the Creative Commons Attribution (CC BY) license (http://creativecommons.org/licenses/by/4.0/).
Share and Cite
MDPI and ACS Style
Mahdavi, S.; Salehi, B.; Huang, W.; Amani, M.; Brisco, B. A PolSAR Change Detection Index Based on Neighborhood Information for Flood Mapping. Remote Sens. 2019, 11, 1854. https://doi.org/10.3390/rs11161854
AMA Style
Mahdavi S, Salehi B, Huang W, Amani M, Brisco B. A PolSAR Change Detection Index Based on Neighborhood Information for Flood Mapping. Remote Sensing. 2019; 11(16):1854. https://doi.org/10.3390/rs11161854
Chicago/Turabian StyleMahdavi, Sahel, Bahram Salehi, Weimin Huang, Meisam Amani, and Brian Brisco. 2019. "A PolSAR Change Detection Index Based on Neighborhood Information for Flood Mapping" Remote Sensing 11, no. 16: 1854. https://doi.org/10.3390/rs11161854
Note that from the first issue of 2016, this journal uses article numbers instead of page numbers. See further details here.