Spatial Upscaling of Tree-Ring-Based Forest Response to Drought with Satellite Data
by
 , and
, and
Peipei Xu
1,2,3,4, 
Wei Fang
4,
Tao Zhou
2,3,*,
Xiang Zhao
5,
Hui Luo
2,3,
George Hendrey
4,6 and
Chuixiang Yi
4,6
1
School of Geography and Tourism, Anhui Normal University, Wuhu 241002, China
2
State Key Laboratory of Earth Surface Processes and Resource Ecology, Faculty of Geographical Science, Beijing Normal University, Beijing 100875, China
3
Key Laboratory of Environmental Change and Natural Disaster, Ministry of Education, Beijing Normal University, Beijing 100875, China
4
School of Earth and Environmental Sciences, Queens College of the City University of New York, New York, NY 11367, USA
5
State Key Laboratory of Remote Sensing Science, Jointly Sponsored by Beijing Normal University and Institute of Remote Sensing and Digital Earth of Chinese Academy of Sciences, Beijing 100875, China
6
Earth and Environmental Sciences Department, the Graduate Center of the City University of New York, New York, NY 10016, USA
*
Author to whom correspondence should be addressed.
Remote Sens. 2019, 11(20), 2344; https://doi.org/10.3390/rs11202344
Submission received: 24 September 2019
/
Revised: 7 October 2019
/
Accepted: 8 October 2019
/
Published: 10 October 2019
(This article belongs to the Special Issue Remote Sensing of Forest Growth in a Changing Climate)
Abstract
:We have integrated the observational capability of satellite remote sensing with plot-scale tree-ring data to upscale the evaluation of forest responses to drought. Satellite data, such as the normalized difference vegetation index (NDVI), can provide a spatially continuous measure with limited temporal coverage, while tree-ring width index (RWI) provides an accurate assessment with a much longer time series at local scales. Here, we explored the relationship between RWI and NDVI of three dominant species in the Southwestern United States (SWUS) and predicted RWI spatial distribution from 2001 to 2017 based on Moderate Resolution Imaging Spectroradiometer (MODIS) 1-km resolution NDVI data with stringent quality control. We detected the optimum time windows (around June–August) during which the RWI and NDVI were most closely correlated for each species, when the canopy growth had the greatest effect on growth of tree trunks. Then, using our upscaling algorithm of NDVI-based RWI, we were able to detect the significant impact of droughts in 2002 and in 2011–2014, which supported the validity of this algorithm in quantifying forest response to drought on a large scale.
1. Introduction
The frequencies and intensities of drought events are increasing under the influence of warming climate [1,2], with impacts on forest ecosystems such as increased tree mortality and decreased forest productivity [3,4,5,6]. Data from multiple sources, ranging from ground-based to satellite-based observations, have been used to demonstrate forest response to climate change [7,8,9,10,11]. However, these datasets are often utilized independently, each specialized in their unique spatial and temporal scales [12]. We set about developing a holistic approach to link these datasets and to combine their strengths [13,14,15].
Tree rings can provide valuable information on tree growth response to climatic trends and its inter-annual variability [5,16,17,18]. Tree rings can also be used for climate model validation in the context of global warming assessment, such as verifying the results derived from net primary productivity (NPP) models [19,20,21,22]. The major advantages of tree rings as climate change indicators are their high temporal resolution, extensively distributed specimen, long-term series, and exact dating [5]. However, due to the limitation of tree core acquisition, tree-ring series records are spatially discontinuous and only reflect forest responses to climate at local scales. The patchiness of spatial coverage of tree-ring data limits their availability. If a regional indicator of tree growth can be developed as a reliable surrogate of tree-ring width, it would allow the reverse process: upscaling of tree-ring data to a regional level [23,24]. Furthermore, to the extent that tree growth is a surrogate for climate conditions [9,23,25], it would allow another technique for evaluating prior climate conditions at regional, and perhaps global, scales.
Living green plants absorb radiation in portions of the visible wavelengths and reflect the near-infrared (NIR) wavelengths. The NIR and red reflectance are sensitive to variations in forest growth parameters including leaf area index (LAI) and chlorophyll content of leaves [26,27,28]. Multispectral sensors have spectral bands from the visible and infrared wavelengths that can be combined into vegetation indexes [29,30]. Several vegetation indexes (VI) have been used in disturbance and drought studies [10,31,32], many of which utilize the NIR and red bands. The normalized difference vegetation index (NDVI) is the most widely used vegetation index to document and monitor drought and related impacts in forests [26,33,34]. The NDVI signal is easily saturated in areas with high vegetation coverage where the enhance vegetation index (EVI), which incorporates the blue waveband to improve its sensitivity, is more preferred [35]. The NDVI is still more sensitive and preferred in monitoring areas with medium and low vegetation coverage such as the semi-arid area in the Southwestern United States [10]. Compared to traditional field measurements often taken at a local scale within a short time span, vegetation indices from remote sensing can provide vegetation growth data at a much greater spatial extent with continuity, and with a highly versatile temporal scale ranging from daily to yearly.
Many prior studies have reported strong positive correlations between summer NDVI and tree-ring width [23,24,28]. It is commonly agreed that there are stronger correlations between these vegetation indices and the actual plant growth during the growing season than the non-growing season or the entire year [23,36,37]. However, there are two potential problems to this practice. First, there is an underlying assumption that all months of the growing season make an equal contribution to the signal strength of vegetation indices representing the actual plant growth, which is not always true [38,39]. Second, different regions may have different time spans for their growing seasons, and different species within the same region may have different phenology [38,39]. Extensive prior knowledge about the region is required to choose the “right” period of the growing season.
In this study, we propose an approach to identify the optimum time period during which the vegetation indices have the strongest signal for relative biomass accumulation. Compared to using a whole year of data, this approach would require less data and greatly enhance computational efficiency; compared to using a certain period of the growing season, this approach would require no prior knowledge about the study areas and species. Specifically, we explore the relationship between NDVI data with varying time spans and RWI data in the Southwestern United States (SWUS). The satellite-based NDVI reflects the growth of canopy leaves, while the field-measured tree-ring width index (RWI) reflects trunk biomass increments as the result of leaf photosynthesis. As a result, we will establish an optimum link between satellite observations and tree growth of various species, which allows the following upscaling of locally accurate growth measurement. To verify the validity of this upscaling approach, we will analyze the regional projection of RWI distribution over time (2001–2017), along with climate patterns during the same period. The overall objective of this study is to determine how to establish an optimum link between satellite observations and field measurements within a refined time window for the strongest correlation, so that we can use readily available satellite data to detect the forest long-term growth response to climate changes with better predictions.
2. Materials and Methods
2.1. Study Region
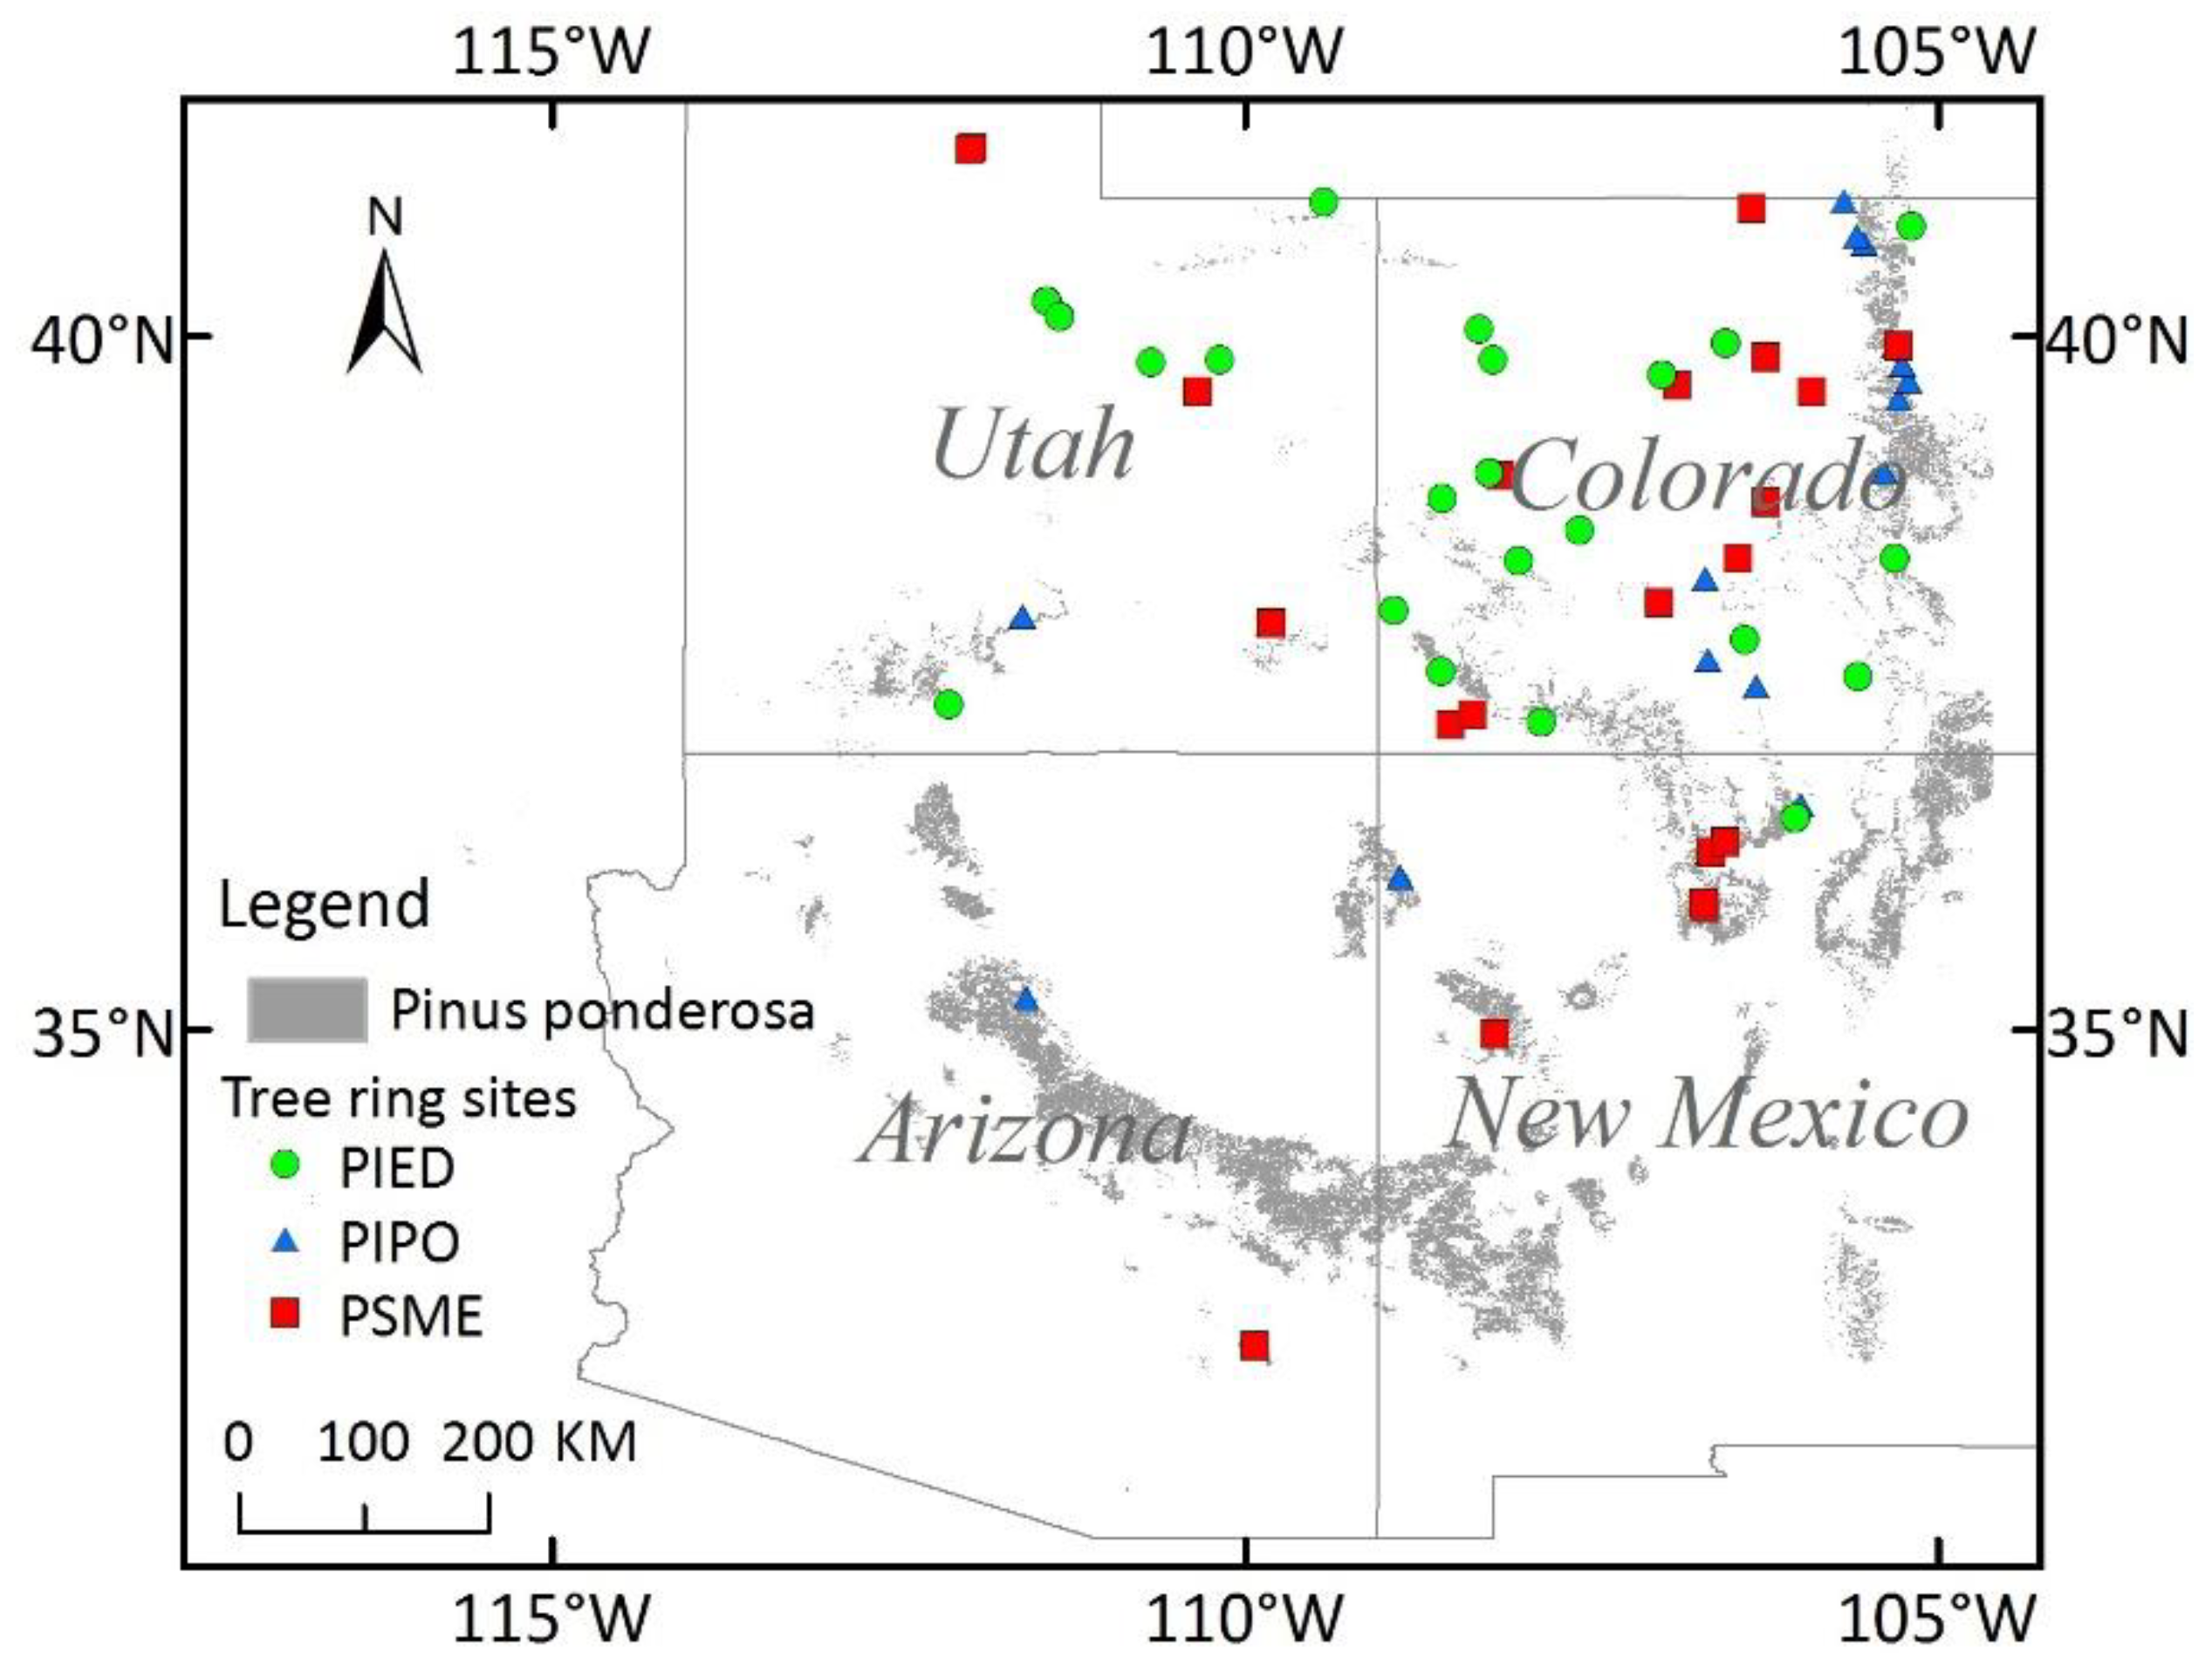
The study area is located in the Southwestern United States (SWUS), including the states of Utah, Colorado, Arizona, and New Mexico (Figure 1). As forests in the SWUS are mainly limited by water deficits, it is a typical area for researching vegetation index and tree-ring response to drought [5,7,40]. It provides us with a natural experiment by which we can develop a link between satellite observation and field measurements.
2.2. Tree Ring Data
The tree-ring data used was from the International Tree-Ring Data Bank (ITRDB), that is managed by national centers for environmental information’s paleoclimatology team and the World Data Center for Paleoclimatology (https://www.ncdc.noaa.gov/data-access/paleoclimatology-data/datasets/tree-ring). The information in the dataset includes geographic location, time, species, raw ring width, and sample size (number of the trees per site). The standard chronologies were created with the Program AutoRegressive STANdardization, by detrending and standardizing from tree-ring measurement series, then applying a robust estimation of the mean value function to remove the effects of endogenous stand disturbances [7]. The RWI value of 1000 represents mean growth values while the value of 0 represents no growth [7]. In this study, three dominant species, Pinus edulis (PIED), Pinus ponderosa (PIPO), and Pseudotsuga menziesii (PSME) in the SWUS, were chosen for upscaling the field measurements by revealing the relationship between vegetation index and tree-ring index. Those three species are the widespread dominant species in the region, and their RWI data are readily available in the tree-ring data bank. There are 22 sites of PIPO with 59 tree-ring records, 16 sites of PIED with 66 tree-ring records, and 22 sites of PSME with 125 tree-ring records after 2000.
2.3. Satellite Data
NDVI: Field measurements are not easy in the SWUS because of the region’s complex terrain. Especially for the tree-ring collection, large-scale tree-ring sampling is difficult. In this context, we would like to use the vegetation index to predict the growth of tree rings at a regional scale. The Southwestern United States is a semi-arid area. Forest coverage is not very high in this region so that the NDVI can be more sensitive for monitoring. Therefore, the responses of the subject forests to drought were quantified through use of MODIS NDVI (MOD13A3 Version 6) from 2001 to 2017, (http://modis.gsfc.nasa.gov/) which served to evaluate potential changes in forest leaf activity. These data have a spatial resolution of 1 km and monthly temporal resolution. In addition to the NDVI data, the MOD13A3 also includes a data layer of reliability assessment to evaluate NDVI data quality.
Forest map: Ponderosa pine (PIPO) is one of the most representative species in the Southwestern United States, so we chose PIPO for upscaling. Distribution of PIPO in the Southwestern United States was based on a recent, fine-scale analysis and classification available from the National Individual Tree Species Atlas (https://apps.fs.usda.gov/fsgisx01/rest/services/RDW_FHP_TreeSpeciesMetrics).
2.4. Climate Data
We use the standardized precipitation evapotranspiration index (SPEI) to quantify surface water deficit and surplus for the indicator of drought intensity [41,42,43]. SPEI data were obtained from the global SPEI dataset, which was based on monthly precipitation and potential evapotranspiration from the Climatic Research Unit (CRU) of the University of East Anglia (http://sac.csic.es/spei/database.html). Following the results from Huang et al. [7], the time-scale of the SPEI with the strongest correlation with RWI is a duration of 11 months ending in July in the SWUS. Therefore, we used the SPEI between the previous September and July of the subject year (11-month time-scale in July) to reveal the relationship between forest growth and drought [7,25].
2.5. Time-Scale Test and Empirical Model
2.5.1. Quality Assessment of NDVI Data
We used the reliability data layer in MOD13A3 dataset to evaluate the quality of the NDVI data. Pixels were divided into five levels of reliability (Table 1). Pixels evaluated as good (rank key = 0) and marginal (rank key = 1) provided reliable data, while data in pixels covered with snow/ice (rank key = 2, canopy may cover with snow) or cloudy (rank key = 3) were not available. (https://modis.gsfc.nasa.gov/data/dataprod/mod13.php). For each month, across all sites and all years, percentages of corresponding NDVI values with various reliability were calculated. Then, data with low quality (rank key = −1, 2 or 3) were replaced with averages from the same month of other available years. We calculated the average NDVI value of the month across the entire time-series instead of only from adjacent years, using only NDVI values of the month with good quality (rank key = 0 or 1). For example, there are 17 January NDVI values from 2001–2017 and only 14 January NDVI values with good quality. We calculated the average January NDVI value over the 14 values to replace the other 3.
2.5.2. Optimum Time Windows
For each year of a site, there is only a single annual value for the RWI to match with 144 NDVI values (12 ending months by 12 durations ranging from 1 month to 12 months). Each month may have multiple different values of NDVI accumulation over a spectrum of time spans (i = 1, 2, …, 12 months). For January, NDVI accumulation only has one time-scale of 1 month, for February it has two time-scales of 1 and 2 months, and for December it has twelve time-scales from 1 month to 12 months, indicating the status of forest growth ranging from short to long term. As a result, there are 78 (1 + 2 + …. + 11 + 12) different values of NDVI accumulation for each site within a calendar year. Thus NDVI accumulation can be expressed herein as NDVIi,j (the NDVI accumulation over the span of i months ending in the month j, j = January,…, December). NDVIi,j represents the forest growth during the various time windows which can be calculated by the sum of NDVI. The purpose here is to identify the optimum time window within which NDVI accumulation has the best correlation with its corresponding annual tree-ring growth (RWI). For each species, 78 Pearson correlation () coefficients will be calculated between all RWI records and each of the 78 permutation of NDVIi,j of the corresponding site and year, which can be expressed as a diagonal matrix of 12 by 12. The pixel (i, j) with the highest correlation coefficient indicates the optimum time window during which the canopy growth indicted by the NDVI has the tightest connection with the trunk growth/biomass accumulation indicted by the RWI.
2.5.3. Empirical Model
For the time window with the maximum correlation coefficient () of each species, i.e., during the time span of I months from month J backward (I,J is one of i,j, it represents the duration that NDVI has the strongest correlation with RWI), we identified the NDVI accumulation that had the strongest correlation with the RWI. We established a linear regression model of RWI over NDVII,J for PIPO. With this empirical model we are able to calculate its spatial distribution of RWI during 2001–2017 using the PIPO forest map and remote sensing data.
2.6. Temporal Trend Analysis at Regional Scale
It is a common practice to use linear regression in trend analysis on a per-pixel basis to reflect the change of forests’ growth [8,44,45]. In this study, trend analysis was conducted on a per-pixel basis using linear regression between RWI of PIPO and year (2001–2017) [8,44,45]. For each pixel, the slope was either significantly different from zero (p ≤ 0.05, positive or negative), or not different from zero (p > 0.05) [44]. Pixels identified with significant slopes were mapped as having either positive or negative temporal changes, and pixels with non-significant slopes were mapped as no consistent changes [8,46].
3. Results and Discussion
3.1. Quality Control of NDVI Data
Figure 2 shows the quality of monthly NDVI values of the pixels where the tree-ring plots were located. Data quality was generally high in April to October and low in November to March. Snow/ice cover (especially cover on the canopy) or cloudiness in winter resulted in low quality of satellite observations. Although the monthly NDVI data with low quality were replaced with the averages of monthly NDVI data with high quality from the same month of other years for this study, it is worth noticing such a strong seasonality in the data quality. This further highlights the importance of identifying optimum time windows for NDVI instead of blindly using data from the whole year. It also highlights that NDVI data from November through March is poor to use, and quality control will be warranted if the data during this time are needed.
3.2. Relationship between RWI and NDVI
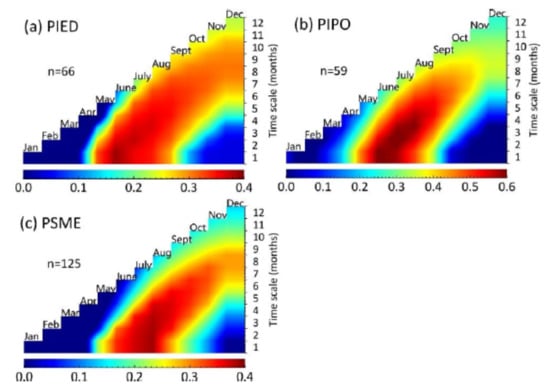
The relationships between the RWI and NDVI changed over time during the year (Figure 3, Tables S1–S3). The RWI of PIED was most relevant to NDVI in June ( = 0.39, p < 0.01, n = 66). For PIPO, RWI was most relevant to the NDVI accumulation in June to July ( = 0.623, p < 0.01, n = 59). For PSME, RWI was most relevant to the NDVI in August ( = 0.388, p < 0.01, n = 125). It is not surprising to see NDVI had a positive linear correlation with RWI, as both variables represent forest growth from different aspects: NDVI for canopy and RWI for trunk. Furthermore, our results showed that RWI had the strongest positive correlation with NDVI in June to August, varying slightly among different tree species. This is consistent with previous studies [23]. In the SWUS, the months of June to August are at the peak of the growing season [47,48], yielding more carbon surplus to be stored in the trunk [47], therefore leading to a higher correlation between canopy and trunk growth. We also conducted a similar study on the relationship between EVI and RWI, the maximum Pearson coefficient was 0.574 for EVI and 0.623 for NDVI in PIPO and similar for the other two species (both 0.390 for EVI and NDVI in PIED, and 0.412 for EVI and 0.388 for NDVI in PSME) (Figure S1). Therefore, NDVI is quite sensitive and suitable for monitoring vegetation growth in the Southwestern United States.
Vegetation indices of the whole growing season or of the whole year to indicate forest growth have been used [36,37]. However, our results showed that vegetation indices such as NDVI and tree-ring index such as RWI are most related in specific time windows of the year [23,49]. Compared to using data of the whole growing season or whole year, using the optimum time window requires less data and computing power with enhanced correlation between satellite observations and biological parameters. In addition, we found that the optimum time windows were different for different tree species due to their specific phenology. Therefore, the optimum time windows should be species-specific when correlations between satellite observations and biological parameters are considered.
3.3. Analyses of RWI over Space and Time
3.3.1. RWI Upscaling
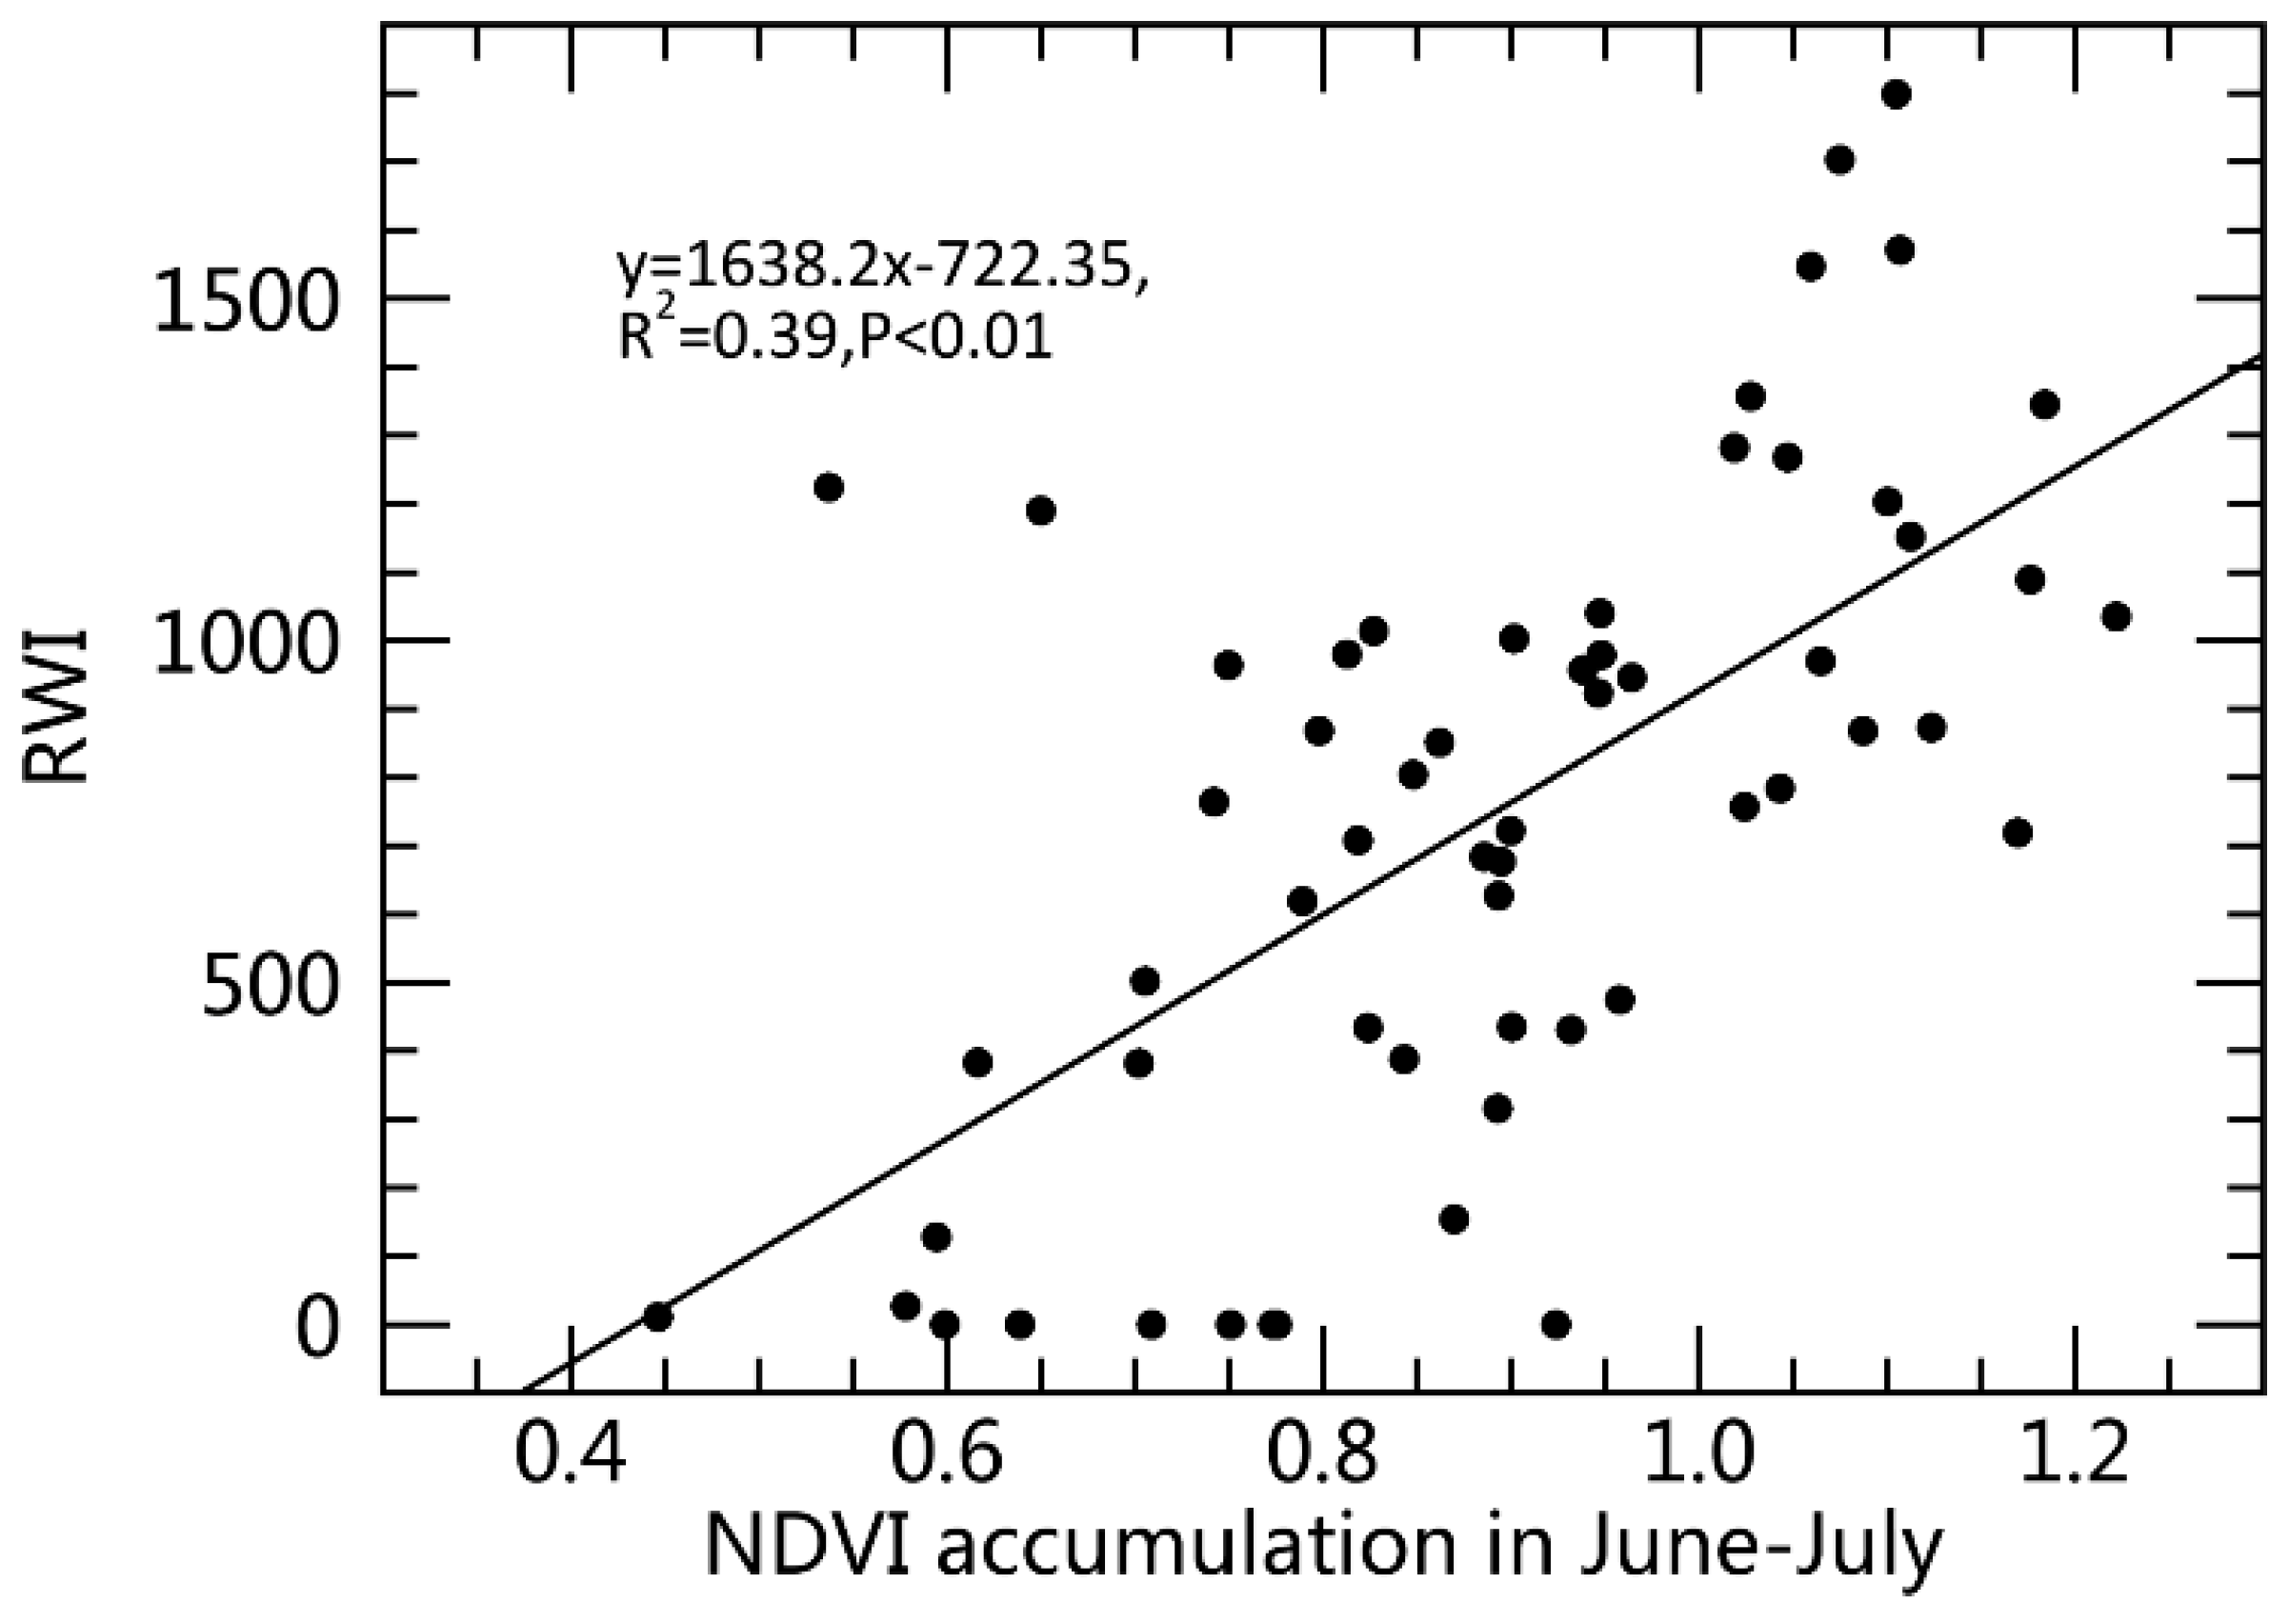
The linear regression of RWI over NDVI accumulation during the detected optimum time window for PIPO (Figure 4) is:
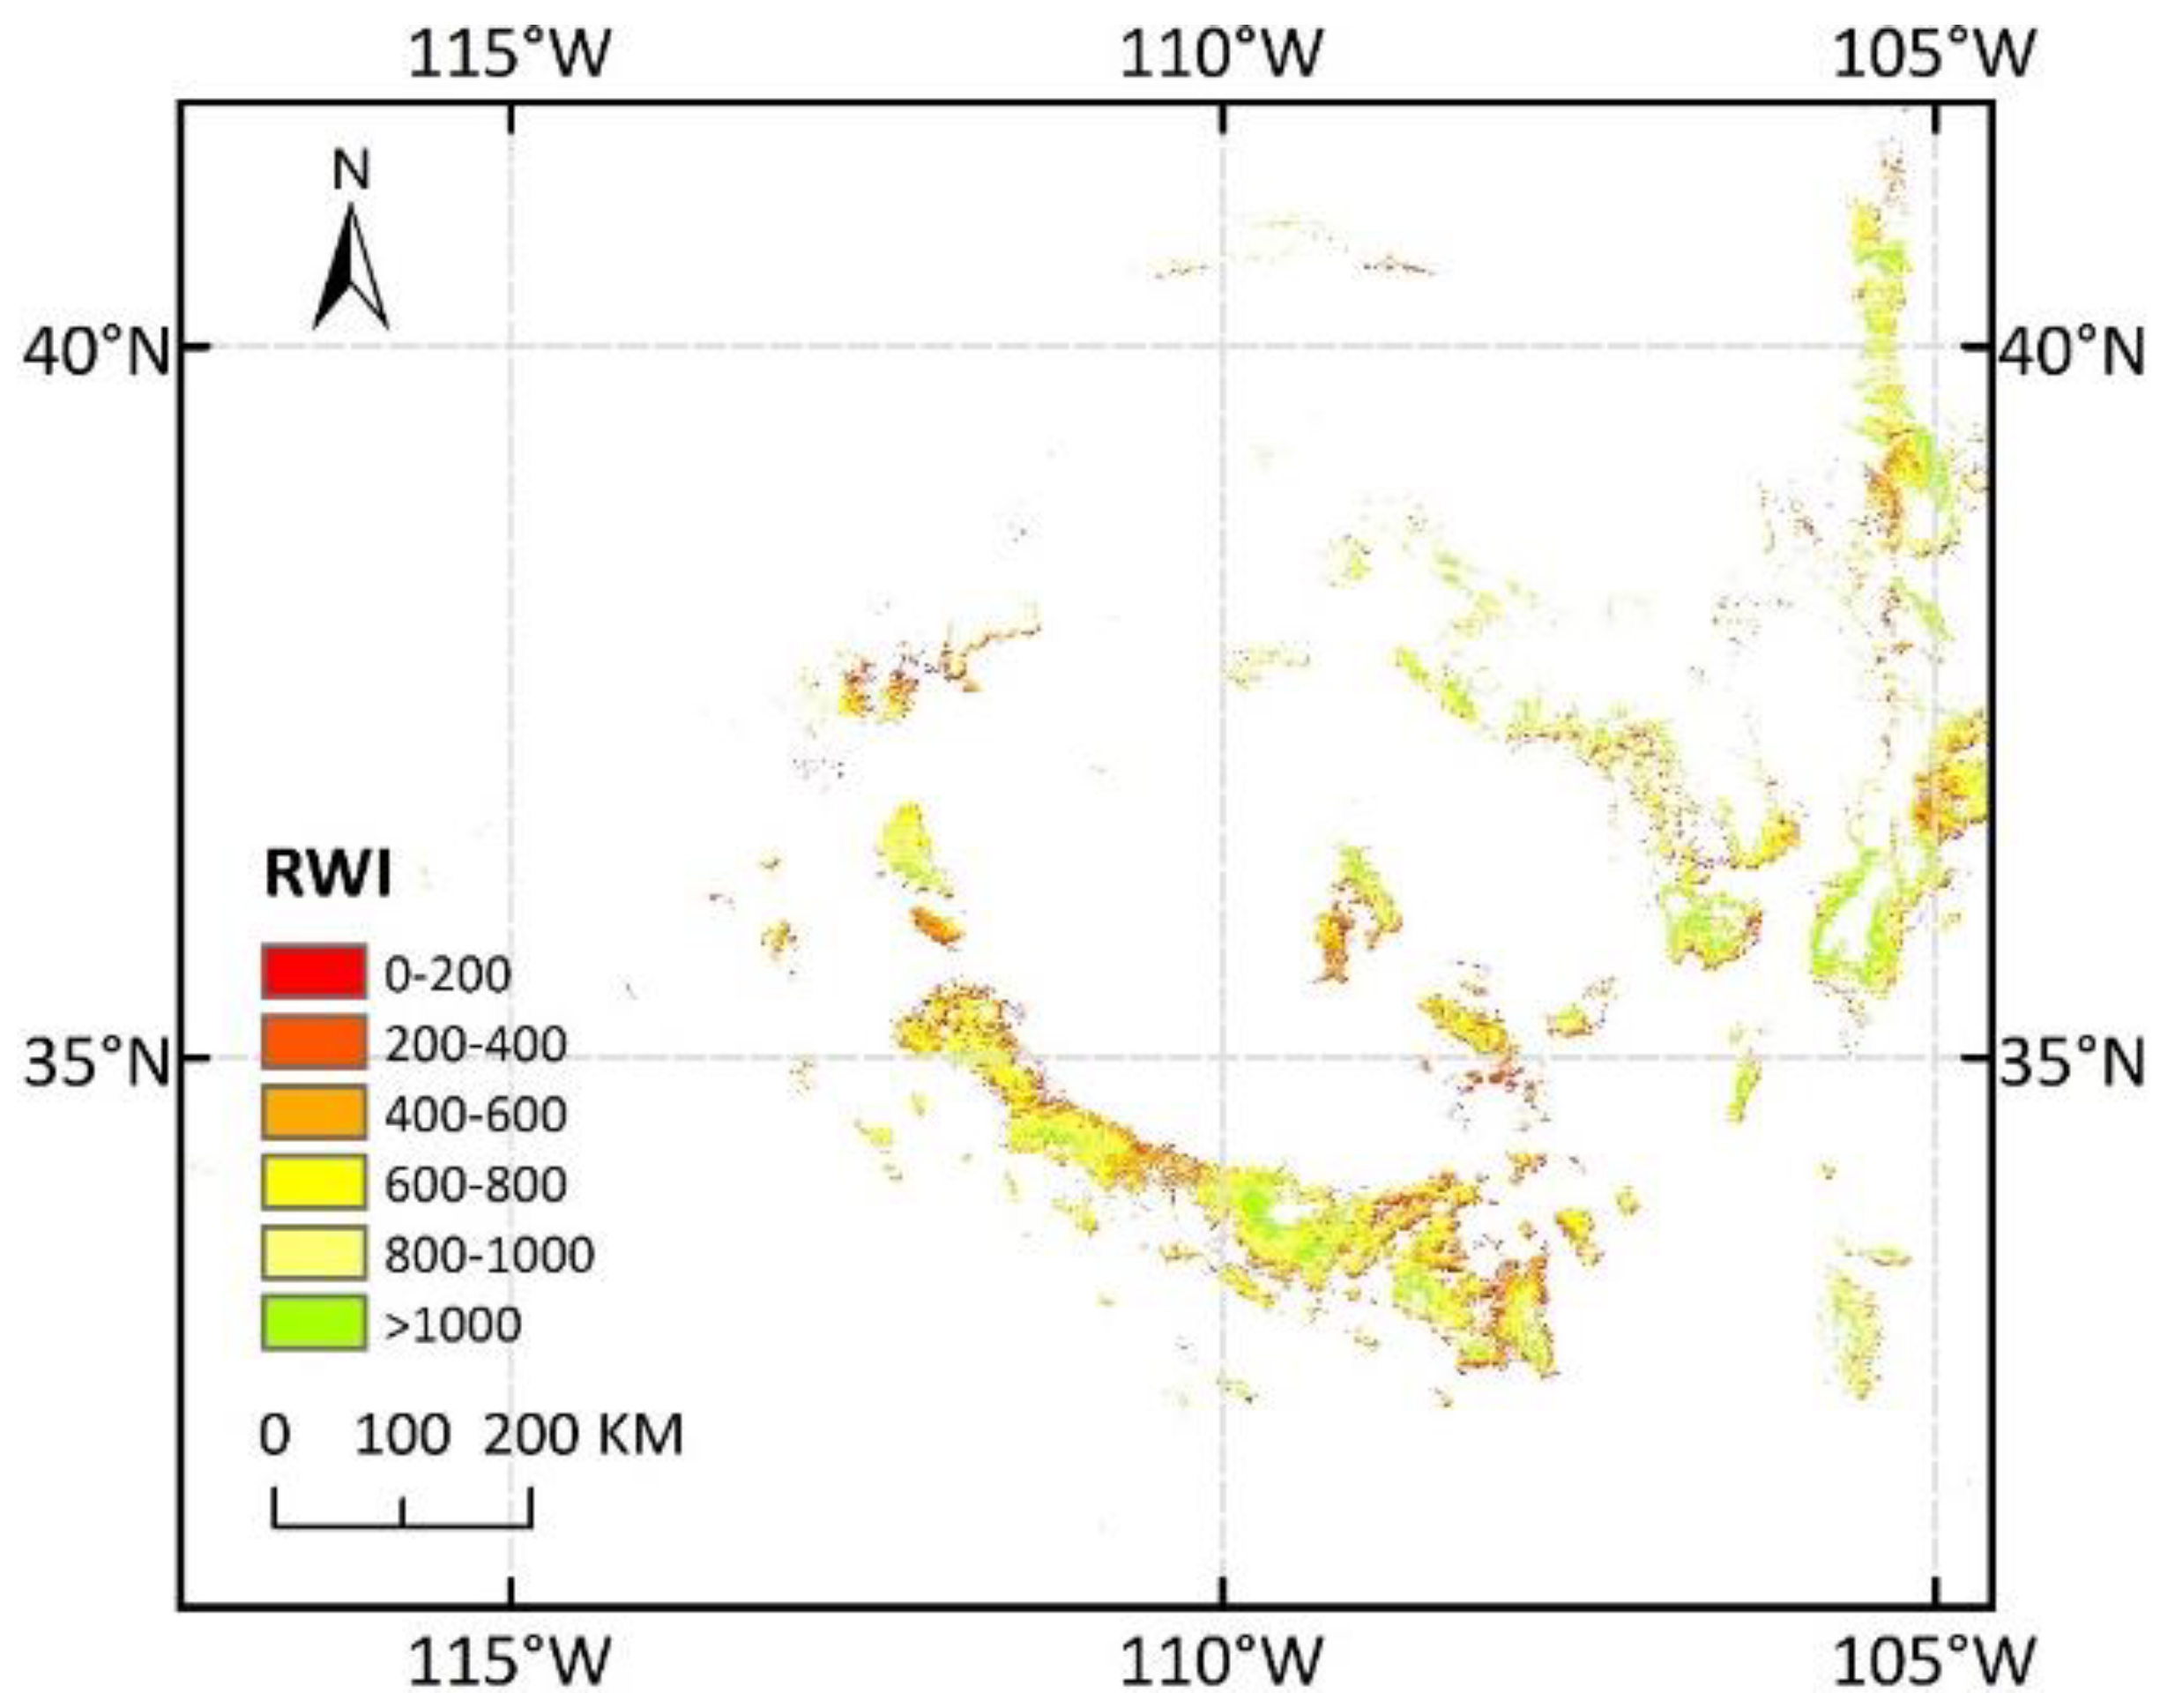
where RWI represents the trunk growth and NDVI2, July represents the NDVI accumulation over the two months of June and July, with 39% variation of trunk growth explained by NDVI. If a predicted RWI of any pixel was less than 0, indicating growth restriction [7], the value would be replaced with 0. Combined with the PIPO distribution map, RWI maps in the SWUS from 2001 to 2017 were generated. Figure 5 shows the RWI distribution of PIPO in 2002 when an extreme drought event happened [7,50]. There were 83.4% of the PIPO pixels with RWI less than 1000, which indicated that forest growth was disturbed by drought. By contrast, there were 65.3% of the PIPO pixels with RWI less than 1000 indicating that forest growth was not fully recovered in 2005 after drought (Figure S2).
RWI = 1638.2 × NDVI2, July
3.3.2. Regional RWI Change over Time and Response to Drought
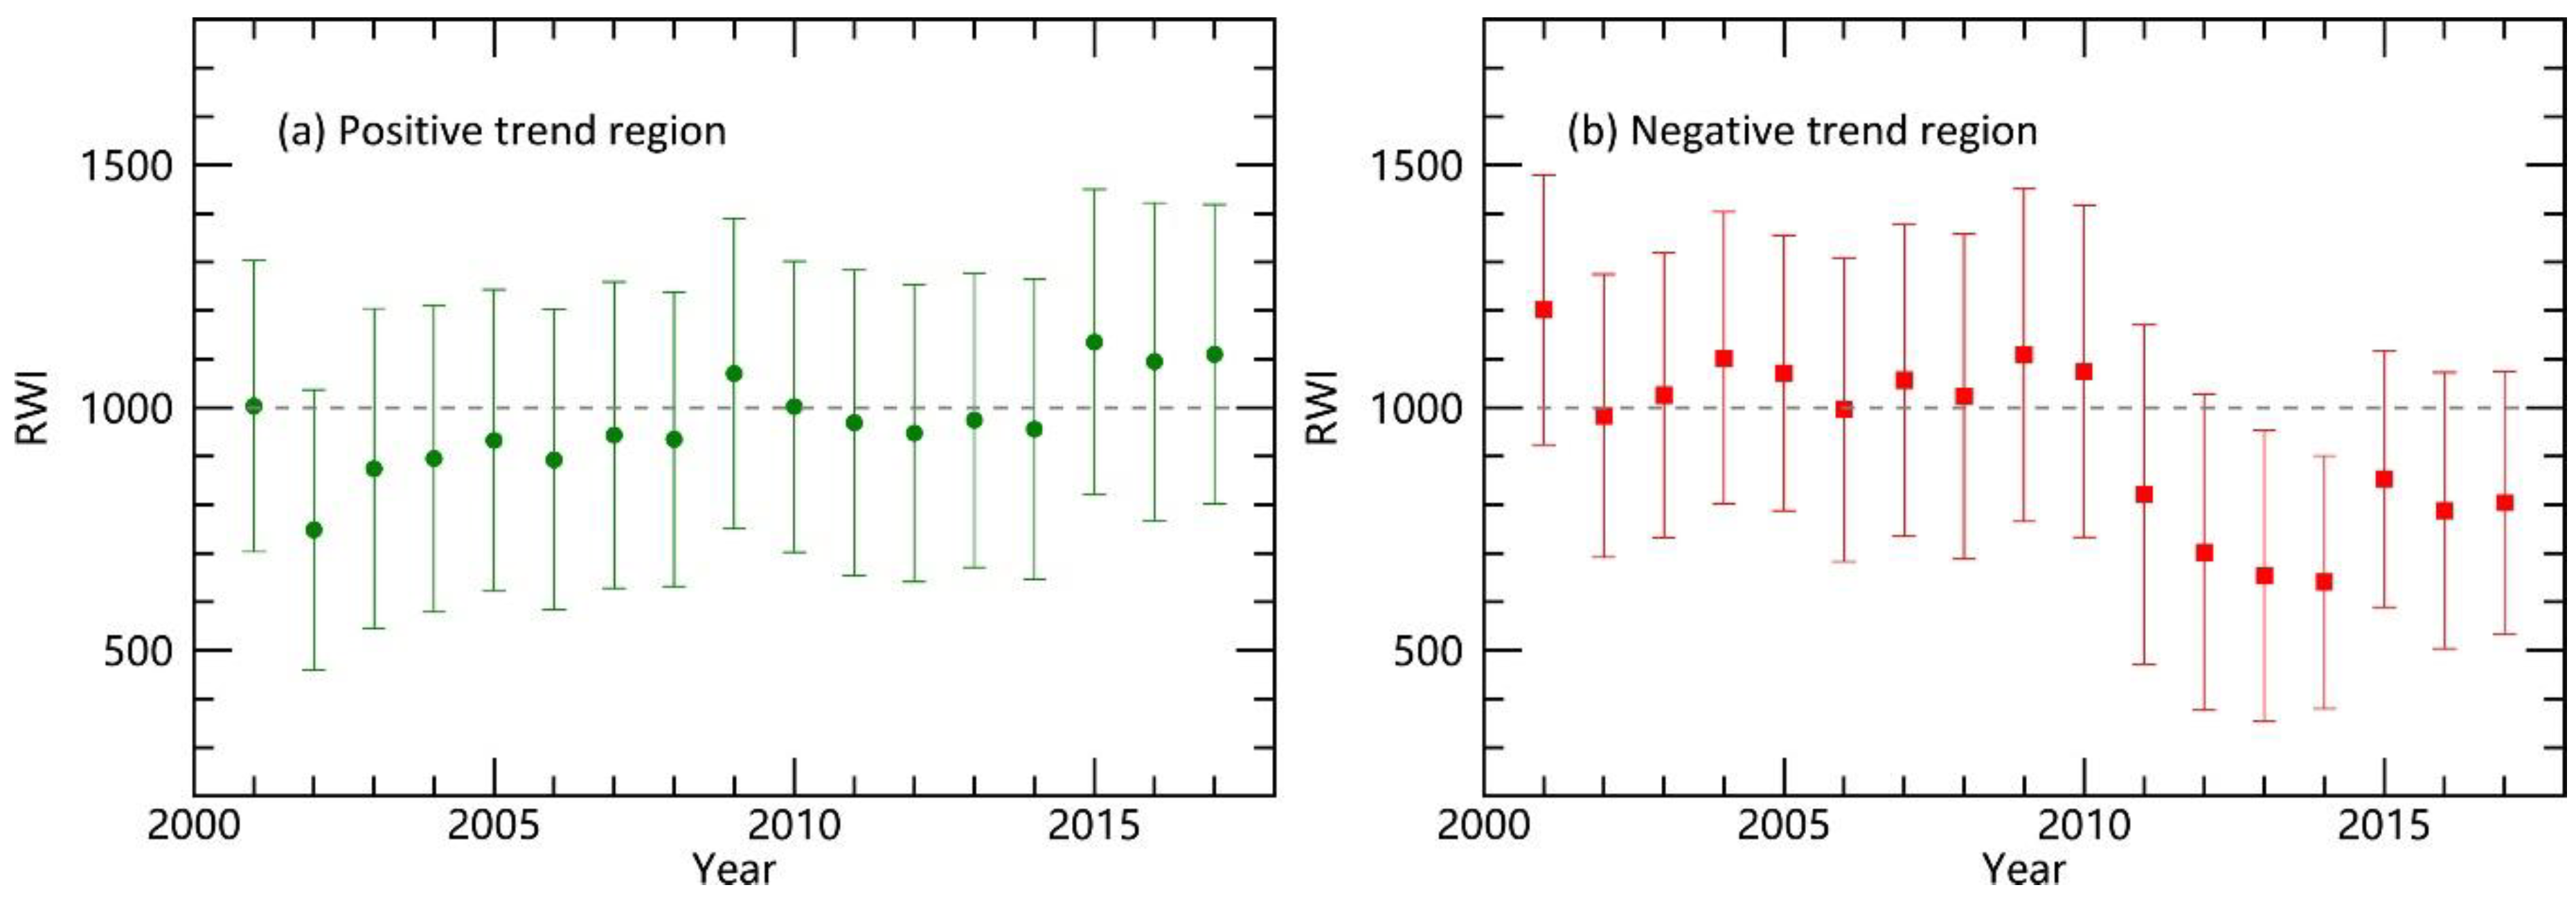
A total of 6.14% of the PIPO forested pixels significantly decreased over time and 12.84% of pixels significantly increased during 2001–2017. In order to explore the reason for the temporal change, we analyzed the pooled averages of RWI in pixels with either positive or negative changes (Figure S3 and Figure 6). For the pixels with positive change over time, there was a significant RWI increase for the pooled averages (R2 = 0.52, p = 0.001). The pooled average of RWI was about 1000 in 2001 indicating a normal year for tree growth (Figure 6a). However, RWI decreased to about 748 ± 289 in 2002 indicating severely hindered growth due to a certain disturbance. Recovery of tree growth after the disturbance was the main reason for the positive temporal trend which took 6–7 years for the average RWI to bounce back above 1000 (Figure 6a).
For the pixels with negative change over time, there was a significant PIPO RWI decrease (R2 = 0.6, p < 0.001). The pooled averages of RWI were almost all above 1000 before 2011, indicating a healthy growth (Figure 6b). However, RWI decreased to way below 1000 after 2011, indicating the forest was disturbed. The period of 2011–2014 contributed to the negative change. After this period of disturbance, forest recovered slowly but incompletely till now (2015–2017, Figure 6b).
The temporal trends of forests in SWUS clearly reflect the processes of disturbance and recovery. SWUS is a semi-arid region where moisture condition is the primary driving force for forest growth. Here we used SPEI data to reveal the relationship between drought and forest responses. Pooled averages of SPEI over time for pixels with significantly positive (green) and negative (red) temporal trends during 2001–2015 were shown in Figure 7. When compared to Figure 7, the temporal trends of the pooled averages of the RWI (including the structural breaks) clearly lined up with the drought events at a regional scale (earlier years for Figure 6a and later years for Figure 6b). This also indirectly supported the validity of the algorithm for RWI scaling-up. For pixels with a positive trend, there was an extreme drought event in 2002 that caused severe dieback and mortality [7,10]. After the 2002 drought, the moisture condition recovered within one year, while the RWI values were under 1000 for the next six years (2003~2008) indicating the effect of disturbance persisted. The inconsistency between the growth of trees and moisture conditions may have resulted from a lag of forest recovery—forests need time to recover from drought. During the recovery time, forest growth stayed lower than before the drought [51,52], regardless of the current moisture condition. For the pixels with a negative trend, the SPEI data demonstrated a wet-and-dry alternation in the SWUS from 2001 to 2015. The years of 2011 and 2013 were moderately dry, while 2012 and 2014 were not dry. However, the RWI values stayed low continuously during this time, which may be a result of the legacy effects resulting from moisture transitions from dry to wet [5,53]. For example, rainfall use efficiency (RUE = net primary production/precipitation), an important indicator for plant function, has a significant relationship with transitions of moisture condition [53]. The minimum RUE appears at the inter-annual moisture transitions from dry to wet [53], when trees produce and store much less dry matter, yielding lower trunk growth. Alternatively, the drought in 2011 was more serious, which might have caused a state change.
Previous studies have shown a significant correlation between NDVI and tree-ring width [13,23,24,28,49]. Since both NDVI and tree-ring width indicated the growth of trees, it is not surprising that there was a significant positive correlation between them. Some studies have also explored the relationships between RWI and NDVI across many time-scales. They looked at how Pearson correlation coefficients varied between RWI and cumulative NDVI across many time-scales [11,15]. Our research explored the change of the correlation over a continuous range of the time window and found the time period with maximum correlation. The satellite observation (NDVI) of this time period can better reflect the dynamics of trees growth. During this process, it is critical to have quality control over NDVI data that may vary under different seasons and weather conditions. Previous studies usually used NDVI data for a specific period of time or the whole year with no discretion on data with varying qualities. Our study found that, the quality of MODIS NDVI data has significant seasonal variation in the SWUS. Therefore, when discussing the correlation between NDVI and tree ring over time, it is necessary to control the quality of NDVI data. On the other hand, unlike previous studies, after revealing the relationship between NDVI and ring width index, we further explored the spatial distribution of projected RWI at the regional scale using the established relationship and revealed its response to drought by analyzing the spatio-temporal changes of RWI.
NDVI represents the spectral change of vegetation. It does not indicate tree growth and mortality directly like RWI does. Converting NDVI values to RWI brings ecological significance to NDVI. In Figure 6, we can easily observe the disturbance and recovery process of forest growth based on RWI = 1000 baseline—the long-term mean of the site. This would not be possible using the original NDVI data. On the other hand, RWI data were taken at individual plots that are not spatially continuous. Predicting RWI based on NDVI would provide such spatial continuity. By analyzing the temporal trends of predicted RWI with their corresponding SPEI, separating the pixels with positive and negative trends from those with no-change trend, we were able to associate the temporal patterns with the processes of climate perturbation and recovery, which also indirectly verified the validity of our modeling approach.
3.4. Uncertainty
The scale mismatch of tree-ring plots and coarse resolution of MODIS NDVI data (1 km) might cause uncertainty in the results in this study. The latitude and longitude of the tree-ring sites were recorded at an accuracy of 0.01 and 0.001 degrees, respectively. This means, for example, the accuracy of latitude (0.01 degrees) is about 1.11 km and the length of the unit longitude varies with the latitude, therefore the maximum deviation in the latitude direction can reach 1.11 km. Such a position deviation is unacceptable for high-resolution images (e.g., 30 × 30 m), because the plots at the actual position and the pixels at recorded coordinates may not overlap at all. On the other hand, there is no information available about the sampling area of tree-ring data in the ITRDB. However, a tree-ring plot on average included 34 sample trees, which was highly unlikely within a 30 m × 30 m grid. Therefore, using moderately resolution images (Landsat Thematic Mapper dataset) might not be the best option in this study. Although 1-km resolution is slightly coarse for the plots, it ensures that the plots are correctly included within the corresponding pixels. Pixels in coarse resolution may contain a mixture of species other than PIPO, which is another contributor to uncertainty in regional RWI prediction. Since the vegetation indices are also related to vegetation coverage [54], the empirical model we developed may underestimate RWI values in area with low tree cover and overestimate in area with high tree cover. Both trees and herbaceous understory (or shrub) contribute to NDVI, therefore NDVI recovery following the drought may not be due to tree recovery completely.
4. Concluding Remarks
We explored the relationship between ring width index and normalized difference vegetation index with different time windows for three species in a year. Our results demonstrated that leaf growth (NDVI) in June–August has the greatest impact on trees’ trunk growth (RWI). This species-specific optimum time window allows the prediction of RWI at the regional scale based on satellite observation. The temporal trends of predicted RWI data showed that both forest disturbance and recovery processes were related to water dynamics in the SWUS. With the detection of the optimum time windows when RWI and NDVI had the tightest connections, we were able to predict the regional RWI distribution using satellite observations, the temporal trends of which in turn may reflect the footprints of regional disturbance and forest recovery.
Supplementary Materials
The following are available online at https://www.mdpi.com/2072-4292/11/20/2344/s1, Figure S1:The distribution of Pearson correlation coefficients between ring width index (RWI) and enhanced vegetation index (EVI); Figure S2:Ring width index (RWI) distribution of Ponderosa pine (PIPO) in 2005 after drought; Figure S3: Locations of forest with positive, negative and no (RWI) trend from 2001 to 2017 (p < 0.05); Table S1: Pearson correlation coefficients between NDVI and RWI in PIED; Table S2:Pearson correlation coefficients between NDVI and RWI in PIPO; Table S3: Pearson correlation coefficients between NDVI and RWI in PSME.
Author Contributions
P.X., W.F., and T.Z. performed the data analysis and drafted the manuscript. X.Z., H.L., G.H., and C.Y. participated in discussions and provided useful data and comments. All of the authors contributed to the manuscript and approved the final version.
Funding
This research was funded by National Natural Science Foundation of China, grant number 41571185 and 41621061; Fundamental Research Funds for the Central University, grant number 2015KJJCB33; City University of New York, grant number PSC-CUNYENHC-48-33 and PSC-CUNY CIRG-80209-0822; Project of State Key Laboratory of Earth Surface Processes and Resource Ecology, grant number 2017-KF-12. The APC was funded by Project of State Key Laboratory of Earth Surface Processes and Resource Ecology.
Acknowledgments
We thank Jim Ellenwood for his help on the Ponderosa pine map. We thank China scholarship council for its financial support to the first author during 2017–2018, so that all authors have the opportunity to work together on this research.
Conflicts of Interest
The authors declare no conflicts of interest.
References
- Cook, B.I.; Smerdon, J.E.; Seager, R.; Coats, S. Global warming and 21st century drying. Clim. Dyn. 2014, 43, 2607–2627. [Google Scholar] [CrossRef] [Green Version]
- Yi, C.; Pendall, E.; Ciais, P. Focus on extreme events and the carbon cycle. Environ. Res. Lett. 2015, 10, 070201. [Google Scholar] [CrossRef]
- Ciais, P.; Reichstein, M.; Viovy, N.; Granier, A.; Ogée, J.; Allard, V.; Aubinet, M.; Buchmann, N.; Bernhofer, C.; Carrara, A. Europe-wide reduction in primary productivity caused by the heat and drought in 2003. Nature 2005, 437, 529–533. [Google Scholar] [CrossRef] [PubMed]
- Allen, C.D.; Macalady, A.K.; Chenchouni, H.; Bachelet, D.; McDowell, N.; Vennetier, M.; Kitzberger, T.; Rigling, A.; Breshears, D.D.; Hogg, E.T. A global overview of drought and heat-induced tree mortality reveals emerging climate change risks for forests. For. Ecol. Manag. 2010, 259, 660–684. [Google Scholar] [CrossRef] [Green Version]
- Gao, S.; Liu, R.; Zhou, T.; Fang, W.; Yi, C.; Lu, R.; Zhao, X.; Luo, H. Dynamic responses of tree-ring growth to multiple dimensions of drought. Glob. Chang. Biol. 2018. [Google Scholar] [CrossRef] [PubMed]
- Babst, F.; Bouriaud, O.; Poulter, B.; Trouet, V.; Frank, D.C. Twentieth century redistribution in climatic drivers of global tree growth. Sci. Adv. 2019, 5, eaat4313. [Google Scholar] [CrossRef] [Green Version]
- Huang, K.; Yi, C.; Wu, D.; Zhou, T.; Zhao, X.; Blanford, W.J.; Wei, S.; Wu, H.; Ling, D.; Li, Z. Tipping point of a conifer forest ecosystem under severe drought. Environ. Res. Lett. 2015, 10, 024011. [Google Scholar] [CrossRef]
- Assal, T.J.; Anderson, P.J.; Sibold, J. Spatial and temporal trends of drought effects in a heterogeneous semi-arid forest ecosystem. For. Ecol. Manag. 2016, 365, 137–151. [Google Scholar] [CrossRef] [Green Version]
- Wei, S.; Yi, C.; Wei, F.; Hendrey, G. A global study of GPP focusing on light-use efficiency in a random forest regression model. Ecosphere 2017, 8, e01724. [Google Scholar] [CrossRef]
- Xu, P.; Zhou, T.; Yi, C.; Fang, W.; Hendrey, G.; Zhao, X. Forest drought resistance distinguished by canopy height. Environ. Res. Lett. 2018, 13, 075003. [Google Scholar] [CrossRef] [Green Version]
- Bhuyan, U.; Zang, C.; Vicente-Serrano, S.M.; Menzel, A. Exploring Relationships among Tree-Ring Growth, Climate Variability, and Seasonal Leaf Activity on Varying Timescales and Spatial Resolutions. Remote Sens. 2017, 9, 526. [Google Scholar] [CrossRef]
- Andujar, E.; Krakauer, N.Y.; Yi, C.; Kogan, F. Ecosystem Drought Response Timescales from Thermal Emission versus Shortwave Remote Sensing. Adv. Meteorol. 2017, 3, 1–10. [Google Scholar] [CrossRef]
- Wang, J.; Rich, P.M.; Price, K.P.; Kettle, W.D. Relations between NDVI and tree productivity in the central great plains. Int. J. Remote Sens. 2004, 16, 12. [Google Scholar] [CrossRef]
- Bunn, A.G.; Hughes, M.K.; Kirdyanov, A.V.; Losleben, M.; Shishov, V.V.; Berner, L.T.; Oltchev, A.; Vaganov, E.A. Comparing forest measurements from tree rings and a space-based index of vegetation activity in Siberia. Environ. Res. Lett. 2013, 8, 035034. [Google Scholar] [CrossRef]
- Vicente-Serrano, S.M.; Camarero, J.J.; Olano, J.M.; Martín-Hernández, N.; Peña-Gallardo, M.; Tomás-Burguera, M.; Gazol, A.; Azorin-Molina, C.; Bhuyan, U.; Kenawy, A.E. Diverse relationships between forest growth and the Normalized Difference Vegetation Index at a global scale. Remote Sens. Environ. 2016, 187, 14–29. [Google Scholar] [CrossRef] [Green Version]
- Speer, J.H. Fundamentals of Tree-Ring Research; University of Arizona Press: Tucson, AZ, USA, 2010. [Google Scholar]
- Babst, F.; Carrer, M.; Poulter, B.; Urbinati, C.; Neuwirth, B.; Frank, D. 500 years of regional forest growth variability and links to climatic extreme events in Europe. Environ. Res. Lett. 2012, 7, 045705. [Google Scholar] [CrossRef]
- Brehaut, L.; Danby, R.K. Inconsistent relationships between annual tree ring-widths and satellite-measured NDVI in a mountainous subarctic environment. Ecol. Indic. 2018, 91, 698–711. [Google Scholar] [CrossRef]
- Graumlich, L.J.; Brubaker, L.B.; Grier, C.C. Long-Term Trends in Forest Net Primary Productivity: Cascade Mountains, Washington. Ecology 1989, 70, 405–410. [Google Scholar] [CrossRef]
- Hasenauer, H.; Nemani, R.R.; Schadauer, K.; Running, S.W. Forest growth response to changing climate between 1961 and 1990 in Austria. For. Ecol. Manag. 1999, 122, 209–219. [Google Scholar] [CrossRef]
- Flurin, B.; Olivier, B.; Dario, P.; Bert, G.; Janssens, I.A.; Eero, N.; Andreas, I.; Jian, W.; Christian, B.; Barbara, K.S. Above-ground woody carbon sequestration measured from tree rings is coherent with net ecosystem productivity at five eddy-covariance sites. New Phytol. 2014, 201, 1289–1303. [Google Scholar]
- Xu, K.; Wang, X.; Liang, P.; An, H.; Sun, H.; Han, W.; Li, Q. Tree-ring widths are good proxies of annual variation in forest productivity in temperate forests. Sci. Rep. 2017, 7, 1945. [Google Scholar] [CrossRef] [PubMed] [Green Version]
- Kaufmann, R.K.; D’Arrigo, R.D.; Laskowski, C.; Myneni, R.B.; Davi, N.K. The effect of growing season and summer greenness on northern forests. Geophys. Res. Lett. 2004, 31, 111–142. [Google Scholar] [CrossRef]
- Berner, L.T.; Beck, P.S.A.; Bunn, A.; Lloyd, A.; Goetz, S.J. High-latitude tree growth and satellite vegetation indices: Correlations and trends in Russia and Canada (1982–2008). J. Geophys. Res. Biogeosci. 2015, 116, 321–342. [Google Scholar] [CrossRef]
- Seiler, R.; Kirchner, J.W.; Krusic, P.J.; Tognetti, R.; Houliã, N.; Andronico, D.; Cullotta, S.; Egli, M.; D’Arrigo, R.; Cherubini, P. Insensitivity of Tree-Ring Growth to Temperature and Precipitation Sharpens the Puzzle of Enhanced Pre-Eruption NDVI on Mt. Etna (Italy). PLoS ONE 2017, 12, e0169297. [Google Scholar] [CrossRef] [PubMed]
- Carreiras, J.M.B.; Pereira, J.M.C.; Pereira, J.S. Estimation of tree canopy cover in evergreen oak woodlands using remote sensing. For. Ecol. Manag. 2006, 223, 45–53. [Google Scholar] [CrossRef]
- Beck, P.S.A.; Goetz, S.J. Satellite observations of high northern latitude vegetation productivity changes between 1982 and 2008: Ecological variability and regional differences. Environ. Res. Lett. 2011, 6, 45501. [Google Scholar] [CrossRef]
- Bunn, A.G.; Goetz, S.J. Trends in Satellite-Observed Circumpolar Photosynthetic Activity from 1982 to 2003: The Influence of Seasonality, Cover Type, and Vegetation Density. Earth Interact. 2006, 10, 1723–1731. [Google Scholar] [CrossRef]
- Xing, W.Z.; Liu, C.; Alfredo, H. From AVHRR-NDVI to MODIS-EVI: Advances in vegetation index research. Acta Ecol. Sin. 2003, 23, 979–987. [Google Scholar]
- Brown, M.E.; Pinzon, J.E.; Didan, K.; Morisette, J.T.; Tucker, C.J. Evaluation of the consistency of long-term NDVI time series derived from AVHRR, SPOT-vegetation, SeaWiFS, MODIS, and Landsat ETM+ sensors. IEEE Trans. Geosci. Remote Sens. 2006, 44, 1787–1793. [Google Scholar] [CrossRef]
- Hope, A.; Fouad, G.; Granovskaya, Y. Evaluating drought response of Southern Cape Indigenous Forests, South Africa, using MODIS data. Int. J. Remote Sens. 2014, 35, 4852–4864. [Google Scholar] [CrossRef]
- Xu, P.; Zhou, T.; Zhao, X.; Luo, H.; Gao, S.; Li, Z.; Cao, L. Diverse responses of different structured forest to drought in southwest china through remotely sensed data. Int. J. Appl. Earth Obs. Geoinf. 2018, 69, 217–225. [Google Scholar] [CrossRef]
- Breshears, D.D.; Cobb, N.S.; Rich, P.M.; Price, K.P.; Allen, C.D.; Balice, R.G.; Romme, W.H.; Kastens, J.H.; Floyd, M.L.; Belnap, J. Regional vegetation die-off in response to global-change-type drought. Proc. Natl. Acad. Sci. USA 2005, 102, 15144–15148. [Google Scholar] [CrossRef] [PubMed] [Green Version]
- Wu, D.; Zhao, X.; Liang, S.; Zhou, T.; Huang, K.; Tang, B.; Zhao, W. Time-lag effects of global vegetation responses to climate change. Glob. Chang. Biol. 2015, 21, 3520–3531. [Google Scholar] [CrossRef] [PubMed]
- Matsushita, B.; Yang, W.; Chen, J.; Onda, Y.; Qiu, G. Sensitivity of the Enhanced Vegetation Index (EVI) and Normalized Difference Vegetation Index (NDVI) to Topographic Effects: A Case Study in High-Density Cypress Forest. Sensors 2007, 7, 2636–2651. [Google Scholar] [CrossRef] [PubMed]
- Luo, H.; Zhou, T.; Wu, H.; Zhao, X.; Wang, Q.; Gao, S.; Li, Z. Contrasting Responses of Planted and Natural Forests to Drought Intensity in Yunnan, China. Remote Sens. 2016, 8, 635. [Google Scholar] [CrossRef]
- Gazol, A.; Camarero, J.J.; Vicente-Serrano, S.M.; Sánchez-Salguero, R.; Gutiérrez, E.; De, L.M.; Sangüesa-Barreda, G.; Novak, K.; Rozas, V.; Tíscar, P.A. Forest resilience to drought varies across biomes. Glob. Chang. Biol. 2018, 24, 2143. [Google Scholar] [CrossRef] [PubMed]
- Xie, Y.; Wang, X.; Silander, J.A., Jr. Deciduous forest responses to temperature, precipitation, and drought imply complex climate change impacts. Proc. Natl. Acad. Sci. USA 2015, 112, 13585–13590. [Google Scholar] [CrossRef] [Green Version]
- PenUelas, J.; Filella, I. Phenology. Responses to a warming world. Science 2001, 294, 793–795. [Google Scholar] [CrossRef]
- Yi, C.; Mu, G.; Hendrey, G.; Vicente-Serrano, S.M.; Fang, W.; Zhou, T.; Shan, G.; Xu, P. Bifurcated Response of a Regional Forest to Drought. Expert Opin. Environ. Biol. 2018, 7, 2. [Google Scholar] [CrossRef]
- Vicenteserrano, S.M.; Beguería, S.; Lópezmoreno, J.I.; Angulo, M.; Elkenawy, A. A new global 0.5° gridded dataset (1901–2006) of a multiscalar drought index: Comparison with current drought index datasets based on the Palmer drought severity index. J. Hydrometeorol. 2010, 11, 1033–1043. [Google Scholar] [CrossRef]
- Vicente-Serrano, S.M.; Gouveia, C.; Camarero, J.J.; Beguería, S.; Trigo, R.; López-Moreno, J.I.; Azorín-Molina, C.; Pasho, E.; Lorenzo-Lacruz, J.; Revuelto, J. Response of vegetation to drought time-scales across global land biomes. Proc. Natl. Acad. Sci. USA 2013, 110, 52–57. [Google Scholar] [CrossRef] [PubMed]
- Kolb, T.E. A new drought tipping point for conifer mortality. Environ. Res. Lett. 2015, 10, 031002. [Google Scholar] [CrossRef]
- McManus, K.M.; Morton, D.C.; Masek, J.G.; Wang, D.; Sexton, J.O.; Nagol, J.R.; Ropars, P.; Boudreau, S. Satellite-based evidence for shrub and graminoid tundra expansion in northern Q uebec from 1986 to 2010. Glob. Chang. Biol. 2012, 18, 2313–2323. [Google Scholar] [CrossRef]
- Vogelmann, J.E.; Tolk, B.; Zhu, Z. Monitoring forest changes in the southwestern United States using multitemporal Landsat data. Remote Sens. Environ. 2009, 113, 1739–1748. [Google Scholar] [CrossRef]
- Czerwinski, C.J.; King, D.J.; Mitchell, S.W. Mapping forest growth and decline in a temperate mixed forest using temporal trend analysis of Landsat imagery, 1987–2010. Remote Sens. Environ. 2014, 141, 188–200. [Google Scholar] [CrossRef]
- Hanson, P.J.; Weltzin, J.F. Drought disturbance from climate change: Response of United States forests. Sci. Total Environ. 2000, 262, 205–220. [Google Scholar] [CrossRef]
- Weiss, J.L.; Gutzler, D.S.; Coonrod, J.E.A.; Dahm, C.N. Seasonal and inter-annual relationships between vegetation and climate in central New Mexico, USA. J. Arid Environ. 2004, 57, 507–534. [Google Scholar] [CrossRef]
- Kaufmann, R.K.; D’Arrigo, R.D.; Paletta, L.F.; Tian, H.Q.; Jolly, W.M.; Myneni, R.B. Identifying Climatic Controls on Ring Width: The Timing of Correlations between Tree Rings and NDVI. Earth Interact. 2008, 12, 1. [Google Scholar] [CrossRef]
- Hicke, J.A.; Meddens, A.J.H.; Kolden, C.A. Recent tree mortality in the Western United States from bark beetles and forest fires. For. Sci. 2016, 62, 141–153. [Google Scholar] [CrossRef]
- Anderson-Teixeira, K.J.; Miller, A.D.; Mohan, J.E.; Hudiburg, T.W.; Duval, B.D.; Delucia, E.H. Altered dynamics of forest recovery under a changing climate. Glob. Chang. Biol. 2013, 19, 2001–2021. [Google Scholar] [CrossRef]
- Xu, P.; Zhou, T.; Yi, C.; Luo, H.; Zhao, X.; Fang, W.; Gao, S.; Liu, X. Impacts of Water Stress on Forest Recovery and Its Interaction with Canopy Height. Int. J. Environ. Res. Public Health 2018, 15, 1257. [Google Scholar] [CrossRef] [PubMed]
- Zhang, X.; Moran, M.S.; Zhao, X.; Liu, S.; Zhou, T.; Ponce-Campos, G.E.; Liu, F. Impact of prolonged drought on rainfall use efficiency using MODIS data across China in the early 21st century. Remote Sens. Environ. 2014, 150, 188–197. [Google Scholar] [CrossRef]
- Xiao, J. Satellite evidence for significant biophysical consequences of the “Grain for Green” Program on the Loess Plateau in China. J. Geophys. Res. Biogeosci. 2014, 119, 2261–2275. [Google Scholar] [CrossRef]
Figure 1.
Distribution of ponderosa pine in the Southwestern United States (SWUS) from the National Individual Tree Species Atlas (2015) (area in gray), and all tree-ring sites of three species in SWUS from the International Tree-Ring Data Bank. PIED: Pinus edulis; PIPO: Pinus ponderosa; PSME: Pseudotsuga menziesii.

Figure 2.
Quality assessment of MOD13A3 normalized difference vegetation index (NDVI) at all tree-ring sites of three species (PIED: Pinus edulis, PIPO: Pinus ponderosa, PSME: Pseudotsuga menziesii) in the Southwestern United States (SWUS). The definitions of good data, marginal data, snow or ice, and cloudy can be found in Table 1.

Figure 3.
The distribution of Pearson correlation coefficients between ring width index (RWI) and normalized difference vegetation index (NDVIi,j) with the time-scale of i (I = 1, 2, …, 12 months) and ending month of j (j = January, February, …, December) of three tree species: (a) PIED: Pinus edulis; (b) PIPO: Pinus ponderosa; and (c) PSME: Pseudotsuga menziesii in the SWUS. n represents the number of tree-ring records from the sites after 2000. The time span during which the NDVI accumulation had the strongest correlation with the RWI was identified as the optimum time window for further analyses. The color bars underneath indict the value of Pearson correlation coefficients.

Figure 4.
The relationship between ring width index (RWI) of Ponderosa pine (PIPO) and normalized difference vegetation index (NDVI).
Figure 4.
The relationship between ring width index (RWI) of Ponderosa pine (PIPO) and normalized difference vegetation index (NDVI).

Figure 5.
Ring width index (RWI) distribution of Ponderosa pine (PIPO) in 2002. There were 83.4% of the PIPO pixels with RWI less than 1000 indicating that forest growth is disturbed by drought.
Figure 5.
Ring width index (RWI) distribution of Ponderosa pine (PIPO) in 2002. There were 83.4% of the PIPO pixels with RWI less than 1000 indicating that forest growth is disturbed by drought.

Figure 6.
Pooled averages of predicted Ponderosa pine ring width index (RWI, mean ± SD) over time for pixels with (a) significantly positive (left panel) and (b) negative (right panel) temporal trends during 2001–2017.
Figure 6.
Pooled averages of predicted Ponderosa pine ring width index (RWI, mean ± SD) over time for pixels with (a) significantly positive (left panel) and (b) negative (right panel) temporal trends during 2001–2017.

Figure 7.
Pooled averages of standardized precipitation evapotranspiration index (SPEI, mean ± SD) over time for pixels with significantly positive (green) and negative (red) temporal trends during 2001–2015.
Figure 7.
Pooled averages of standardized precipitation evapotranspiration index (SPEI, mean ± SD) over time for pixels with significantly positive (green) and negative (red) temporal trends during 2001–2015.


Table 1.
MOD13A3 pixel reliability.
| Rank Key | Summary Quality Assurance | Description |
|---|---|---|
| −1 | Fill/no data | Not processed |
| 0 | Good data | Use with confidence |
| 1 | Marginal data | Useful, but look at other QA information |
| 2 | Snow/ice | Target covered with snow/ice |
| 3 | Cloudy | Target not visible, covered with cloud |
© 2019 by the authors. Licensee MDPI, Basel, Switzerland. This article is an open access article distributed under the terms and conditions of the Creative Commons Attribution (CC BY) license (http://creativecommons.org/licenses/by/4.0/).
Share and Cite
MDPI and ACS Style
Xu, P.; Fang, W.; Zhou, T.; Zhao, X.; Luo, H.; Hendrey, G.; Yi, C. Spatial Upscaling of Tree-Ring-Based Forest Response to Drought with Satellite Data. Remote Sens. 2019, 11, 2344. https://doi.org/10.3390/rs11202344
AMA Style
Xu P, Fang W, Zhou T, Zhao X, Luo H, Hendrey G, Yi C. Spatial Upscaling of Tree-Ring-Based Forest Response to Drought with Satellite Data. Remote Sensing. 2019; 11(20):2344. https://doi.org/10.3390/rs11202344
Chicago/Turabian StyleXu, Peipei, Wei Fang, Tao Zhou, Xiang Zhao, Hui Luo, George Hendrey, and Chuixiang Yi. 2019. "Spatial Upscaling of Tree-Ring-Based Forest Response to Drought with Satellite Data" Remote Sensing 11, no. 20: 2344. https://doi.org/10.3390/rs11202344
Note that from the first issue of 2016, this journal uses article numbers instead of page numbers. See further details here.