Abstract
Effective maintenance of railways requires a comprehensive assessment of the actual condition of the construction materials involved. In this regard, Ground-Penetrating Radar (GPR) stands as a viable alternative to the invasive and time-consuming traditional techniques for the inspection of these infrastructures. This work reports the experimental activities carried out on a test-site area within a railway depot in Rome, Italy. To this purpose, a 30 m-long railway section was divided into ten sub-sections reproducing different various physical and structural conditions of the track-bed. For more detail, combinations of varying scenarios of fragmentation and fouling of the ballast were reproduced. The set-up was then investigated using different multi-frequency GPR horn antenna systems. The effects of the different physical conditions of ballast on the electromagnetic response of the material were analysed for each scenario using time- and frequency-domain signal processing techniques. Parallel to this, modelling was provided to estimate fouling content. Interpretation of results has proven the viability of the GPR method in detecting signs of decay at the network level, thereby proving this technique to be worthy of implementation in asset management systems.
1. Introduction
On a daily basis, railway convoys carry vast numbers of commuters, freights and bulk goods by traveling along ballasted tracks. Through the years, role of railways in connecting residential and production poles has become crucial, fostering huge improvements in the technical performance of the convoys that, in turn, require adequate support from the track-beds. In view of this, a more effective and timely maintenance is needed for railway ballast in order to ensure suitable safety and functionality conditions at the network level.
According to the literature, a typical railway track-bed can be described as an overlap of two structural elements, namely, the superstructure and the substructure [1,2]. The superstructure is composed of the rails, the fastening system and the sleepers, whereas the substructure includes the granular layers that are laid upon the subgrade, i.e., the ballast and the sub-ballast. Specifically, ballast is referred to as a homogeneously graded hard-rock-derived material, usually composed of aggregates with a diameter size ranging between 3 and 6 cm [2,3].
The bearing capacity of the substructure stands as a major concern for designers and maintainers, as differential settlements are usually reported to occur within this system [1,4]. This is mainly due to i) a change in the material grading caused by the breakage of the sharp corners of the aggregates under the effects of cycling loadings [5,6] and ii) the contribution of fine-graded material from the ballast-sleeper and the wheel-rail friction filling the inter-granular air voids [4]. This material can be directly poured by the passing freights [7] or it can migrate upwards or sideways from the subgrade along with capillary water [8]. In fact, both the occurrences affect a decrease of the shear angle between the aggregates and, therefore, they are mostly responsible for triggering plastic and irreversible deformations of the track-bed [1]. According to the above, a comprehensive knowledge of the condition of the railway substructure is crucial to prioritise maintenance activities and, in parallel, to maintain the highest safety standards.
Necessarily, the monitoring procedures that allow for such a knowledge have to comply with cost-benefits considerations. As a result, the quality of the monitoring in terms of dedicated funds is typically related to the rate of utilization of the inspected railway stretch [3]. In such a framework, increasingly efficient inspection techniques are required in order to lower the cost-to-benefit ratio, and allow for a wider assessment of the track-bed conditions over the entire network.
Within this context, it is worth mentioning that the traditional monitoring procedures of visual inspections are still widely diffused. On-site operators are required to evaluate the conditions of the railway track by reporting the presence and the extent of decay for each visible structural component. In regard to ballast, it is clear that this approach allows the assessment of signs of fragmentation and fouling only at the surface level, neglecting deep pollution and fragmentation of the aggregates at the foundation level.
Nowadays, automatic laser-based systems are employed as an integration to the traditional approach. These systems, mounted onto dedicated diagnostic convoys, allow us to monitor the geometric parameters of steel rails (i.e., gauge, rail alignment) and, therefore, to observe anomalous deformations along the track. Even though this approach is evidently more robust than performing only visual inspections, it allows a partial and late assessment of the condition of the substructure. Both fouling and fragmentation are in fact detected only at a very advanced stage, i.e., when the deformation of the rails has started.
In view of this, advanced diagnostic trains equipped with additional systems for the direct assessment of the condition of the ballast have been introduced in the past few years [3]. Among the other equipment, Ground-Penetrating Radar (GPR) is one of the most employed for this type of service.
GPR is a widespread geophysical technique, which allows us to inspect relevant features of the subsurface using information from the propagation of electromagnetic (EM) fields [8,9]. In terms of working principles, a source inner to the GPR system emits an EM impulse that is partially back-reflected and partially transmitted beyond at any given dielectric contrast encountered throughout the medium. The collection of these diffractive occurrences through a receiving station allows us to image the subsurface features, in both two and three dimensions [8,9].
According to the literature, first attempts of using GPR as a potential method for assessing the conditions of ballasted railway track-beds date back to the early years of this century [10,11]. In these experimental activities, surveys were conducted using GPR systems with central frequencies below 500 MHz. More recently, high-frequency (1000–2000 MHz) air-launched systems have been mostly adopted [12,13,14,15,16,17,18], due to the advantages observed in terms of results viability and survey productivity.
It is important to observe that the research focus on the subject area has also changed over the years [17]. The assessment of the geometry of the track-bed and its overall stability have been first a matter of research [10,19], whereas the focus has progressively moved towards the time-domain [14,15,16] and the frequency-domain [12,14,20,21,22,23,24] analyses of the effects of fouling and fragmentation of ballast on the signal. In addition to this, new avenues in assessing quality of ballast aggregates have been recently explored by means of simulation-based approaches [25] and numerical models [26]. To the best of the authors’ knowledge, although crucial pieces of information were derived from these studies, only few laboratory and test-site activities are actually reported in the literature. This is most likely due to the high costs and the labor extensiveness of the operations [2,27,28].
This work reports the results of an extensive experimental campaign conducted on a test-site located on a real-life railway in Rome, Italy. The main aim of the research is to investigate the viability of GPR in assessing the health conditions of railway track-beds and to evaluate its suitability for implementation into maintenance management programs. In this regard, the effects of fouling and fragmentation of the ballast on the EM signal are analysed and interpreted with a special reference to potential future applications in maintenance and monitoring activities. Modelling is finally proposed to estimate fouling content.
The specific objectives of this study can be summarised as follows: i) understanding the influence of fragmentation and fouling of ballasted track-beds on the EM signal as collected by GPR; ii) defining the role of soil moisture within the detection of ballast decay; iii) providing indications on the most suitable survey configuration (central frequency of the antenna and its polarisation) according to the specific target of the survey.
2. Materials and Methods
2.1. Inspected Material
In order to reproduce different rates of fragmentation, two samples of typical limestone railway ballast were selected for setting up the test site. Specifically, an ex-quarry ballast sample complying with material standard requirements from the Italian National Railways [29] and an exhausted ballast removed from service due to aggregate degradation, were used. In terms of fragmentation, use of these materials identifies two different health conditions, i.e., i) a well-graded ballast and ii) a highly fragmented. Figure 1 shows the grading curves of the samples, obtained following dedicated sieving standards [30]. The two above conditions are represented by the grading curves 1 and 2 (GC1 and GC2), respectively.
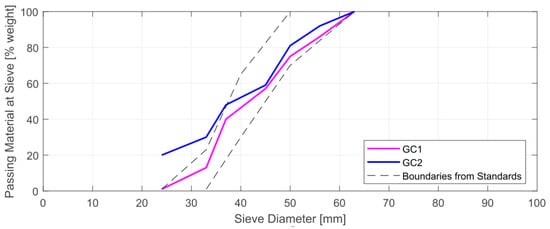
Figure 1.
Outcomes of the sieving test on the ballast samples used for the tests.
In addition, different fouling conditions were reproduced using a fine-graded soil, excavated from a depot. It is worth noting that the material had been previously removed from inadequate railway subgrades due to the severe uprising of fine particles towards the ballast layers. Two fouling conditions representing clean ballast, i.e., all the voids between aggregates are clean from pollution (Fouling Index (FI) = 0%), and fouled ballast, i.e., all the voids are clogged up by the polluting soil (FI = 25%), were accounted for testing purposes. The FI is calculated as follows [7]:
where P4 and P0.075 are the percentages in weight of the material passing the 4 mm and the 0.075 mm sieves [22].
2.2. Test-Site Preparation
A 30 m-long section of railway was investigated using GPR. Location and main characteristics of the test-site are shown in Figure 2. The superstructure is composed of steel rails with a 1.435 m-wide gauge, fastened to mono-block reinforced concrete sleepers spaced 0.60 m each to one another.
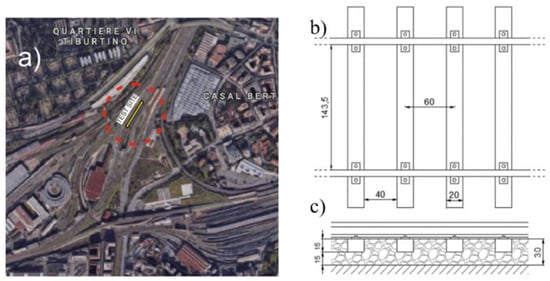
Figure 2.
(a) Location of the test-site; (b) plan view of the inspected railway section; (c) cross-section of the track-bed. The measures are expressed in cm.
The ballast-filled slots comprised between the sleepers in the test-site area were emptied out and re-filled with the test material. This allowed the creation of 10 different configurations/sub-sections of fouling and fragmentation conditions of the track-bed, each one comprising 3 consecutive slots (Figure 3).
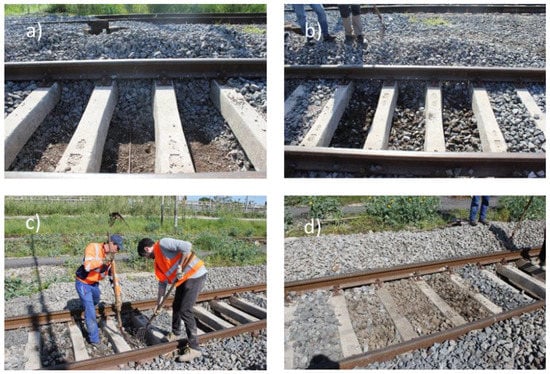
Figure 3.
Preparation of a single sub-section within the test-site area; (a) a set of three slots is emptied out of the original ballast; (b) the slots are filled up again with the test material; (c) the material is arranged and compacted in order to fill all the voids; (d) the re-arranged configuration.
Arrangement of the 10 sub-sections was realised by dividing each volume into two 15 cm-thick layers (see Figure 2c) and varying the physical conditions of each layer.
Moreover, for each of the 10 configurations, three levels of soil moisture were reproduced, by progressively pouring water onto the test-site. At each round of GPR tests, a sample of the material was extracted from a slot, and the moisture was measured in a laboratory environment. In more detail, water contents of 6% (“dry” D), 12% (“moist” M) and 17% (“wet” W) by mass were reproduced for testing purposes. The main characteristics of each configuration are reported in Table 1.

Table 1.
Features of the tested configurations.
More specifically, Configurations 1 and 2 were used as a reference of sound ballast, in terms of both fouling and grading. Configurations 3 and 4 simulated an increasing rate of uprising clogging of the ballast from the subgrade (FI = 0% to 25%). Configurations 5 to 7 reproduced different rates of aggregate fragmentation, i.e., unsuitable deeper layer (e.g., after the process of renewing the top layer), inadequate shallower layer and total fragmentation of the track-bed. Configurations 8 to 10 simulated various conditions of combined decay. The full arrangement of the test-site is shown in Figure 4.
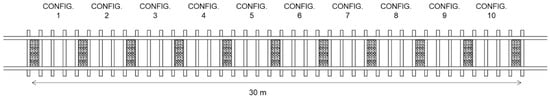
Figure 4.
Plan view of the full test-site arrangement.
2.3. Test Equipment
The EM response of the various configurations was collected by towing a pulsed GPR system equipped with high-frequency horn antennas along the test-site. The central frequencies of the antennas were 1000 MHz and 2000 MHz. The system and the antennas were both manufactured by IDS GeoRadar (Part of Hexagon).
Surveys were conducted separately for the two antennas using a hand-towed railway cart (Figure 5a) equipped with a wooden support. This allowed to maintain the antenna suspended in the air at a fixed height of approximately 40 cm and its rotation around the vertical axis. This ensured to reproduce different polarisations of the antenna. To this effect, orientations of 0°, 45° and 90° were created with respect to the towing direction (Figure 5b).
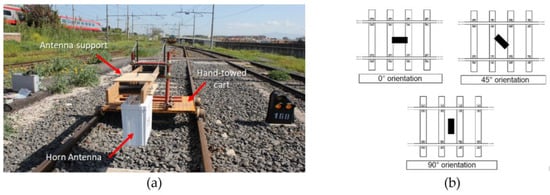
Figure 5.
(a) The experimental testing device; (b) tested antenna orientations.
2.4. Survey Protocol
Data collection was carried out by towing the GPR system along the full test-site area. Acquisitions were then repeated for each combination of parameters and tested values, as shown in Table 2.
Table 2.
Parameters and tested values within the data collection process.
To this effect, an overall dataset of 18 acquisitions was collected along the 30 m-long stretch reported in Figure 4. The acquisition parameters adopted for the GPR system are reported in Table 3, according to the specific frequency.
Table 3.
GPR acquisition parameters.
2.5. Data Processing
The raw data have been analysed in both time and frequency domains, following the application of a multi-stage processing procedure [31], composed of:
- Time-zero correction: for inspections conducted with an air-coupled antenna, direct wave arrival times (time-zero) are not horizontally aligned along the main longitudinal scanning direction, due to the bouncing of the antenna support. This causes a variation of the default height of the antenna along the inspection length. Accordingly, the air layer between the signal source and the surface is removed in order to set a common starting time for each trace.
- De-wow: typically, GPR sections show strong lower frequency harmonics (“wow”) or initial direct current offsets (Direct Current (DC) shift, DC offset or DC bias), which might cover actual EM reflections. In fact, these harmonics tend to distort the average amplitude of the GPR trace towards values different from zero. De-wow is a stationary low-pass filter that suppresses harmonics with a dominant frequency usually lower than a specific threshold below the Nyquist frequency of the GPR signal. In the present study, suppression frequencies of 250 MHz and 500 MHz were adopted for the 1000 MHz and the 2000 MHz antennas, respectively.
- Background removal: the signal ringing inner to the antenna produces nearly-perfect horizontal reflections that might mask actual reflections from real targets and produce unreliable results. Elements surrounding the test-site, such as electricity cables, mobile phones, etc., may generate these horizontal-like reflections. This occurrence is generally referred to as the “background noise”. To suppress these artifacts from the signal, the average GPR trace calculated using all the traces in the section is subtracted to every GPR trace, sample by sample.
- Band-pass filtering: the signal-to-noise (SNR) ratio in GPR sections is usually lowered by the noise due to the surrounding media and by the inherent loss of the GPR signal, especially at relatively late arrivals. These noise components are generally found to be outside the main working frequency bandwidth of a GPR system. The band-pass filter works by cutting off these side bands from the collected spectrum.
- Short-time Fourier transform (STFT): the application of this method allows keeping data information in both time and frequency domain, by tracking the change of frequency spectrum with time (or depth). Such an information is obtained as follows:where x is the reflected amplitude, t is the time, ω is the radial frequency, w is the window function and STFT is the frequency energy at time t and frequency ω. Values of w equal to 0.12 ns and 0.20 ns were adopted in this study for processing the 1000 MHz and 2000 MHz datasets, respectively.
It worth noting that, in the case of surveys conducted on actual convoys, the maximum sampling frequency may be exceeded and asynchrony between the actual position of a GPR trace and the scanning distance recorded by the odometer can generate due to the high traveling speeds. Accordingly, a further step of processing is required at the beginning of this phase, in order to remove incoherent traces and replace these by way of interpolation.
3. Results and Discussion
3.1. Influence of the Antenna Orientation
Figure 6 shows the averaged frequency spectra for the 1000 MHz (in blue) and the 2000 MHz (in magenta) central frequencies, with reference to the three orientations of the antenna. To single out the EM response from the track-bed and the concrete sleepers, only the traces collected in the middle of the ballast-filled slots were considered. As depicted in the figure, the shape of the spectra are found not to be significantly affected by the orientation of the antenna, for both the frequencies. However, the amplitude of the frequency spectrum turned out to be highly affected by this parameter. In regard to the 1000 MHz antenna, the reflected amplitude is observed to increase as the antenna is oriented more transversally with respect to the direction of the rails. On the contrary, a lower reflected intensity is observed for the 2000 MHz antenna in the case of the 90° orientation. For this specific orientation, the two antennas turned out to provide a response with very similar amplitudes.
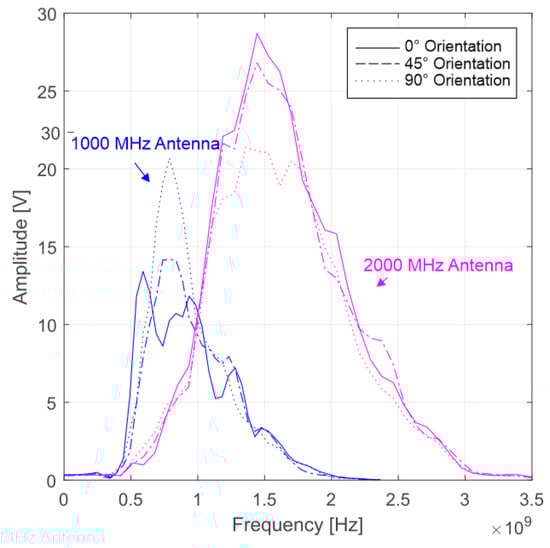
Figure 6.
Frequency-domain response collected using the 1000 MHz (blue) and 2000 MHz (magenta) antennas with 0° (solid line), 45° (dashed line) and 90° (dotted line) orientations.
The time-domain influence of the antenna orientation on the EM response of the entire track-bed (including the sleepers) is shown in Figure 7. As a further confirmation of the frequency-domain results, the effects from the orientation of the antenna (left to right, in the figure) are much more evident for the 1000 MHz (Figure 7a–c, first row) as opposed to the 2000 MHz signals (Figure 7d–f, second row). Indeed, while the latter are not significantly affected by the antenna polarisation, the response from the 1000 MHz inspection returns very different outcomes. In particular, the signal collected using the 0° orientation (Figure 7a) shows to be seriously affected by the presence of the concrete sleepers causing clearly distinguishable hyperbolas.
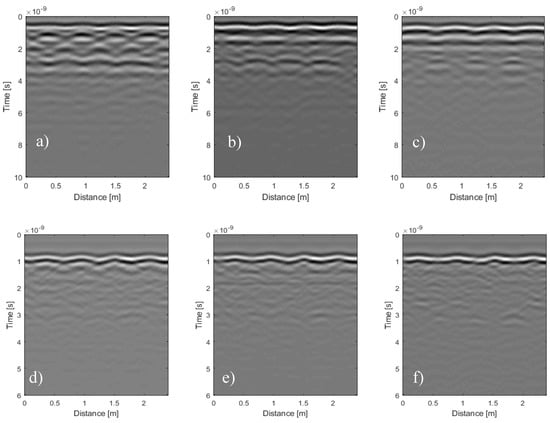
Figure 7.
Time-domain response collected over the configuration 1 with 1000 MHz (a–c) and 2000 MHz (d–f) antennas, using 0° (a,d), 45° (b,e) and 90° (c,f) orientations.
On the other hand, the transversal polarisation (Figure 7c) provided a very high reflection from the surface, with only a slight influence from the sleepers. However, the attenuation of the signal in depth turned out to inhibit a clear identification of the bottom section of the track-bed. Conversely, the 45° (Figure 7b) orientation turned out to provide the clearest response in the time domain, in terms of structural details of the track-bed. According to Al-Qadi et al. [32], a potential explanation to this could be the incidence angle of the EM waves on the rails and the sleepers that, for this particular orientation, tends to send them away from the antenna.
3.2. Grading-Dependent Behaviours
With regard to the effects of the ballast grading on the signal, dry conditions of Configurations 1 (GC1) and 6 (GC2) were taken into account to represent sound and crushed ballast, respectively. Moreover, Configurations 5 and 7 (one layer of sound ballast and one layer of crushed ballast) were considered in order to reproduce partially-crushed material. Figure 8 shows the EM response of these configurations in the frequency domain. The frequency spectra reported in the plot have been obtained by averaging the seven traces collected in the central 15 cm-section of each of the three ballast slots composing the configuration.
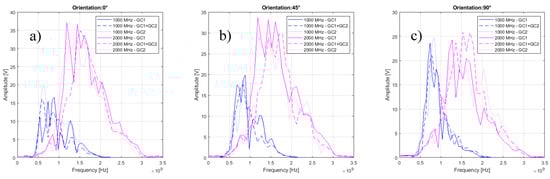
Figure 8.
Frequency-domain EM response collected using the 1000 MHz (blue) and 2000 MHz (magenta) antennas with (a) 0°, (b) 45° and (c) 90° orientations, of sound (solid line), semi-crushed (dashed line) and totally-crushed (dotted line) dry ballast.
Regarding the signal collected with the 1000 MHz antenna (in blue in Figure 8), the shape of the spectra was found not to vary significantly in relation to the fragmentation rate. This was verified for all the orientations of the antenna.
On the contrary, the analysis of the information collected with the 2000 MHz antenna (in magenta in Figure 8), allows us to identify a dependency between the spectrum shape and the fragmentation rate. For all the antenna orientations, the frequency spectra relative to sound ballast (GC1, solid lines in Figure 8) showed a significant rate of energy at lower frequencies, i.e., in the 1100–1300 MHz frequency range, with respect to the averagely- or totally-crushed configurations (dashed and dotted lines).
This grading-dependent behaviour of sound ballast subject to high-frequency EM fields is in agreement with subject-related literature. In fact, this had been already observed in previous research [12,20,21], where the occurrence was related with scattering and resonance effects triggered by the specific dimension of the aggregates and the air voids. The time-frequency analysis carried out using the STFT approach, as depicted in Figure 9, demonstrates that most of the energy for sound ballast (a) is focused at a short arrival time (4–6 ns). This is followed by a gradual attenuation that ends up around 14 ns. As the fragmentation of the ballast increases, a faster attenuation of the signal is observed. In particular, energy drops at 13 ns and 12.5 ns are observed for semi-crushed and totally-crushed configurations (Figure 9b,c).
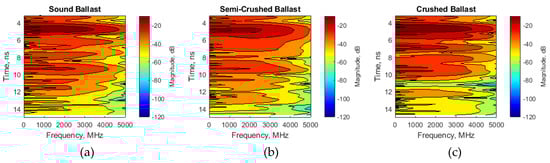
Figure 9.
STFT spectra for (a) sound, (b) averagely-crushed ballast and (c) totally-crushed ballast, collected using the 2000 MHz antenna with 45° orientation, at the centre of the ballast slot (sleepers are excluded).
3.3. Fouling/Moisture Effects on the Surface Reflection Amplitude
Due to the known physio-chemical attitude of fine-graded materials towards the retention of soil moisture [21,22,23], fouling and moisture are expected to magnify each other’s influence on the EM signal. In fact, the more fouled is the track-bed, the less efficient is the drainage of liquids poured onto the surface. In turn, the water retained by the polluting material is responsible for heavily affecting its dielectric properties. Therefore, the EM effects of fouling are expected to be significantly more evident in cases of high soil moisture. On the other hand, the effects of water content on the EM response of ballast are expected to be negligible, in absence of pollution.
Following these assumptions, three test configurations at growing fouling conditions have been taken into account at three different rates of soil moisture. The amplitude of the air-surface reflection was observed along its length across all of these configurations. Results are shown in Figure 10.
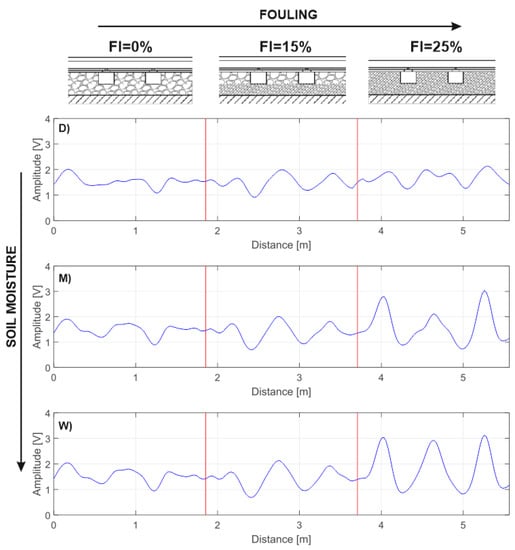
Figure 10.
Amplitude of the air-surface reflection for clean (FI = 0%), partially-fouled (FI = 15%) and totally-fouled (FI = 25%) configurations, in dry (D), moist (M) and wet (W) conditions. Data were collected with a 90° orientation of the 1000 MHz antenna system.
The outcomes of this investigation clearly confirm the initial assumptions, as the influence of the fouling rate (left to right) is much more evident for wet (W) conditions. Similarly, the effects of water content (top to bottom) are most likely to be appreciated in the case of totally-fouled ballast conditions (FI = 25%).
In more detail, the variation of the reflection amplitude when the antenna moved from the concrete sleeper to the ballast was taken as a reference for the evaluation of the influence of both the fouling and the moisture factors [33]. In fact, the behaviour of the amplitude seems as quasi-horizontal for dry (D) and FI = 0% conditions, whereas it assumes a sinusoidal shape for wet (W) and FI = 25%. In this case, the position of the sleepers is clearly identifiable. To support this statement, the standard deviation of the reflection amplitude is plotted in Figure 11 against the FI and the moisture.
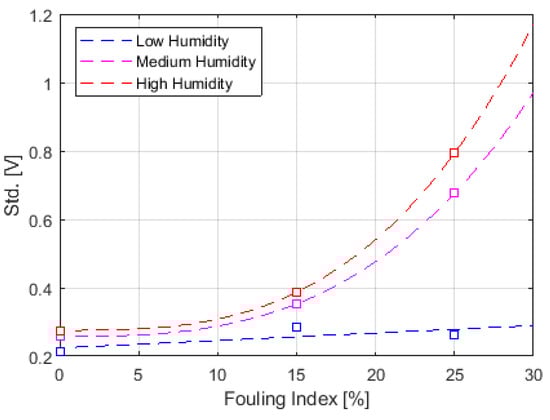
Figure 11.
Standard deviation of the surface reflection amplitude against fouling and moisture conditions.
As demonstrated in Figure 11, standard deviation of the surface reflection variability stands as a viable indicator for predicting the rate of fouling. The polynomial regression reported in Figure 11 can be analytically expressed as follows:
with FI and SD being the Fouling Index and the Standard Deviation of the surface reflection variability, respectively. The value of the coefficients ai are reported in Table 4.
Table 4.
Coefficient ai in Equation (3).
The above findings are confirmed by the analysis of the time-frequency data. Figure 12 shows the application of the STFT approach to GPR traces collected with the 1000 MHz antenna at the centre of the ballast slot at growing rates of fouling (from left to right), in both low (Figure 12a–c) and high (Figure 12d–f) moisture conditions. Influence of fouling is found to be not relevant in drier conditions, whereas it turned out to heavily affect the STFT spectrum of the track-bed under wet conditions. In this specific case, an energy drop is observed already at 10 ns (Figure 12f).
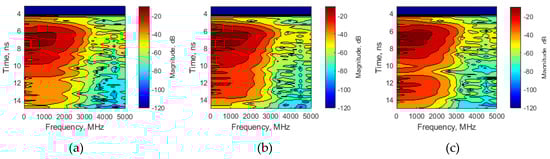
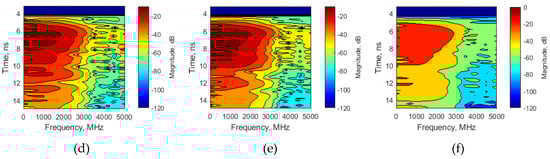
Figure 12.
STFT spectra collected with the 1000 MHz antenna at the centre of the ballast slots (i.e., sleepers are excluded) with FI = 0% (a,d), FI = 15% (b,e) and FI = 25% (c,f), for dry (a–c) and wet (d–f) samples.
4. Conclusions and Practical Implications
This work reports the experimental activities carried out on a test-site area within a railway depot in Rome, Italy. A 30 m-long railway section was divided into 10 sub-sections reproducing different various physical and structural conditions of the track-bed.
Combinations of different scenarios of fragmentation and fouling of the ballast were reproduced. The set-up was then investigated using different multi-frequency (1000, 2000 MHz) GPR horn antenna systems. These were towed along the rail sections by means of a dedicated railway cart that allowed the antenna to be oriented with an angle of 0°, 45° and 90° with respect to the rails.
The effects of the physical conditions of the railway ballast on its EM response was estimated for each scenario using time- and frequency-domain signal processing techniques. Parallel to this, modelling was provided to estimate fouling content.
Interpretation of the results has shown viability of the GPR method in detecting signs of decay at the network level, thereby proving this technique to be worthy for implementation in asset management systems. Such a conclusion confirms previous research findings on this subject [12,13,14,15,20]. However, the present research has pointed out key information in regard to the practical use of an air-coupled GPR system for assessing fragmentation and fouling in railway track-beds.
In this regard, use of high-frequency antenna systems was reported to be promisingly effective in detecting the fragmentation rate of the aggregates. In case of track-beds isolated from the subgrade, such as the typical modern high-speed tracks, the spectral analysis of the 2000 MHz signal is expected to provide viable information about this particular type of decay.
On the other hand, time-domain and combined time-frequency analyses of the 1000 MHz antenna system, allowed us to achieve a reliable indication of the pollution rate of voids within the aggregates. The influence of fouling on the EM response was observed to be particularly relevant for highly-wet conditions. This could imply that monitoring activities may need to be carried out in relatively-dry conditions of the track-bed in order to optimise the functionality of the process.
Author Contributions
conceptualization, A.C. and L.B.C.; methodology, A.C. and F.D.; investigation, F.D.; data curation, L.B.C.; writing—original draft preparation, L.B.C.; writing—review and editing, F.D. and A.C.
Funding
This research received no external funding.
Acknowledgments
The authors express their deep gratitude to RFI S.p.a. for granting the accessibility to the test-site and the assistance during the surveys. IDS Georadar S.p.a. is also acknowledged for providing part of the survey equipment. Finally, many thanks to Spartaco Cera for the valuable help in arranging and conducting the experimental operations.
Conflicts of Interest
The authors declare no conflicts of interest.
References
- Indraratna, B. 1st Ralph Proctor lecture of ISSMGE. Railroad performance with special reference to ballast and substructure characteristics. Transp. Geotech. 2016, 7, 74–114. [Google Scholar] [CrossRef]
- Benedetto, A.; Tosti, F.; Bianchini Ciampoli, L.; Calvi, A.; Brancadoro, M.G.; Alani, M.A. Railway ballast condition assessment using ground-penetrating radar—An experimental, numerical simulation and modelling development. Constr. Build. Mater. 2016, 140, 508–520. [Google Scholar] [CrossRef]
- Artagan, S.S.; Bianchini Ciampoli, L.; D’Amico, F.; Calvi, A.; Tosti, F. Non‑destructive Assessment and Health Monitoring of Railway Infrastructures. Surv. Geophys. 2019, 1–37. [Google Scholar] [CrossRef]
- Indraratna, B.; Nimbalkar, S.; Coop, M.; Sloan, S.W. A Constitutive model for coal-fouled ballast capturing the effects of particle degradation. Comput. Geotech. 2014, 61, 96–107. [Google Scholar] [CrossRef]
- Selig, E.T.; Waters, J.M. Track geotechnology and substructure management; Thomas Telford Publications: London, UK, 1994. [Google Scholar]
- Ebrahimi, A.; Tinjum, J.M.; Edil, T.B. Protocol for testing fouled railway ballast in large-scale cyclic triaxial equipment. Geotech. Testing J. 2012, 35, 1–9. [Google Scholar] [CrossRef]
- Selig, E.T.; Dello Russo, V.; Laine, K.J. Sources and Causes of Ballast Fouling, Report No. R-805; Association of American Railroads, Technical Center: Chicago, IL, USA, 1992. [Google Scholar]
- Jol, H. Ground penetrating radar theory and applications, 1st ed.; Elsevier: Amsterdam, The Netherlands, 2018. [Google Scholar]
- Daniels, D.J. Ground penetrating radar, 2nd ed.; The Institution of Electrical Engineers: London, UK, 2004. [Google Scholar]
- Clark, M.R.; Gillespie, R.; Kemp, T.; McCann, D.M.; Forde, M.C. Electromagnetic properties of railway ballast. NDT E Int. 2001, 34, 305–311. [Google Scholar] [CrossRef]
- Hugenschmidt, J. Railway track inspection using GPR. J. Appl. Geophys. 2000, 43, 147–155. [Google Scholar] [CrossRef]
- Al-Qadi, I.L.; Xie, W.; Roberts, R. Time-frequency approach for ground penetrating radar data analysis to assess railroad ballast condition. Res. Nondestr. Eval. 2008, 19, 219–237. [Google Scholar] [CrossRef]
- Benedetto, F.; Tosti, F.; Alani, A.M. An entropy-based analysis of GPR data for the assessment of railway ballast conditions. IEEE Trans. Geosci. Remote Sens. 2017, 55, 3900–3908. [Google Scholar] [CrossRef]
- Al-Qadi, I.L.; Xie, W.; Roberts, R.; Leng, Z. Data analysis techniques for GPR used for assessing railroad ballast in high radio-frequency environment. J. Transp. Eng. 2010, 136, 96–105. [Google Scholar] [CrossRef]
- Sussmann, T.R.; O’Hara, K.R.; Selig, E.T. Development of material properties for railway application of ground penetrating radar. Proc. SPIE 2002, 4758. [Google Scholar] [CrossRef]
- Shao, W.; Bouzerdoum, A.; Phung, S.L.; Su, L.; Indraratna, B.; Rujikiatkamjorn, C. Automatic classification of ground-penetrating-radar signals for railway-ballast assessment. IEEE Trans. Geosci. Remote Sens. 2011, 49, 3961–3972. [Google Scholar] [CrossRef]
- Fontul, S.; Fortunato, E.; De Chiara, F.; Burrinha, R.; Baldeiras, M. Railways Track Characterization Using Ground Penetrating Radar. Procedia Eng. 2016, 143, 1193–1200. [Google Scholar]
- De Chiara, F. Improvement of railway track diagnosis using ground penetrating radar. Ph.D. Thesis, La Sapienza University, Rome, Italy, 2014. [Google Scholar]
- Olhoeft, G.R.; Selig, E.T. Ground penetrating radar evaluation of railway track substructure conditions. In Proceedings of the 9th International Conference on Ground Penetrating Radar (GPR 2002), Santa Barbara, CA, USA, 29 April–2 May 2002. [Google Scholar]
- Bianchini Ciampoli, L.; Tosti, F.; Brancadoro, M.G.; D’Amico, F.; Alani, A.M.; Benedetto, A. A spectral analysis of ground-penetrating radar data for the assessment of the railway ballast geometric properties. NDT E Int. 2017, 90, 39–47. [Google Scholar] [CrossRef]
- Tosti, F.; Benedetto, A.; Bianchini Ciampoli, L.; Lambot, S.; Patriarca, C.; Slob, E.C. GPR analysis of clayey soil behaviour in unsaturated conditions for pavement engineering and geoscience applications. Near Surf. Geophys. 2016, 14, 127–144. [Google Scholar] [CrossRef]
- Patriarca, C.; Tosti, F.; Velds, C.; Benedetto, A.; Lambot, S.; Slob, E. Frequency dependent electric properties of homogeneous multi-phase lossy media in the ground-penetrating radar frequency range. J. Appl. Geophys. 2013, 97, 81–88. [Google Scholar] [CrossRef]
- Benedetto, A.; Tosti, F.; Ortuani, B.; Giudici, M.; Mele, M. Soil moisture mapping using GPR for pavement applications. In Proceedings of the 7th International Workshop on Advanced Ground Penetrating Radar, Nantes, France, 2–5 July 2013. [Google Scholar]
- Tosti, F.; Bianchini Ciampoli, L.; Calvi, A.; Alani, A.M.; Benedetto, A. An investigation into the railway ballast dielectric properties using different GPR antennas and frequency systems. NDT E Int. 2018, 93, 131–140. [Google Scholar] [CrossRef]
- Brancadoro, M.G.; Bianchini Ciampoli, L.; Ferrante, C.; Benedetto, A.; Tosti, F.; Alani, A.M. An Investigation into the railway ballast grading using GPR and image analysis. In Proceedings of the 9th International Workshop on Advanced Ground Penetrating Radar, IWAGPR 2017, Edinburgh, UK, 28–30 June 2017. [Google Scholar]
- Benedetto, A.; Bianchini Ciampoli, L.; Brancadoro, M.G.; Alani, A.M.; Tosti, F. A Computer-Aided Model for the Simulation of Railway Ballast by Random Sequential Adsorption Process. Comput. Aided Civ. Infrastruct. Eng. 2018, 33, 243–257. [Google Scholar] [CrossRef]
- Shangguan, P.; Al-Qadi, I.L.; Leng, Z. Ground-penetrating radar data to develop wavelet technique for quantifying railroad ballast-fouling conditions. Transp. Res. Rec. 2012, 2289, 95–102. [Google Scholar] [CrossRef]
- Fontul, S.; Fortunato, E.; De Chiara, F. Evaluation of ballast fouling using GPR. In Proceedings of the 15th International Conference on Ground Penetrating Radar (GPR 2014), Brussels, Belgium, 30 June–4 July 2014. [Google Scholar]
- RFI DTC SICS SP IFS 001A. “General technical standard of civil works contracts”, Section 17, Ballast for Railway Track-beds. Italian National Railways, 2016.
- EN 933-1:2012. Tests for geometrical properties of aggregates—Part 1: Determination of particle size distribution—Sieving method. European Committee for Standardization, 2012.
- Bianchini Ciampoli, L.; Tosti, F.; Economou, N.; Benedetto, F. Signal Processing of GPR Data for Road Surveys. Geosciences 2019, 9, 96. [Google Scholar] [CrossRef]
- Al-Qadi, I.A.; Xie, W.; Roberts, R. Optimization of antenna configuration in multiple-frequency ground penetrating radar system for railroad substructure assessment. NDT E Int. 2010, 43, 20–28. [Google Scholar] [CrossRef]
- Benedetto, A.; Tosti, F.; Schettini, G.; Twizere, C. Evaluation of geotechnical stability of road using GPR. In Proceedings of the 6th International Workshop on Advanced Ground Penetrating Radar, IWAGPR 2011, Aachen, Germany, 22–24 June 2011. [Google Scholar]
© 2019 by the authors. Licensee MDPI, Basel, Switzerland. This article is an open access article distributed under the terms and conditions of the Creative Commons Attribution (CC BY) license (http://creativecommons.org/licenses/by/4.0/).