Article

JAXA Annual Forest Cover Maps for Vietnam during 2015–2018 Using ALOS-2/PALSAR-2 and Auxiliary Data

1
Center for VNU Development at Hoa Lac Campus—Vietnam National University, Hanoi, Thach Hoa Commune, Thach That District, Hanoi 155500, Vietnam
2
Graduate School of Life and Environmental Sciences, University of Tsukuba, Tennoudai 1-1-1, Tsukuba, Ibaraki 305-8572, Japan
3
Hydraulic Construction Institute—Vietnam Academy for Water Resources, No. 3, Alley 95, Chua Boc Street, Dong Da district, Hanoi 116765, Vietnam
4
Earth Observation Research Center, Japan Aerospace Exploration Agency (JAXA), 2-1-1 Sengen, Tsukuba, Ibaraki 305-8505, Japan
5
Faculty of Life and Environmental Sciences, University of Tsukuba, Tennoudai 1-1-1, Tsukuba, Ibaraki 305-8572, Japan
*
Author to whom correspondence should be addressed.
Remote Sens. 2019, 11(20), 2412; https://doi.org/10.3390/rs11202412
Submission received: 21 September 2019 / Revised: 13 October 2019 / Accepted: 15 October 2019 / Published: 17 October 2019

Abstract

:
Monitoring the temporal changes of forests is important for sustainable forest management. In this study, we investigated the potential of using multi-temporal synthetic aperture radar (SAR) images for mapping annual change in forest cover at a national scale. We assessed the robustness of using multi-temporal Phased Array L-band Synthetic Aperture Radar-2/Scanning Synthetic Aperture Radar (PALSAR-2/ScanSAR) mosaic images for forest mapping by comparison with single-temporal PALSAR-2 mosaic images for three test sites in North, Central, and Southern Vietnam. We then used a combination of multi-temporal PALSAR-2/ScanSAR images, multi-temporal Moderate Resolution Imaging Spectroradiometer (MODIS) Normalized Difference Vegetation Index (NDVI) images, and Shuttle Radar Topography Mission (SRTM) images to map annual forest cover for mainland Vietnam during 2015–2018. Average overall accuracies of our forest/non-forest (FNF) maps (86.6% ± 3.1%) were greater than recent maps of Japan Aerospace Exploration Agency (JAXA, (77.5% ± 3.2%)) and European Space Agency (ESA, (85.4% ± 1.6%)). Our estimates of mainland Vietnam’s forest area were close to that of the Vietnamese government. A comparison of the spatial distribution of forest estimated from JAXA and ESA FNF maps showed that our FNF map in 2015 agreed relatively well with the ESA map, with 77% of pixels being consistent. This study demonstrates the merit of using multi-temporal PALSAR-2/ScanSAR images for annual forest mapping at a national scale.

Graphical Abstract

1. Introduction

Forests are crucial ecosystems that provide critical habitats to plants and animals [1,2], affect the global carbon cycle through deforestation and reforestation [3], and offer livelihood to humankind [4]. Despite its importance, from 2000 to 2012, 2.3 × 10⁶ km2 of forest were lost globally, with 32% of the total loss coming from tropical forests [5]. Forest loss causes problems such as soil erosion, increased greenhouse gas emissions, and also threatens the livelihood of local people and animals [6]. The recent extreme change in forest cover emphasizes the need for the reliable information on forest status in order to enhance active forest management and the implementation of the Reducing Emissions from Deforestation and Forest Degradation (REDD+) framework.
The development of satellite missions such as Landsat, Moderate Resolution Imaging Spectroradiometer (MODIS), Sentinel, and Advanced Land Observation Satellite (ALOS) has facilitated the mapping of changes on the Earth’s land cover. It is possible to extract information about forests from global land-cover datasets such as the 1 km Global Land Cover Dataset for the year 2000 (GLC2000) [7], the 500 m MODIS Land Cover Type (MCD12Q1) [8], the 300 m MERIS Global Land Cover Service (GlobCover) [9], and the 30 m Finer Resolution Observation and Monitoring of Global Land Cover (FROM-GLC) [10]. However, these products focus not only on forests but also on other land cover categories, and they are different in spatial resolutions. It can, therefore, be challenging to obtain accurate information on the forest category from these products. Some satellite-derived global forest datasets have been developed, such as the MODIS vegetation continuous fields product [11], the global tree cover products [5,12], and the Japan Aerospace Exploration Agency (JAXA) forest/non-forest products [13]. However, difficulties remain regarding how to directly apply the results of these global land cover maps to national reports due to uncertainties in the estimation of forest area and change in forest area at a national scale [14,15,16] and the fact that forest definition is different in many parts of the world [17]. Thus, further efforts are needed to improve the reliability of global forest maps for national reporting [14].
JAXA has been working on mapping annual global forests using a series of its synthetic aperture radar (SAR) sensors, namely ALOS/PALSAR and ALOS-2/PALSAR-2. The JAXA FNF map for each year is created from a single mosaic image consisting of the high-resolution SAR images taken in that year. This approach does not use features of the intra-annual (seasonal) change of the land surface. However, since the intra-annual change is a good indicator of land cover, the use of SAR time-series data covering several seasons in a year has the potential to improve JAXA FNF maps. PALSAR-2 provides ScanSAR images, which are acquired more frequently than the high-resolution images. The purposes of the ScanSAR mode operation are to monitor rapid deforestation and wetlands, mainly in the tropical region. However, the potential of using PALSAR-2/ScanSAR time-series images for annual forest mapping has not been investigated.
Many studies have revealed the uncertainties that are currently involved in the estimation of forest cover from satellite images, especially in tropical regions and have suggested that the integration of optical images and SAR images can be used to obtain more accurate forest mapping [18,19,20,21,22,23,24]. Optical and SAR images both have advantages and disadvantages for land cover mapping. Optical images are affected by clouds, which limit the continuous observation of the land surface. Therefore, it is challenging to detect annual changes in forest area using optical satellite images. Meanwhile, SAR images contain speckle noise and distortion due to the influence of terrain, which can greatly affect the accuracy of classification maps. However, advantageously, SAR images are not affected by cloud or solar illumination conditions. Therefore, SAR images can be used to fill the data gap caused by clouds in optical images. Hence, the combination of optical and SAR images is robust since the disadvantage of one can be compensated for the other.
By fusing SAR and optical images, some studies have reported substantial improvements in the accuracy of forest mapping compared to global forest maps [18,19,25,26]. Combining optical images (Landsat, MODIS) and SAR images (ALOS/PALSAR, ALOS-2/PALSAR-2, European Remote Sensing (ERS), RADARSAT) often produces more accurate land cover maps than a single data source [27]. Recently, some studies have extensively utilized PALSAR/PALSAR-2 mosaic data and MODIS NDVI for forest mapping [18,19,26,28]. For example, Zhang et al. (2019) [26] showed that forest maps produced using PALSAR/PALSAR-2 and MODIS NDVI data were more accurate than original JAXA FNF maps. Therefore, the combination of PALSAR/PALSAR-2 images and MODIS images has the potential to improve the accuracy of forest mapping greatly.
The purpose of this study was to produce annual forest-cover maps for mainland Vietnam during 2015–2018. We specified the following three objectives: (1) assess the relative advantages of multi-temporal PALSAR-2/ScanSAR images compared to single-temporal PALSAR-2 images by performing forest classification using different image combinations for three test sites in Vietnam. (2) produce annual FNF maps for the mainland Vietnam by using multi-temporal PALSAR-2/ScanSAR images, MODIS NDVI images, and SRTM images, and (3) compare our results with Vietnamese national statistical data, the current annual JAXA FNF maps, and the European Space Agency (ESA) global land cover map. Our study area was mainland Vietnam because Vietnam has a rich diversity of forest types (open broad-leaved forests, deciduous forests, bamboo and palms, coniferous forests, evergreen broad-leaved forests, and semi-deciduous broad-leaved forests) and is one of the few developing countries that have experienced a transition from deforestation to reforestation [29].

2. Materials and Methods

2.1. Study Area

Vietnam is a tropical monsoon country located in Southeast Asia and extends from 8°37′ to 23°23′N and from 102°11′ to 109°27′E. The country borders with China, Laos, and Cambodia in the north, the west, and the southwest, respectively. Our study area is mainland Vietnam, excluding small islands remote from the continent. Mainland Vietnam occupies an area of around 332,000 km2 and comprises a variety of landscapes, including high mountains, highlands, deltas, and coastal areas (total coast length of 3200 km). Following economic reforms in 1986 and the revision of the second land law in 1993, Vietnam’s forest experienced a substantial recovery [30]. In recent decades, Vietnam has become one of the few countries in Southeast Asia which have transitioned from net deforestation to net reforestation [31]. The increase in forest cover in Vietnam is mainly due to reforestation programs, which have costed around 2 billion USD in total [32]. These programs led to an increase in the area of planted forest, which has been intensively grown to meet the domestic and export demand for timber [30].

2.2. Satellite Images and Preprocessing

2.2.1. Multi-Temporal PALSAR-2/ScanSAR and Single-Temporal PALSAR-2 Images

JAXA operates the PALSAR-2 instrument aboard the ALOS-2 satellite. The instrument has different modes, including Spotlight, Stripmap, and ScanSAR, and these modes have different resolutions, incident angles, and swath widths. Multi-temporal PALSAR-2/ScanSAR images are acquired in ScanSAR mode, while single-temporal PALSAR-2 images are acquired in Stripmap mode (fine beam dual (FBD) mode). The ALOS-2 satellite completes one cycle around the Earth every 14 days. The different modes of ALOS-2/PALSAR-2 are intended for observation in different cycles in a year. Details of the ALOS-2/PALSAR-2 acquisition modes are available on the JAXA website [33]. The ScanSAR images are mosaicked images consisting of images acquired within one cycle (14 days). Therefore, a 1o × 1o tile mosaic image can contain data acquired on different dates in the same cycle. To simplify the processing, we set the representative date for the image as the starting date of the cycle. The difference between the assigned date and the real acquisition date of the image was between 0 and 11 days. This difference was considered acceptable given that we were analyzing the changes in land cover on an annual basis.
JAXA provides the ScanSAR images in 1o × 1o tiles with a spatial resolution of 50 m. For each tile, images are available with two different polarizations (HH and HV). The data were corrected for the slope effect and were provided together with mask information describing layover and shadowing. We used the ScanSAR images for four years, namely, 2015 (339 scenes), 2016 (450 scenes), 2017 (506 scenes), and 2018 (490 scenes). A total of 60 tiles were required to cover the mainland Vietnam. On a yearly average, we have about seven scenes for each tile.
During preprocessing, the digital number (DN) of both HH and HV polarizations was first converted into gamma-naught ( γ o ) values (unit in decibel [dB]) using Equation (1). Then, we assigned “NULL” values to the pixels of layover and shadowing in order to exclude them from the subsequent analysis. On average, the “NULL” value pixels account for 2% of the total number of pixels in the 1o × 1o tile images (2250 pixels × 2250 pixels). The speckle noise was reduced using a Lee filter equipped on the SNAP software (version 5.0) [34]. The difference and the ratio between γ HH o and γ HV o showed their potential for forest mapping [19,26,35] and land cover mapping [18]. In this study, we also used the difference (Equation (2)) and the ratio (Equation (3)) in the classification process. After preprocessing, the final ScanSAR images consist of γ HH o , γ HV o , difference, and ratio layers. Figure 1a shows an example of a ScanSAR false-color composite image.
γ o = 10 · log 10 D N 2   +   C
Difference   =   γ HH o   γ HV o
Ratio   =   γ HH o γ HV o  
where C is the absolute calibration factor (C = −83) [36] and < > is ensemble averaging with a 3 × 3 pixel moving window.
Additionally, we used single-temporal PALSAR-2 one-year mosaic images (FBD mode) to map forest cover at three test sites in Vietnam. The purpose of this was to compare the utility of these maps with those obtained using the ScanSAR time-series images to detect changes in annual forest cover. The PALSAR-2 mosaic images are provided in 1o × 1o tiles with both HH and HV polarization and have a spatial resolution of 25 m [37]. The PALSAR-2 one-year mosaic images were preprocessed using the same procedure as for the ScanSAR images and were also classified using the   γ HH o , γ HV o , ratio, and difference.

2.2.2. MODIS NDVI and SRTM

Moderate Resolution Imaging Spectroradiometer (MODIS) Normalized Difference Vegetation Index (NDVI) data have been widely used in combination with SAR images for forest mapping purposes [18,26,28,35]. In this study, we used the “MODIS Terra vegetation indices 16-day global 250 m”. The images were downloaded from the Google Earth Engine website (https://earthengine.google.com/). We selected the NDVI images whose acquisition date were closest to those of the ScanSAR images (Figure 1b). After converting to the latitude-longitude coordinate system and resizing to a spatial resolution of 50 m, each downloaded NDVI image was divided into a 1o × 1o tile size, since the classification process was based on this tile size.
The Shuttle Radar Topography Mission–Digital Elevation Model (SRTM–DEM) has previously been used for forest mapping and allows greater mapping accuracy when used in combination with other satellite images [38,39,40]. We downloaded SRTM-DEM images with a spatial resolution of 30 m for the mainland Vietnam, the images were obtained from the United States Geological Survey (USGS) website (https://earthexplorer.usgs.gov/). The DEM images were then resized to a spatial resolution of 50 m, which is the same spatial resolution as the ScanSAR and MODIS NDVI images. The slope map was then estimated for later classification (Figure 1c). For preprocessing MODIS NDVI and SRTM images, we used the GRASS GIS software in combination with GDAL library, using the “gdalwarp” tool to resize images and the “gdaldem” tool to estimate the slope map from the SRTM-DEM.

2.3. Classification Method

This study used a robust machine learning approach, which is a combination of Kernel Density Estimation and Bayesian inference [41]. The robustness of this approach is due to (1) the flexibility and ease with which the Bayesian rule can be used to integrate the posterior probability of multi-temporal images or multi-sensor images [42] and (2) the high accuracy of the Kernel Density Estimation method for simulating the probability density functions of training data. Hashimoto et al. (2013) proposed this approach [41] and used it to produce land use/land cover maps with higher overall accuracy than those produced using other algorithms, such as maximum likelihood classification and support vector machines. The approach was applied to produce high-resolution land use and land cover maps for all of Japan [43,44] and Vietnam [45,46]. The resulting products were published by JAXA as an open land-cover dataset [47]. Due to its distinct advantages, this approach is considered as a reliable way to produce accurate forest maps.
The machine learning approach used in the present study estimates the probability density of features (e.g., backscattering coefficient, vegetation index, and slope) by adding small Gaussian functions (kernels) at each training data point in the feature space. Then, the probability density is used to estimate the posterior probability of land cover categories using the Bayesian rule. The final land cover category is the greatest joint probability category of overlapped images from time-series and different sensors [41]. The details of the method are as follows.
The preprocessed satellite image is considered as a set of D-dimensional vectors in the feature space. Let x be a feature vector in the feature space, x = (x1, x2,…, xD), where x refers to a pixel in the image. In the ScanSAR images, D is equal to 6 and includes four features related to the polarizations (HH, HV, Difference, and Ratio) and two features related to the observation date (t1 and t2 Equation (4)).
[ t 1 , t 2 ]   =   [ cos ( 2 π D O Y D O Y max ) , sin ( 2 π D O Y D O Y max ) ]
where:
  • DOY is the day of the year (Julian day) on which the observation was made,
  • DOYmax is the maximum day of the year on which the observation was made (DOYmax is equal to 365 or 366 depending on the observation year).
For each pixel, the posterior probability of a land cover category is computed based on the Bayesian rule (Equation (5)) [41].
p ( C k   |   x )   =   p ( C k   ) p ( x   |   C k   ) p ( x )   =   p ( C k   ) p ( x   |   C k   ) k = 1 M p ( C k   ) p ( x   |   C k   )
where:
  • Ck is the kth category (k = 1,2,…,M, where M is the number of categories, here, M = 7),
  • p(Ck) is the prior probability of category Ck,
  • p(x|Ck) is a category-conditional probability of x, and it is estimated using kernel density estimation (KDE).
The conditional probability p(x|Ck) of input data x given the category Ck is the sum of the kernel functions, which are in the same form and centered on each training datum (Equation (6)) [41]. In this method, the Gaussian kernel is the kernel function (Equation (7)) and the bandwidth parameter hd is estimated using Scott’s rule of thumb (Equation (8)) [41].
p ( x   |   C k   )   =   1 N k n   =   1 N k { d   =   1 D 1 h d   K ( x d   x n , d h d ) }  
K ( u )   =   1 2 π exp ( 1 2 u 2 )
h d =   N k 1 / ( D   +   4 ) · σ d
where:
  • xd is the dth component of the feature vector x (1 d ≤ D),
  • xn,dis the dth component of vector xn(training data), where 1 ≤ n ≤ Nk, where Nk is the number of training data in category Ck,
  • hd is the bandwidth parameter which adjusts the radius of the kernel functions,
  • σd is the standard deviation of the dth component training data of category Ck.
We computed the joint probability of each category by multiplying the posterior probability of all overlapped images. At a pixel, the category with the greatest joint probability is assigned as the predicted category. In this study, we ran the KDE process separately for ScanSAR, MODIS NDVI, and SRTM-slope images. The separate posterior files were finally integrated to create the land cover maps (Figure 2). Then, the non-forest categories were aggregated to create FNF maps. This study utilized the SACLASS software, whose algorithm employs KDE based on the Bayesian rule [43].

2.4. Collection of Reference Data

In this study, we utilized the Land Cover Classification System of the Food Agriculture Organization [48], which was used in recent land-cover mapping studies for Vietnam [45,46]. Forests are defined as areas larger than 0.5 ha which is predominantly covered by woody vegetation with at least 10% cover. For forest/non-forest classification, this study used seven categories, including water, built-up, forest, paddy, orchard, barren, and other crops. The reasons for separating the non-forest category into detail categories are: (1) There is a diversity of non-forest categories, which caused a wide distribution of their feature in the feature space. It is difficult to present the wide range of features by one non-forest category, (2) We should treat more careful to some categories such as built-up and orchard which are easy to misclassify into forest due to their similar backscatter characteristics in SAR images, (3) The land cover types such as built-up, paddy, orchard, barren and other crops are popular in Vietnam that make it easy to select their training data by visual interpretation.
We created training data for the seven land cover categories by the visual interpretation of high-resolution Google Earth images, Landsat 8 images, and Sentinel 2 images. The creation process was arbitrary that allowed the interpreter to select training data in homogeneous land cover areas and avoided the borders of land cover types. We tried to distribute the training points at places where the land cover was homogeneous and relatively stable from 2015 to 2018. Thus, it can be assumed that the land cover types at the training points did not change between 2015 and 2018. Therefore, we can use one training dataset to classify land cover maps for the four years. We created training data for the seven categories in each 1o × 1o tile. In the total of the whole country (60 tiles), we created 123,051 points, 37% of which corresponded to the forest category (Figure 3a). In this study, we planned to classify FNF maps for three test sites with 1o × 1o tile and then for the whole country (60 tiles). For three test sites, we used the training data taken in the same three 1o × 1o tiles in the 60 tiles.
The validation data for the FNF maps for the three test sites (Figure 4) and the mainland Vietnam were collected separately using a stratified random sampling method. Firstly, for the three test sites with 1o × 1o tiles, a balanced stratified random sampling method was used. For FNF maps (2 categories), we first assumed an overall accuracy of 90%, and we desired a standard error of ±1.5% for this accuracy. According to Equation (9) [49], a sample size of no less than 400 is required to obtain the desired standard error.
n   =   O ( 1   O ) S E 2
where n is the sample size, O is the assumed overall accuracy of the FNF map, and SE is the desired standard error of the overall accuracy. For three test sites, our plan was to compare FNF maps produced by different satellite image combinations including (1) single temporal PALSAR-2 images, (2) multi-temporal PALSAR-2/ScanSAR images, and (3) multi-temporal PALSAR-2/ScanSAR in combination with MODIS NDVI and SRTM images (ScanSAR/NDVI/SRTM). To simplify the sampling design process, we selected forest and non-forest categories of the classified ScanSAR/NDVI/SRTM FNF maps as strata and allocated 200 points to each stratum (Figure 3c–e). In each stratum, the points were randomly allocated using Linux built-in random number generator [50,51]. The allocation was manipulated by the “shuf” command in Linux to the data of each stratum. The land cover types (forest or non-forest) of each point were interpreted from multiple satellite images, including Sentinel 2 (10 m resolution), Landsat 8 (30 m resolution), and Google Earth images. Secondly, for the mainland Vietnam, we also used the balanced stratified random sampling method. We decided to use the strata of the classified 2017 FNF map of mainland Vietnam, as the validation data collected on these strata are valid for assessing the accuracy of maps in other years [49]. We selected a sample size of 500 to assure a standard error of ±1.5%. We also randomly allocated 250 points to each stratum (forest and non-forest) of the 2017 FNF map (Figure 3b). By visual interpretation of Sentinel 2, Landsat 8, and Google Earth images, we created a validation set of 500 points for the FNF map of each year from 2015 to 2018. It is also noticed that we have not considered the effects of interpreter errors to the estimates of the map’s accuracies, forest area and their standard errors due to lack of ground truth data [52].
Additionally, based on the 500-point validation datasets in 2015 and 2018, we created a new validation dataset for accuracy assessment of a forest gain & loss map between 2015 and 2018. We established the forest gain & loss map between 2015 and 2018 by numerical subtraction of pixel values of the 2015 FNF map from the 2018 FNF map. Accordingly, the validation dataset of the forest gain & loss map was also created by numerical subtraction of land cover labels (1 for forest and 0 for non-forest) of the 2015 validation dataset from the 2018 validation dataset.

2.5. Method for Accuracy Assessment and Area Estimation

Stratified random sampling has been widely applied in many fields. One of the motivations of this method is to improve the precision of estimation of population characteristics [53] by dividing the population into subgroups called strata. For land cover map assessment using stratified random sampling, the analysis depends on an estimation weight associated with each sample unit [49]. Olofsson et al. (2013) provided good examples of using an estimation weight for the accuracy assessment and area estimation of a single land change map, in which an estimation weight is the proportion of a strata weight and the total sample count of the map category [54]. This approach is applicable when assessing a single land cover map, in which the sample points from a stratum could not be mixed into other strata in the error matrix of sample counts. Sometimes, we need to assess several maps (assessed maps) using a common validation dataset designed from strata of a single map (the original map). In such a case, the issue is twofold. Firstly, the estimation weight for sample points determined based on the original map should be applied to the assessed maps [49]. This is because the estimation weights of the sample points were estimated based on the defined strata of the original map. Secondly, there is a case that some points from a stratum of the original map are not in the same stratum in the assessed map. As a result, a cell of an error matrix of sample counts may contain points from different strata of the original map. Therefore, it is necessary to incorporate the estimation weights of reference points for each stratum into their corresponding error matrices of sample counts before adding them up (Equation (10)).
As described in Section 2.4, the stratified random samples based on the 2017 FNF map were used to validate FNF maps from 2015 to 2018. Therefore, we used the estimation weights determined by strata of the 2017 FNF map to estimate accuracies, forest areas, standard errors of overall accuracies, and standard errors of the estimated areas of FNF maps in the four years. In this section, we describe a method for accuracy assessment and area estimation of time-series FNF maps by modifying the method described in the study of Olofsson et al. (2013). The main differences between our modification method and the original method are as follows:
(1) We established error matrices of sample counts for reference data from each stratum of the selected map, instead of one error matrix in the original method. This step aims to incorporate the estimation weights of reference data into their corresponding error matrices.
(2) We used different estimation weights compared to the original method. Our estimation weights are considered to be related to the inclusion probabilities of the reference data in the corresponding stratum. Since inclusion probabilities are considered the basis of probability sampling designs. Using the inclusion probability concept allowed us to apply a common reference dataset for the assessment of multiple maps, without considering the stratum weights of each map.
(3) The estimators of standard errors of the map’s overall accuracy and the estimated area are different between our modified method and the original method due to the difference in the estimation weights.
The details of our applied method are described as follows:
Firstly, to estimate the accuracy of each FNF map, we constructed two error matrices of sample counts for the reference data coming from forest stratum and non-forest stratum of the 2017 FNF map. Examples of two error matrices are shown in Table 1 and Table 2, in which the predicted categories (map category) are rows, and the actual categories (reference categories) are columns, where:
  • nij(f) and nij(nf) are the numbers of reference data of category j from the forest stratum and the non-forest stratum, respectively, which are classified as the category i on the map. The subscript (f) and (nf) denote “forest” and “non-forest”, respectively,
  • n(f) and n(nf) are number of reference data from the forest stratum and the non-forest stratum, respectively, which are classified as the category i on the map,
  • n·j(f) and n·j(nf) are numbers of reference data of the category j from the forest stratum and the non-forest stratum, respectively,
  • n(f) and n(nf) are numbers of reference data from the forest stratum and the non-forest stratum, respectively, n(f) + n(nf) = total number of reference data.
Secondly, to estimate areas of the map’s categories, we converted two error matrices of sample counts (Table 1 and Table 2) into an error matrix of the area proportion (Table 3) using an unbiased estimator (Equation (10)). According to Equation (10), each cell ij of Table 1 and Table 2 is multiplied by a weight of W(f) ÷ n(f) (or W(nf) ÷ n(nf)), which is inverse of an inclusion probability of reference data in the corresponding stratum of 2017 FNF map. It is noticed that we assess the accuracy of FNF maps from 2015 to 2018 using the designed reference data coming from the strata of the 2017 FNF map. Hence, we applied the weight estimated on the 2017 FNF map to other maps.
p i j   =   W ( f ) n i j ( f ) n ( f )   +   W ( nf ) n i j ( nf ) n ( nf )
where:
  • pij is the area proportion of cell ij in the error matrix of estimated area proportion,
  • W(f) and W(nf) are the proportion of the mapped area of forest category and non-forest category of 2017 FNF map: W(f) = Am,f /Atot, W(nf) = Am,nf /Atot (Am,f and Am,nf are mapped area of forest category and non-forest category of 2017 map (m denotes “mapped”), and Atot is the total area of 2017 map).
From the error matrix of area proportion, we can directly estimate overall accuracy, user’s accuracies, and producer’s accuracies of the FNF map. The variance of overall accuracy (OA) is estimated by Equation (11).
V ( OA ) =   W ( f ) 2 i = 1 2 n i i ( f ) n ( f ) ( 1   i = 1 2 n i i ( f ) n ( f ) ) n ( f ) 1 +   W ( nf ) 2 i = 1 2 n i i ( nf ) n ( nf ) ( 1   i = 1 2 n i i ( nf ) n ( nf ) ) n ( nf ) 1
where:
  • V(OA) is the variance of the overall accuracy. The standard error of the overall accuracy is obtained by taking the square root of the estimated variance.
  • nii(f) and nii(nf) are reference data from the forest and non-forest stratum of the category j (j = i) that are mapped as a category i on the map.
Finally, the area of the category j (Aj, error-adjusted area) is estimated based on the total area proportion of category j (p·j) in Table 3 using Equation (12).
A j   =   A tot   ×   p · j
The standard error of the error-adjusted area is estimated by Equation (13).
S ( A j ) =   A tot   × S ( p · j )
where S(p·j) is the standard error of area proportion of category j, and it is estimated using the error propagation theory (Equation (14)).
S ( p · j )   =   i   =   1 2 ( W ( f ) 2 n i j ( f ) n ( f ) ( n i · ( f )   n i j ( f ) n ( f ) ) n i · ( f ) 1 +   W ( nf ) 2 n i j ( nf ) n ( nf ) ( n i · ( nf )   n i j ( nf ) n ( nf ) ) n i · ( nf ) 1 )
As described in Section 2.4, we also planned to estimate accuracy for FNF maps at three test sites and forest gain and loss maps between 2015 and 2018, having three categories (forest gain, forest loss, and no change). The described stratified estimators of the map’s accuracies and forest area were applied to the FNF maps at test sites and the forest gain and loss map. Noticeably, for three test sites, the selected strata are of ScanSAR/NDVI/SRTM maps. Hence, the weight of W(f) ÷ n(f) and W(nf) ÷ n(nf) were estimated based on ScanSAR/NDVI/SRTM map and applied to FNF maps of other image combinations (single-temporal PALSAR-2 and multi-temporal PALSAR-2/ScanSAR). In terms of the forest gain and loss map, the stratified estimator of the map’s accuracies and forest area were applied to three categories, including forest gain, forest loss, and no change). The weight of W(f) ÷ n(f) and W(nf) ÷ n(nf) were estimated based on the 2017 FNF map.

2.6. Method for Comparing FNF Maps from Difference Sources

We compared our FNF maps with other data sources, including the national statistical data of Vietnam and global forest products. National inventory statistics were collected from official documents of the Vietnamese Ministry of Agriculture and Rural Development (MARD) and from the National Statistical Year Books of Vietnam. The statistical data were used as a reference for this study’s FNF maps and the global FNF maps. Two global datasets were selected, namely, the JAXA 25 m Global FNF [37] and the ESA 100 m Copernicus Global Land Cover [55]. We extracted FNF maps for the mainland Vietnam from these global products for comparison with our national-scale FNF maps. The 500-point validation datasets (Section 2.4) were used to estimate the overall accuracy of the FNF maps extracted from the global products. We also used the weight of W(f) ÷ n(f) and W(nf) ÷ n(nf) estimated based on the 2017 FNF map (Section 2.5) in accuracy assessment and forest area estimation of the global FNF maps.
To assess the spatial correlation between our FNF map and the global FNF maps, we applied the cross comparison approach, which is robust for comparing the consistency of maps in places where validation data are limited [56]. We compared our FNF maps with the JAXA and ESA FNF maps for 2015. To make the products comparable, we aggregated our 50 m FNF map, the 25 m JAXA FNF map, and the 100 m ESA FNF map to a spatial resolution of 1000 m. Each 1000-m pixel contained forest cover information, which was estimated by counting the fraction of forest pixels in the original map. Then, we estimated the difference in forest fraction among the maps by defining forests as lands with ≥ 10% tree cover. Two forest fraction pixels were considered to be consistent when the difference in their forest fractions was between −0.2 and 0.2 [19].

3. Result

3.1. Classification Result for Three Test Sites

We selected three sites in North, Central, and Southern of Vietnam, respectively, as the test locations for forest classification (Figure 4a). The chosen satellite datasets were single-temporal PALSAR-2 mosaic images, multiple-temporal PALSAR-2/ScanSAR mosaic images, and multiple-temporal PALSAR-2/ScanSAR images in combination with NDVI images and slope images estimated from SRTM-DEM. All of the satellite images were from 2017 and had a 1o × 1o tile size. As shown in Figure 4b, maps based on the single-temporal PALSAR-2 mosaic underestimate the forest area compared to maps based on other products. For site 3, there is clearly a large difference between the FNF map based on the single-temporal PALSAR-2 mosaic and the FNF maps based on other products. The average overall accuracies of the FNF maps based on 400 validation points for 2017 were about 77.4% (±3.6%), 85.7% (±3.1%), and 88.4% (±2.8%) for the single-temporal PALSAR-2, the multi-temporal PALSAR-2/ScanSAR, and the multi-temporal PALSAR-2/ScanSAR and NDVI and SRTM products, respectively (Table 4). For site 2 and site 3, the accuracy of FNF maps based on PALSAR-2/ScanSAR time-series images was considerably larger than those based on the PALSAR-2 single mosaic images. Using a combination of ScanSAR images and NDVI and SRTM images can also improve the accuracy of the forest mapping in site 2 and site 3. Regarding this result, it is noteworthy that we managed to improve the accuracy of the FNF classification for Vietnam using a combination of ScanSAR, NDVI, and SRTM images.

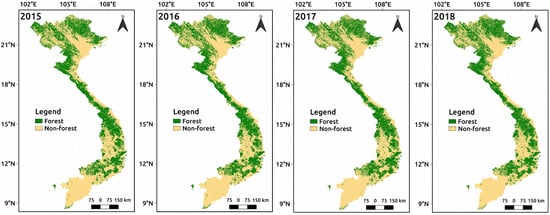
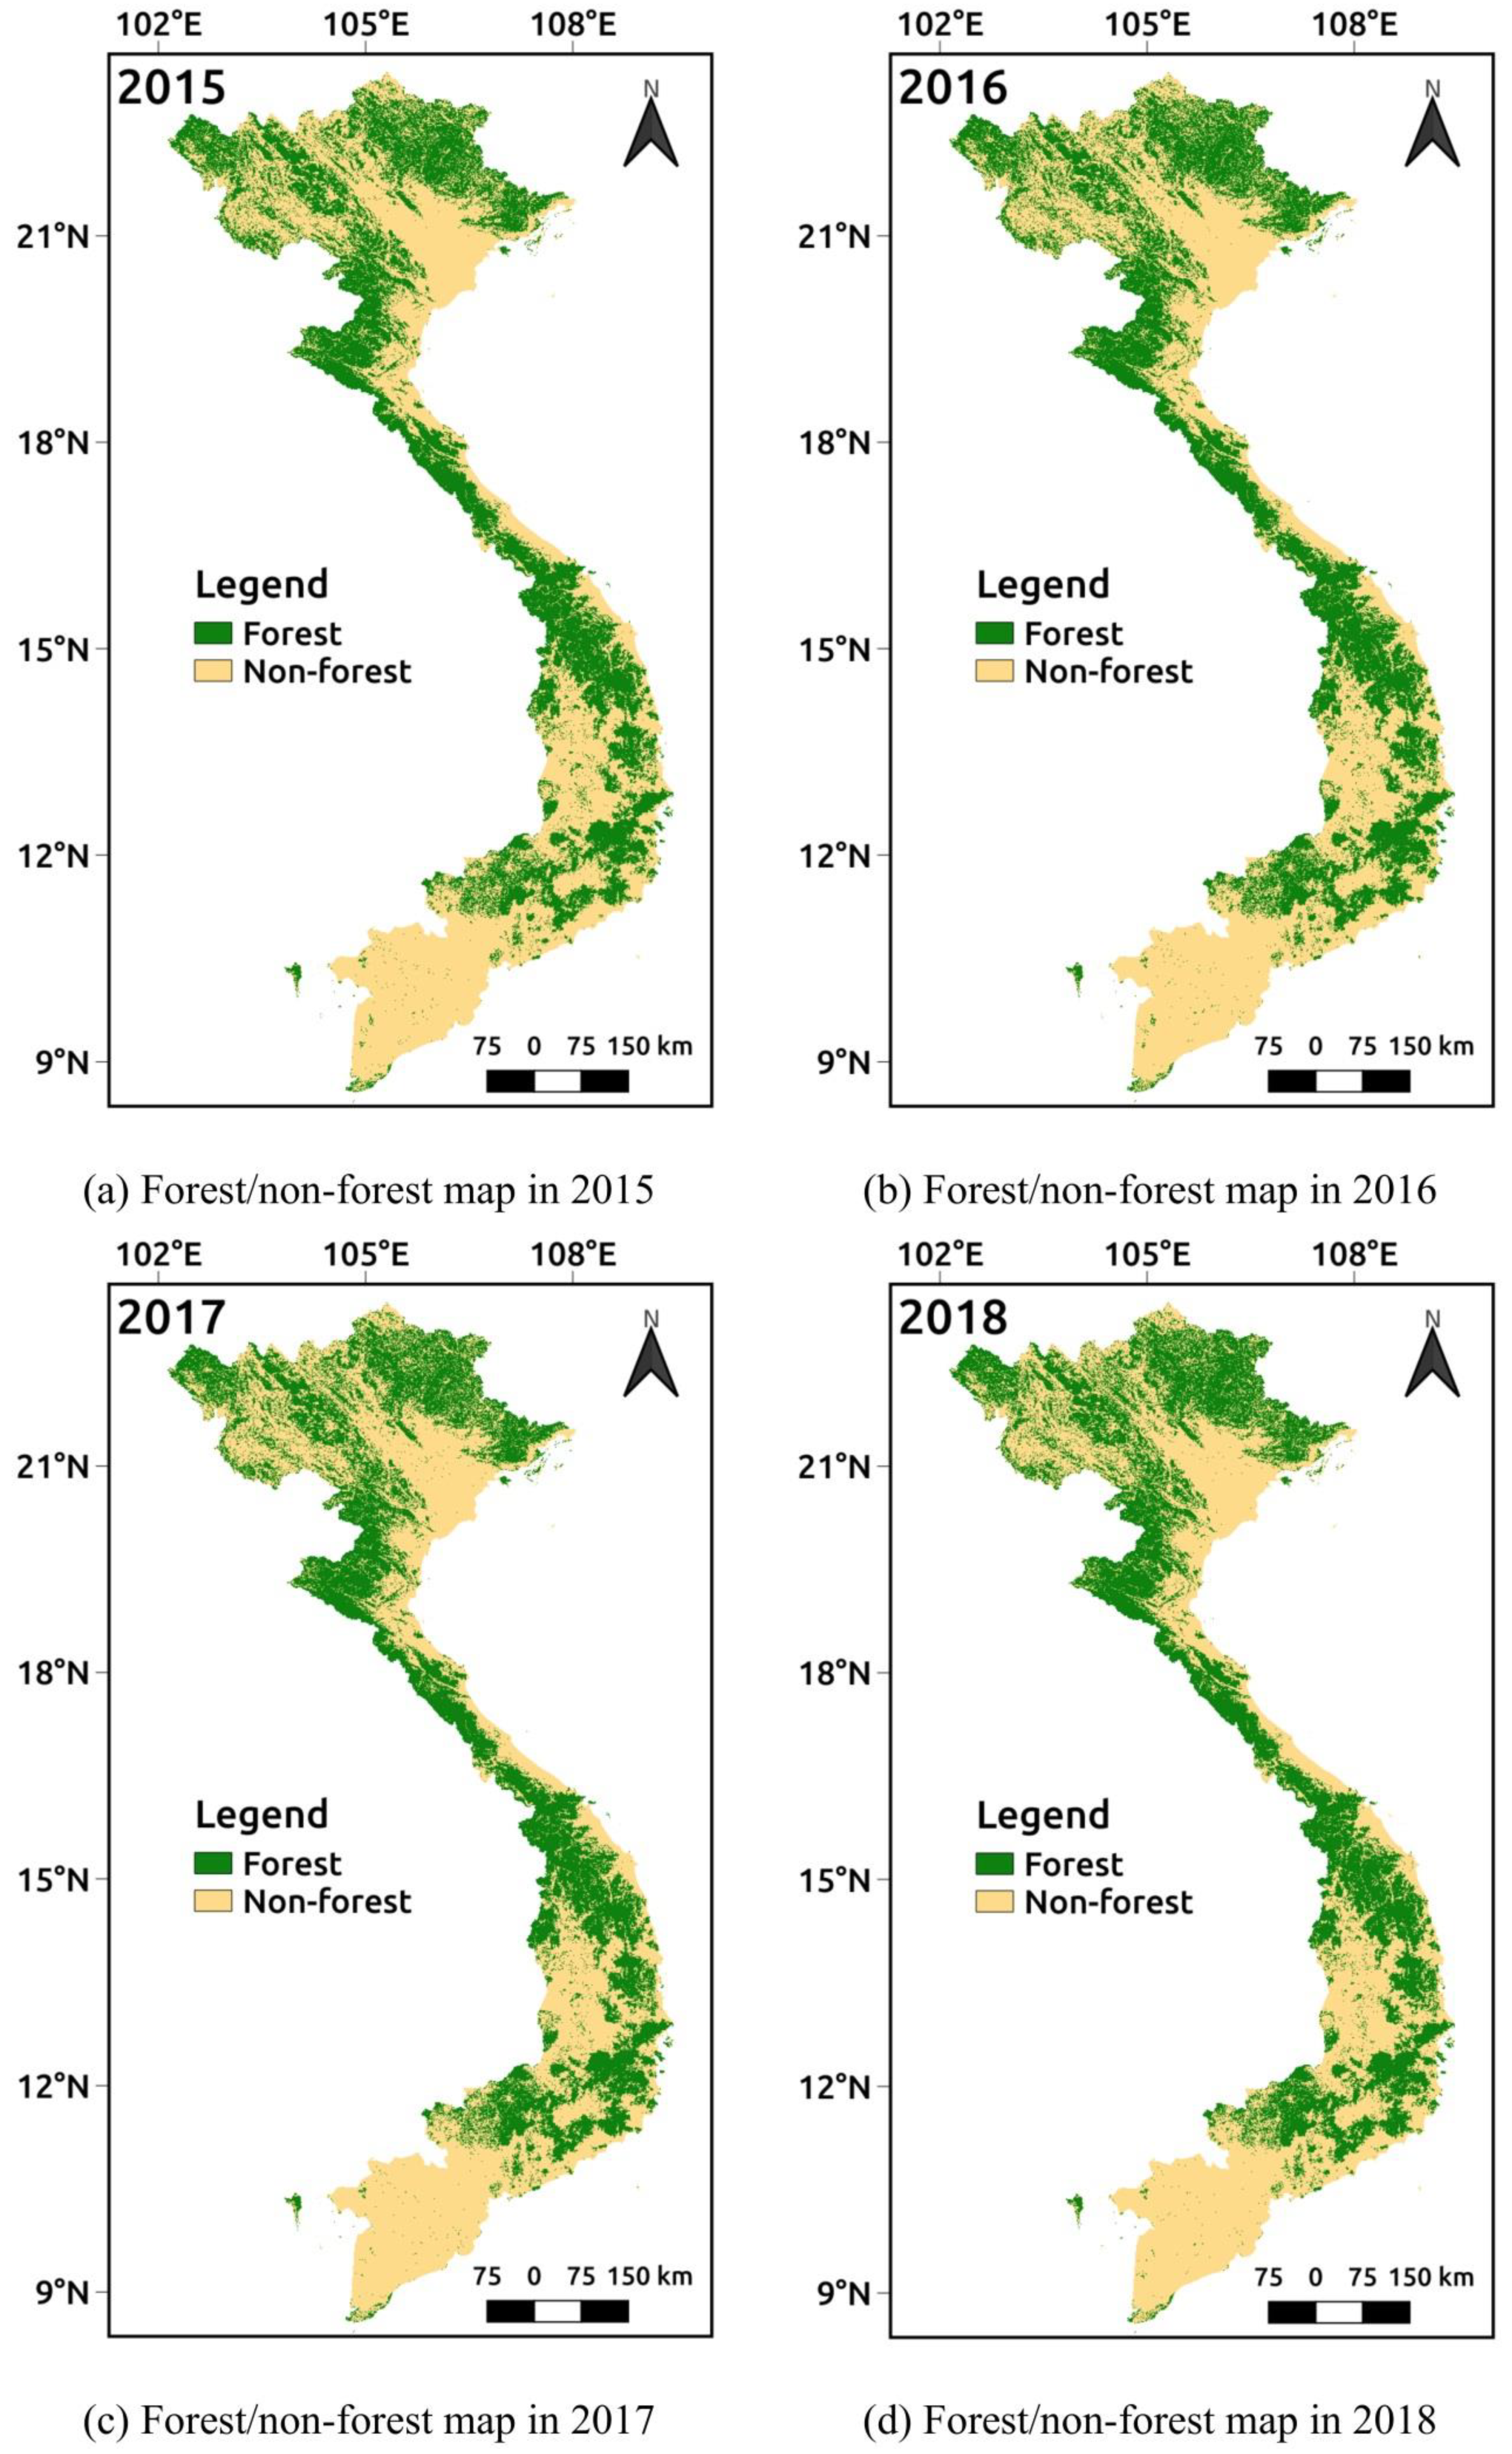
3.2. Forest/Non-Forest Maps Using ScanSAR/NDVI/SRTM

Figure 5 shows the annual FNF maps (two categories) from 2015 to 2018. The overall accuracy of the FNF maps from 2015 to 2018 are 87.9% (±1.5%), 86.0% (±1.5%), 87.0% (±1.5%), 85.5% (±1.6%), respectively. During 2015–2018, the average estimated forest area for mainland Vietnam was about 14.79 × 10⁶ ha (±1.02 × 10⁶ ha), which is equivalent to a forest cover of 43.7% (±3.0%) of the total map area. Forests are distributed unequally throughout the country. The result shown in Figure 5 suggested that forests in Vietnam were stable during 2015–2018. The result also suggested that dense forests are located in Northeastern Vietnam and in the north, west, and southeast of Central Vietnam (see Figure S6.1a–d in the Supplementary Material for full-sized (A4) FNF maps). In the Red River Delta, Central Highlands, Mekong River Delta, and coastal areas, the land is primarily used for urban, paddy fields, and other crops (Figure S6.3 in the Supplementary Material).

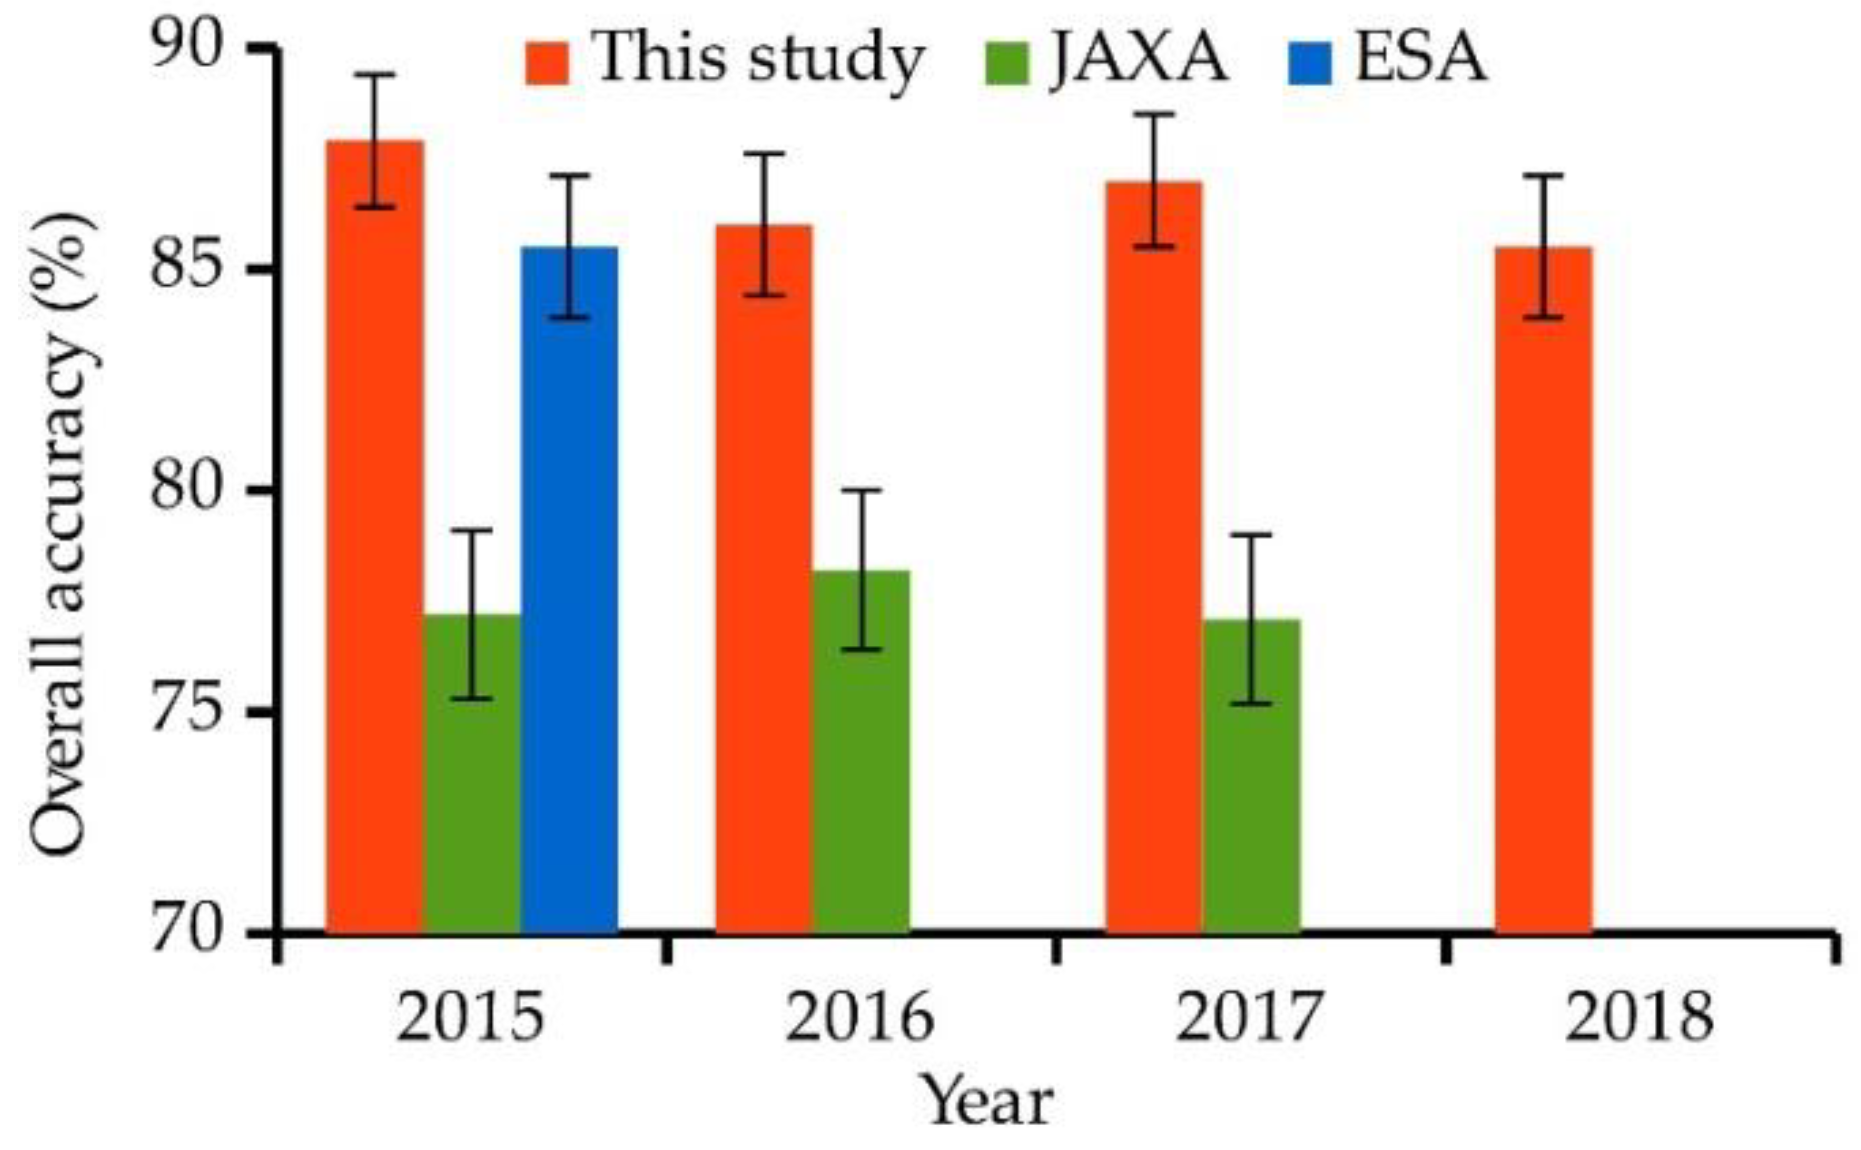
3.3. Comparison of Forest Cover Data from Multiple Sources

We compared the overall accuracy of FNF maps derived from multiple sources using the 500-point validation datasets. As shown in Figure 6, the overall accuracy of our FNF maps is considerably higher than that of the JAXA FNF maps and is slightly higher than that of the 2015 ESA FNF map. Our FNF maps had an average overall accuracy of 86.6% (±3.1%), while that of the JAXA FNF maps was 77.5% (±3.2%). The overall accuracy of the ESA FNF map (100 m spatial resolution) was 85.4% (±1.6%). We also compared our estimates of forest area with estimates from other data sources, including the national statistical data of Vietnam, the JAXA FNF maps, and the ESA FNF map. As shown in Table 5, the estimates of forest area were consistent among our FNF maps (14.79 ± 1.02 × 10⁶ ha on average), the JAXA FNF maps (14.81 ± 0.90 × 10⁶ ha on average), and the ESA map (15.06 ± 0.49 × 10⁶ ha). The estimates of the forest area of FNF products were close to the estimates of the Vietnamese national data (14.34 × 10⁶ ha on average). Generally, the estimates of the Vietnamese government were in the estimation ranges of other FNF products. The difference in forest area estimated by the government and our estimates was about 0.45 × 10⁶ ha on average (without considering the standard error). There is an interesting point that consistent estimates of forest area among FNF products can still be achieved with low overall accuracies of JAXA FNF maps. This consistent estimates suggested that stratified estimators with sufficient validation data can provide accurate area estimation for low accuracy maps.
To assess the consistency among the FNF maps in 2015, we conducted a cross comparison at a pixel level (Figure 7 and Figure 8). Our map and the ESA map showed a relatively good agreement in terms of the spatial distribution of forest, with about 77% of pixels being consistent. Our map and the JAXA map showed a lower agreement, with 68% of pixels being consistent. The JAXA map and the ESA map showed a large difference in terms of the spatial distribution of forests, with only 63% of pixels being consistent (Figure 7d). It is notable that in places where the forest fraction is small (less than 0.4, in Northwest Vietnam and the central highlands of Vietnam), the difference between FNF products is much larger than in places with larger forest cover (Figure 8 and Figure 9).

4. Discussion

4.1. Improvement of Forest Classification Using Multi-Temporal ScanSAR Images

We investigated the potential of using multi-temporal ScanSAR images to estimate annual changes in forest areas. We created FNF maps for the mainland Vietnam using only multi-temporal ScanSAR images (Figure S6.5 in the Supplementary Material) and compared them with the JAXA global FNF maps, which used single-temporal PALSAR-2 images. The average overall accuracy of the maps based on multi-temporal PALSAR-2/ScanSAR images is 84.2% (±3.3%), which is greater than that of JAXA maps (77.5% ± 3.3%). This result shows that the use of multi-temporal PALSAR-2/ScanSAR images can reduce the uncertainties in the estimation of annual changes in forest area (Figure 10). The use of single-temporal images (in the JAXA FNF maps) neglects the seasonal changes, and the resulting maps, therefore, contain uncertainties due to rapidly changing factors such as soil moisture, rain, flooding, and surface roughness (water). Figure 10a–c shows the misclassification of water-bodies and rapid changes in forest area (in the upper left corner of the images) in JAXA FNF maps from 2015 to 2017. The FNF maps based on multi-temporal PALSAR-2/ScanSAR images showed good consistency among the three years (Figure 10d–f).
Recent studies have shown that fusing single-temporal PALSAR/PALSAR-2 mosaic images and optical images can increase the accuracy of forest classification and the detection of changes in forest area [18,22,25,26,36]. In this study, we also quantified the accuracy of forest cover maps based on ScanSAR images, MODIS NDVI images, and SRTM images by comparison with the FNF maps created using only ScanSAR images. By using MODIS NDVI and SRTM, the overall accuracy of the FNF maps for 2015 reached to 87.9% (± 1.5%), compared to 83.4% (± 1.7%) that was achieved using only ScanSAR images (Table S5.1c in the Supplementary Material). The overall accuracy of FNF maps which used ScanSAR, NDVI, and SRTM images (86.6% ± 3.1% on average) is slightly higher than FNF maps which used only ScanSAR images (84.2% ± 3.3% on average). Therefore, future work is needed to investigate the potentials of fusing SAR and high-resolution optical images (Landsat and Sentinel 2) for producing high accuracy of FNF maps and detecting annual changes of forests in the national scales.

4.2. Forest Change in Vietnam between 2015 and 2018

Figure 11a presents a map of forest gain and loss between 2015 and 2018 with three categories, including “forest gain”, “forest loss”, and “no change”. The overall accuracy of the forest gain and loss map was estimated using the validation datasets of 2015 and 2018 (described in Section 2.4) and the method in Section 2.5. The overall accuracy of the map is 88.9% (±1.4%) (Table S3.1c in the Supplementary Material). Our estimates of forest area change between 2015 and 2018 showed that the area of forest gain was 1.09 ± 0.26 × 10⁶ ha, while the area of forest loss was 0.73 ± 0.22 × 10⁶ ha. According to the Vietnamese Ministry of Agriculture and Rural Development (MARD), 80% of the increase in the forest area in Vietnam was contributed by planted forests [57]. Forest gain and loss mainly occurred at the base of mountains, where the unique circular patterns of forest change are observed (Figure 11b–d). Forest cover changed unequally throughout Vietnam during the study period. Figure 11a showed that forest change occurred primarily in the north, the central coast, the southeast, and the southwest of the country. Forest change was more dramatic in the north than in the other regions, the most important factor behind this might be the huge demand for timber from China. Vietnam is one of the biggest timber exporters in Southeast Asia [58], and China is one of the world’s largest timber importers [59]. The change in forests in eastern Central Vietnam was more extreme than in western Central Vietnam. This might be due to the high mountain range with steep slopes in western Central Vietnam. It is also clear that the distribution of dense forest in central Northern Vietnam and central Western Vietnam remained stable during the study period. In Southern Vietnam, forest change mainly occurred in the southwest, which contains a large area of rubber plantation.

4.3. Forest Dynamics in Vietnam

Several recent studies have identified a transition from deforestation to reforestation in Vietnam [29,31,32], and the Vietnamese government forest data has also shown that an increase in forest cover and forest area has occurred in recent years [60,61,62,63]. This transition is the result of economic reform and policy changes in the agricultural and forestry sectors. Several reforestation programs had been launched, such as the 327 Program [64] and the 661 Program [32]. The Vietnamese government has launched the Vietnam Forestry Development Strategy 2006–2020, which aims to increase the extent and quality of forest in Vietnam [65]. According to this study, between 2015 and 2018, forest change occurred primarily in the north, central coast, southeast, and southwest regions of Vietnam (Figure 11a,b). Forest change in Vietnam has been considerably controlled by the high demand for paper and pulp production for export to China [30,66]. Therefore, the area of planted forest has increased in the vicinity of the paper production industry and in provinces near China. The area of planted forest was recorded to increase in mid-elevation areas in the northeast and the central coast regions of Vietnam, which are dominated by acacia plantations [67]. The area of the natural forest increased mainly in Northern Vietnam, where steep slopes limit cultivation [30]. It is notable that the area of natural forest decreased in the Central Highlands and Southeastern Vietnam, which contain large areas of rubber and coffee plantation [68]. Vietnamese forests have been controlled by different factors, such as economic development and changes in forest management policy [30]. Modern satellite products bring increased opportunities to determine forest dynamics under human impacts on a large scale.

4.4. The Need of Having Reliable Forest Maps for User Communities

This study revealed large differences between the accuracies of national-scale forest maps derived from different global products, namely, JAXA FNF maps and an ESA FNF map (Figure 8, Figure 9 and Figure 10). Notably, the difference is greater in areas with low forest cover (Figure 10) [19]. Several factors contribute to the uncertainties in global forest products, such as forest definition [69], methodology, and image data [18,22,35,70]. In the case of Vietnam, high-resolution and highly accurate maps will be crucial in the next few years. Since Vietnam has become the first country in the Asia-Pacific region to fulfill the Warsaw Framework for REDD+, the country is allowed to receive REDD+ results-based payments [71]. The future development of highly reliable and detailed forest maps can support the National Forest Inventory Monitoring and Assessment Program and could considerably facilitate the implementation of REDD+ in Vietnam. As JAXA now provides ScanSAR data for Vietnam via the Vietnam Space Center (VNSC), PALSAR-2/ScanSAR time-series images and auxiliary data are possible sources for the production of forest map of Vietnam [72]. The VNSC is currently managing the Vietnam Open Data Cube [73], which allows users to access a satellite database including ALOS, ALOS-2, SENTINEL, MODIS TERRA, and GPM (Global Precipitation Measurement) data. Future studies of forest mapping should take advantage of this database in order to classify detailed forest types (natural forest and planted forest) using a multiple image approach. The Vietnamese forestry industry focuses on acacia, pine (in the north), and rubber (in the south). Annual changes in the national distribution of these key species are crucial for Vietnamese forestry and forest management. The availability of data such as ScanSAR images offers the chance to map these key plantation species with great accuracy and reliability.

5. Conclusions

In this study, we showed that using multi-temporal PALSAR-2/ScanSAR images can create greater accuracies of FNF maps than using single-temporal PALSAR-2 mosaic images in the national scale. FNF maps produced using multi-temporal ScanSAR images were considerably more accurate than current JAXA FNF maps for the mainland Vietnam. The use of multi-temporal images can reduce the uncertainties in the detection of forest change compared with the use of single-temporal images. By using a combination of SAR and optical images, the accuracy of FNF maps could be improved. The annual FNF maps for 2015–2018 that were produced using this new approach led to an estimation of forest cover which is close to the Vietnamese national statistics, with the difference of 0.45 × 10⁶ ha on average. We also showed that stratified estimators with sufficient validation data could produce accurate area estimation for low accuracy FNF maps. By comparing multiple products, this study identified discrepancies between global forest-cover products, especially for areas with low forest cover. Therefore, users should consider the uncertainties of global forest maps on a national scale. We also highlighted the need for reliable forest maps for the mainland Vietnam to meet the future requirements of the forestry industry and sustainable forest management. The limitation of this study is that we have not considered the effects of interpreter errors to the estimates of the map’s accuracies, forest area, and their standard errors. Therefore, future studies should also consider interpreter errors in the sampling design processes.

Supplementary Materials

The following are available online at https://www.mdpi.com/2072-4292/11/20/2412/s1; supplementary material including error matrices for all classification results, land cover maps, and forest/non-forest maps for Vietnam from 2015 to 2018. The reader can also download land cover maps of mainland Vietnam from 2015 to 2018 on the JAXA website (https://www.eorc.jaxa.jp/ALOS/en/lulc/lulc_index.htm).

Author Contributions

V.T.T. and K.N.N. conceived the idea for this study. V.T.T., T.T.H., and K.N.N. conducted field surveys. V.T.T. and T.T.H. collected reference data by visual interpretation. V.T.T. analyzed data, performed the classification, and drafted the paper. D.P.C., T.T.H., M.H., T.T., and K.N.N. gave comments and corrected this manuscript. The paper was finalized by V.T.T. and K.N.N.

Funding

This research was conducted under the scholarship of the Project for Human Resource Development Scholarship (JDS) from Japanese Grant Aid. This paper is supported under the Ecosystem Group of Earth Observation Research center (EORC).

Acknowledgments

We wish to thank JAXA for providing PALSAR-2/ScanSAR images, and FNF maps of mainland Vietnam under the research agreement of “Generation of the Precise Land Cover Map”. The authors wish to thank the USGS and NASA for providing MODIS NDVI and SRTM images. Finally, we wish to acknowledge the anonymous reviewers that helped to validate and improve the manuscript.

Conflicts of Interest

The authors declare no conflicts of interest.

References

  1. Pimm, S.L.; Joppa, L.N. How Many Plant Species are There, Where are They, and at What Rate are They Going Extinct? Ann. Mo. Bot. Gard. 2015, 100, 170–176. [Google Scholar] [CrossRef]
  2. Corlett, R.T. Plant diversity in a changing world: Status, trends, and conservation needs. Plant Divers. 2016, 38, 10–16. [Google Scholar] [CrossRef] [PubMed] [Green Version]
  3. Pearson, T.R.H.; Brown, S.; Murray, L.; Sidman, G. Greenhouse gas emissions from tropical forest degradation: An underestimated source. Carbon Balance Manag. 2017, 12, 3. [Google Scholar] [CrossRef] [PubMed]
  4. Chao, S.; Griffiths, T.; Colchester, M.; Yong, C.; Kidd, C. Forest Peoples Numbers Across the World; Forest Peoples Programme: Moreton-in-Marsh, UK, 2012; Available online: http://www.forestpeoples.org/sites/fpp/files/publication/2012/05/forest-peoples-numbers-across-world-final_0.pdf (accessed on 14 June 2019).
  5. Hansen, M.C.; Potapov, P.V.; Moore, R.; Hancher, M.; Turubanova, S.A.; Tyukavina, A.; Thau, D.; Stehman, S.V.; Goetz, S.J.; Loveland, T.R.; et al. High-Resolution Global Maps of 21st-Century Forest Cover Change. Science 2013, 342, 850–853. [Google Scholar] [CrossRef] [PubMed] [Green Version]
  6. Food Agriculture Organization. The State of the World’s Forests 2018—Forest Pathways to Sustainable Development; FAO: Rome, Italy, 2018; Available online: http://www.fao.org/3/I9535EN/i9535en.pdf (accessed on 14 June 2019).
  7. Bartholomé, E.; Belward, A.S. GLC2000: A new approach to global land cover mapping from Earth observation data. Int. J. Remote Sens. 2005, 26, 1959–1977. [Google Scholar] [CrossRef]
  8. Friedl, M.A.; McIver, D.K.; Hodges, J.C.; Zhang, X.Y.; Muchoney, D.; Strahler, A.H.; Woodcock, C.E.; Gopal, S.; Schneider, A.; Cooper, A.; et al. Global land cover mapping from MODIS: Algorithms and early results. Remote Sens. Environ. 2002, 83, 287–302. [Google Scholar] [CrossRef]
  9. Bicheron, P.; Amberg, V.; Bourg, L.; Petit, D.; Huc, M.; Miras, B.; Brockmann, C.; Hagolle, O.; Delwart, S.; Ranera, F.; et al. Geolocation Assessment of MERIS GlobCover Orthorectified Products. IEEE Trans. Geosci. Remote Sens. 2011, 49, 2972–2982. [Google Scholar] [CrossRef]
  10. Gong, P.; Wang, J.; Yu, L.; Zhao, Y.; Zhao, Y.; Liang, L.; Niu, Z.; Huang, X.; Fu, H.; Liu, S.; et al. Finer resolution observation and monitoring of global land cover: First mapping results with Landsat TM and ETM+ data. Int. J. Remote Sens. 2013, 34, 2607–2654. [Google Scholar] [CrossRef]
  11. DiMiceli, C.; Carroll, M.; Sohlberg, R.; Huang, M.C.; Hansen, M.; Townsend, J.R.G. Annual Global Automated MODIS Vegetation Continuous Fields (MOD44B) at 250 m Spatial Resolution for Data Years Beginning Day 65, 2000–2010; Collection 5, Version 1; University Maryland: College Park, MD, USA, 2001. [Google Scholar]
  12. Sexton, J.O.; Song, X.-P.; Feng, M.; Noojipady, P.; Anand, A.; Huang, C.; Kim, D.-H.; Collins, K.M.; Channan, S.; DiMiceli, C.; et al. Global, 30-m resolution continuous fields of tree cover: Landsat-based rescaling of MODIS vegetation continuous fields with lidar-based estimates of error. Int. J. Digit. Earth 2013, 6, 427–448. [Google Scholar] [CrossRef] [Green Version]
  13. Shimada, M.; Itoh, T.; Motooka, T.; Watanabe, M.; Shiraishi, T.; Thapa, R.; Lucas, R. New global forest/non-forest maps from ALOS PALSAR data (2007–2010). Remote Sens. Environ. 2014, 155, 13–31. [Google Scholar] [CrossRef]
  14. Sannier, C.; McRoberts, R.E.; Fichet, L.V. Suitability of Global Forest Change data to report forest cover estimates at national level in Gabon. Remote Sens. Environ. 2016, 173, 326–338. [Google Scholar] [CrossRef]
  15. Bos, A.B.; De Sy, V.; Duchelle, A.E.; Herold, M.; Martius, C.; Tsendbazar, N.-E. Global data and tools for local forest cover loss and REDD+ performance assessment: Accuracy, uncertainty, complementarity and impact. Int. J. Appl. Earth Obs. Geoinf. 2019. [Google Scholar] [CrossRef]
  16. Fritz, S.; See, L.; McCallum, I.; Schill, C.; Obersteiner, M.; van der Velde, M.; Boettcher, H.; Havlík, P.; Achard, F. Highlighting continued uncertainty in global land cover maps for the user community. Environ. Res. Lett. 2011, 6, 044005. [Google Scholar] [CrossRef]
  17. Keenan, R.J.; Reams, G.A.; Achard, F.; de Freitas, J.V.; Grainger, A.; Lindquist, E. Dynamics of global forest area: Results from the FAO Global Forest Resources Assessment 2015. For. Ecol. Manag. 2015, 352, 9–20. [Google Scholar] [CrossRef]
  18. Qin, Y.; Xiao, X.; Dong, J.; Zhang, G.; Roy, P.S.; Joshi, P.K.; Gilani, H.; Murthy, M.S.R.; Jin, C.; Wang, J.; et al. Mapping forests in monsoon Asia with ALOS PALSAR 50-m mosaic images and MODIS imagery in 2010. Sci. Rep. 2016, 6, 20880. [Google Scholar] [CrossRef]
  19. Qin, Y.; Xiao, X.; Dong, J.; Zhou, Y.; Wang, J.; Doughty, R.B.; Chen, Y.; Zou, Z.; Moore, B. Annual dynamics of forest areas in South America during 2007–2010 at 50-m spatial resolution. Remote Sens. Environ. 2017, 201, 73–87. [Google Scholar] [CrossRef]
  20. Reiche, J.; Verbesselt, J.; Hoekman, D.; Herold, M. Fusing Landsat and SAR time series to detect deforestation in the tropics. Remote Sens. Environ. 2015, 156, 276–293. [Google Scholar] [CrossRef]
  21. Espírito-Santo, F.D.B.; Keller, M.; Braswell, B.; Nelson, B.W.; Frolking, S.; Vicente, G. Storm intensity and old-growth forest disturbances in the Amazon region. Geophys. Res. Lett. 2010, 37. [Google Scholar] [CrossRef] [Green Version]
  22. Qin, Y.; Xiao, X.; Dong, J.; Zhang, G.; Shimada, M.; Liu, J.; Li, C.; Kou, W.; Moore, B. Forest cover maps of China in 2010 from multiple approaches and data sources: PALSAR, Landsat, MODIS, FRA, and NFI. ISPRS J. Photogramm. Remote Sens. 2015, 109, 1–16. [Google Scholar] [CrossRef] [Green Version]
  23. Pham, T.D.; Yoshino, K.; Le, N.N.; Bui, D.T. Estimating aboveground biomass of a mangrove plantation on the Northern coast of Vietnam using machine learning techniques with an integration of ALOS-2 PALSAR-2 and Sentinel-2A data. Int. J. Remote Sens. 2018, 39, 7761–7788. [Google Scholar] [CrossRef]
  24. Vafaei, S.; Soosani, J.; Adeli, K.; Fadaei, H.; Naghavi, H.; Pham, T.; Tien Bui, D. Improving Accuracy Estimation of Forest Aboveground Biomass Based on Incorporation of ALOS-2 PALSAR-2 and Sentinel-2A Imagery and Machine Learning: A Case Study of the Hyrcanian Forest Area (Iran). Remote Sens. 2018, 10, 172. [Google Scholar] [CrossRef]
  25. Qin, Y.; Xiao, X.; Wang, J.; Dong, J.; Ewing, K.; Hoagland, B.; Hough, D.; Fagin, T.; Zou, Z.; Geissler, G.; et al. Mapping Annual Forest Cover in Sub-Humid and Semi-Arid Regions through Analysis of Landsat and PALSAR Imagery. Remote Sens. 2016, 8, 933. [Google Scholar] [CrossRef]
  26. Zhang, Y.; Ling, F.; Foody, G.M.; Ge, Y.; Boyd, D.S.; Li, X.; Du, Y.; Atkinson, P.M. Mapping annual forest cover by fusing PALSAR/PALSAR-2 and MODIS NDVI during 2007–2016. Remote Sens. Environ. 2019, 224, 74–91. [Google Scholar] [CrossRef]
  27. Joshi, N.; Baumann, M.; Ehammer, A.; Fensholt, R.; Grogan, K.; Hostert, P.; Jepsen, M.; Kuemmerle, T.; Meyfroidt, P.; Mitchard, E.; et al. A Review of the Application of Optical and Radar Remote Sensing Data Fusion to Land Use Mapping and Monitoring. Remote Sens. 2016, 8, 70. [Google Scholar] [CrossRef]
  28. Dong, J.; Xiao, X.; Sheldon, S.; Biradar, C.; Duong, N.D.; Hazarika, M. A comparison of forest cover maps in Mainland Southeast Asia from multiple sources: PALSAR, MERIS, MODIS and FRA. Remote Sens. Environ. 2012, 127, 60–73. [Google Scholar] [CrossRef]
  29. Meyfroidt, P.; Lambin, E.F. Forest transition in Vietnam and its environmental impacts. Glob. Chang. Biol. 2008, 14, 1319–1336. [Google Scholar] [CrossRef]
  30. Cochard, R.; Ngo, D.T.; Waeber, P.O.; Kull, C.A. Extent and causes of forest cover changes in Vietnam’s provinces 1993–2013: A review and analysis of official data. Environ. Rev. 2017, 25, 199–217. [Google Scholar] [CrossRef]
  31. Meyfroidt, P.; Lambin, E.F. The causes of the reforestation in Vietnam. Land use policy 2008, 25, 182–197. [Google Scholar] [CrossRef]
  32. McElwee, P. Reforesting “Bare Hills” in Vietnam: Social and Environmental Consequences of the 5 Million Hectare Reforestation Program. AMBIO A J. Hum. Environ. 2009, 38, 325–333. [Google Scholar] [CrossRef]
  33. EORC-JAXA. ALOS-2 Project/PALSAR-2. Available online: https://www.eorc.jaxa.jp/ALOS-2/en/about/palsar2.htm (accessed on 20 June 2019).
  34. ESA. ESA’s Software Download Website. Available online: http://step.esa.int/main/download/snap-download/previous-versions/ (accessed on 10 April 2019).
  35. Dong, J.; Xiao, X.; Sheldon, S.; Biradar, C.; Xie, G. Mapping tropical forests and rubber plantations in complex landscapes by integrating PALSAR and MODIS imagery. ISPRS J. Photogramm. Remote Sens. 2012, 74, 20–33. [Google Scholar] [CrossRef]
  36. Shimada, M.; Isoguchi, O.; Tadono, T.; Isono, K. PALSAR Radiometric and Geometric Calibration. IEEE Trans. Geosci. Remote Sens. 2009, 47, 3915–3932. [Google Scholar] [CrossRef]
  37. EORC-JAXA. Global PALSAR-2/PALSAR/JERS-1 Mosaic and Forest/Non-Forest Map. Available online: https://www.eorc.jaxa.jp/ALOS/en/palsar_fnf/fnf_index.htm (accessed on 4 April 2019).
  38. Liu, M.; Cao, C.; Dang, Y.; Ni, X. Mapping Forest Canopy Height in Mountainous Areas Using ZiYuan-3 Stereo Images and Landsat Data. Forests 2019, 10, 105. [Google Scholar] [CrossRef]
  39. Sesnie, S.E.; Hagell, S.E.; Otterstrom, S.M.; Chambers, C.L.; Dickson, B.G. SRTM-DEM and Landsat ETM + data for mapping tropical dry forest cover and biodiversity assessment in Nicaragua. Rev. Geogr. Acad. 2008, 2, 53–65. [Google Scholar]
  40. Sadeghi, Y.; St-Onge, B.; Leblon, B.; Prieur, J.-F.; Simard, M. Mapping boreal forest biomass from a SRTM and TanDEM-X based on canopy height model and Landsat spectral indices. Int. J. Appl. Earth Obs. Geoinf. 2018, 68, 202–213. [Google Scholar] [CrossRef]
  41. Hashimoto, S.; Tadono, T.; Onosato, M.; Hori, M. Land use and land cover inference in large areas using multi-temporal optical satellite images. In Proceedings of the 2013 IEEE International Geoscience and Remote Sensing Symposium—IGARSS, Melbourne, VIC, Australia, 21–26 July 2013; pp. 3333–3336. [Google Scholar]
  42. Reiche, J.; de Bruin, S.; Hoekman, D.; Verbesselt, J.; Herold, M. A Bayesian Approach to Combine Landsat and ALOS PALSAR Time Series for Near Real-Time Deforestation Detection. Remote Sens. 2015, 7, 4973–4996. [Google Scholar] [CrossRef] [Green Version]
  43. Katagi, J.; Nasahara, K.N.; Kobayashi, K.; Dotsu, M.; Tadono, T. Reduction of misclassification caused by mountain shadow in a high resolution land use and land cover map using multi-temporal optical images. J. Remote Sens. Soc. Jpn. 2018, 38, 30–34. [Google Scholar]
  44. HASHIMOTO, S.; TADONO, T.; ONOSATO, M.; HORI, M.; SHIOMI, K. A New Method to Derive Precise Land-use and Land-cover Maps Using Multi-temporal Optical Data. J. Remote Sens. Jpn. 2014, 34, 102–112. [Google Scholar]
  45. Hoang, T.T.; Nasahara, K.N.; Katagi, J. Analysis of Land Cover Change in Northern Vietnam Using High Resulution Remote Sensing Data; Tien Bui, D., Ngoc Do, A., Bui, H.-B., Hoang, N.-D., Eds.; Springer International Publishing: Cham, Switzerland, 2018; Volume 1, ISBN 978-3-319-68239-6. [Google Scholar]
  46. Duong, P.; Trung, T.; Nasahara, K.; Tadono, T. JAXA High-Resolution Land Use/Land Cover Map for Central Vietnam in 2007 and 2017. Remote Sens. 2018, 10, 1406. [Google Scholar] [CrossRef]
  47. EORC-JAXA. Homepage of High-Resolution Land Use and Land Cover Map Products. Available online: https://www.eorc.jaxa.jp/ALOS/en/lulc/lulc_index.htm (accessed on 7 June 2019).
  48. Di Gregorio, A.; Jansen, L.J.M. Land Cover Classification System (LCCS): Classification Concepts and User Manual; Environment and Natural Resources Service (SDRN), GCP/RAF/287/ITA Africover—East Africa Project, Soil Resources, Management and Conservation Service (AGLS); Food and Agriculture Organization of the United Nations: Rome, Italy, 1998; pp. 1–157. [Google Scholar]
  49. Olofsson, P.; Foody, G.M.; Herold, M.; Stehman, S.V.; Woodcock, C.E.; Wulder, M.A. Good practices for estimating area and assessing accuracy of land change. Remote Sens. Environ. 2014, 148, 42–57. [Google Scholar] [CrossRef]
  50. Pousse, B. Short communication: An interpretation of the Linux entropy estimator. IACR Cryptol. ePrint Arch. 2012, 2012, 487. [Google Scholar]
  51. Gutterman, Z.; Pinkas, B.; Reinman, T. Analysis of the Linux random number generator. In Proceedings of the 2006 IEEE Symposium on Security and Privacy (S&P’06), Berkeley/Oakland, CA, USA, 21–24 May 2006; pp. 15–385. [Google Scholar]
  52. McRoberts, R.E.; Stehman, S.V.; Liknes, G.C.; Næsset, E.; Sannier, C.; Walters, B.F. The effects of imperfect reference data on remote sensing-assisted estimators of land cover class proportions. ISPRS J. Photogramm. Remote Sens. 2018, 142, 292–300. [Google Scholar] [CrossRef]
  53. Cochran, W.G. Sampling Techniques, 3rd ed.; Wiley: New York, NY, USA, 1977. [Google Scholar]
  54. Olofsson, P.; Foody, G.M.; Stehman, S.V.; Woodcock, C.E. Making better use of accuracy data in land change studies: Estimating accuracy and area and quantifying uncertainty using stratified estimation. Remote Sens. Environ. 2013, 129, 122–131. [Google Scholar] [CrossRef]
  55. ESA. Global Land Cover. Available online: https://lcviewer.vito.be/ (accessed on 20 April 2019).
  56. Herold, M.; Mayaux, P.; Woodcock, C.E.; Baccini, A.; Schmullius, C. Some challenges in global land cover mapping: An assessment of agreement and accuracy in existing 1 km datasets. Remote Sens. Environ. 2008, 112, 2538–2556. [Google Scholar] [CrossRef]
  57. General Statistics Office of Vietnam (GSO). Statistical Summary Book of Vietnam; GSO: Ha Noi, Vietnam, 2018. Available online: https://www.gso.gov.vn/default_en.aspx?tabid=515&idmid=5&ItemID=19294 (accessed on 15 May 2019).
  58. Cao, X.; Yang, S.; Huang, X.; Tong, J. Dynamic Decomposition of Factors Influencing the Export Growth of China’s Wood Forest Products. Sustainability 2018, 10, 2780. [Google Scholar] [CrossRef]
  59. Phan, T.T.H. Identifying illicit timber trade between Vietnam and China. World Cust. J. 2017, 11, 13–22. [Google Scholar]
  60. Ministry of Agriculture and Rural Development (MARD). Annual Decisions by the Minister of Ministry of Agriculture and Rural Development on Annual Forest Cover in Vietnam in 2018; MARD: Ha Noi, Vietnam, 2019. Available online: http://tongcuclamnghiep.gov.vn/LamNghiep/Index/quyet-dinh-so-911qd-bnn-tcln-ngay-19032019-cua-bo-nong-nghiep-va-phat-trien-nong-thon-cong-bo-hien-trang-rung-toan-quoc-nam-2018-3959 (accessed on 20 June 2019).
  61. Ministry of Agriculture and Rural Development (MARD). Annual Decisions by the Minister of Ministry of Agriculture and Rural Development on Annual Forest Cover in Vietnam in 2015; MARD: Ha Noi, Vietnam, 2016. Available online: http://tongcuclamnghiep.gov.vn/LamNghiep/Index/cong-bo-hien-trang-rung-nam-2015-quyet-dinh-so-3158qd-bnn-tcln-ngay-2772016-3094 (accessed on 20 June 2019).
  62. Ministry of Agriculture and Rural Development (MARD). Annual Decisions by the Minister of Ministry of Agriculture and Rural Development on Annual Forest Cover in Vietnam in 2017; MARD: Ha Noi, Vietnam, 2018. Available online: http://tongcuclamnghiep.gov.vn/LamNghiep/Index/cong-bo-hien-trang-rung-toan-quoc-nam-2017-van-ban-so-1187qd-bnn-tcln-ngay-0342018-3671 (accessed on 12 May 2019).
  63. Ministry of Agriculture and Rural Development (MARD). Annual Decisions by the Minister of Ministry of Agriculture and Rural Development on Annual Forest Cover in Vietnam in 2016; MARD: Ha Noi, Vietnam, 2017. Available online: https://www.mard.gov.vn/Lists/bonongnghiep_News/Attachments/48115/1819-QD-BNN-TCLN.pdf (accessed on 12 May 2019).
  64. Sikor, T. Decree 327 and the Restoration of Barren Land in the Vietnamese Highlands. In Defining Highland Development Challenges in Vietnam; East-West Center: Honolulu, HI, USA, 1995; pp. 143–156. [Google Scholar]
  65. Socialist Republic of Vietnam (SRV). Vietnam Forestry Development Strategy 2006–2020; Office of the Prime Minister, SRV: Hanoi, HI, USA, 2007; Available online: http://theredddesk.org/sites/default/files/viet_nam_forestry_development_strategy_2.pdf (accessed on 20 May 2019).
  66. Barney, K. Central Plans and Global Exports: Tracking Vietnam’s Forestry Commodity Chains and Export Links to China; Forest Trends: Washington, DC, USA, 2005. [Google Scholar]
  67. Hung, T.T.; Almeida, A.C.; Eyles, A.; Mohammed, C. Predicting productivity of Acacia hybrid plantations for a range of climates and soils in Vietnam. For. Ecol. Manag. 2016, 367, 97–111. [Google Scholar] [CrossRef]
  68. Nguyen, B.T.; Dang, M.K. Temperature dependence of natural rubber productivity in the southeastern Vietnam. Ind. Crops Prod. 2016, 83, 24–30. [Google Scholar] [CrossRef]
  69. Sexton, J.O.; Noojipady, P.; Song, X.-P.; Feng, M.; Song, D.-X.; Kim, D.-H.; Anand, A.; Huang, C.; Channan, S.; Pimm, S.L.; et al. Conservation policy and the measurement of forests. Nat. Clim. Chang. 2016, 6, 192–196. [Google Scholar] [CrossRef]
  70. Tchuenté, A.T.K.; Roujean, J.L.; de Jong, S.M. Comparison and relative quality assessment of the GLC2000, GLOBCOVER, MODIS and ECOCLIMAP land cover data sets at the African continental scale. Int. J. Appl. Earth Obs. Geoinf. 2011, 13, 207–219. [Google Scholar] [CrossRef]
  71. Charlotte, H. Vietnam Becomes the First Country in Asia-Pacific to Fulfill the Warsaw Framework for REDD+. Available online: https://www.un-redd.org/single-post/2019/02/25/Viet-Nam-submits-its-first-summary-of-information-on-safeguards-to-the-UNFCCC-and-releases-one-of-the-world%E2%80%99s-first-fully-operational-online-safeguards-information-systems-SIS (accessed on 7 July 2019).
  72. Steventon, M.; Ward, S.; Dyke, G.; Smith, L.; Sobue, S.; Oyoshi, K. Asia-Rice 2018 Implementation Report; JAXA: Tokyo, Japan, 2019; Available online: http://asia-rice.org/files/Asia-RiCE_2018_Implementation_Report_1-3-2019.pdf (accessed on 10 July 2019).
  73. VNSC. Vietnam Open Data Cube. Available online: http://datacube.vn/ (accessed on 15 July 2019).
Figure 1. Examples of the input data used to create forest/non-forest (FNF) maps. (a) False-color composite of ScanSAR images for mainland Vietnam (dates: Jun. 19, 2017 and Nov. 20, 2017): red: HH polarization, green: HV polarization, blue: difference of HH and HV polarizations. (b) MODIS NDVI image for mainland Vietnam (date: Nov. 20, 2017). (c) Slope (in degree) images of mainland Vietnam estimated using SRTM-DEM images (date: Feb. 11, 2000).
Remotesensing 11 02412 g001
Figure 2. The work-flow used to produce FNF maps for mainland Vietnam using multi-temporal PALSAR-2/ScanSAR, multi-temporal MODIS NDVI, and SRTM images.
Remotesensing 11 02412 g002
Figure 3. Distribution of reference data. (a) Distribution of training data. (b) Distribution of the 500 validation sample points for the mainland Vietnam based on the 2017 FNF map. (ce) Distribution of the 400 validation sample points based on the 2017 ScanSAR/NDVI/SRTM FNF map at three test sites.
Remotesensing 11 02412 g003
Figure 4. Classification result of FNF maps for three test sites in Vietnam using: (a) Location of the test sites in mainland Vietnam, (b) single-temporal PALSAR-2 mosaic images, (c) multi-temporal PALSAR-2/ScanSAR images, and (d) a combination of multi-temporal PALSAR-2/ScanSAR, MODIS NDVI, and SRTM-slope images.
Remotesensing 11 02412 g004
Figure 5. Classification result for FNF maps for mainland Vietnam from 2015 to 2018. (a) Forest/non-forest map in 2015, (b) Forest/non-forest map in 2016, (c) Forest/non-forest map in 2017, (d) Forest/non-forest map in 2018.
Remotesensing 11 02412 g005
Figure 6. Comparison of the overall accuracy of FNF maps from a different data source (Error bars are standard errors).
Remotesensing 11 02412 g006
Figure 7. Comparison of the forest fraction of different forest cover maps for 2015 with a spatial resolution of 1 km. (a) difference in forest fraction between this study and JAXA FNF maps, (b) difference in forest fraction between this study and ESA FNF maps, (c) difference in forest fraction between JAXA and ESA FNF maps, (d) The histogram of (a), (b), and (c) showed the agreement among the FNF maps (the vertical axis showed the percentage of number of pixels, the horizontal axis showed the range of difference in forest fraction. Pixels having forest fraction difference in the range from −0.2 to 0.2 were considered being consistent on forest fraction.
Remotesensing 11 02412 g007
Figure 8. Forest fraction maps for 2015 with a spatial resolution of 1 km. (a) forest fraction estimated from the FNF map of this study, (b) forest fraction estimated from the FNF map of JAXA, (c) forest fraction estimated from the FNF map of ESA.
Remotesensing 11 02412 g008
Figure 9. Forest fraction maps with a spatial resolution of 1 km for the three test sites.
Remotesensing 11 02412 g009
Figure 10. Comparison of FNF maps obtained using single-temporal PALSAR-2 images (ac) and multi-temporal PALSAR-2/ScanSAR images (df).
Remotesensing 11 02412 g010
Figure 11. Forest gain and loss map in between 2015 and 2018: (a) the forest gain and loss map for mainland Vietnam, (bd) Zoomed-in windows of the forest gain and loss map in site 1, site 2, and site 3, respectively.
Remotesensing 11 02412 g011
Table 1. An error matrix of sample counts for a 2-category FNF map (forest category = 1, non-forest category = 2) based on reference data coming from the forest stratum of 2017 FNF map.
Predicted Category (i = 1, 2)Actual Category (j = 1, 2)Total
12
1n11(f)n12(f)n1·(f)
2n21(f)n21(f)n2·(f)
Totaln1·(f)n2·(f)
Table 2. An error matrix of sample counts for a 2-category FNF map (forest category = 1, non-forest category = 2) based on reference data coming from the non-forest stratum of 2017 FNF map.
Predicted Category (i = 1, 2)Actual Category (j = 1, 2)Total
12
1n11(nf)n12(nf)n1·(nf)
2n21(nf)n21(nf)n2·(nf)
Totaln1·(nf)n2·(nf)
Table 3. Error matrix of estimated area proportion using Equation (10).
Predicted Category (i = 1, 2)Actual Category (j = 1, 2)TotalUser’s Accuracy
12
1p11p12p1·p11/p1·
2p21p22p2·p22/p2·
Totalp·1p·21
Producer’s accuracyp11/p·1p22/p·2 OA = p11 + p22
Table 4. Accuracy assessment for FNF maps of the test sites (Errors are standard errors estimated based on Equation (11)).
SiteTraining (Points)Validation (Points)Overall Accuracy (%)
Single-Temporal PALSAR-2Multi-Temporal PALSAR-2/ScanSARPALSAR-2/ScanSAR + NDVI + SRTM
Site 1397440077.8 ± 2.181.2 ± 2.082.6 ± 1.9
Site 2378940079.8 ± 2.289.4 ± 1.693.4 ± 1.3
Site 3319540074.5 ± 2.286.6 ± 1.789.3 ± 1.6
Average77.4 ± 3.685.7 ± 3.188.4 ± 2.8
Table 5. Comparison of estimates of forest area based on data from different sources. The numbers were rounded to two digits after the decimals (Errors are standard errors).
YearForest Area (× 106 ha)
National StatisticsThis Study (Stratified Estimation)JAXA (Stratified Estimation)ESA (Stratified Estimation)
201514.0615.05 ± 0.4915.05 ± 0.5115.06 ± 0.49
201614.3814.49 ± 0.5114.49 ± 0.52-
201714.4214.90 ± 0.5114.90 ± 0.51-
201814.5014.70 ± 0.52--
Average14.3414.79 ± 1.0214.81 ± 0.9015.06 ± 0.49

