1. Introduction
Universities are tasked with improving student learning and demonstrating program effectiveness. Even though numerous teaching tools are available, teaching and learning are not singularly dependent on technology. However, as technology enhances student access to resources, we may witness a portentous shift in their learning patterns [
1]. One of the primary components of effective teaching, and likewise critical to learning, is student engagement [
2,
3]. In Europe, as defined by the new paradigm of European Higher Education within the Bologna process, lecturers are agents that create working environments to stimulate students. In this scenario, lecturers should create and generate resources to facilitate an adequate context for learning [
4]. The main factor in the learning process is the willingness to learn [
5], which is dependent on the student. However, the lecturer can help students by guiding and supporting their autonomous learning. One major objective is to realize the vision of “learning to learn”, in which students are trained in methods to acquire information, critical thinking, and life-long learning skills.
Remote sensing (RS) is a rapidly growing technology integrated with other disciplines, such as photogrammetry, geographic information systems (GIS), and computer science. New Earth observation programs like Copernicus [
6], acquisition platforms like unmanned aerial systems (UAS) or cloud-based platforms for geospatial analysis like Google Earth Engine [
7], have placed the geoscientific community, and in particular RS, in an essential position. Its importance has been recognized by different organizations [
8,
9] and has been identified as one of the three most important emerging disciplines [
10]. Geosciences are linked to technologies related to the Earth’s surface, with GIS, RS, and Global Navigation Satellite Systems (GNSS) being of key import. These technologies are joined under the term geomatics, defined as the branch of science that deals with the collection, analysis, and interpretation of data, especially instrumental data, relating to the Earth’s surface.
The contents and methodologies used in educational programs for remote sensing have changed radically. At the beginning of the 1980s, most of the courses offered in the United States were provided as service courses at an introductory level [
11]. However, in 2013, a review of technical education in Europe on aerospace and RS was carried out and [
12] education programs were organized into three main categories: a) “Aerospace hardware”, b) “Remote sensing and image/data processing”, and c) “Aerospace environmental application”. The first category is focused on aircraft or satellite structure as the main objective to study construction, propulsion, motion, aerodynamics, and flight mechanics of the platforms. Included in “remote sensing and image/data processing”, authors highlight programs related to data capture and processing as the main topics for RS. These are classical courses focused on the optical and radar sensors and satellite principles and the main image processing techniques. Additionally in some cases, the educational scope is multimedia data processing, with RS being a possible application. Finally, “Aerospace environmental applications” are focused on RS for environmental purposes. The use of satellite images to create maps to monitor forests, oceans, glaciers or urban areas are some of the typical topics of courses like this. Independent of the geographic area, new technological developments in RS and photogrammetry areas demand changes in the educational programs, requiring adaptation and application of improved teaching methods [
13]. Active learning methods have been proved to better motivate students, increasing their knowledge compared to traditional ways of teaching [
14,
15]. Active learning involves students in doing things and thinking about what they are doing [
16]. In this framework, different approaches were adopted in the remote sensing field like podcasts created by students [
17], inquiry-based educational experiments [
18], internet-based seminars [
19], and interactive online tools [
20]. A successful inquiry-based educational experiment is “ESF goes to space” (College of Environmental Science and Forestry, New York, USA), where students design, build, and launch a helium balloon for acquiring images [
18].
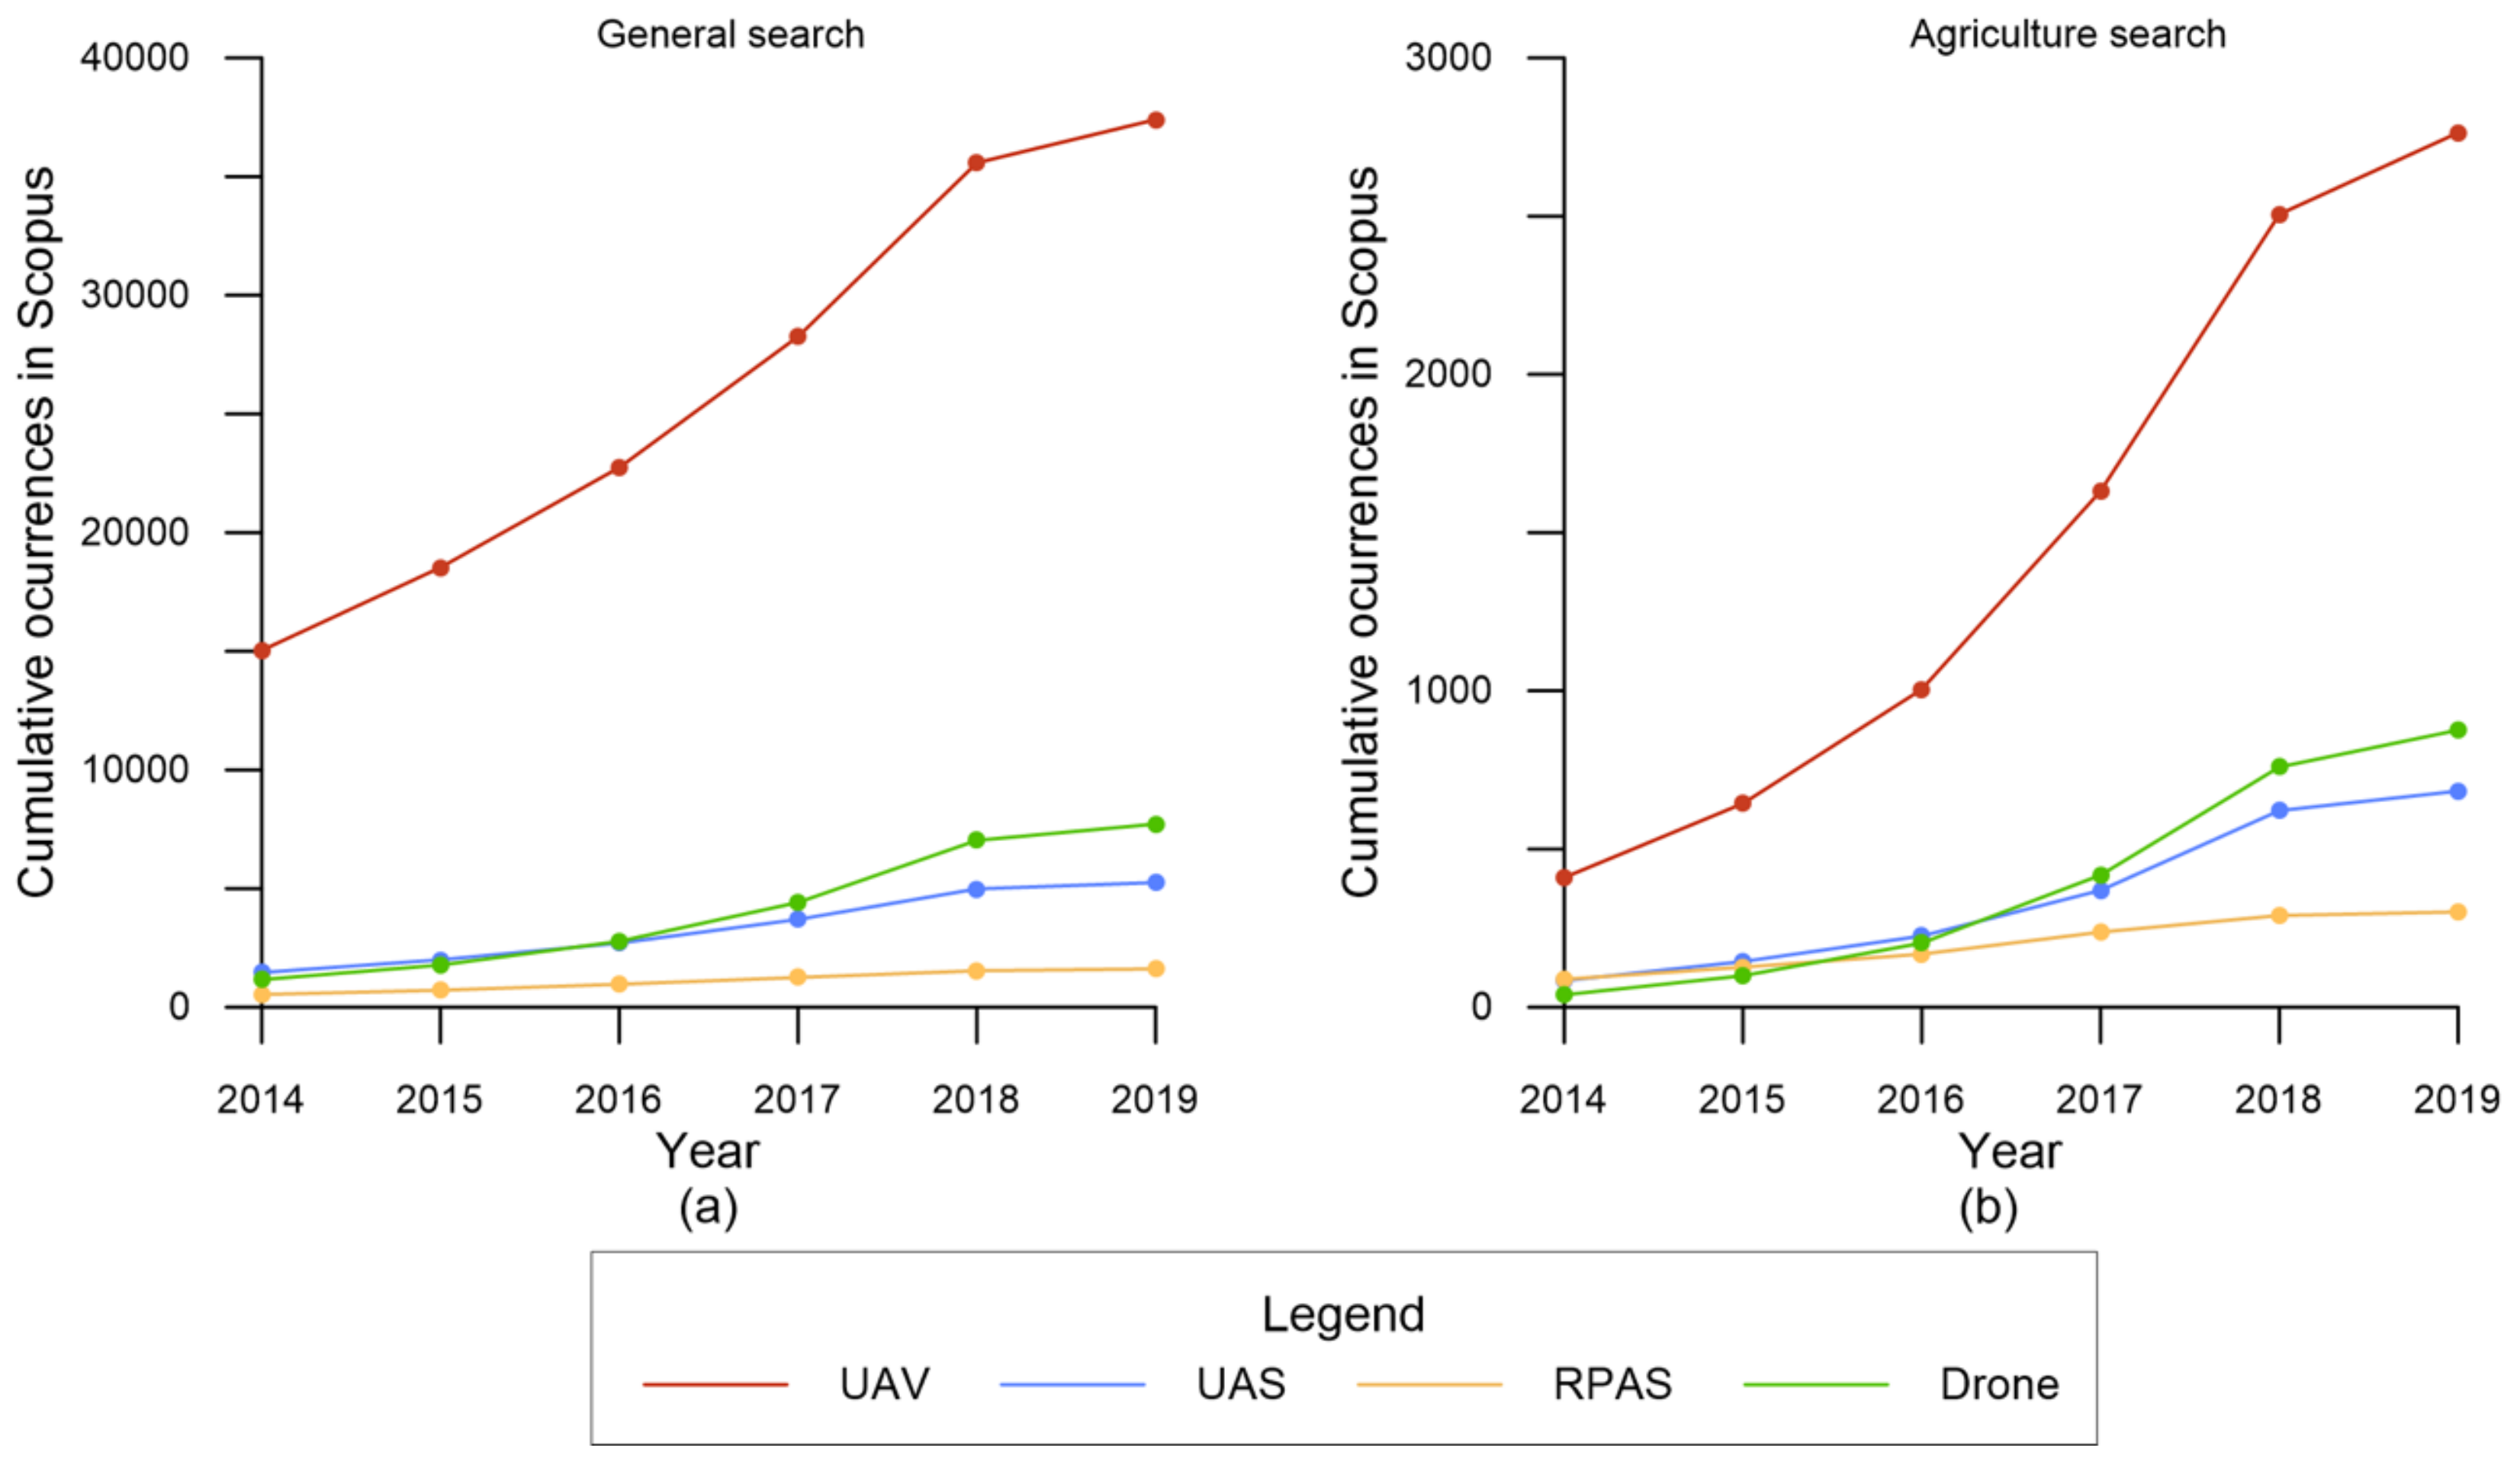
Commercial opportunities through UAS are on the rise as platform and sensor technologies are becoming more affordable. This fact is reflected in the increase of bibliographic references in recent years. Different terms fall under UAS: Unmanned aerial vehicle (UAV), remotely piloted aircraft systems (RPAS) or drone [
21]. Bibliometric census using the scientific database Scopus (
Figure 1) shows an increase in the number of appearances year by year (up to 15 April 2019), with UAV being the term most used. This trend also appears when adding the keyword “agriculture” to this analysis, showing the interest of its use in agronomy. Equally of note, precision agriculture (PA) is one of the most economically important sectors in the UAS market [
22,
23]. As such, the development of UAS in the last decade has marked a new era in RS and has become a serious “game-changer” in PA [
24], providing data of unprecedented spatial, spectral, and temporal resolution [
21].
Given this scenario, universities should expand their education programs, including UAV-based geomatics operations and application developments [
25]. New curriculums are mainly focused, to date, on photogrammetry applications [
26,
27]. As a result of the interest generated by UAV applications, it is likely beneficial to introduce UAV-RS learning in those university studies related to agriculture. The goal of this manuscript is to show the teaching methodology used to do so in the Faculty of Agriculture and Forestry Engineering (Escuela Técnica Superior de Ingeniería Agronómica y de Montes, ETSIAM) at the University of Córdoba (Spain).
2. Project-Based Learning: Characteristics and Goals
One of the main objectives of engineering programs is “to produce broad-based, flexible graduates who can think integratively, solve problems, and be life-long learners” [
28]. As such, it is accepted that if a combination of theory and practice are implemented into the educational programs, the educational outputs are positive for the student’s learning process. Learning methods, like project-based learning (PBL), are adequate supplements to traditional teaching methods. PBL is considered an approach to teaching where students respond to real-world questions [
29], providing a context of learning through problems or questions linked to real-world practices [
30], and dealing with problems that approximate real situations [
31]. Therefore, the main goal of PBL is to provide students the opportunities to apply knowledge instead of simply acquiring it, with a focus on problem formulation as well as problem-solving [
32]. In this context, the practice of PBL is supported by three major principles in learning:
As per Barrows [
35], PBL characteristics are: “a) learning is student-centered, b) learning occurs in small student groups, c) lecturers are facilitators or guides, d) problems form the organizing focus and stimulus for learning, e) problems are a vehicle for the development of clinical problem-solving skills and f) new information is acquired through self-directed learning”. PBL is a learning model where students actively work, plan, implement, and evaluate projects that have real-world applications [
36], which is not to be confused with problem-based learning where students are focused on resolving specific problems. Therefore, PBL is a broader category of learning, where in addition to solving a specific problem, students also address other areas that are not explicit in the problem. From the lecturer’s point of view, PBL has authentic objectives and uses real assessment, while the teacher acts as a coach with explicit educational objectives [
37]. On the other hand, from the student’s point of view, PBL stimulates collaborative and cooperative learning, allows continuous improvement in their presentations or products among others, and is designed for the student to participate actively in the resolution of the task [
37]. Accordingly, the success of PBL is based on the design of adequate problems to motivate self-study. In this context, RS and GIS are areas of knowledge that allow the incorporation of new pedagogical methodologies, such as, in this case, PBL [
38,
39,
40].
3. UAV-RS in Agricultural Engineering at ETSIAM (University of Cordoba)
The Higher Technical School of Agricultural Engineering (Escuela Técnica Superior de Ingenieros Agrónomos, ETSIA) at the University of Córdoba (Spain) began its academic activity in 1968, providing a degree in agricultural engineering with various specialties. In 1989, it was authorized to provide studies in forestry engineering. As a result, the school was called the Higher Technical School of Agricultural and Forestry Engineering (Escuela Técnica Superior Ingeniería Agronómica y de Montes, ETSIAM). ETSIAM offers: three bachelor programs—Agrifood Engineering and Rural Environment, Forestry Engineering, and Enology; two professional master’s degrees—Agricultural Engineering, and Forestry Engineering; and eight specialized master’s courses can be studied at ETSIAM. Since its inception, ETSIAM has opted to incorporate the latest technological advances in its academic programs. As an example, in 2018, a master’s degree in digital transformation in the agri-food sector was implemented, where the students learn aspects related to big data, cloud computing, IoT, and others as applied to agriculture.
Since 2012, the Department of Graphic Engineering and Geomatics of ETSIAM has established UAV-RS as one of its key areas of focus with emphasis on research and teaching. Our own UAV-RS research allows our department to consolidate areas of interest in agriculture which, thereby, in terms of education, permits personal experience to form part of the educational content. In addition, our research activity through projects financed both publicly and privately, allows us to have the knowledge, experience, and materials related to UAV technology, such as flight platforms, sensors, and software. These three components are then made available to students studying UAV-RS.
Three categories of students participate in UAV-RS programs: bachelor students, master students, and PhD students. Bachelor students do not study UAV-RS, however, in recent years, some have requested an overview of these technologies, likely due to expectations and novelty. In these cases, students do their final year project on RS-UAV in agriculture. Master students have the opportunity to take a course on UAV-RS. PhD students use UAV technology in their research activities.
RS is a discipline studied throughout the programs offered by ETSIAM, while UAV studies are offered as an elective subject titled, “UAVs in the Agroforest Sector” in the second course of the master’s degree in agricultural engineering. This course has four ECTS (European Credit Transfer and Accumulation System) with 40 hours of teacher-guided activities and 60 hours of self-directed activities. The activity distribution is summarized in
Table 1. The purpose of this course is to provide students an opportunity to work with UAS applied to precision agriculture using RS techniques. Applying PBL, students process and analyze data that they have registered themselves using RGB, multispectral, and thermal sensors onboard UAV platforms. The main goal of this is for students to apply RS methods in orthomosaics generated from images that have been registered by sensors onboard UAV and to generate crop information to support decision making.
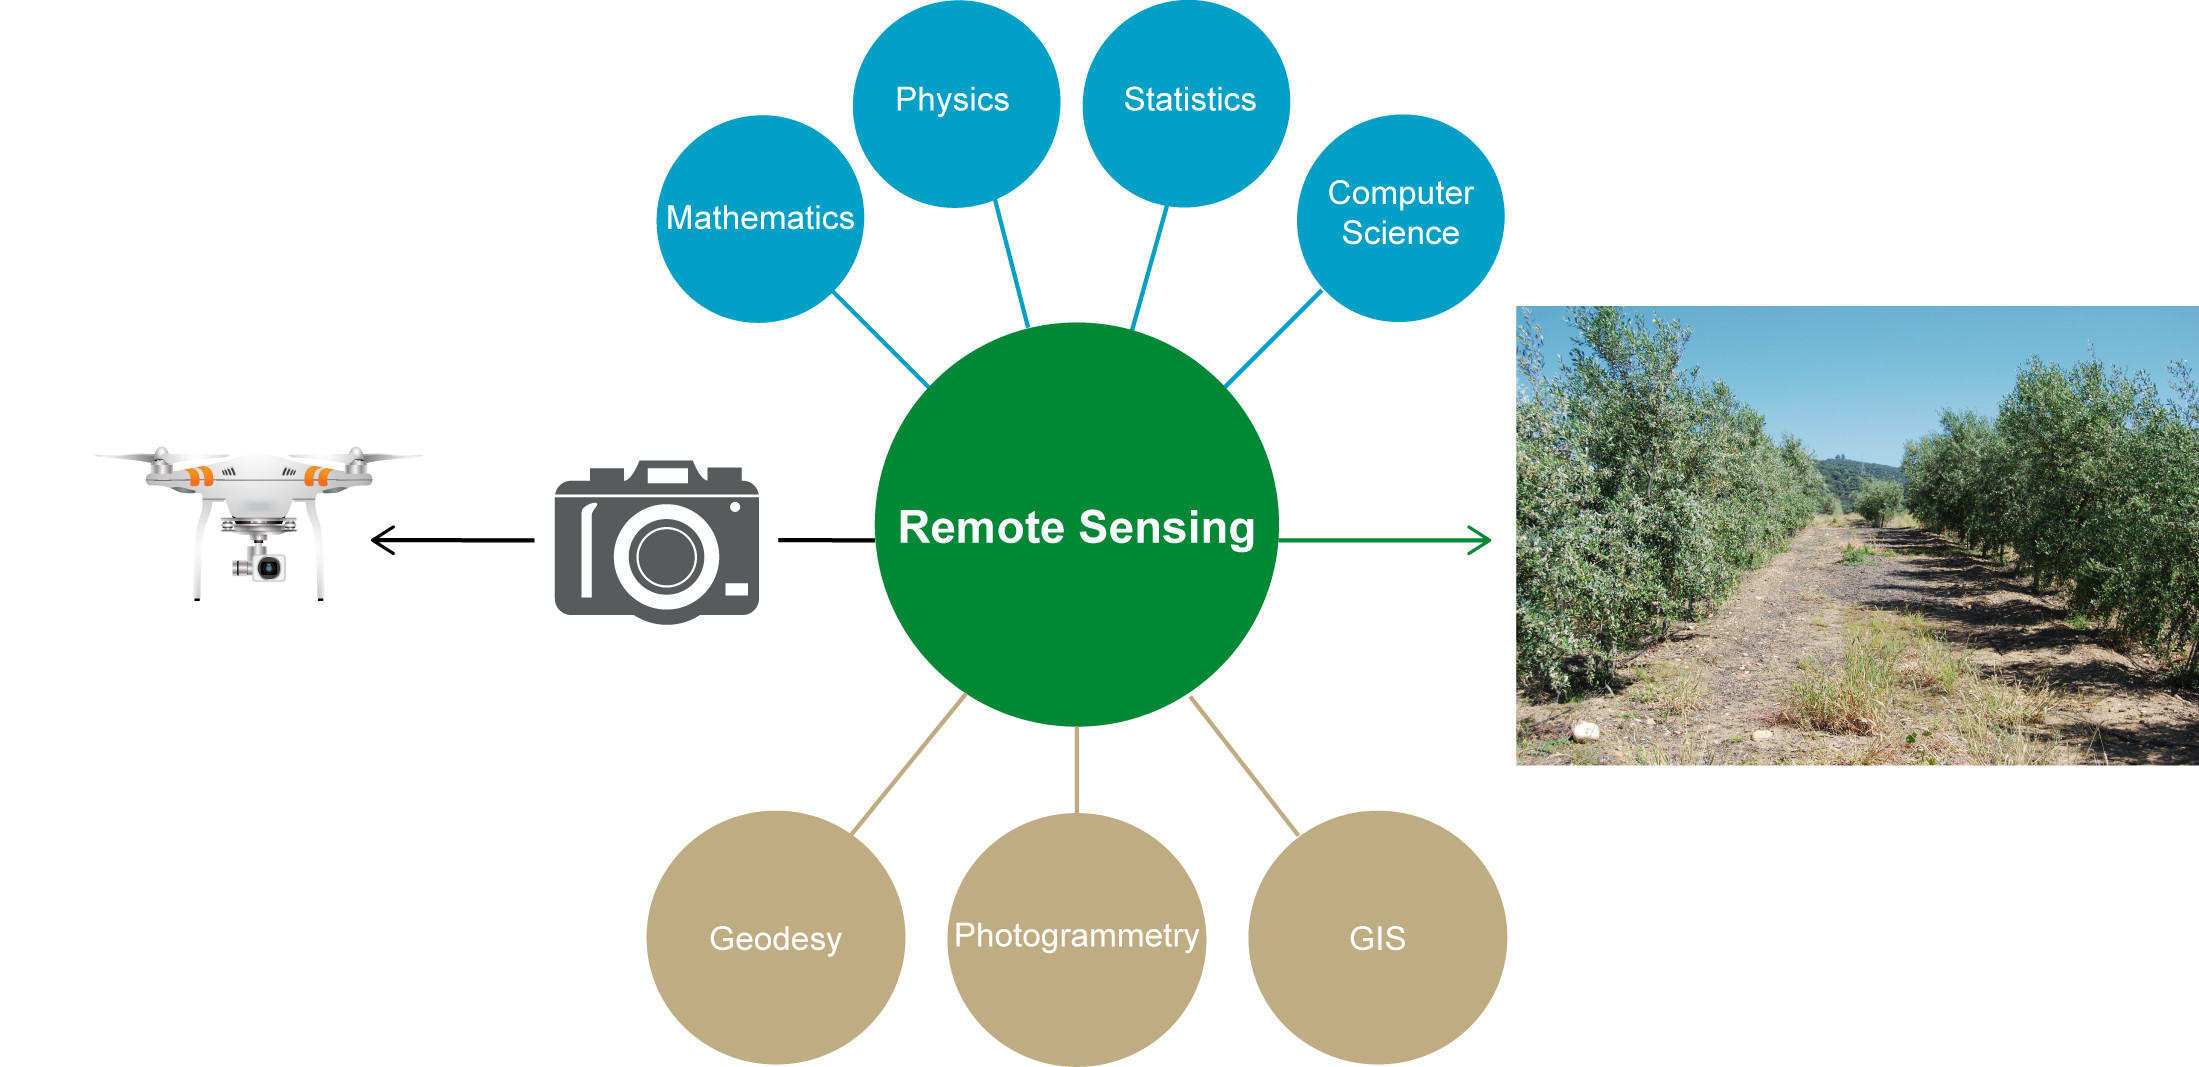
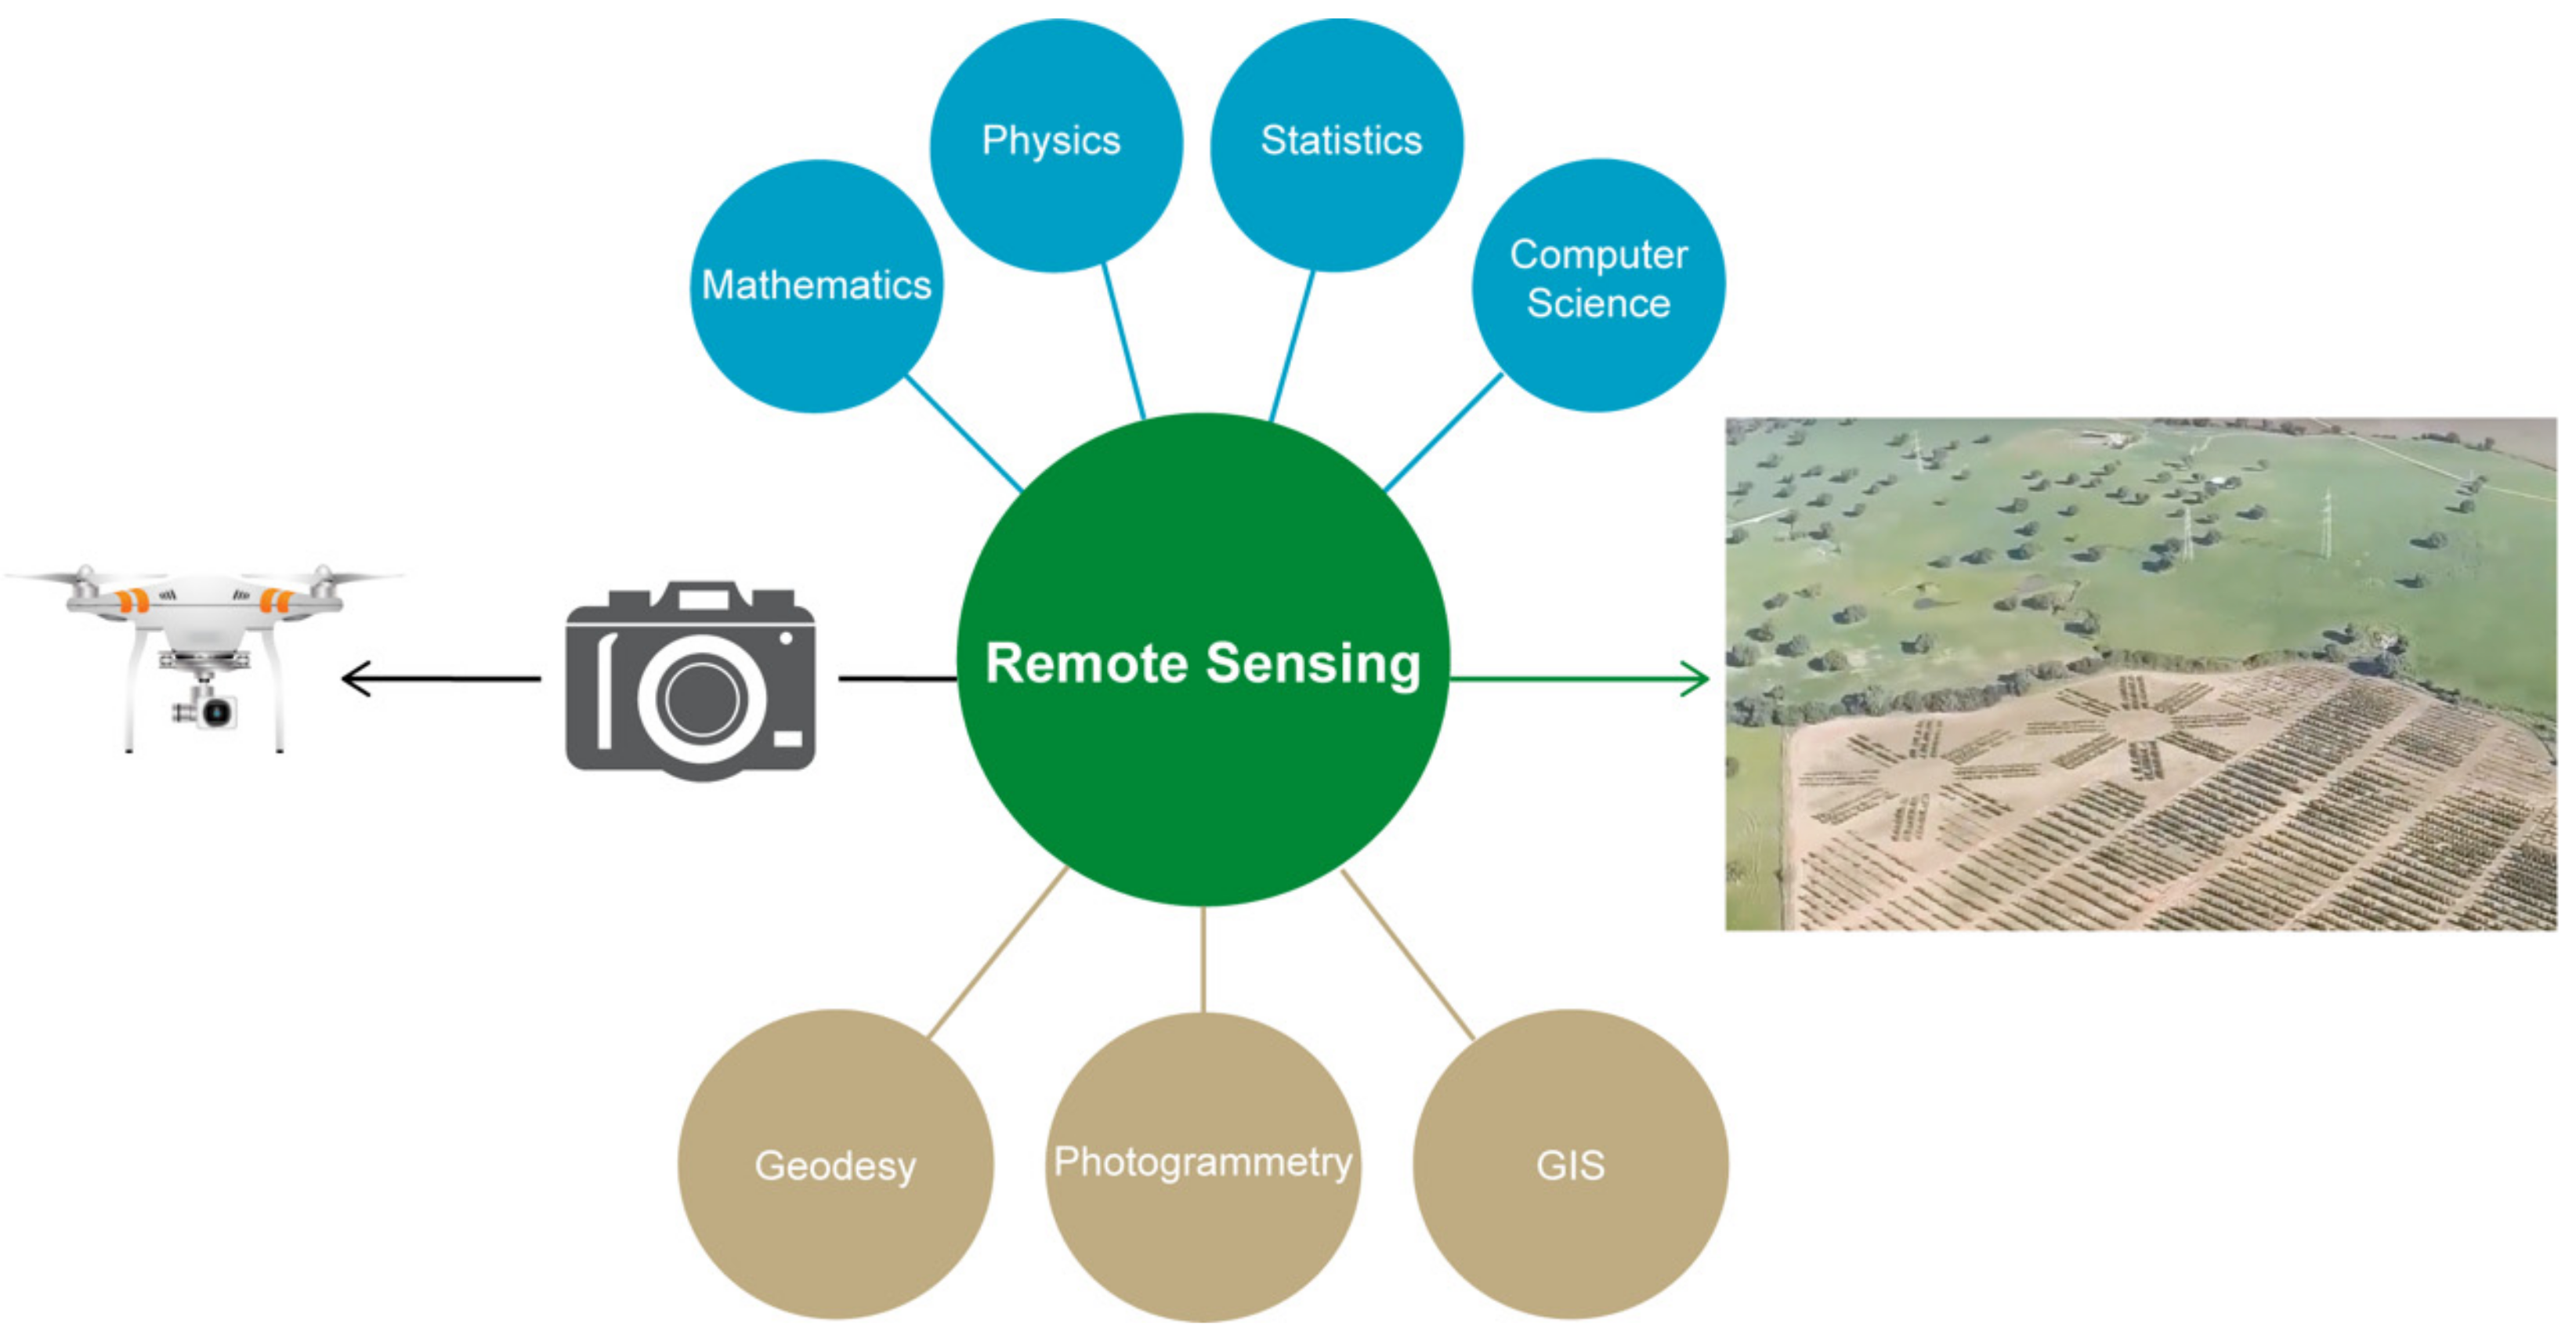
Figure 2 summarizes all the knowledge areas that students use together with RS in this subject. In the Bachelor of Agrifood Engineering and Rural Environment in ETSIAM, students have previously studied geodesy, photogrammetry, GIS, and RS. Specifically, the courses in photogrammetry and RS emphasize manned aerial and satellite platforms, respectively and therefore, students have previously studied the fundamentals of both geomatic disciplines. Through their academic training, students have additionally studied mathematics, physics, and statistics. Moreover, they have worked with R-commander developing scripts as a statistical tool. Due to this preparation, students are ready to work on the specific characteristics of the UAV-RS by using and applying the knowledge previously acquired in earlier courses.
4. Systems Design and Educational Activities
The application of UAV-RS in agriculture is relatively novel. UAV-RS shares many technical and methodological aspects with satellite and manned platforms. However, it is necessary to adapt to the specific particularities that UAV-RS presents to the users. This explains the large number of scientific publications in recent years, as shown in
Figure 1. In the “UAVs in the Agroforest Sector” course, students are required to generate information about the state of a crop in terms of its vigor and water needs, linking that information to the characteristics of the plot, such as soil characteristics, topography or irrigation dose. It is, therefore, not only a question of generating maps through RS but also of assessing the “why” of the results obtained. For PBL to be successful, it is essential that students collect their own data, which necessitates having the adequate materials available.
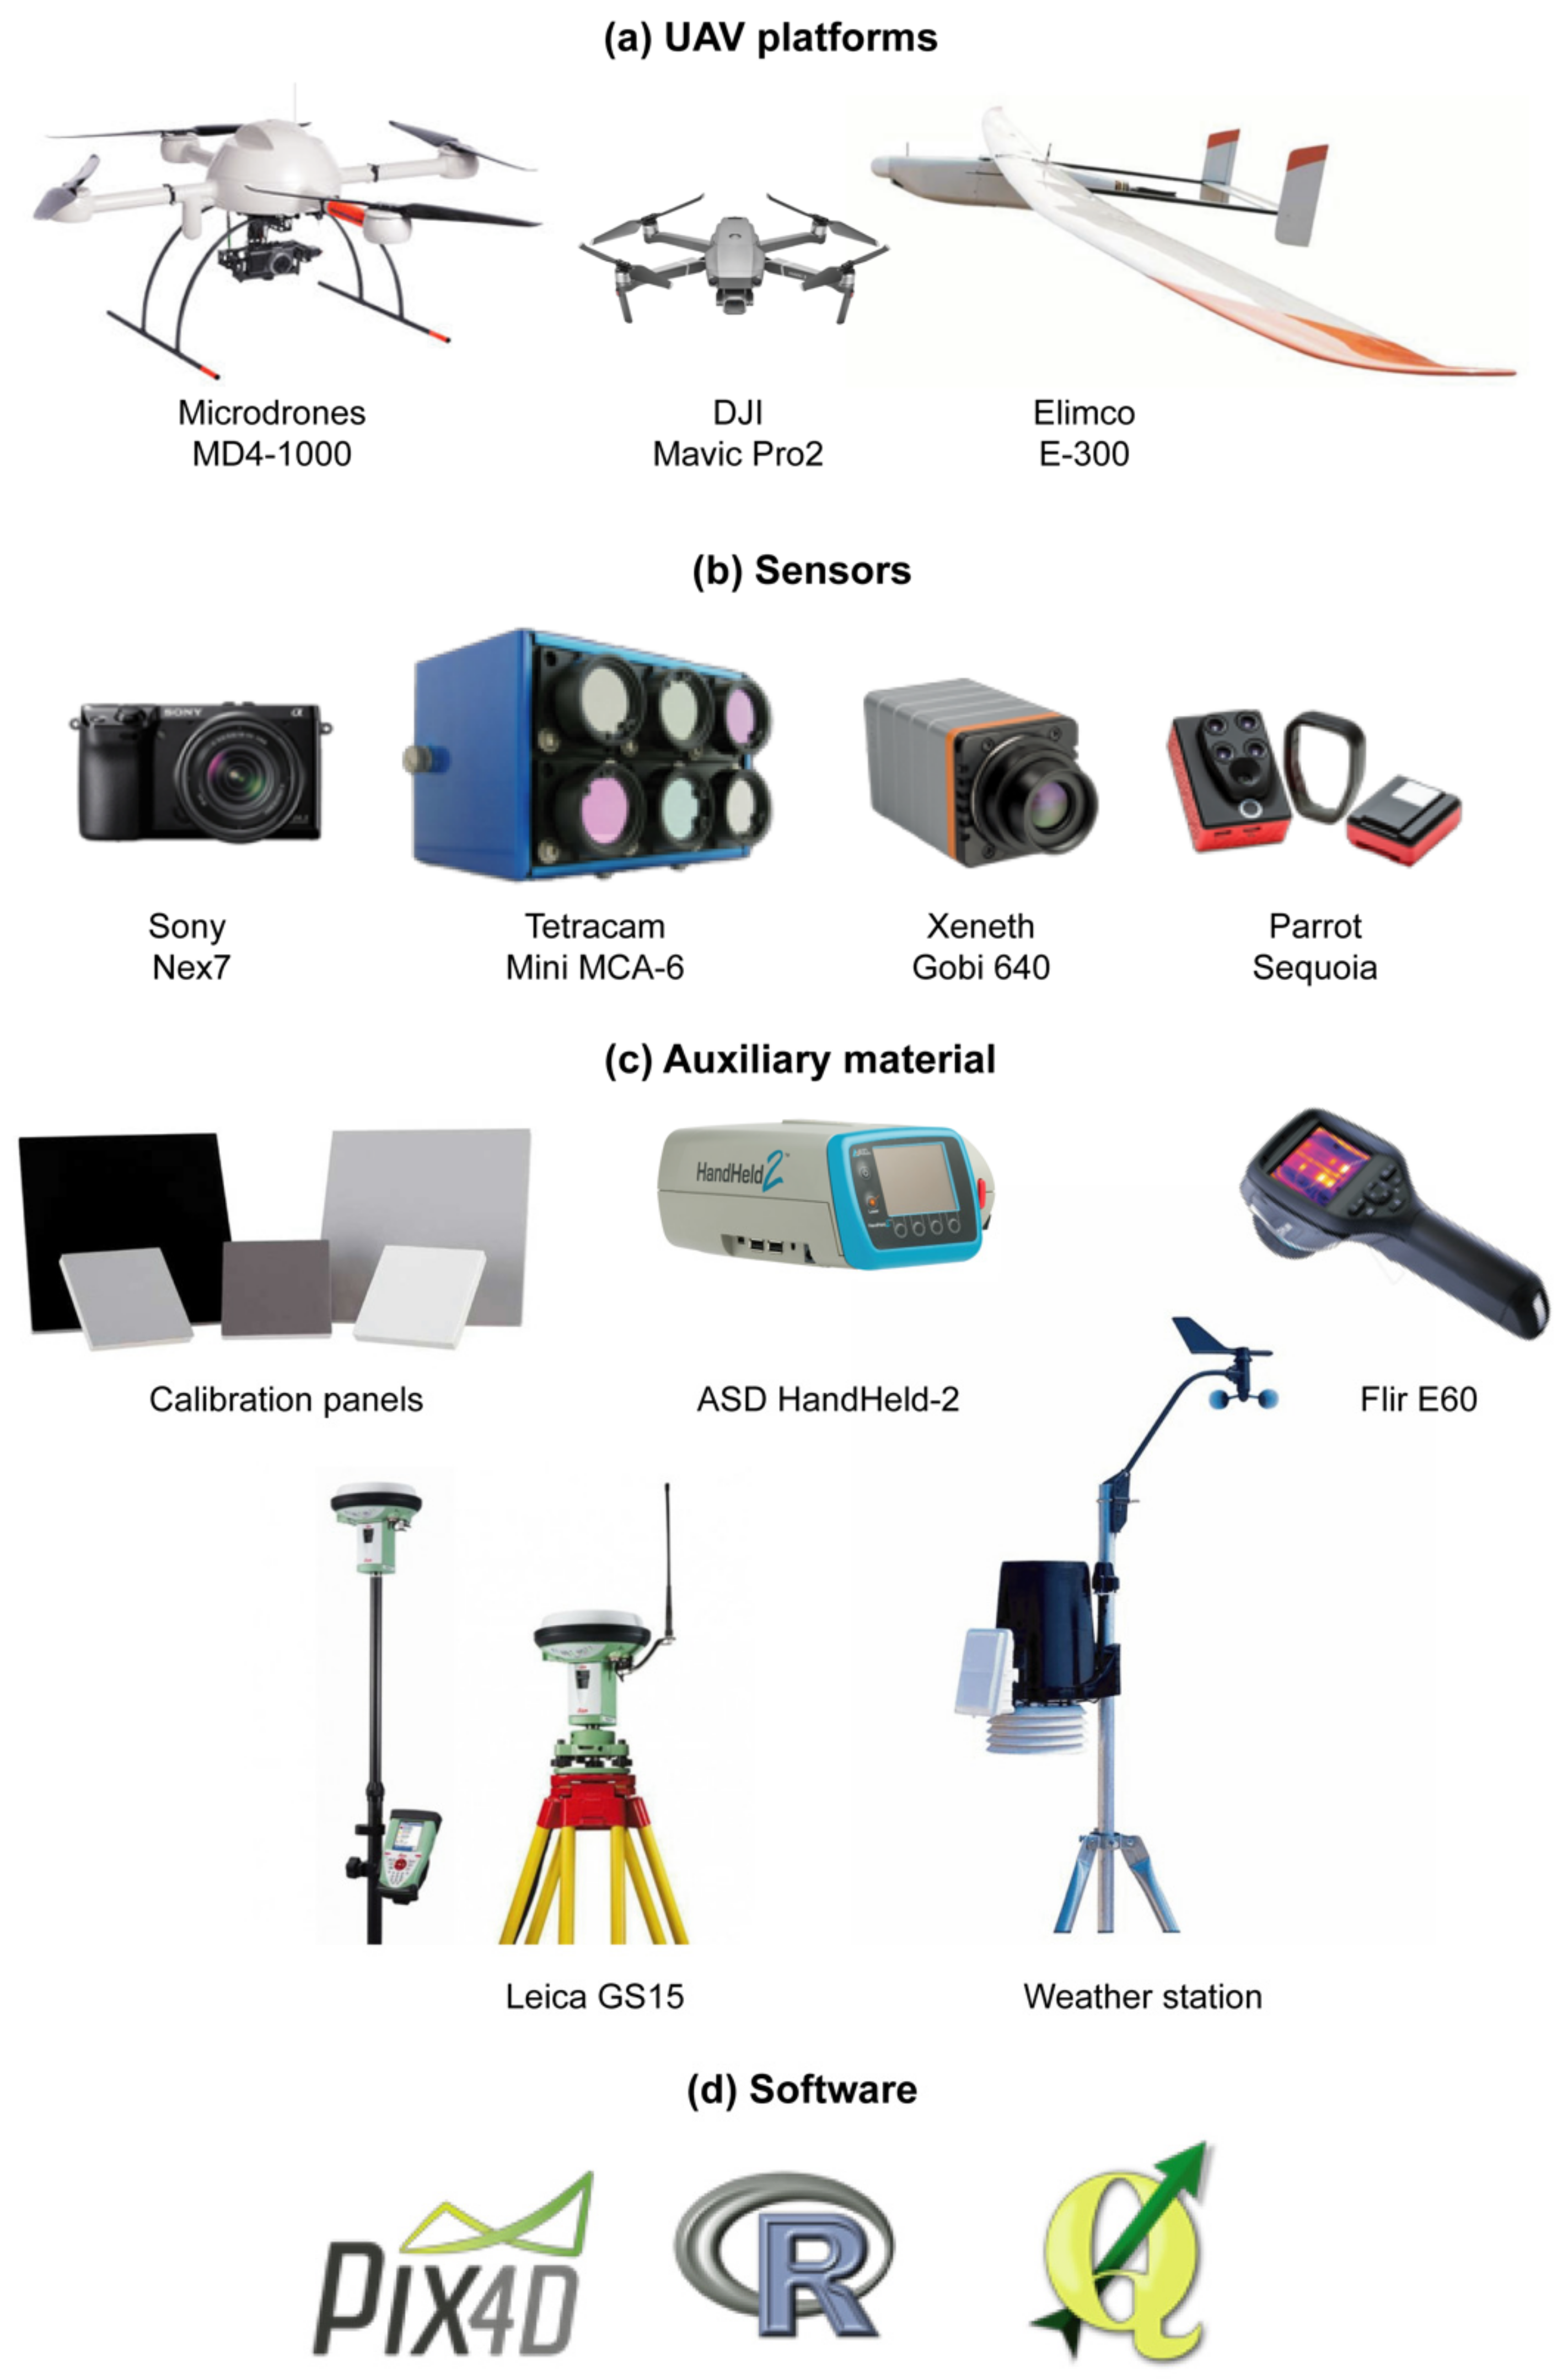
Figure 3 and
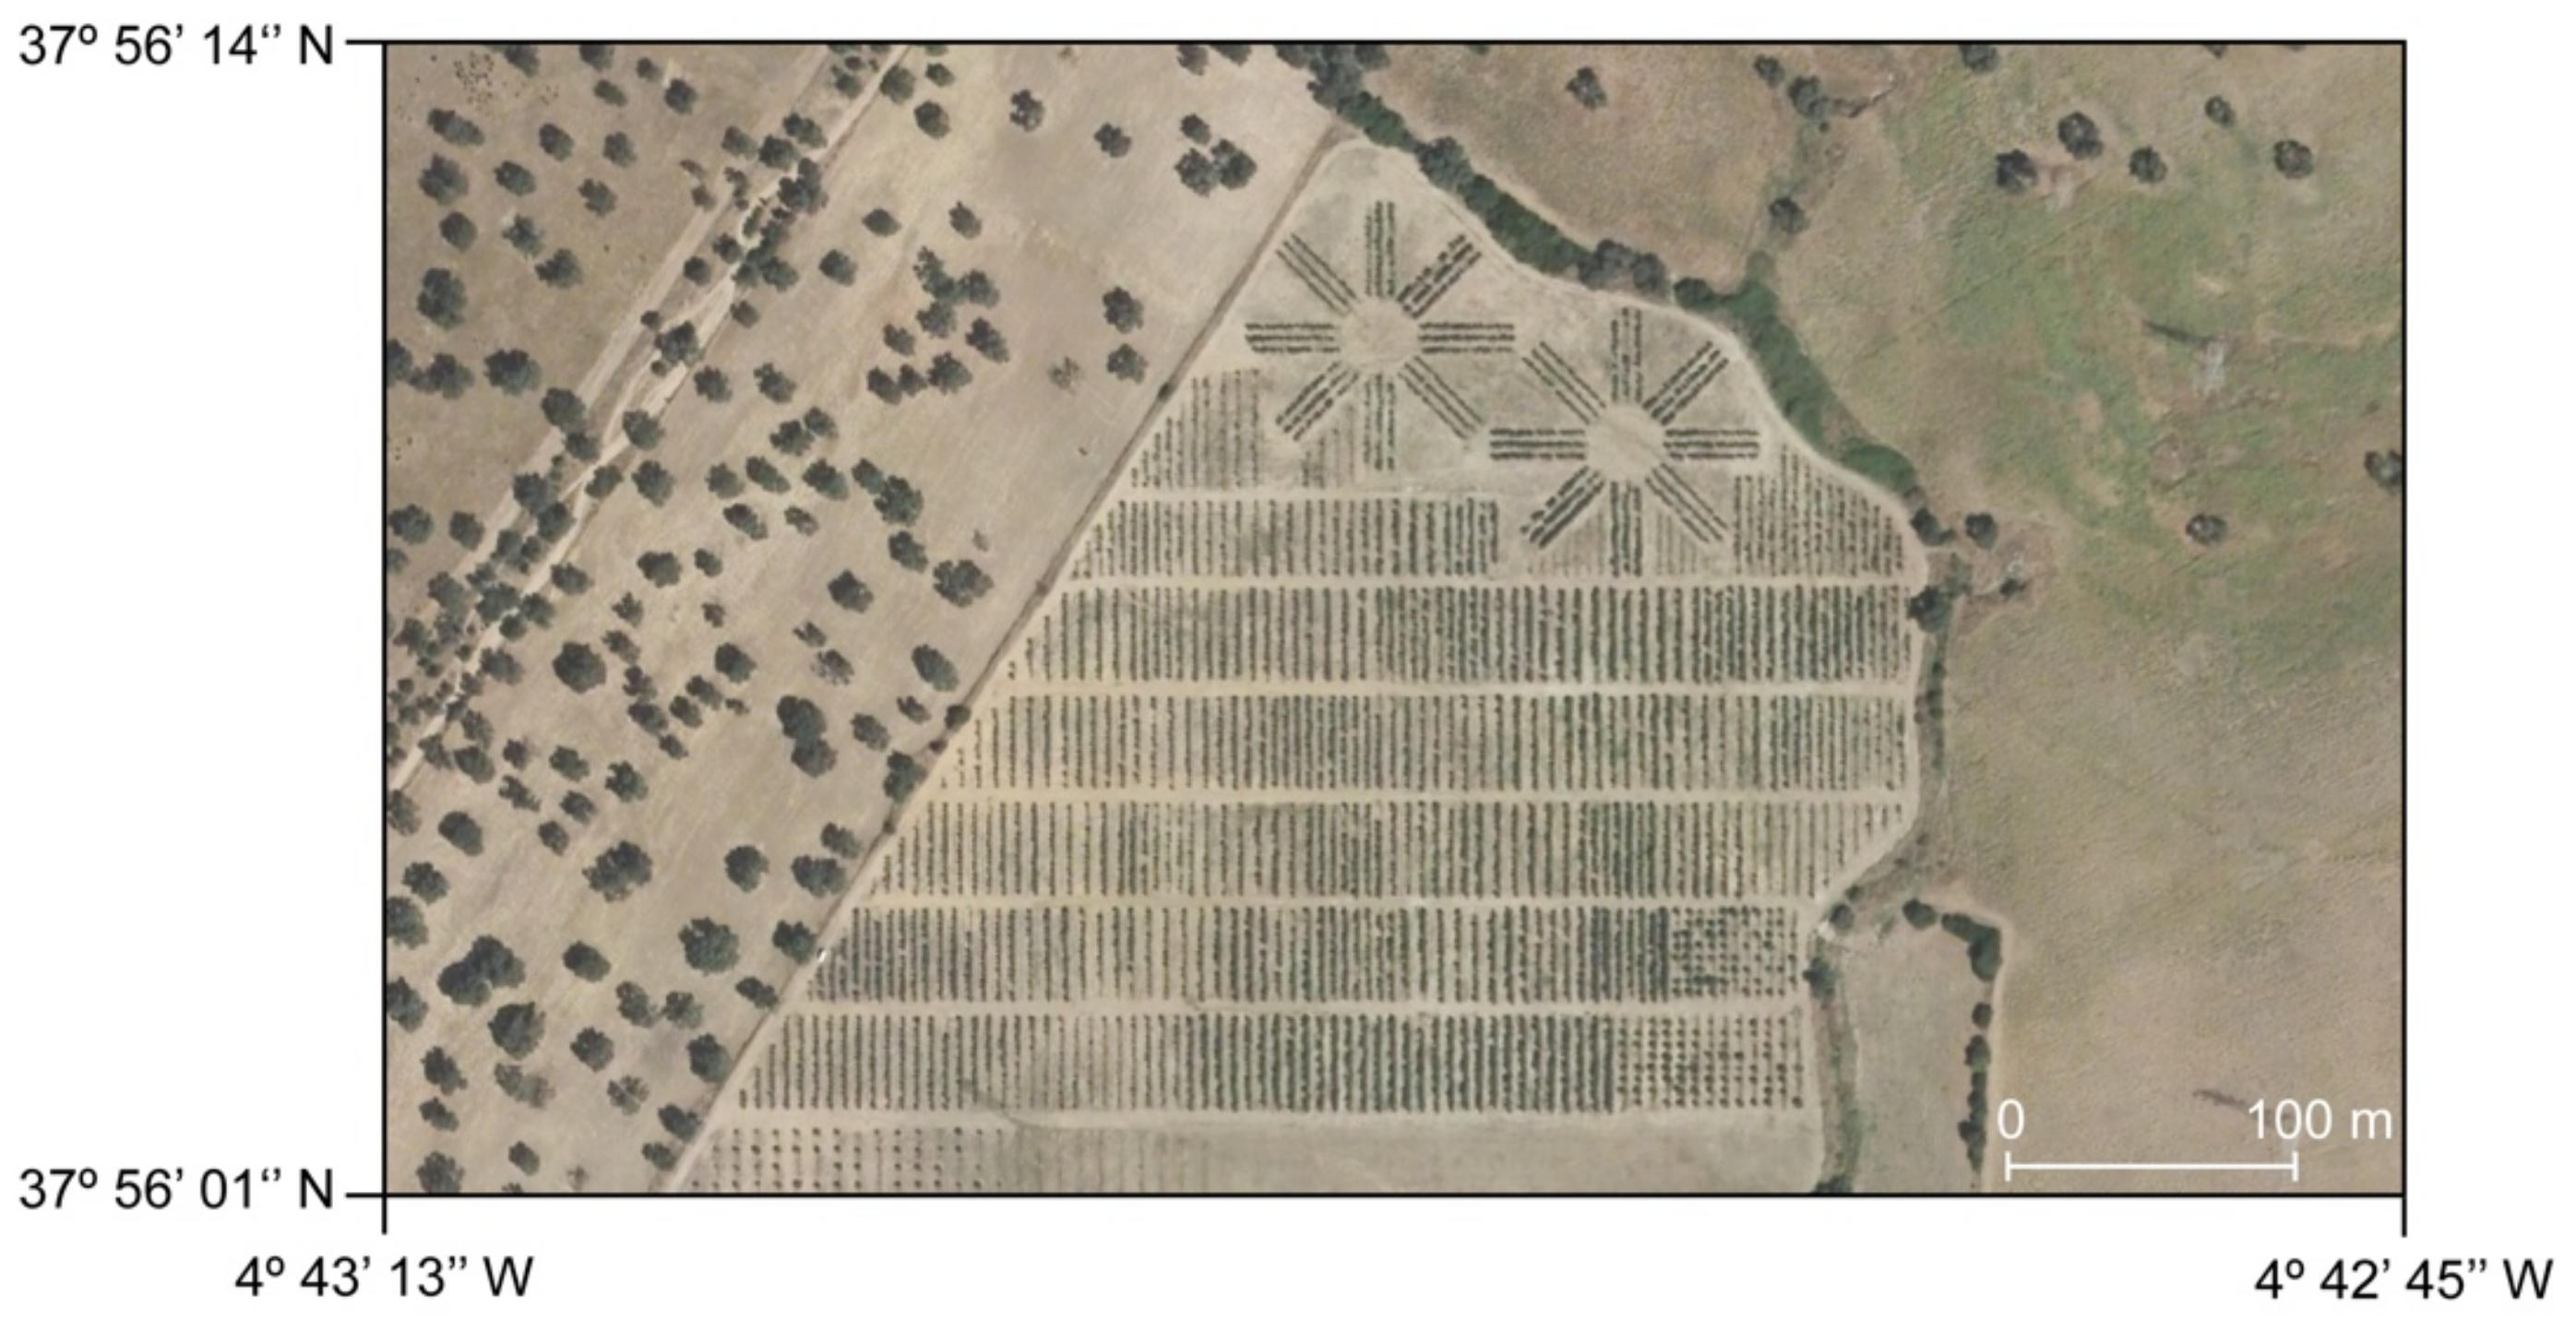
Table 2 summarizes all the materials with which the students work with: three flight platforms, four sensors to register images, auxiliary materials for geometric and atmospheric corrections, as well as different software solutions for the treatment of images. In addition, ETSIAM manages a “nature classroom” with different crops. Among them, there is an orchard with an area equal to 10 hectares of high-density hedgerow olive trees (north latitude 37°56′05′′, west longitude 4°42′59′′, WGS 84) (
Figure 4) with four different variables to be analyzed: phenotype, density, orientation, and irrigation dose together with soil characteristics. This provides students a real-world case study where they can collect data via RS techniques and then convert them into information useful for assisting decision-making. This “nature classroom” or plot, then, is the central element on which the PBL methodology is designed.
While students learn UAV RS, PBL allows them to acquire other competencies grouped into three classes: basic, general, and specific. Basic competencies are those referring to transversal competencies, transferable to many functions and tasks (communication, teamwork, etc.). While general competencies are those referring to successful integration into social and working life (language, new technologies, etc.). Finally, specific competencies are those directly related to a particular area of knowledge. Regarding the first group, each student learns in a highly personalized and independent way within their development and often close to the context of the research. In addition, they solve problems in new or unfamiliar environments related to their area of study, such as programming. Likewise, they acquire skills that will allow them to continue studying autonomously. For general competencies, students develop the ability to apply the acquired knowledge to solve problems, analyze the information, and synthesize it to facilitate the decision-making process. In addition, the ability to transmit information and conclusions using new communication channels is developed. Finally, and with specific character, students acquire knowledge and skills to be applied in the agricultural sector.
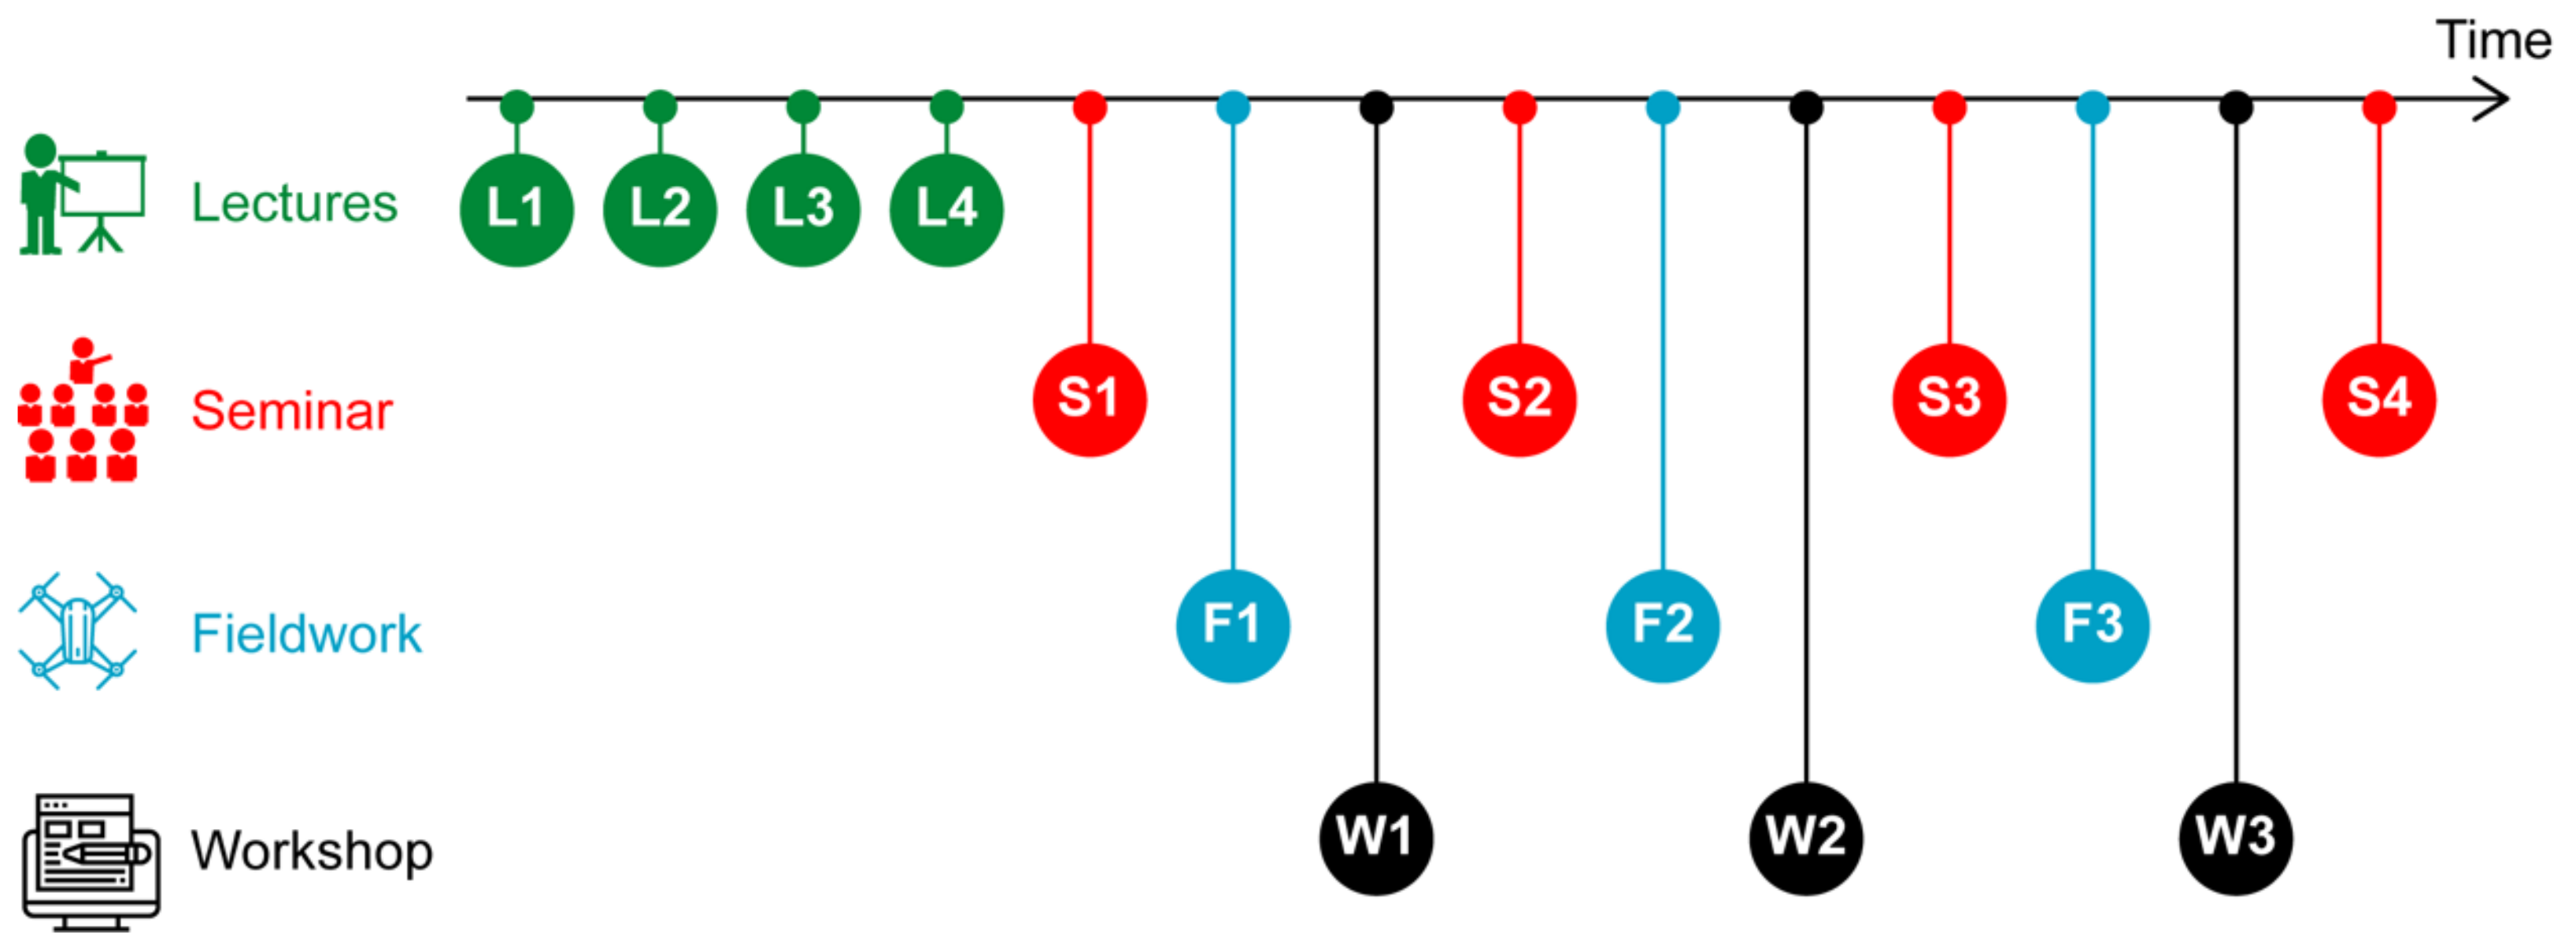
Table 3 summarizes teacher-guided activities and
Figure 5 shows the temporal distribution. Lectures have a total duration of five hours. Firstly, students are given the rationale for learning these technologies and their applications to precision agriculture, advantages and disadvantages in terms of spatial and temporal resolution compared to other platforms, as well as when their use is justified (
Table 3, L1). In addition, the student learns the legislative aspects that regulate the use of this type of platform, highlighting that today, the current legislation only allows the use of RPAS. Once the RPAS concept is introduced, the student learns what a UAS is and the different sub-systems that it is composed of: the flight platform, sensors, and the control station (
Table 3, L2). Flight platforms are analyzed from different points of view, such as architecture, autonomy, weight, and maximum flight height, providing an overview of their individual capabilities, features, and versatilities. In another session, the student learns the different sensors of interest in agriculture to be onboard a UAV (
Table 3, L3): RGB, multi/hyper-spectral, thermographic, and LiDAR. An overview of the current state of sensors is made, assessing development level, possibilities, and opportunities for improvement. Finally, concepts in photogrammetry are reviewed as this was studied in the bachelor’s degree (
Table 3, L4) and only needs to be extended conceptually to unmanned platforms. Overall, depending on the type of sensor onboard the UAV and our experience with it, particularities and suggestions are detailed for the students.
Three seminars based on UAV-RS applications in agriculture using RGB, multispectral and thermal sensors, and one on diffusing information form part of the course. Based on scientific articles, web pages, and our own results from UAV flights, students learn different indexes and their usefulness in agriculture, such as color indices, isolating vegetation based on RGB sensors, determining the water needs through vegetation, temperature indices and so forth. These seminars are combined over time with fieldwork as the different applications of the sensor type are studied, thereby allowing students to put into practice what they have learned in the classroom. Each fieldwork assignment starts with a UAV flight. Thus, students plan the flight, use GNSS receivers to measure ground control points for geometric correction, use a thermographic gun and spectroradiometer to measure calibration panels, and then perform an atmospheric correction using the empirical line method.
The transformation of the UAV collected data to useful information for the farmer implies the generation of a series of products, such as maps or graphs, that have to be clear and easy to interpret. Today, aside from the classic analogical maps, it is necessary to provide this information digitally. For this reason, the last seminar (
Table 3, S4) has been designed to present different tools for publishing geographic information through web services and applications.
Finally, three workshops are organized throughout the course. The first (
Table 3, W1) is focused on the generation of digital surface models (DSM), digital elevation models (DEM) and orthomosaics from an image collection obtained from a UAV flight. The second (
Table 3, W2) focuses on statistical treatments of images, atmospheric correction, and generation of indices using R-commander. In the last workshop (
Table 3, W3), students learn to automate spatial analysis processing using QGIS and the Python programming language.
Teacher-guided activities support self-directed activities with the main objective being that the students are able to independently provide information about crops.
Table 4 summarizes self-directed activities according to the sensor used. All in-course UAV flights have a common goal, to generate a DSM, a DEM, and an orthomosaic. Upon completion of the UAV flight, the students measure auxiliary data to perform geometric corrections from the measurements of the ground control points (GCPs) obtained from the GNSS receivers and atmospheric corrections obtained from the spectroradiometer or thermographic gun. In addition, environmental parameters such as air temperature, relative humidity, and atmospheric pressure are measured for each UAV flight. A true- color ortho-mosaic is produced using RGB images from the RGB UAV flight (F1), which is used to isolate hedgerow olive trees by a color filter. Scientific references, such as [
41], are provided to the students so that they may reproduce the processing by developing an R-Commander script. Different color filters, like ExG or ExR, are implemented to later assess which one provides the best results in terms of isolating vegetation from the soil. In addition, these results are applied again in the multispectral and thermographic orthomosaics to extract the information only from the crop.
For the multispectral UAV flight (F2), once the spectral orthomosaic for each spectral band is generated, the students apply an atmospheric correction using the empirical line method. An R-Commander script is developed by the students to calculate a lineal model to relate image values and spectroradiometer measurements for each spectral band, which is later applied to generate a new set of atmospheric-corrected orthomosaics. Using these atmospheric-corrected orthomosaics, students have to calculate five vegetation indexes (VIs). NDVI and SAVI are obligatory while the students are free to calculate the rest. The calculation of these VIs is done through a script developed in Python and QGIS. Subsequently, the value of the VI relative to the crop is isolated using the mask generated from the RGB UAV flight in the previous activity and each hedgerow is statistically characterized. In addition, every tree is analyzed individually since the plantation pattern is known. This is carried out for each VI calculated so that the students once again have to automate the whole process through Python and QGIS.
Finally, a thermal orthomosaic is generated using images from a thermographic UAV flight (F3). After, atmospheric correction is applied through the empirical line method using in-field temperature measurements of panel calibrations. For that, students use the R-Commander script developed previously. Then, every hedgerow and the individual trees are thermally characterized using basic statistics. Moreover, a crop water stress index (CWSI) model from scientific literature is applied [
42].
As a result of the application of RS techniques, the student characterizes the crop, both at the level of hedgerow and individual trees. It is then necessary for the student to learn tools that agilely show the results obtained. As the final step, currently, the student learns Carto (
www.carto.com) as a cloud-based GIS tool to present their results on different devices (tablets, smartphones or laptops). With all the information collected from the crop, the student analyzes the causes that explain the differential behavior in terms of vigor, temperature, and water stress, and generate a final report with all the results obtained.
5. Results
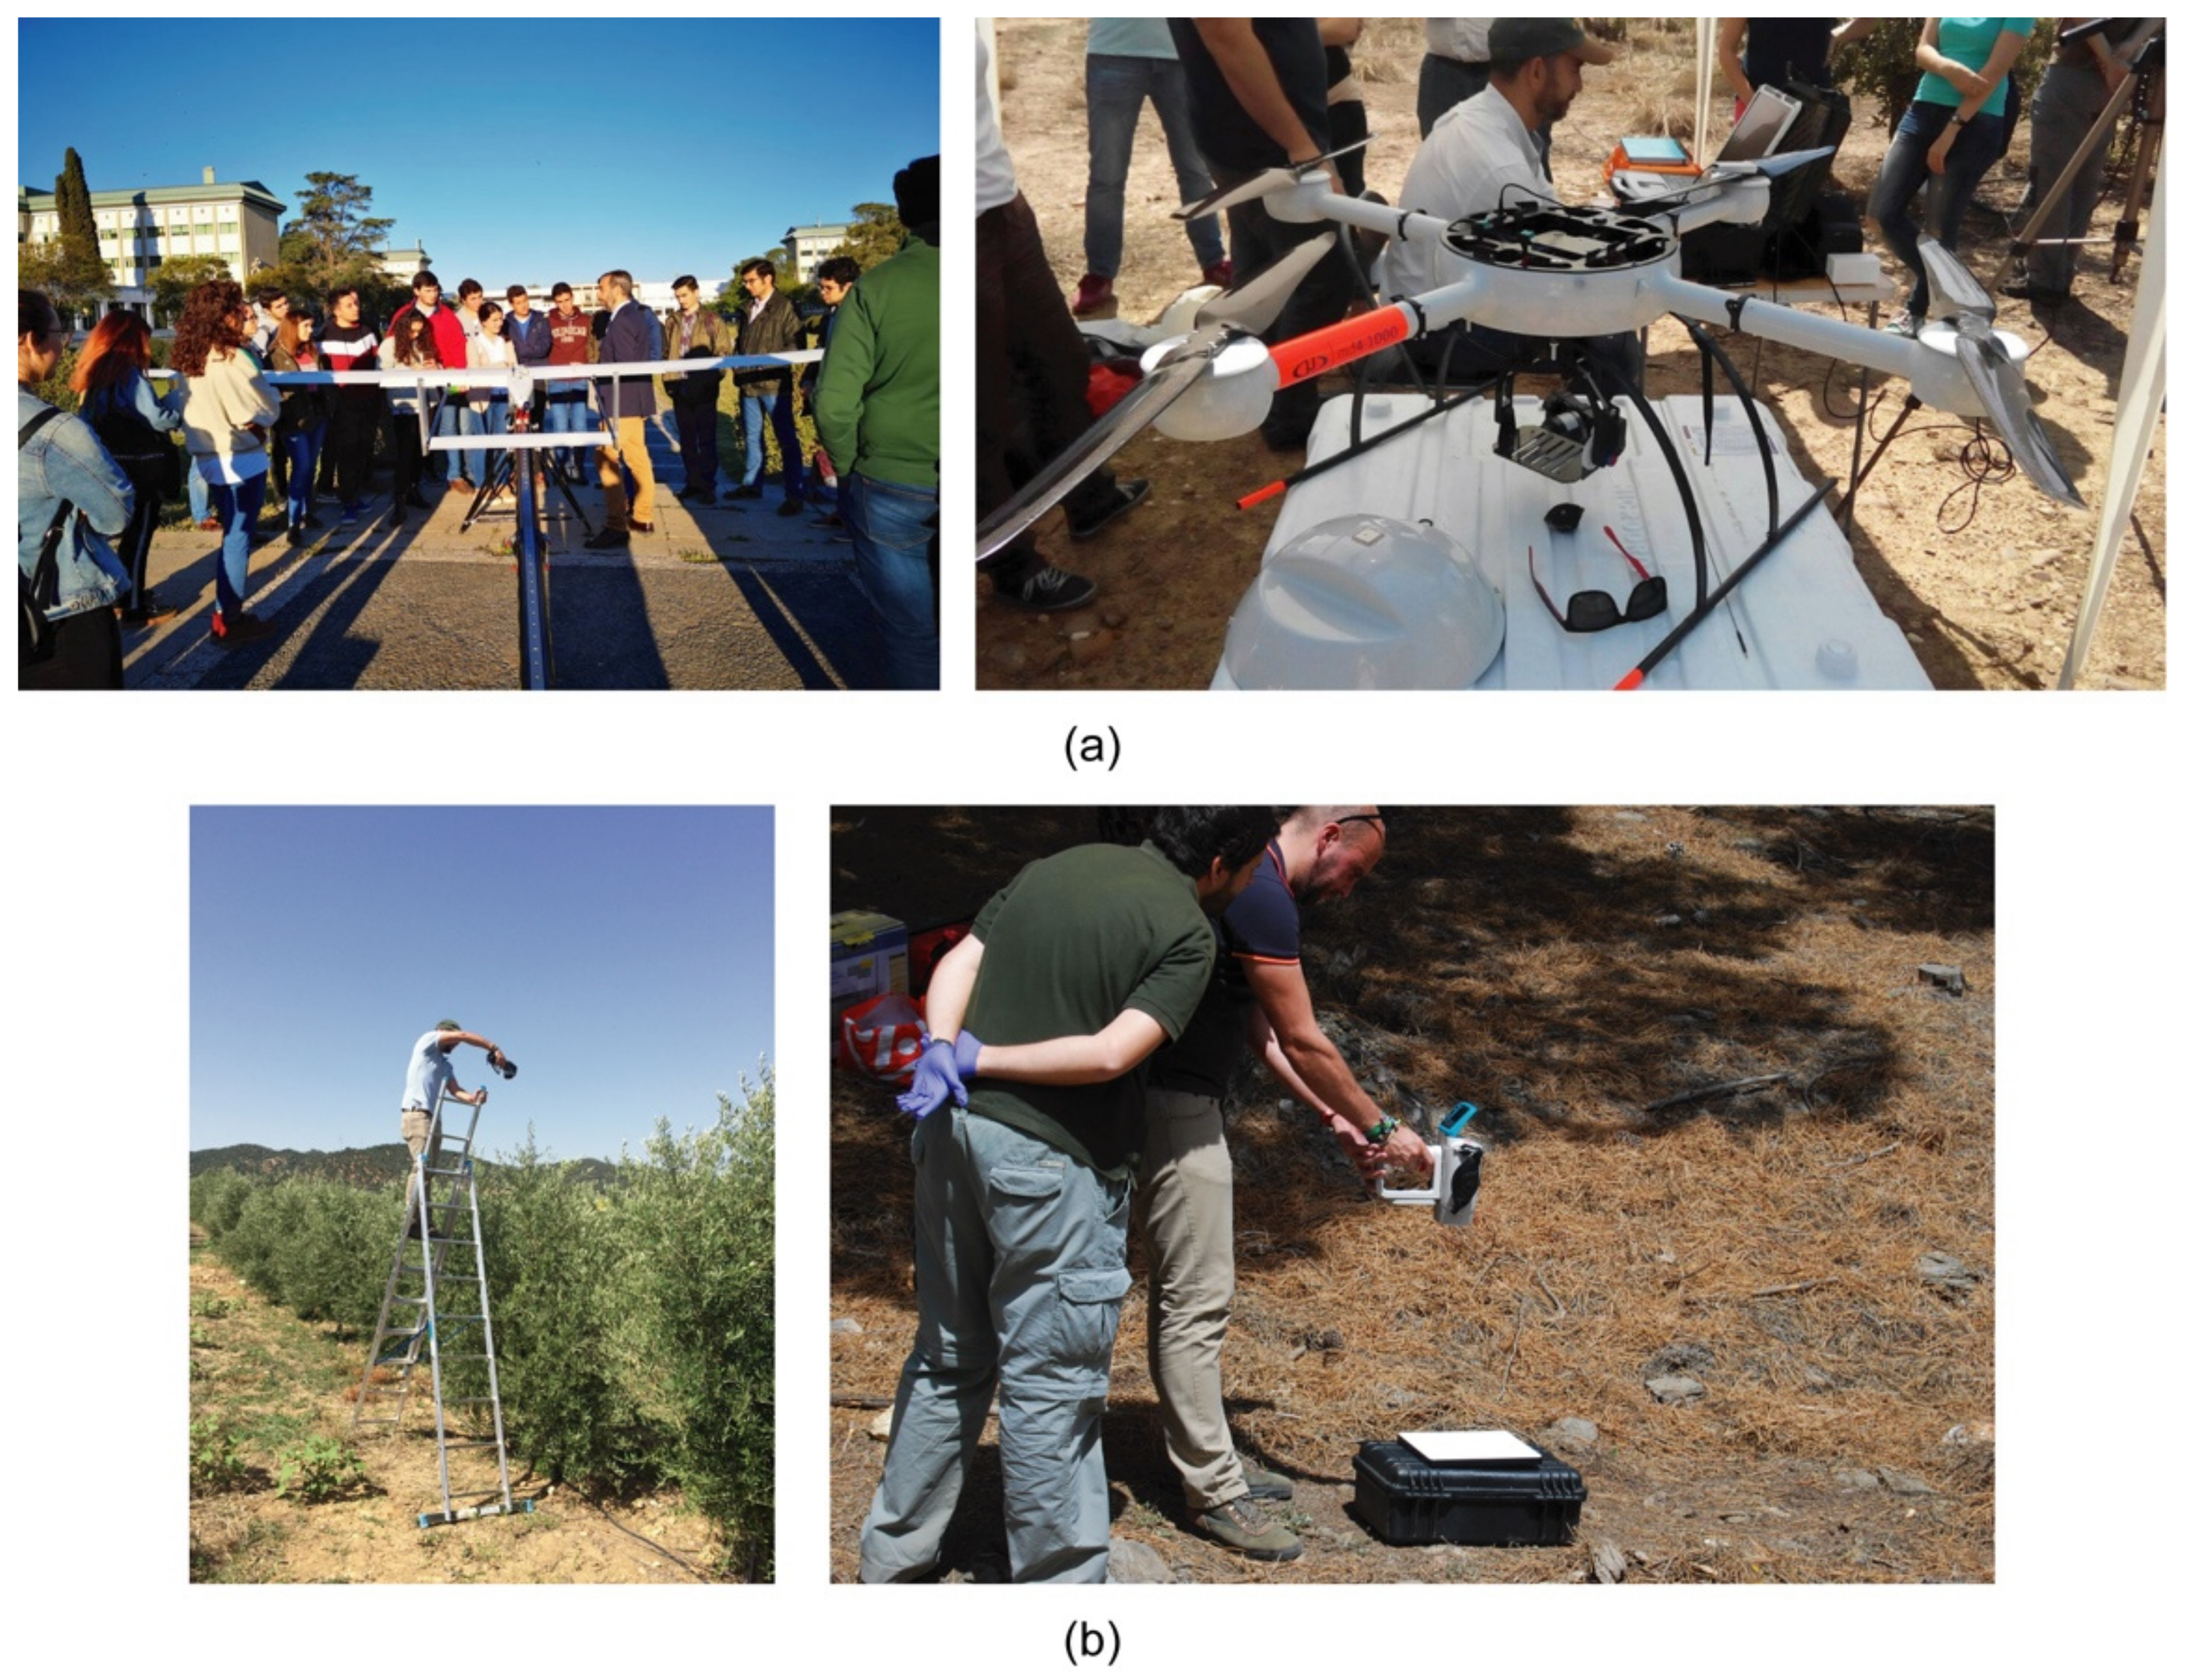
Students participate actively in the learning process by collecting field data, developing scripts, and analyzing results (
Figure 6). As such, from the beginning the students are motivated and involved in the learning process, awakening the desire to learn new tools, methodologies, and RS methods with direct application in agriculture. This mainly stems from two aspects. Firstly, students have access to and use of sensors, flight platforms, and scientific-professional instruments acquired by the research group over the years. Secondly, being able to do real fieldwork on an experimental farm allows the results from RS to be subsequently validated.
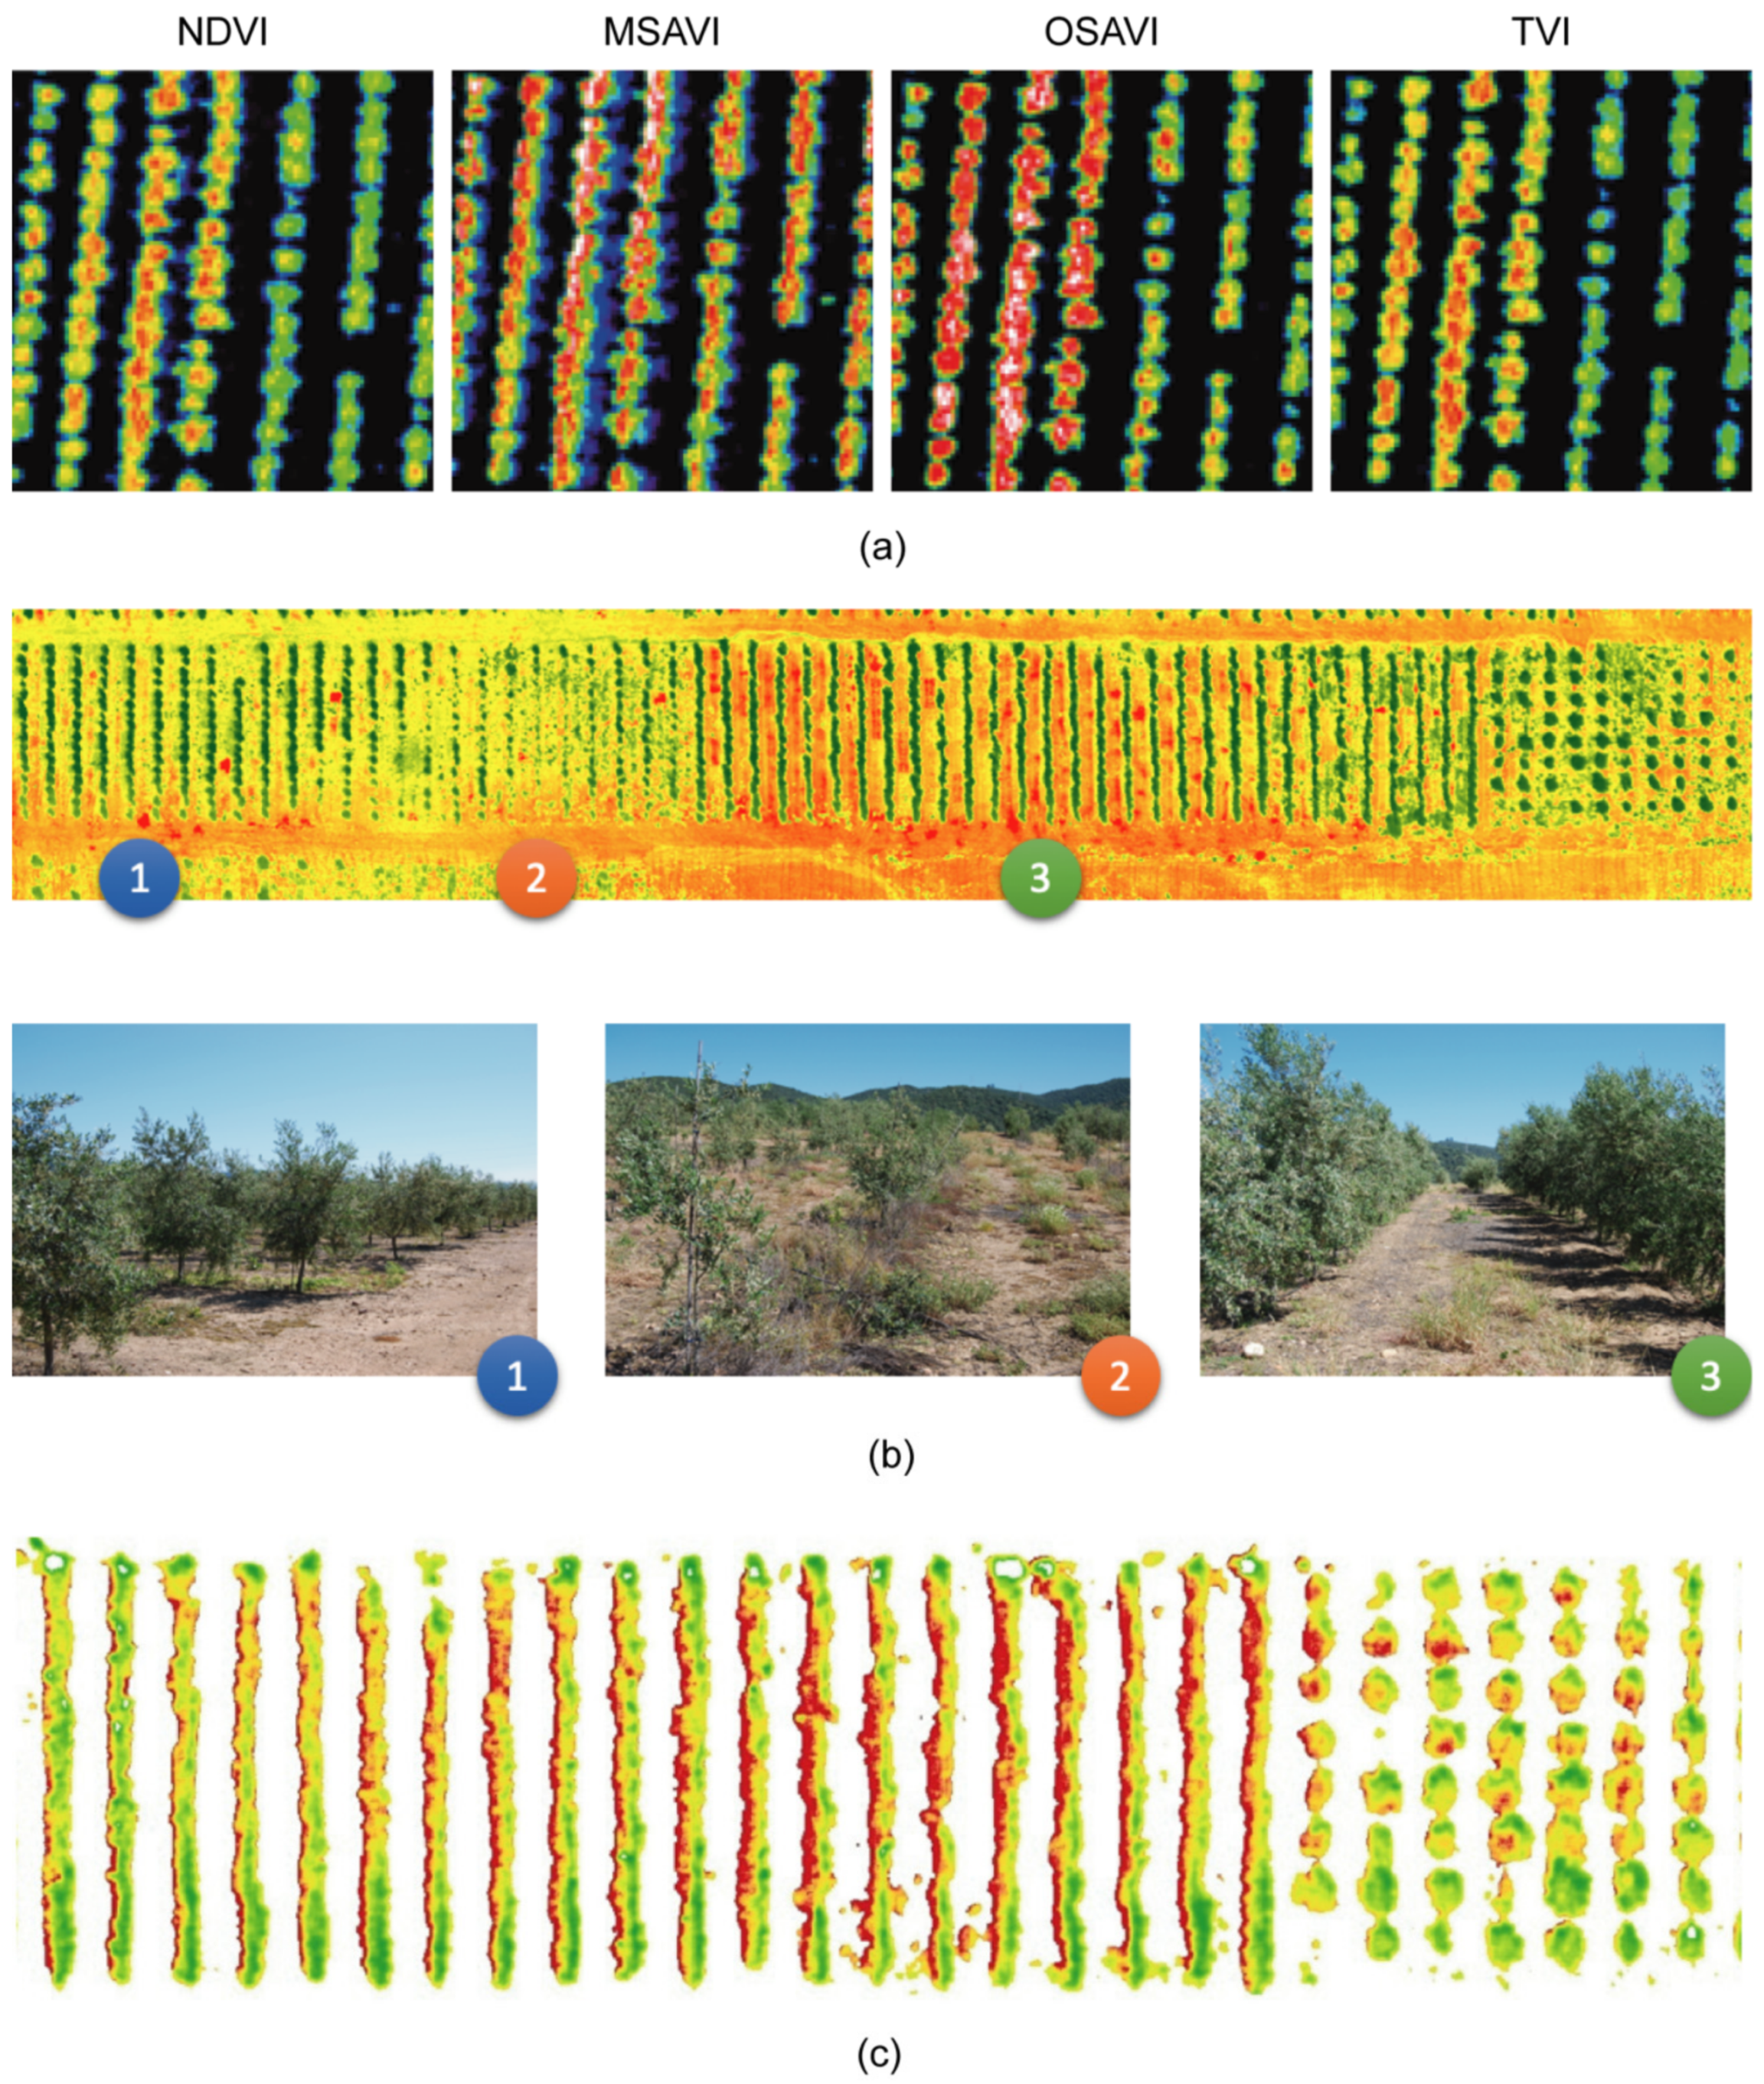
As a result of the learning process, some of the products produced by students are presented as examples in
Figure 7. Using multispectral sensors, students calculate different vegetation indices (
Figure 7a). Once these differences associated with the vigor of the tree have been detected, the student must analyze the cause. In the same manner, the students analyze the results obtained in the thermographic orthomosaic (
Figure 7b). As in the previous case, they validate the results obtained in the field. Being able to work in the "nature classroom" allows students to personally check the characteristics of the soil or the development of the crop. In the case of
Figure 7b, a relationship is shown between the temperature map and the photographs of the crop that explain and justify these differences. Finally,
Figure 7c shows part of a water stress map. In this case, the students found out which area of the plot was under deficit irrigation.
To date (2018/19 academic year), the course “UAVs in the Agroforest Sector” has been taught over four academic years. In these four editions, the University of Córdoba has surveyed students through the teaching quality system, currently with full data from the first three courses.
Table 5 summarizes a total of 21 questions evaluated between 0 (lowest qualification) and 5 (highest qualification) represented in three sections including course planning, course development, and learning evaluation. Since the course’s inception, students have evaluated the subject positively, marking high qualifications, close to 5 in all sections. Regarding the “Course Planning“ section, students know from the first day of the course how the subject is planned, what they are intended to do, and what capacities are to be developed and achieved throughout the course.
As related to the “Course Development” section, students evaluate whether adequate resources have been used, if the bibliography and other sources of information are useful, if the lecturer explains the contents with clarity, and if the students are interested in the subject. This section, having scored 4.56 out of 5 in the first year, is the one that has improved the most. This improvement is the sum of several factors. Firstly, the research of the teaching staff in UAV-RS is directly projected in the quality of the subject. In addition, having access to adequate instruments is an added benefit that students value positively.
In the “Learning Evaluation” section, students answer two questions: a) Do I know what will be required of me to pass the subject? and b) Are the criteria and evaluation systems adequate? The feedback received from the students encourages the department to continue with this teaching system. Year by year, students score this section higher demonstrating that students favor PBL to traditional methods, which in turn, leads to greater student engagement.
In addition to the results of the quality survey, our personal impression is that students value this teaching method. Being able to use these technologies in a real world-simulation field they can visit whenever they want makes them feel involved in the learning process, which results in stronger educational drivers. Of all the content of the subjects, the development of scripts is the most difficult task for them. Even so, each year students are more receptive to this kind of challenge, likely because they are progressively more aware of the undergoing technological changes in agriculture.
Although the results are positive, in order to improve the quality of the subject it is important to keep the subject dynamic, adapted, and updated in content. For this reason, the research group will start working with hyperspectral sensors in 2019. Once the knowledge and experience acquired are adequate, these sensors will be introduced into the learning process. Furthermore, additional crops will be introduced and students will be distributed into workgroups. Each group will center on an assigned crop and the results obtained will be shared among the groups.

 ,
, 


