1. Introduction
As a widely cultivated crop and staple food in the world, wheat (
Triticum aestivum L.) is crucial for ensuring food security. Unfortunately, its production is limited by many abiotic and biotic stresses. Among biotic stresses, fungal diseases are the most important. Worldwide, one of the most devastating fungal diseases of wheat is Fusarium head blight (FHB) or scab, which is caused by a number of different
Fusarium species, but most commonly
F. graminearum. FHB attacks wheat spikes, which causes yield losses as high as 40% under severe epidemics [
1]. In addition to causing yield losses, FHB pathogens also produce mycotoxins that can contaminate the grain, often rendering it unusable. One of the most common mycotoxins produced by
F. graminearum in grain is deoxynivalenol (DON), which is toxic to humans and animals, especially swine. When humans ingest grain contaminated with DON, the common symptoms include vomiting, dizziness, and nausea [
2,
3]. Due to the problems associated with this mycotoxin in food and feed chains, DON levels in grain are routinely assayed.
The development of resistant varieties is one of the most important means for ameliorating the impact of FHB. However, the tasks of manually phenotyping FHB severity on hundreds of lines in the field and selecting based on resistance is a costly, labor-intensive, and time-consuming process. Moreover, conventional phenotyping protocols suffer from inaccurate subjective assessments (raters often do not capture the true level of disease), rater-fatigue (people tire quickly from this work), and inter-rater variation (individual raters will score diseased kernels on spikes differently), which are all factors contributing to increased experimental error in the disease assessments [
4]. It is clear that breeding programs and research requiring FHB field phenotyping would be well-served by developing a high throughput phenotyping system.
FHB pathogens infect spikelets (i.e., inflorescence unit comprised of two glumes surrounding one or more florets) within the wheat spike. In doing so, they destroy the tissue, altering the chlorophyll and water content as well as the structure of the organ [
5]. Thus, the optical properties of infected florets are different from those of healthy florets within a spike. Innovations in sensors and data processing methods offer potential methods to detect FHB, and techniques such as hyperspectral and color imaging have been investigated.
Hyperspectral imaging can provide considerable spectral and spatial information. A hyperspectral image contains hundreds of images that correspond to each wavelength [
6]. This technique has been used to detect several crop diseases [
7,
8,
9]. With respect to FHB, Ropelewska et al. [
10] designed a hyperspectral imaging system to capture images of infected and healthy wheat kernels and then used the MaZda software to extract approximately 200 textures at selected wavelengths. The researchers analyzed these features to develop classification models to distinguish infected wheat kernels, and the accuracy attained was 94%–100%. Similarly, Barbedo et al. [
11] processed hyperspectral images of a wheat kernel and segmented them from the background using four selected bands. After completing the tests, they selected a wavelength of 1411 nm to define a
Fusarium index, which could indicate the likelihood of the kernel being infected by FHB. Whetton et al. [
12] scanned a wheat canopy using a hyperspectral imager and obtained complete spectral data for wheat spikes. Then, these researchers used partial least squares regression (PLSR) analyses to establish models that could assess the percentage of coverage by FHB. Bauriegel et al. [
13] applied principal component analysis to identify four wavelength ranges (i.e., 500–533, 560–675, 682–733, and 927–931 nm) and used them successfully to distinguish diseased and healthy wheat spikes. The previously mentioned studies were all conducted under laboratory conditions. The researchers also investigated the potential of applying hyperspectral imaging for detecting FHB in the field. Whetton et al. [
14] continued their work of processing hyperspectral images collected in winter wheat fields, with a spectral range of 400–1000 nm. PLSR was used to predict FHB and assess disease severity, and the residual prediction deviation value was 2.27. Furthermore, Jin et al. [
15] designed a system for collecting hyperspectral images of wheat spikes in the field. A deep neural network (DNN) was used to classify diseased and healthy pixels, and the accuracy reached as high as 74.3%. Most studies have selected several specific wavebands and have developed models or proposed indexes using machine learning to detect FHB. In recent years, DNN has been extensively implemented in processing hyperspectral images and has exhibited excellent performance [
16]. Although hyperspectral imaging can be useful in detecting FHB, several problems limit its application. First, hyperspectral imaging is costly and, thus, difficult to widely promote. Second, some specific accessories (e.g., calibration board, stage, and objective lenses) are essential when collecting hyperspectral data, especially in the field. Lastly, the extraction of information from huge hyper-spectral data sets is challenging [
17].
Alternatively, color imaging is inexpensive and is easy to handle. Color imaging can capture the color and texture information of an object, and has been implemented to detect and assess plant diseases [
18,
19,
20]. For
Fusarium or FHB detection, researchers have explored the usefulness of color imaging. Cambaza et al. [
21] found that color imaging can be applied to monitor
Fusarium based on the color differences between healthy and infected oat grains. The textural features from channels R (red), G (green), B (blue), and other color models were analyzed to develop classification models. Ruan et al. [
22] used 55 color and texture features to develop a four-layer neural network to estimate the percentage of visual scabby wheat kernels. Color imaging was also investigated to recognize wheat spikes under field conditions, which provides the basis of identifying FHB infection. Bakhouche et al. [
23] extracted seven features including mean, variance, energy, entropy, contrast, skewness, and kurtosis of intensities, from wheat color images, and then used the K-means algorithm to detect spikes. Li et al. [
24] used the Laws’ texture energy method and trained a classification model using a neural network. Zhu et al. [
25] chose the RGB (red, green, blue), Lab (L for lightness and a and b for the color-opponent dimensions), and HSV (hue, saturation, value) color spaces. The researchers applied all color components to train a support vector machine (SVM) model that can detect wheat spikes. Zhou et al. [
26] proposed an approach using a color feature (color coherence vectors), a texture feature (gray level co-occurrence matrix), and an image feature (edge histogram descriptor) to train a twin SVM model. Thus, this successfully extracted each spike pixel from the background. In summary, specific features were extracted or calculated from color images and used as input parameters of classification models. The models were trained to detect FHB or spikes. Most recently, Hasan et al. [
27] tested a Faster Region-based Convolutional Network (RCNN) model to detect spikes and output their bounding boxes. Pound et al. [
28] trained a deep convolutional neural network (DCNN) model that localized wheat spikes in the laboratory. Generally, extracting features is not necessary, since accurate models can be obtained using a sufficiently large dataset. Deep learning (DL) is promising for detecting wheat spikes and FHB, but its application requires further exploration [
29,
30].
Assessment of FHB levels in the field is important for a number of different applications such as breeding for resistance to the disease, assessing the efficacy of various disease management practices (e.g., fungicide applications and crop residue treatments), and determining crop quality for various end uses. Therefore, accurate assessments of FHB on wheat plants in the field, particularly quantitative ones, are very important. To obtain enough sample data for accurate assessments of FHB, a population of spikes must be assessed. This requires not only distinguishing the boundaries of individual wheat spikes but also resolving which florets within the spikes are diseased or healthy. Previous studies have revealed the potential of color imaging for assessing FHB infection in wheat spikes. Moreover, DL techniques can improve the efficiency of color imaging.
Therefore, our study focuses on the usefulness of color imaging collected in the shadow condition and the application of DL techniques for assessing FHB infection in wheat. The specific aims of this study were to: (1) train a DCNN model that can extract individual wheat spikes from one image with a complex background and (2) propose a novel approach to detecting FHB-infected areas from each spike.
The remainder of this paper is organized as follows.
Section 2 briefly describes the data collection, DCNN model training, and the methods of FHB detection.
Section 3 provides the results of model training and FHB detection in detail.
Section 4 discusses the analysis results and the shortcomings of this study, with proposals for improvements. Lastly, the conclusions are provided in
Section 5.
2. Materials and Methods
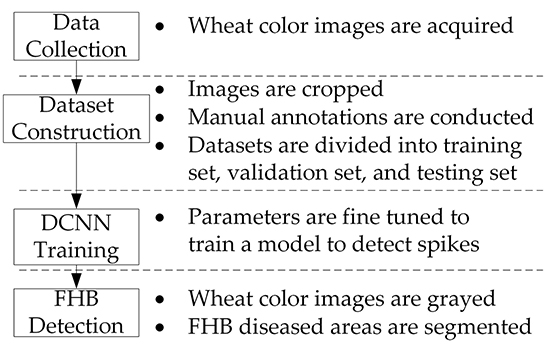
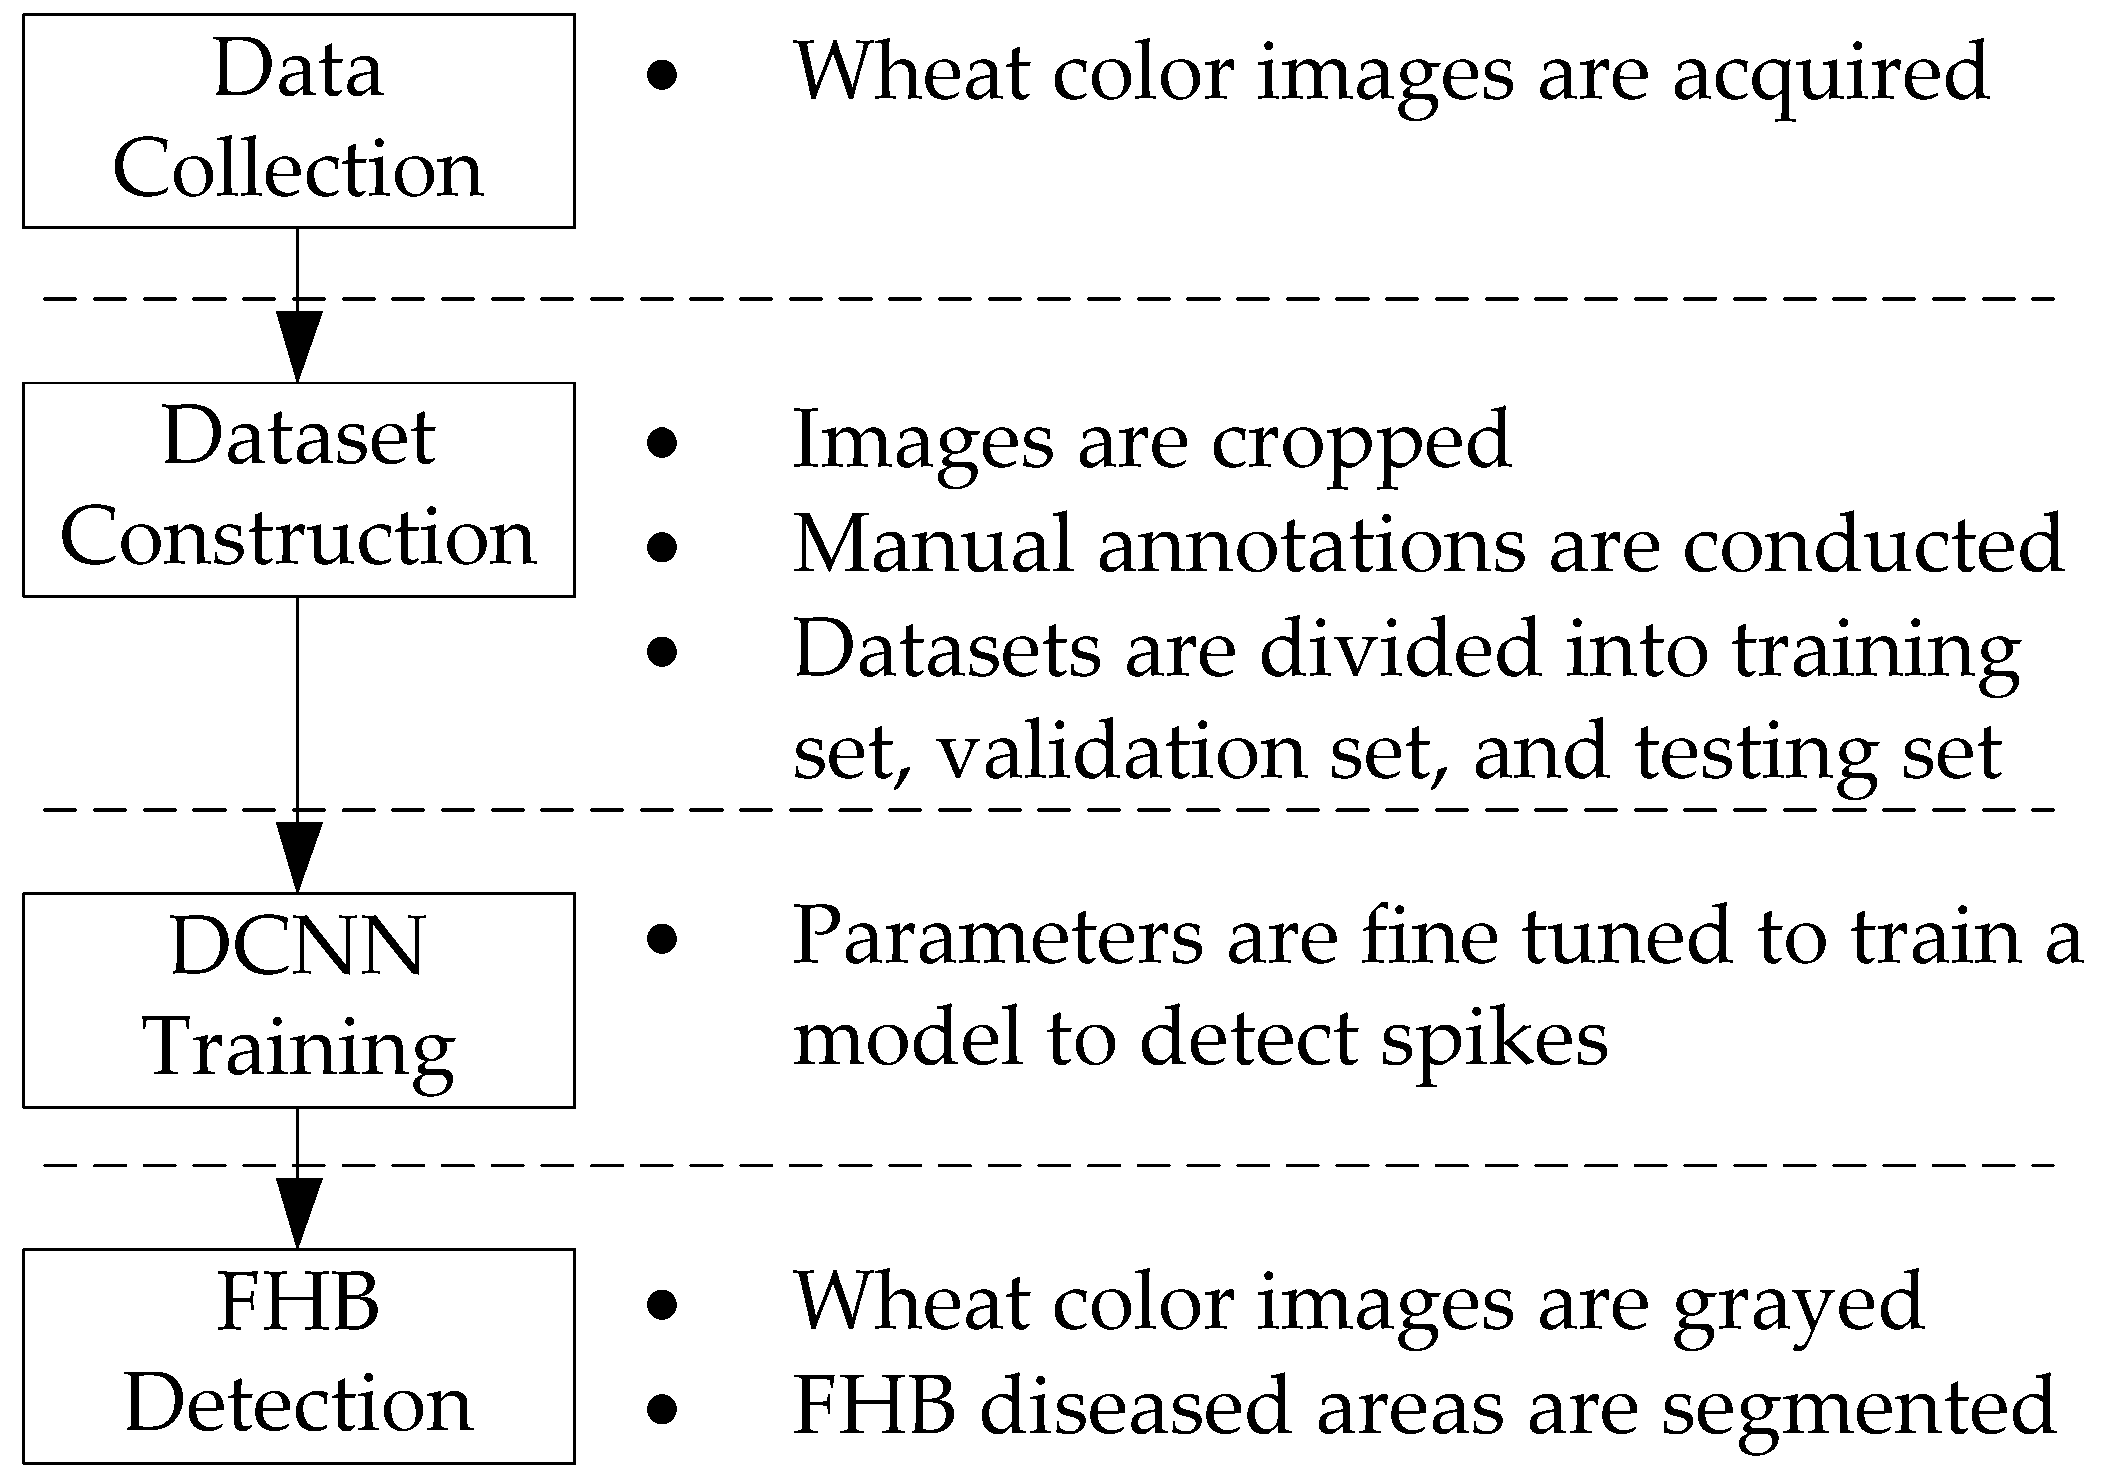
The workflow of our system is depicted in
Figure 1. The system involves four main steps including data collection, dataset construction, DCNN model training, and FHB detection. Each step is described in detail in the following sections. A desktop computer with a 3.4 GHz AMD R5-2600 CPU, NVIDIA GTX 1070 (8 GB memory), and 8 GB RAM was utilized for offline processing.
2.1. Data Collection
Three wheat lines were cultivated in plots of approximately 1.6 m × 0.7 m (length × width) on the St. Paul campus at the University of Minnesota (Minnesota, USA). The wheat lines selected had different levels of susceptibility to FHB and included Wheaton (susceptible with awns (i.e. bristle-like appendages extending from the glumes, i.e. outside bracts of the spikelet)), Roblin (susceptible, awnless), and MN00269 (late maturing susceptible, awned). To initiate FHB infection in the plots, all lines were inoculated using the grain spawn method [
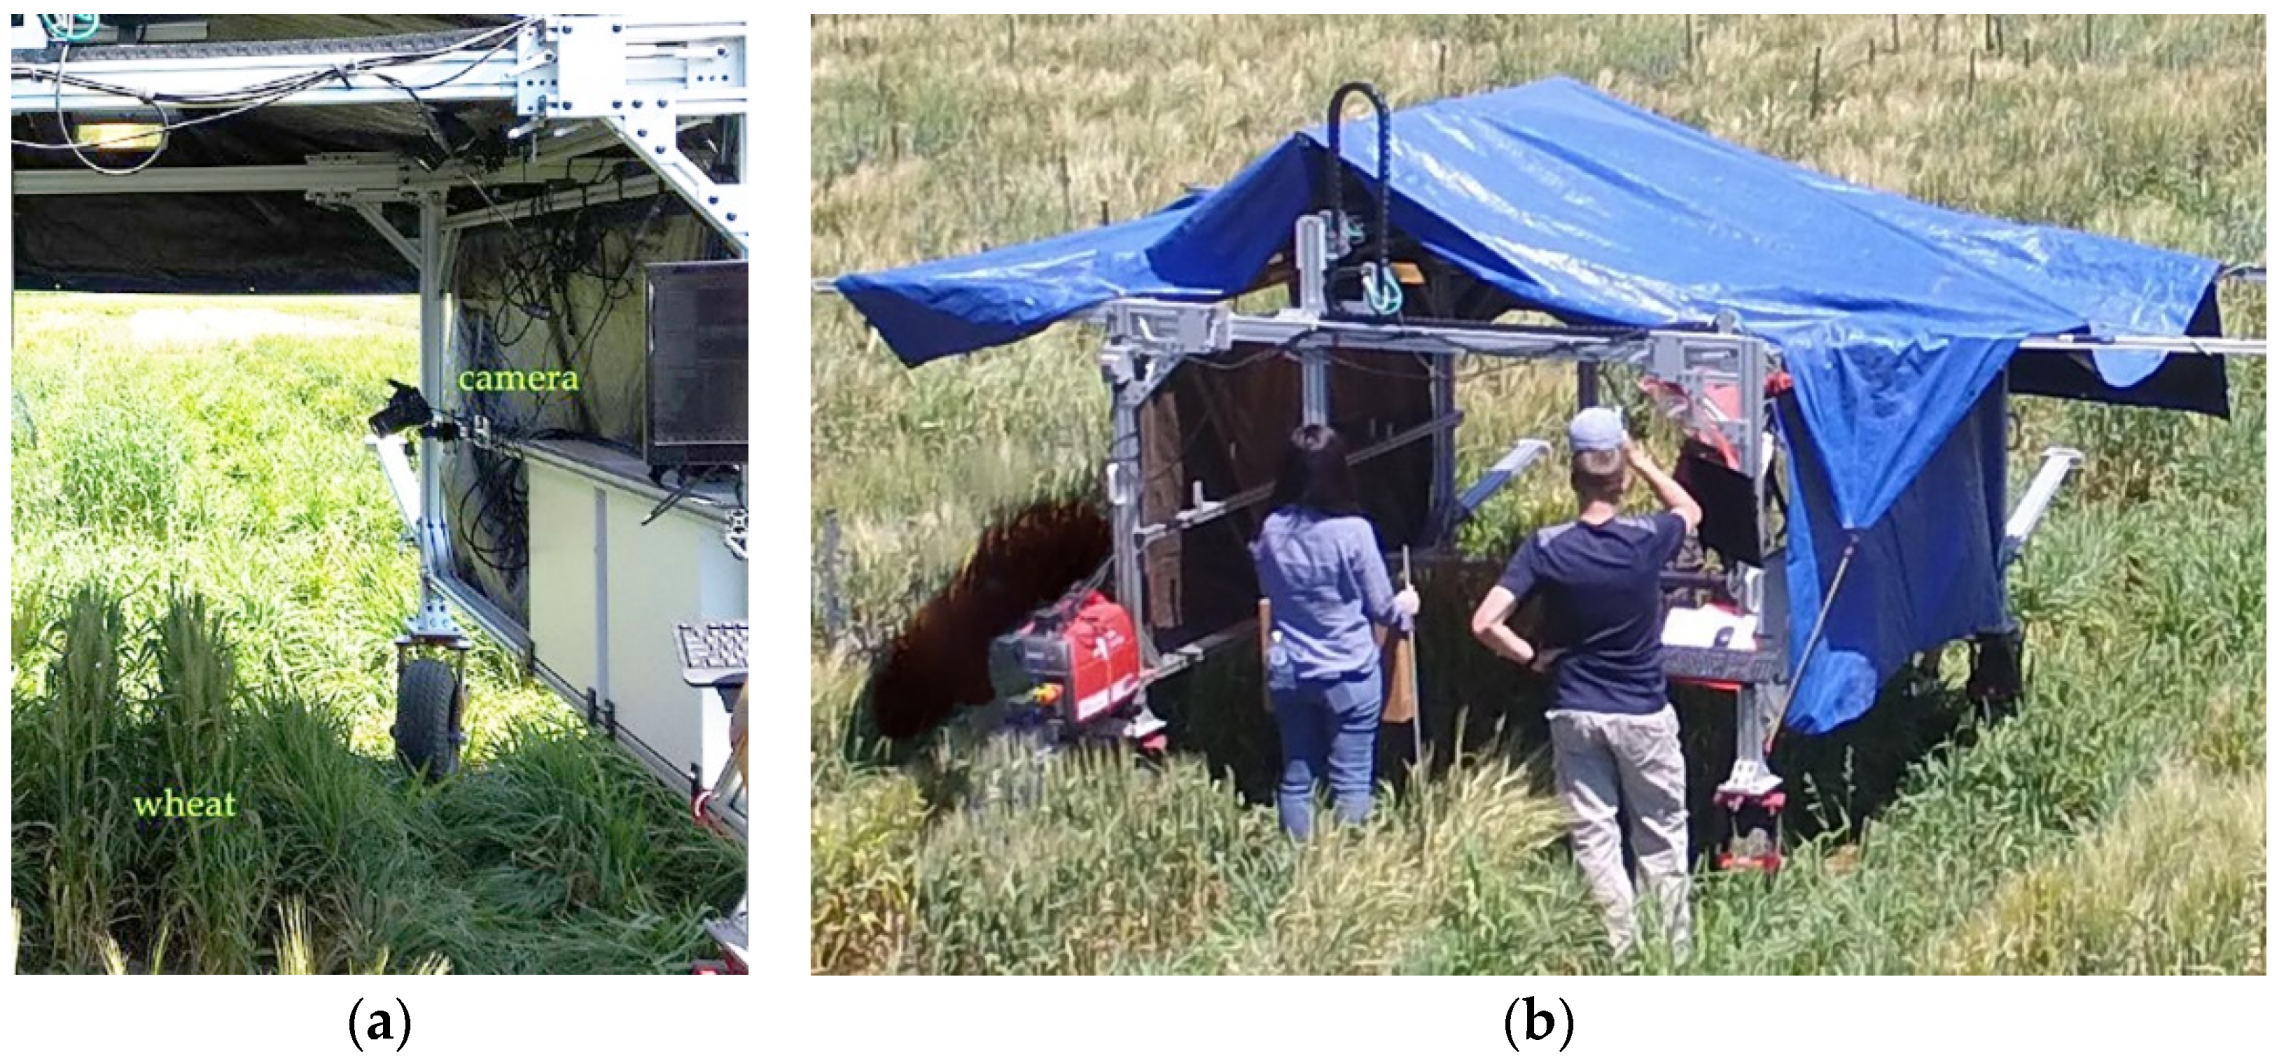
31]. Collection of images was performed with a phenotyping platform (approximately 2.7 m × 2.5 m, length × width) between 11:00 and 14:00 on 16 July, 2018, during which most of the wheat lines were at the milk stage of development. The phenotyping platform was manually advanced and stopped to capture the wheat images. A camera (Canon EOS Rebel T6i) with a large field of view was installed on the platform, as illustrated in
Figure 2a so that the entire wheat plot was captured in each image. In addition, a shelter was designed to achieve uniform light on the subject matter (
Figure 2b). The camera was controlled through an onboard computer to collect the wheat images. All images were saved in a JPEG (Joint Photographic Experts Group) compressed format for later analysis. The captured images have a 6000 × 4000-pixel resolution. In total, 12 images were collected including four images of each of the three wheat lines.
2.2. Data Augmentation
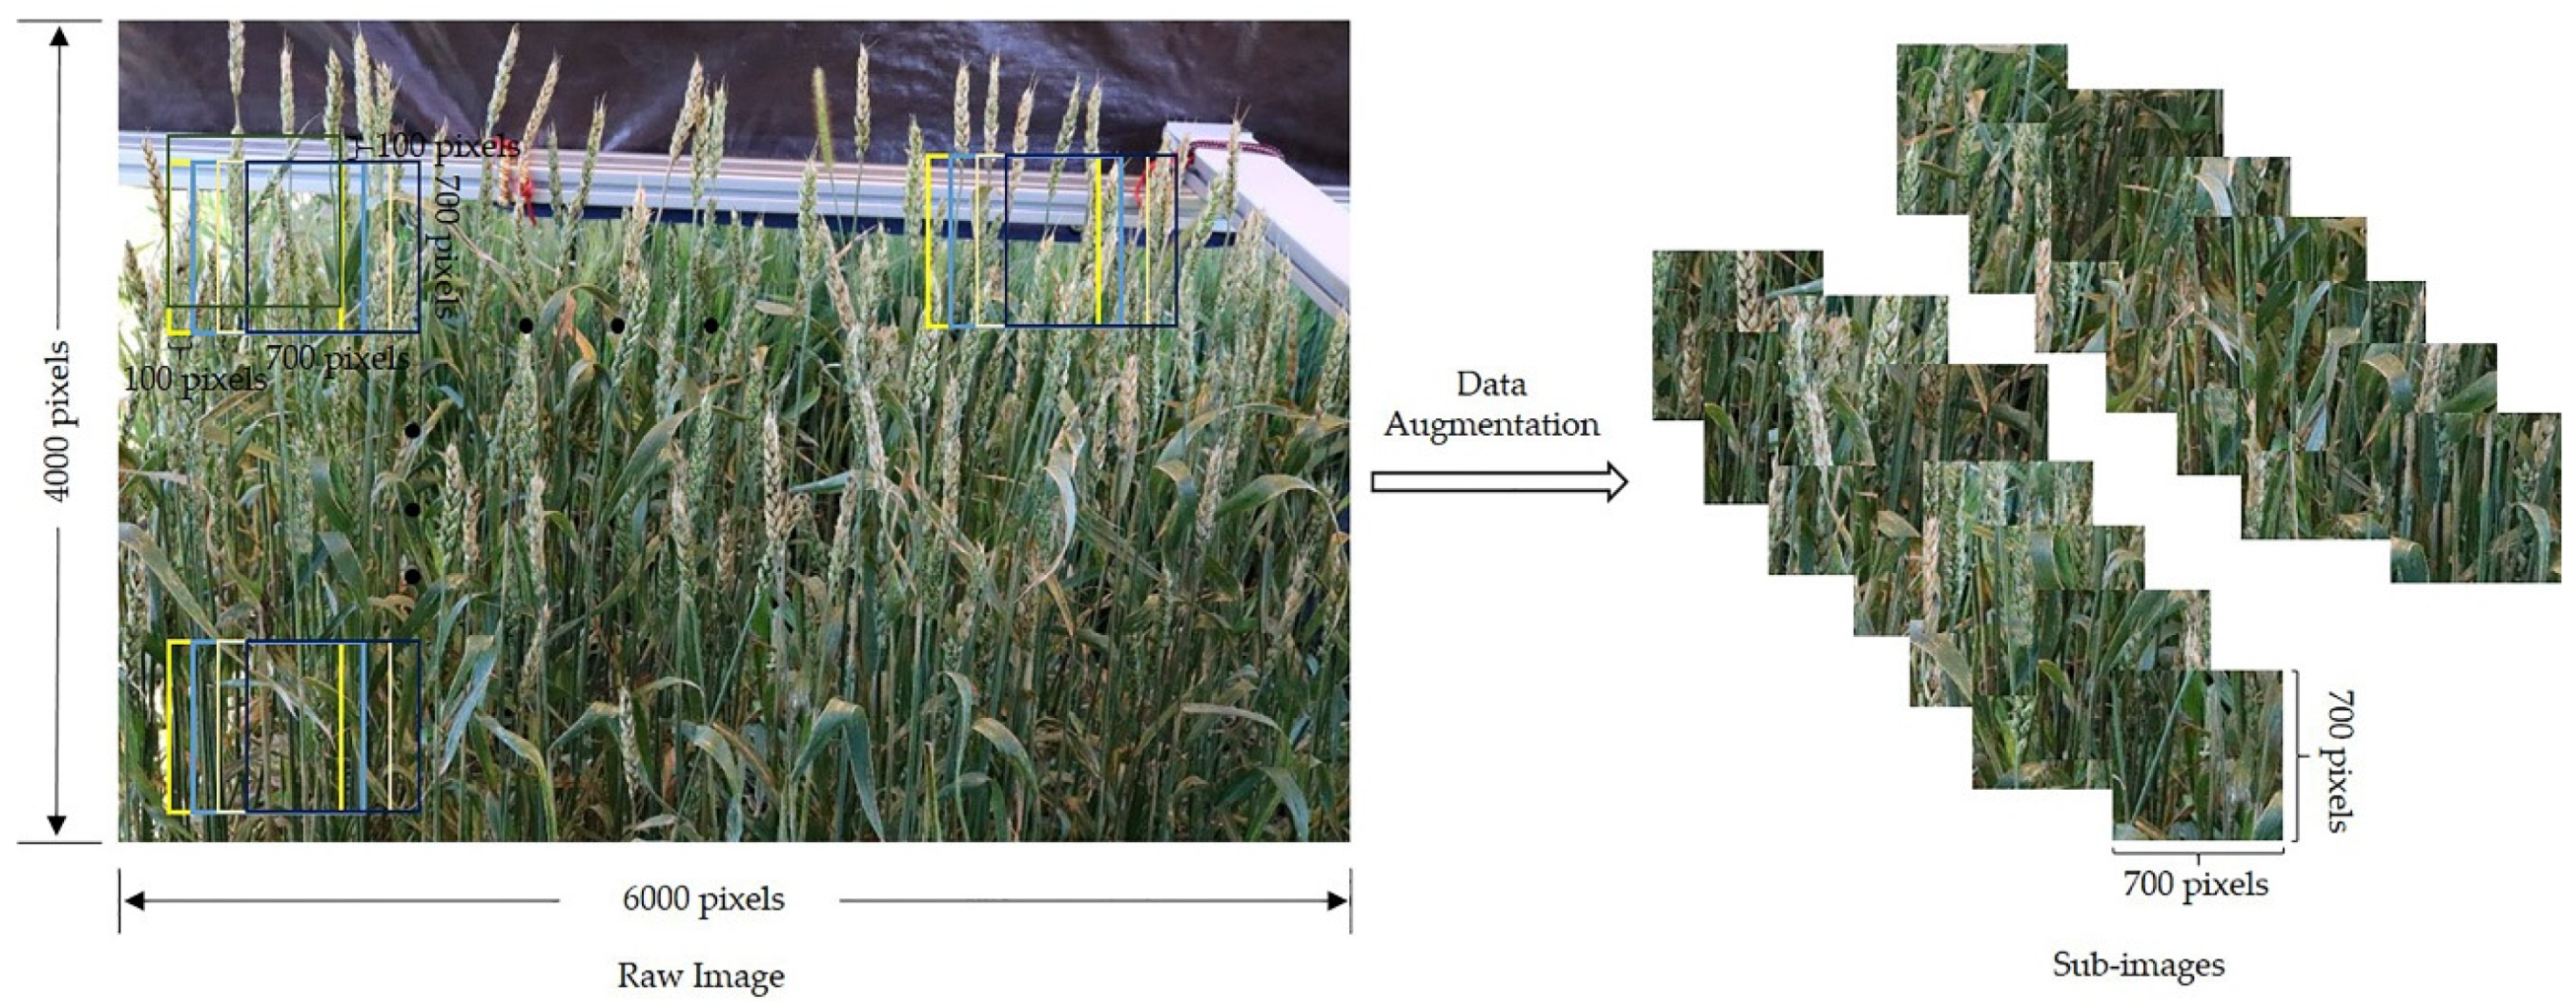
This small set of images (12 images) was insufficient to train the DL model. To increase the sample size, two common steps were performed. First, the raw images were divided into smaller sub-images, as demonstrated in
Figure 3. The sub-images were 700 × 700 pixels in resolution with 100 overlapping pixels between adjacent images. Then, additional datasets were generated by mirroring the sub-images horizontally and vertically. In the end, 2829 images were generated after the augmentation.
2.3. DCNN Model
The ultimate goal of this study was to reliably detect diseased areas of individual spikes, which is a task where object detection techniques are key. The first essential step in this process is detecting the boundaries of the spikes and removing the background. Based on the DL technique, He et al. [
32] proposed the Mask RCNN model, which can not only classify objects, but can also output their outlines at the pixel level. It extends the Faster RCNN model by combining classification, bounding boxes, and mask generation, which enables instance segmentation. Specifically, Mask RCNN has two main steps. First, it scans an image and generates numerous probable anchor regions using the region proposal network to extract features. Second, the regions are evaluated and classified, which generates bounding boxes and masks. In addition, the “RoIAlign” layer was proposed to improve the segmentation accuracy, and loss function (
L) was defined as function (1).
where
Lcls,
Lbox, and
Lmask represent the classification, bounding box, and mask losses, respectively.
In the present study, Mask RCNN was implemented using Tensorflow API. The model was pre-trained using the COCO dataset [
33], and only the last few layers were trained and fine-tuned using transfer learning. ResNet 50 and ResNet 101 [
34] are two backbone network options. The former was used in this case given its accuracy and small training dataset. Batch normalization was applied to prevent overfitting. The batch size was set to 2 because it requires only a small amount of memory. Five scales (i.e., 32, 64, 128, 256, and 512) and three ratios (i.e., 0.5, 1, and 2) were set for the anchors. If the values of intersection over the union ratio with the ground-truth bounding boxes were higher than 0.5, the anchors were considered to be available. The other parameters were configured to the default setting.
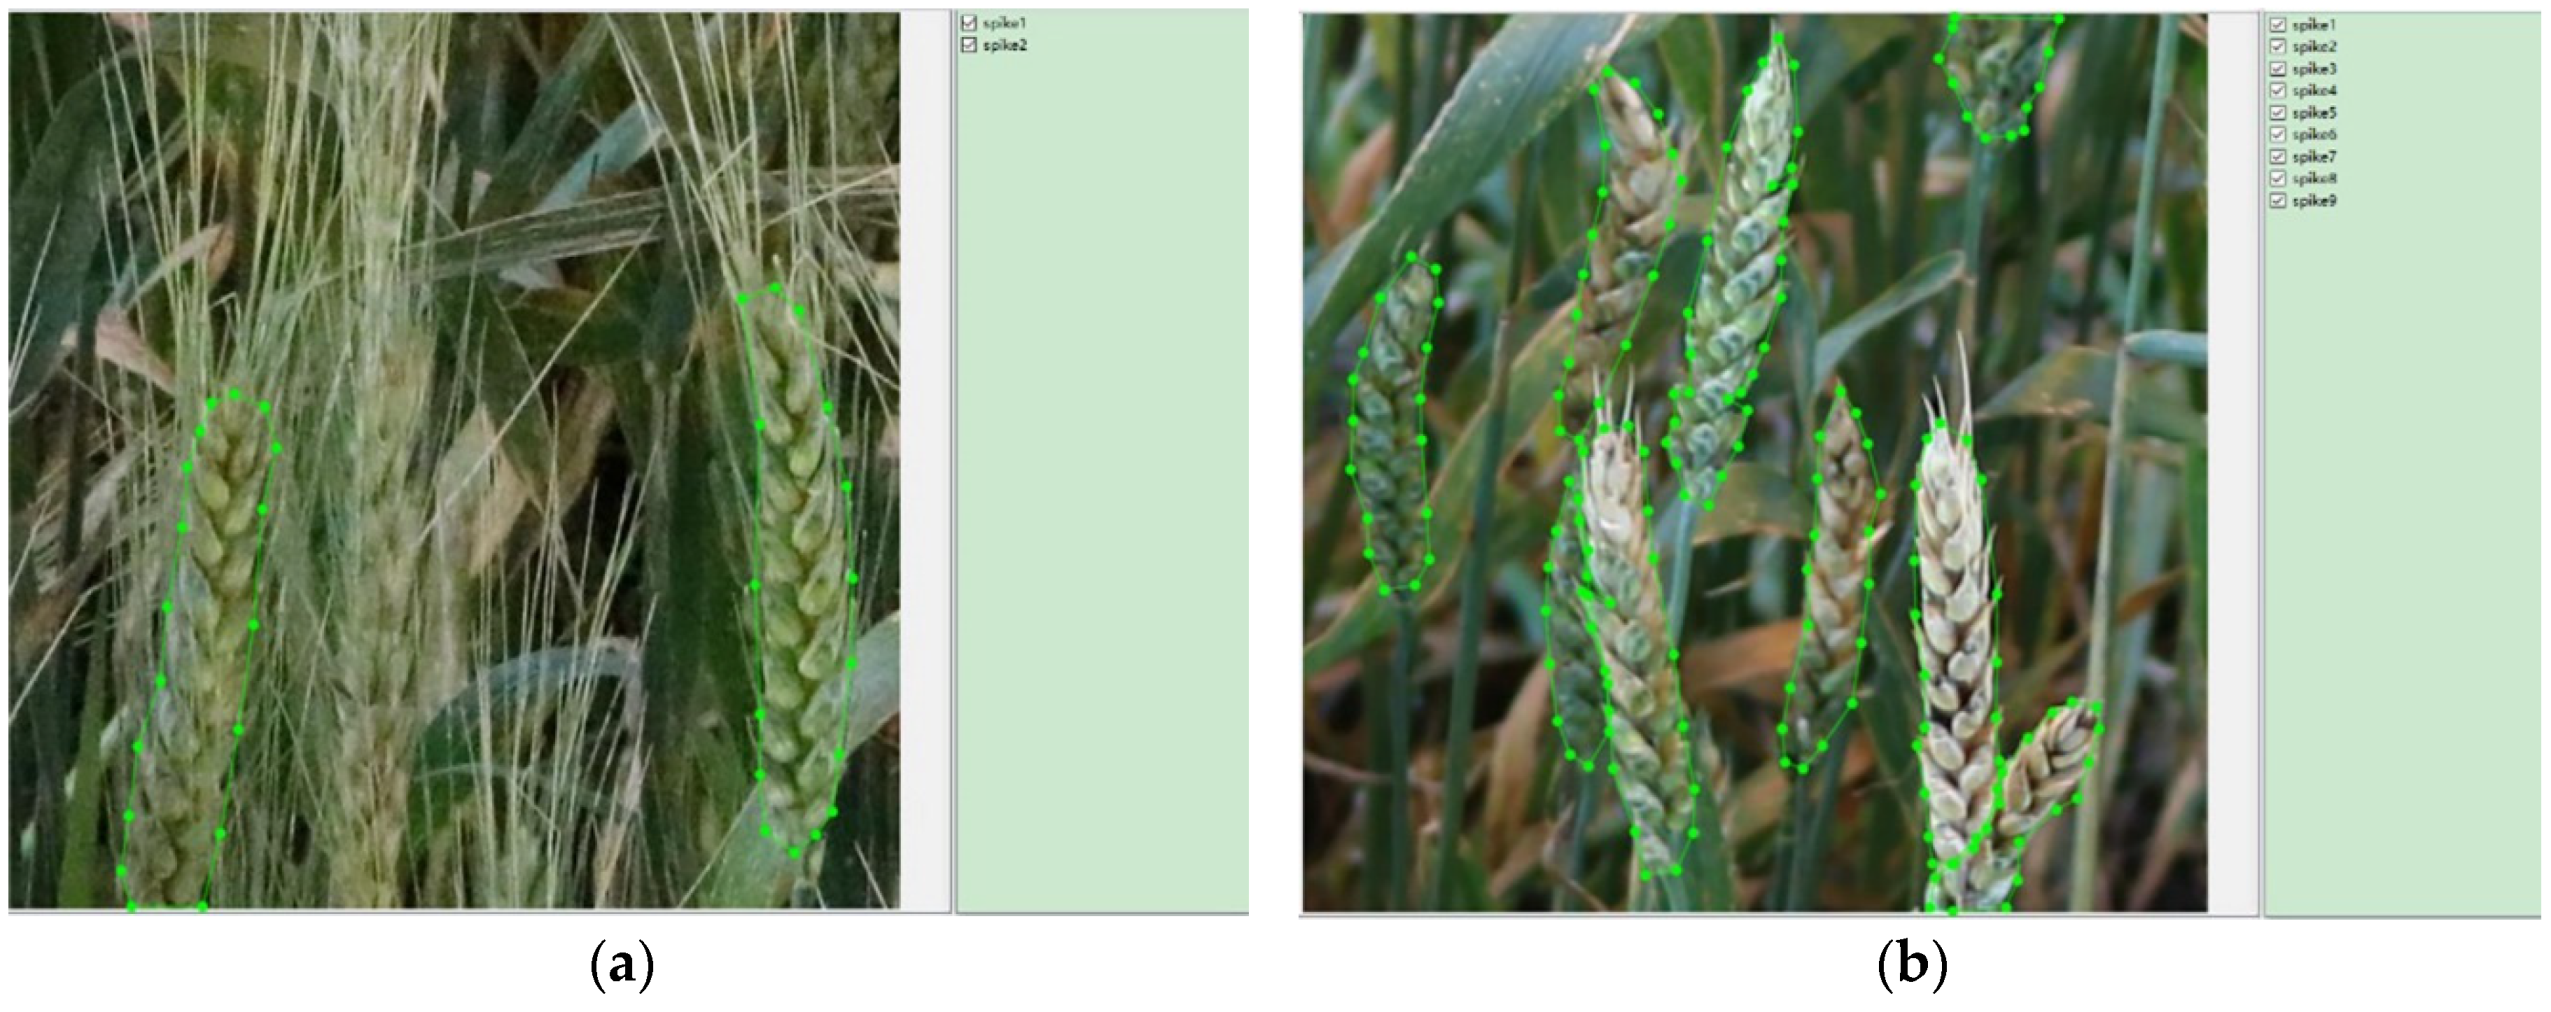
Before training the model, a training dataset and a validation dataset were annotated. An open-source software, Lableme [
35], was used to label the datasets. Then, the spikes were selected and labeled the “spike” class by drawing polygons manually, as exhibited in
Figure 4. Furthermore, the software generated JSON (JavaScript Object Notation) files that record the boundaries of the spikes.
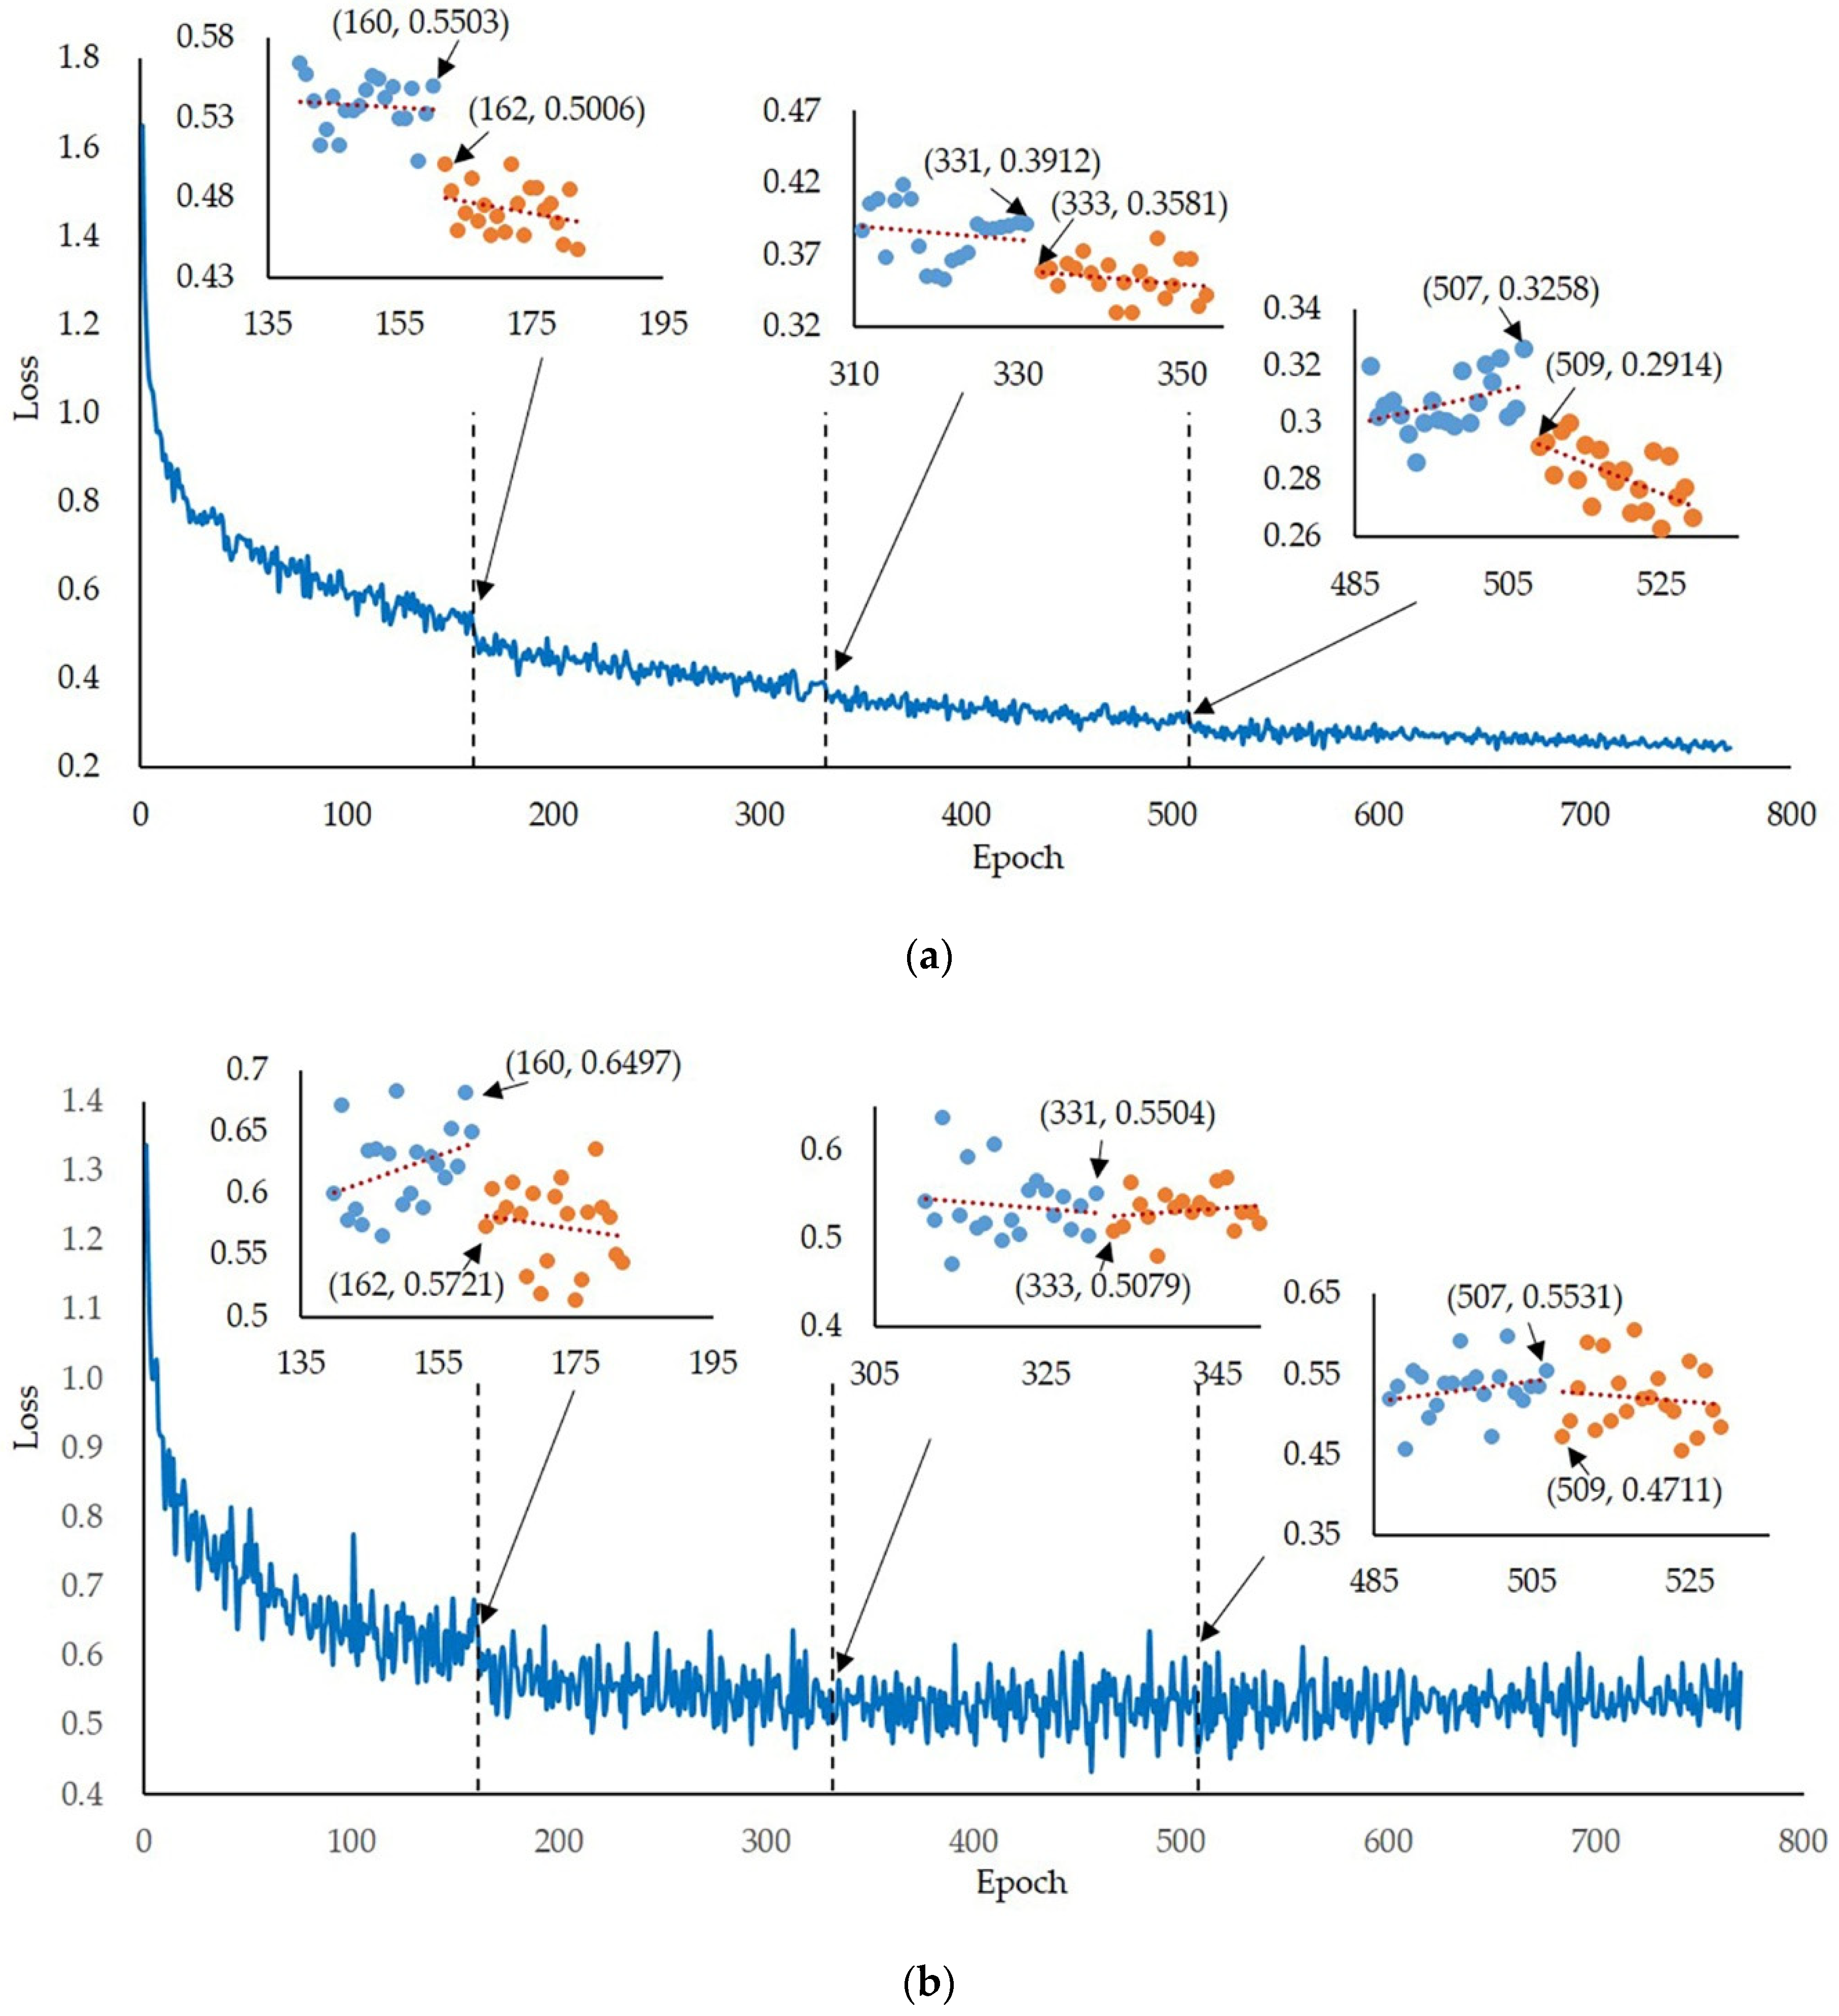
The model was retrained on a desktop computer with CUDA 9.0. A dataset containing 1959 images (Wheaton: 595 images, Roblin: 970 images, MN00269: 394 images) that were randomly selected from 2829 images was obtained as the training dataset. Among these images, 989 and 970 represent awned and awnless wheat spikes, respectively. A total of 420 (Wheaton: 101 images, Roblin: 200 images, MN00269: 119 images) wheat images were randomly selected to generate the validation dataset, with 220 and 200 images corresponding to awned and awnless wheat spikes, respectively. The remaining images (450 images, Wheaton: 116 images, Roblin: 222 images, MN00269: 112 images) were used as the testing dataset, with images 228 and 222 corresponding to awned and awnless wheat spikes, respectively. Every epoch contains 100 iterations, and the maximum number of training epochs was set to 770 with a momentum of 0.9. In addition, the weight decay was fixed to 0.01 and the learning rate (LR) was initially set to 0.002. After 161, 332, and 508 epochs, the LR was decreased to 0.001, 0.0005, and 0.0002, separately.
After training, the model was evaluated using two parameters, including recall (
r) and precision (
p). These parameters were calculated using the following functions:
where
TP is the predicted mask pixels that correspond to the labeled mask pixels,
FN represents the labeled mask pixels that are inexistent in the predicted mask pixels, and
FP is the predicted mask pixels that are inexistent in the labeled mask pixels. Normally, a high
TP, a low
FN, and a low
FP are indicative of improved performance. However, an individual parameter could not quantify the model adequately. Therefore, the average precision (AP), known as the area under the precision–recall curve, was applied as an indicator to estimate the model.
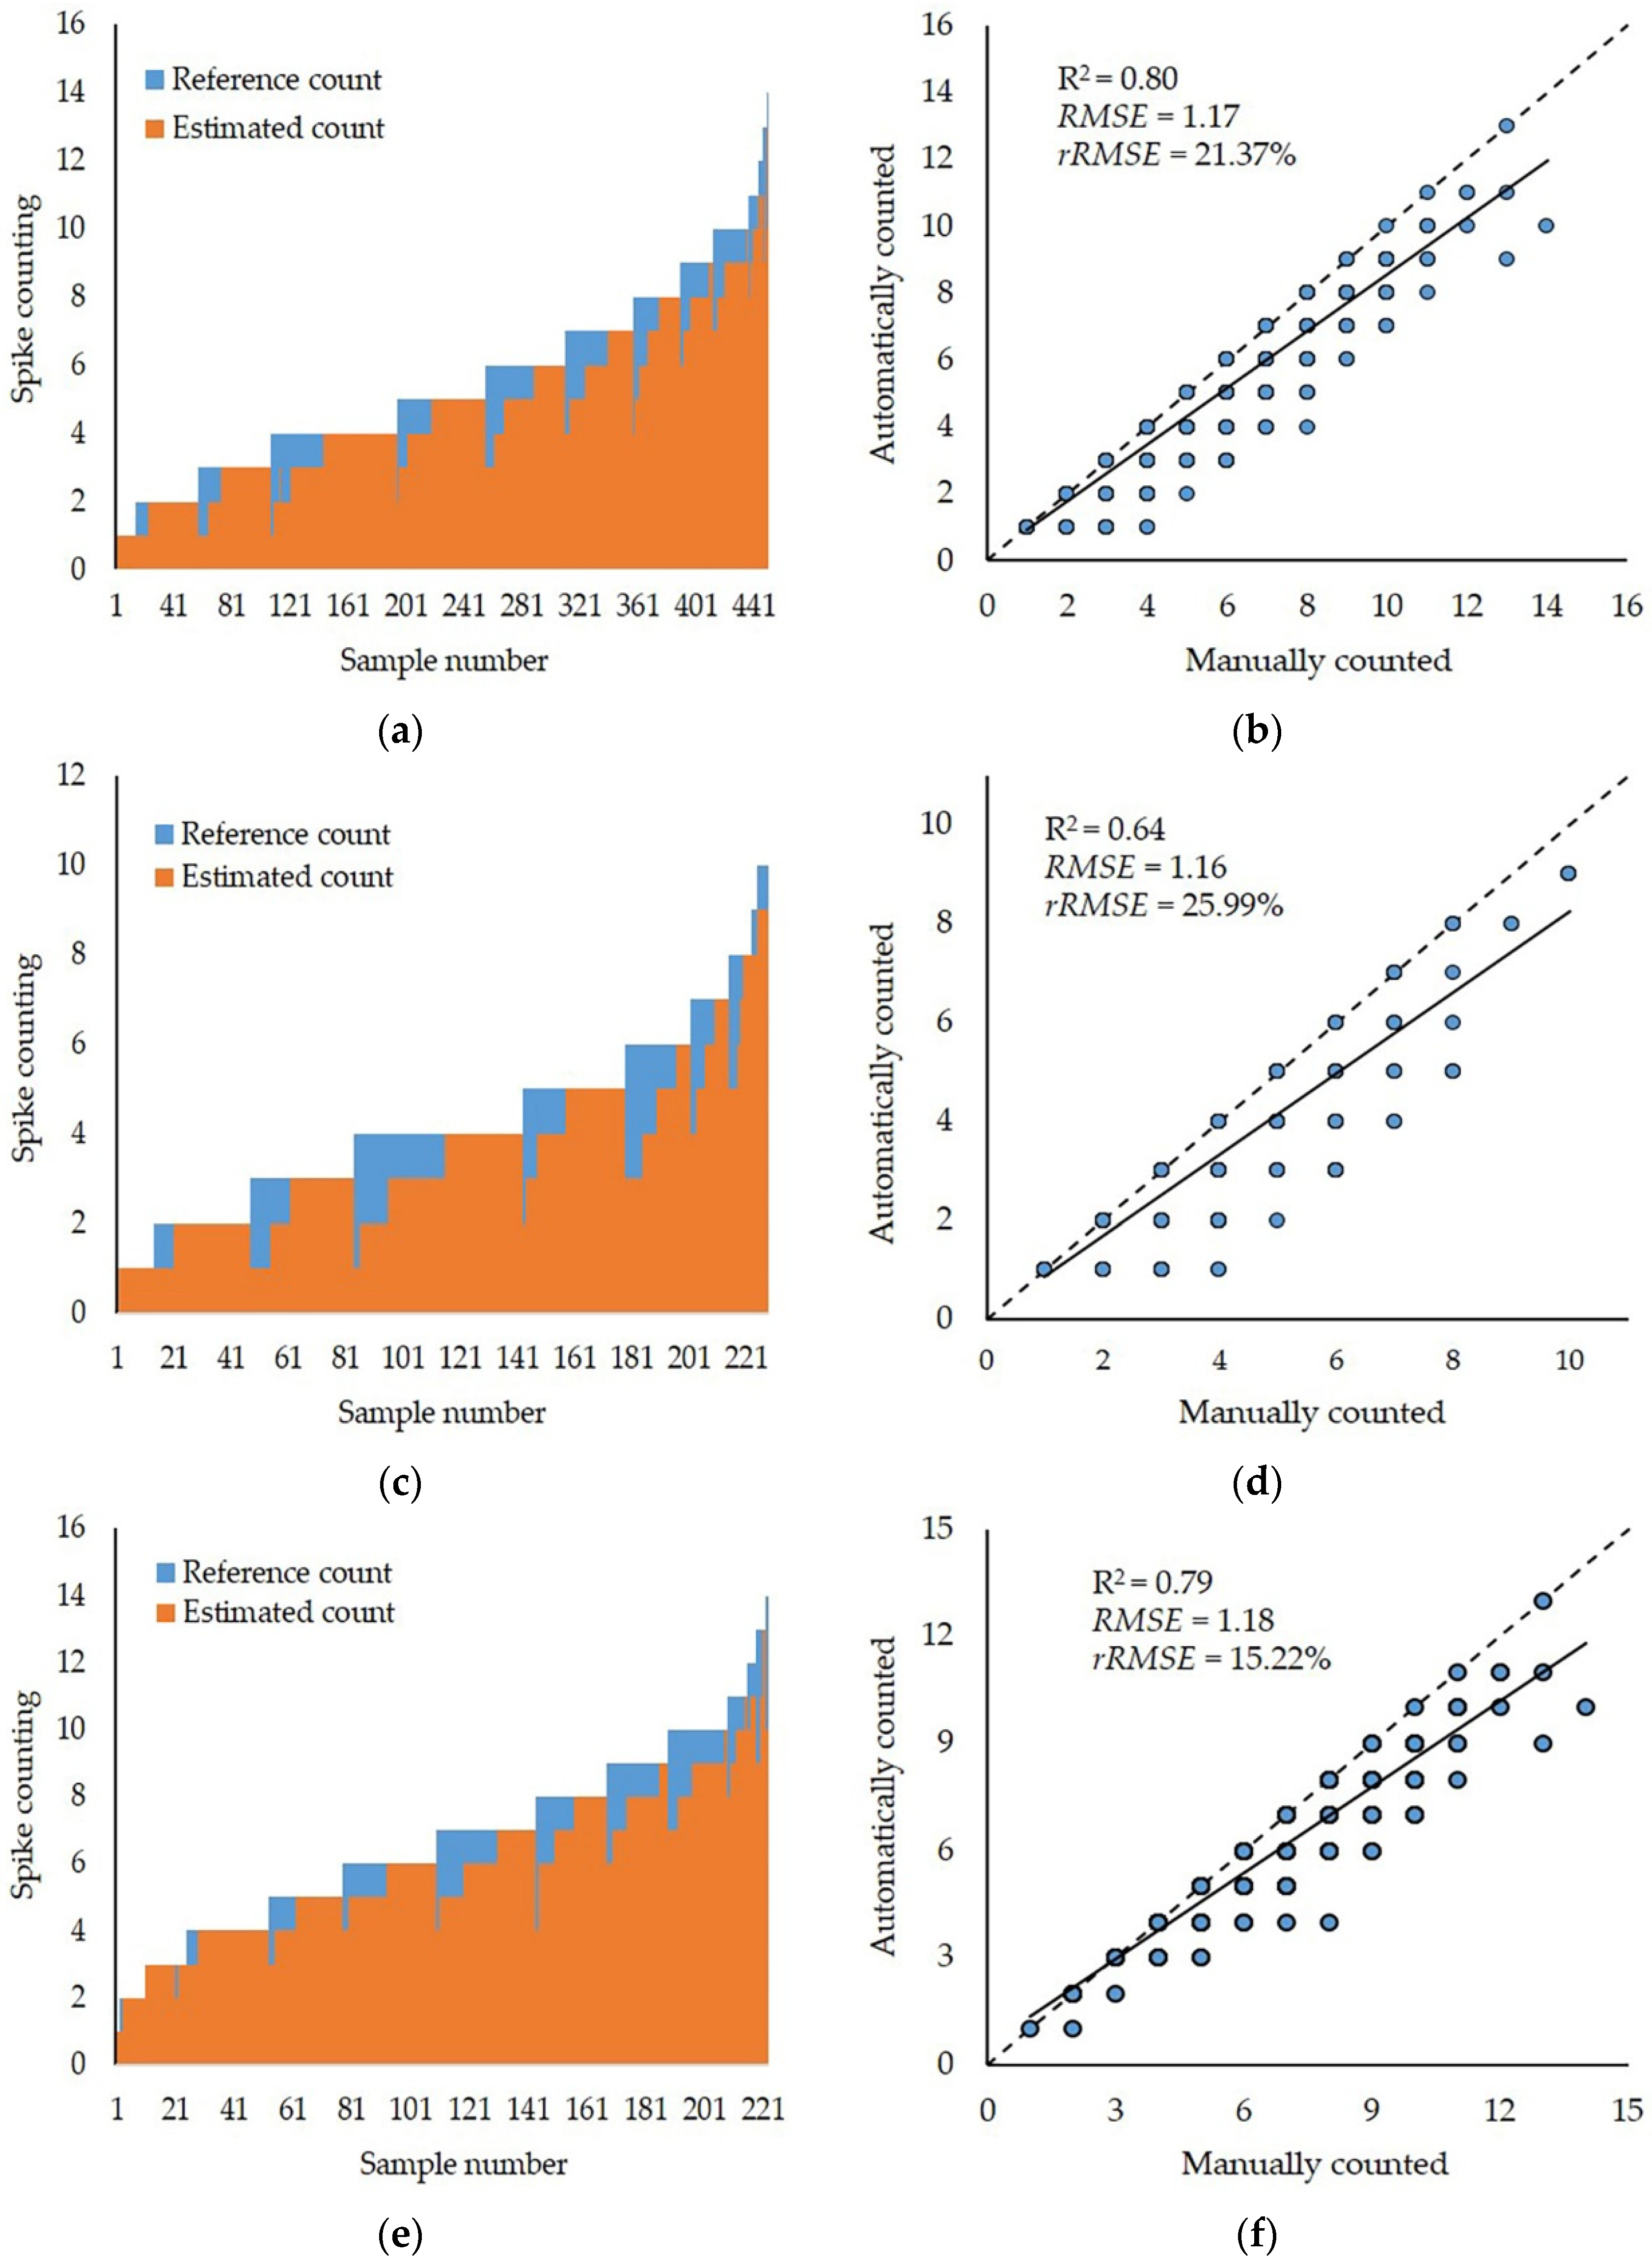
Furthermore, several statistical parameters were used to assess the spike detection performance. These parameters were root mean squared error (
RMSE), relative
RMSE (
rRMSE), and the coefficient of determination (R
2), as described in the following functions.
where
n is the number of testing samples,
ti is the manually counted number of spikes,
di is the automatically counted number of spikes, and
is the mean value of
ti.
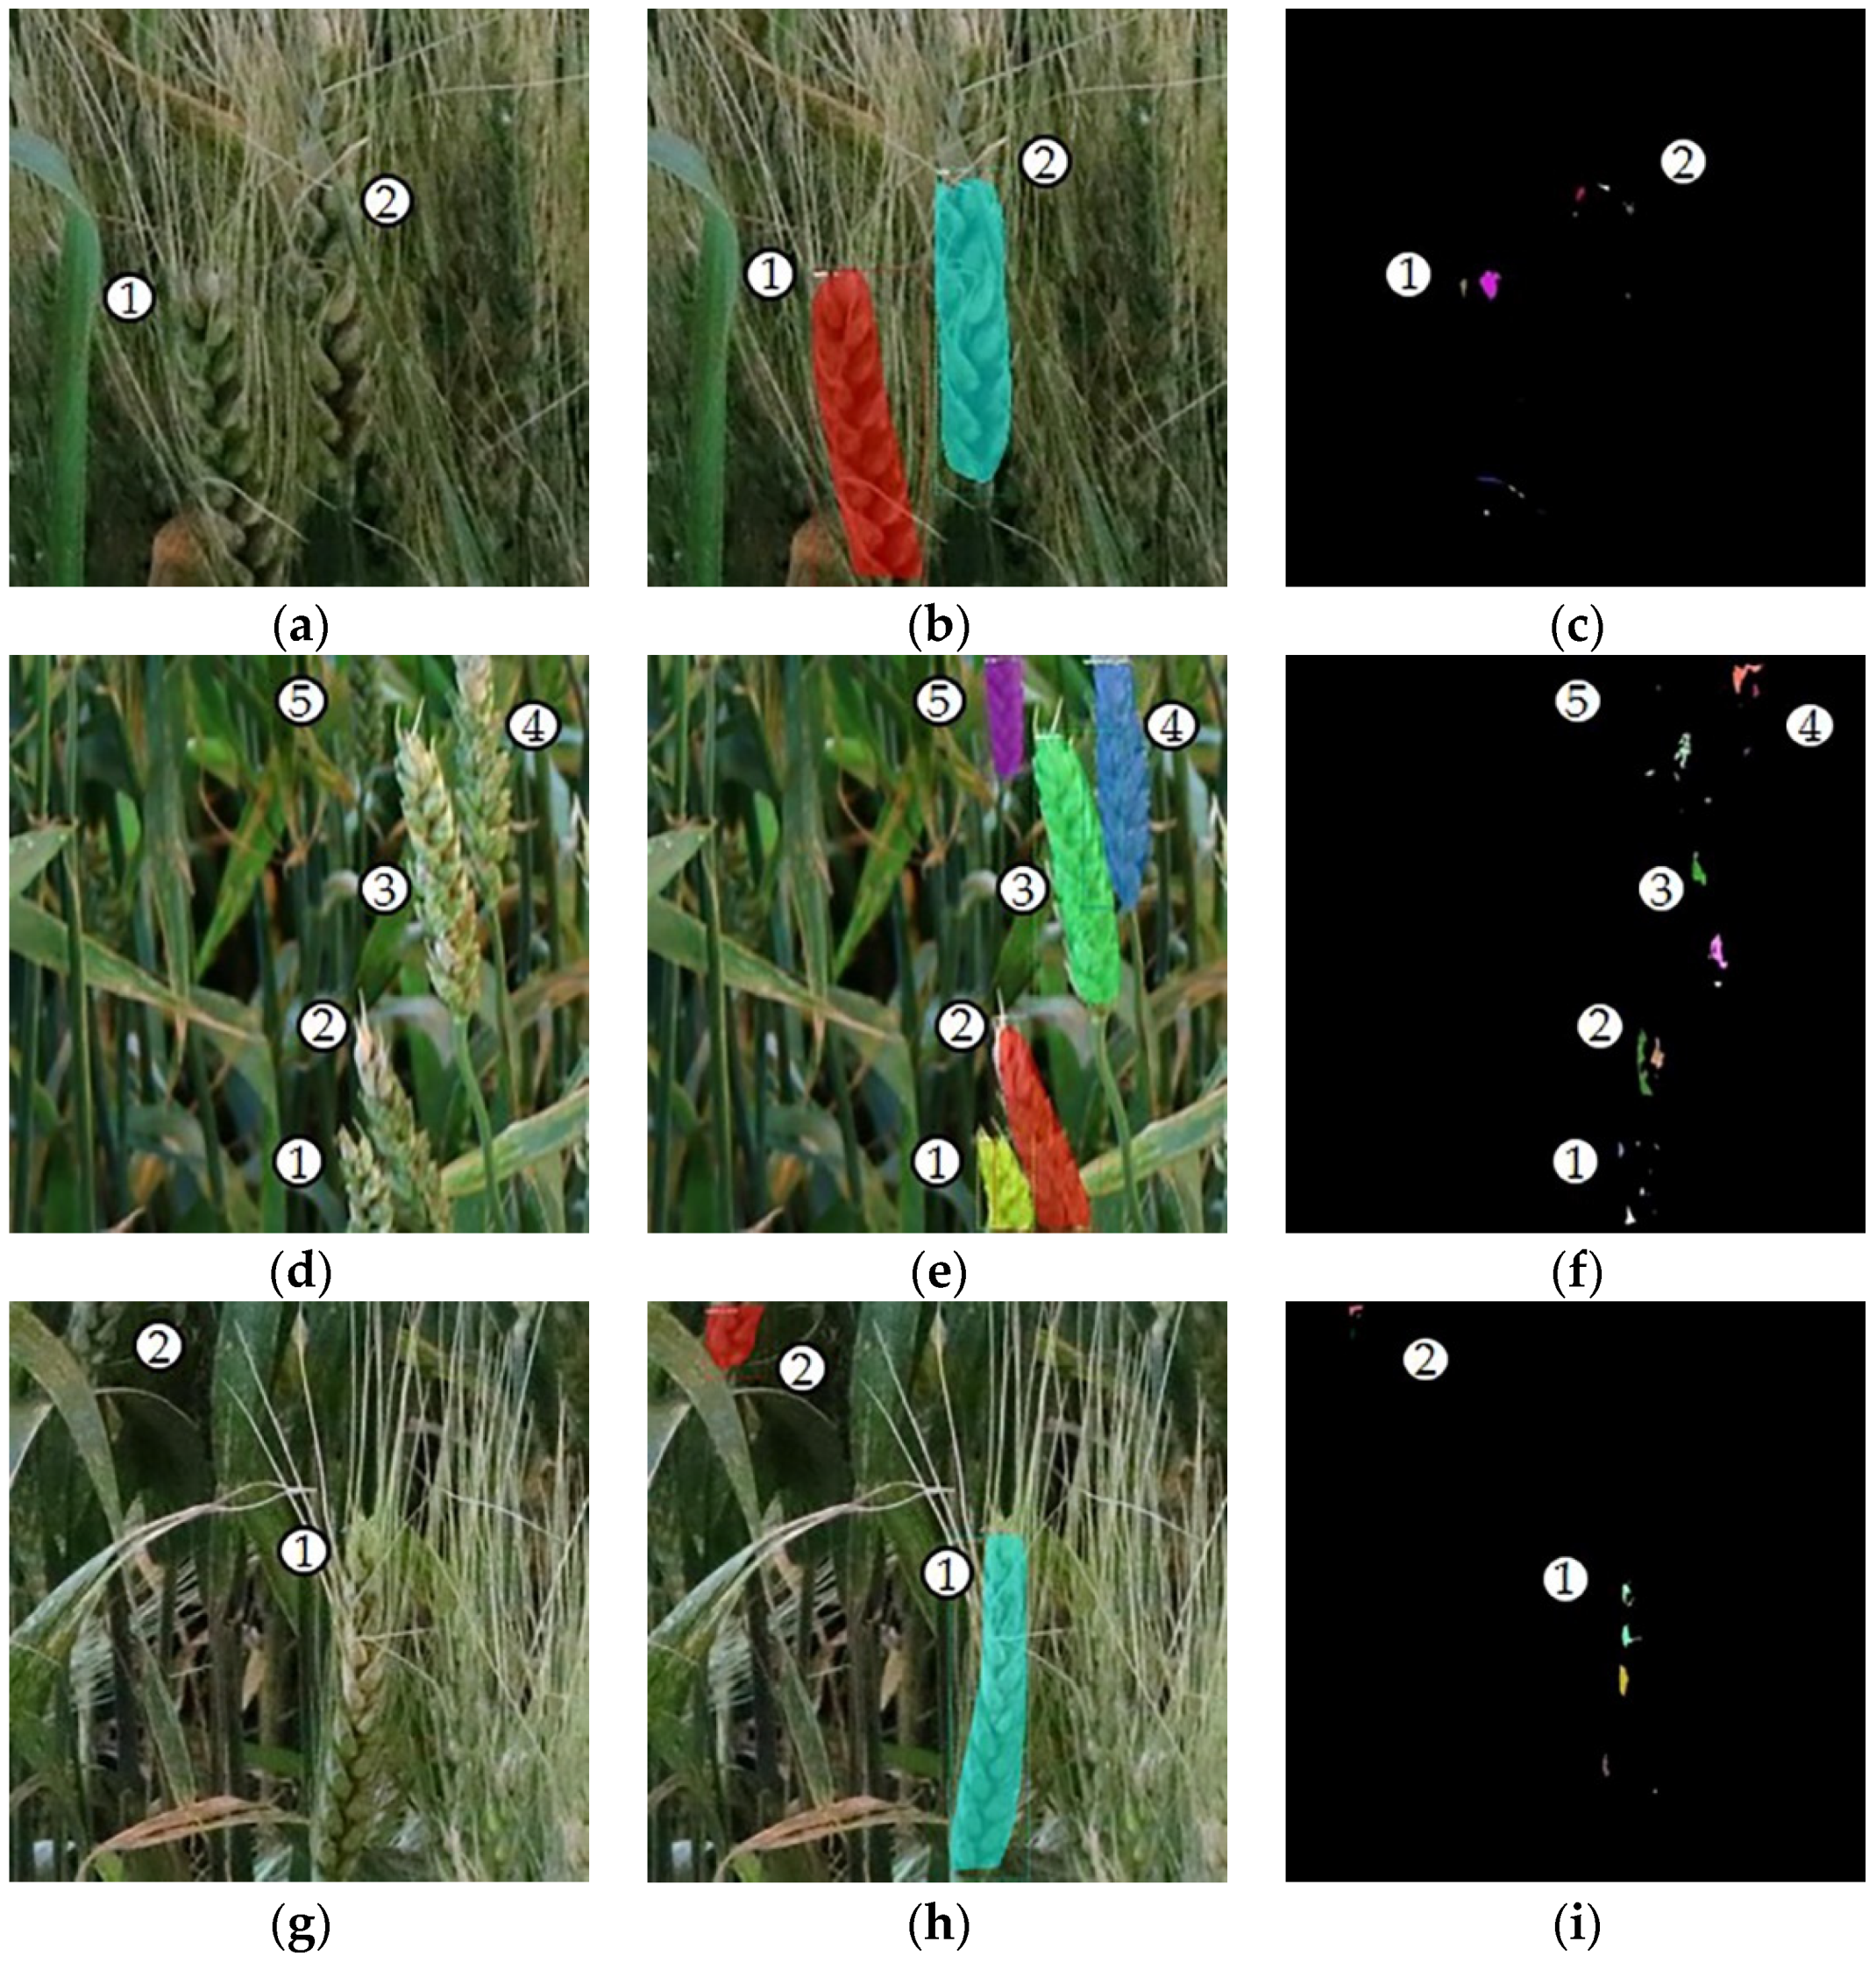
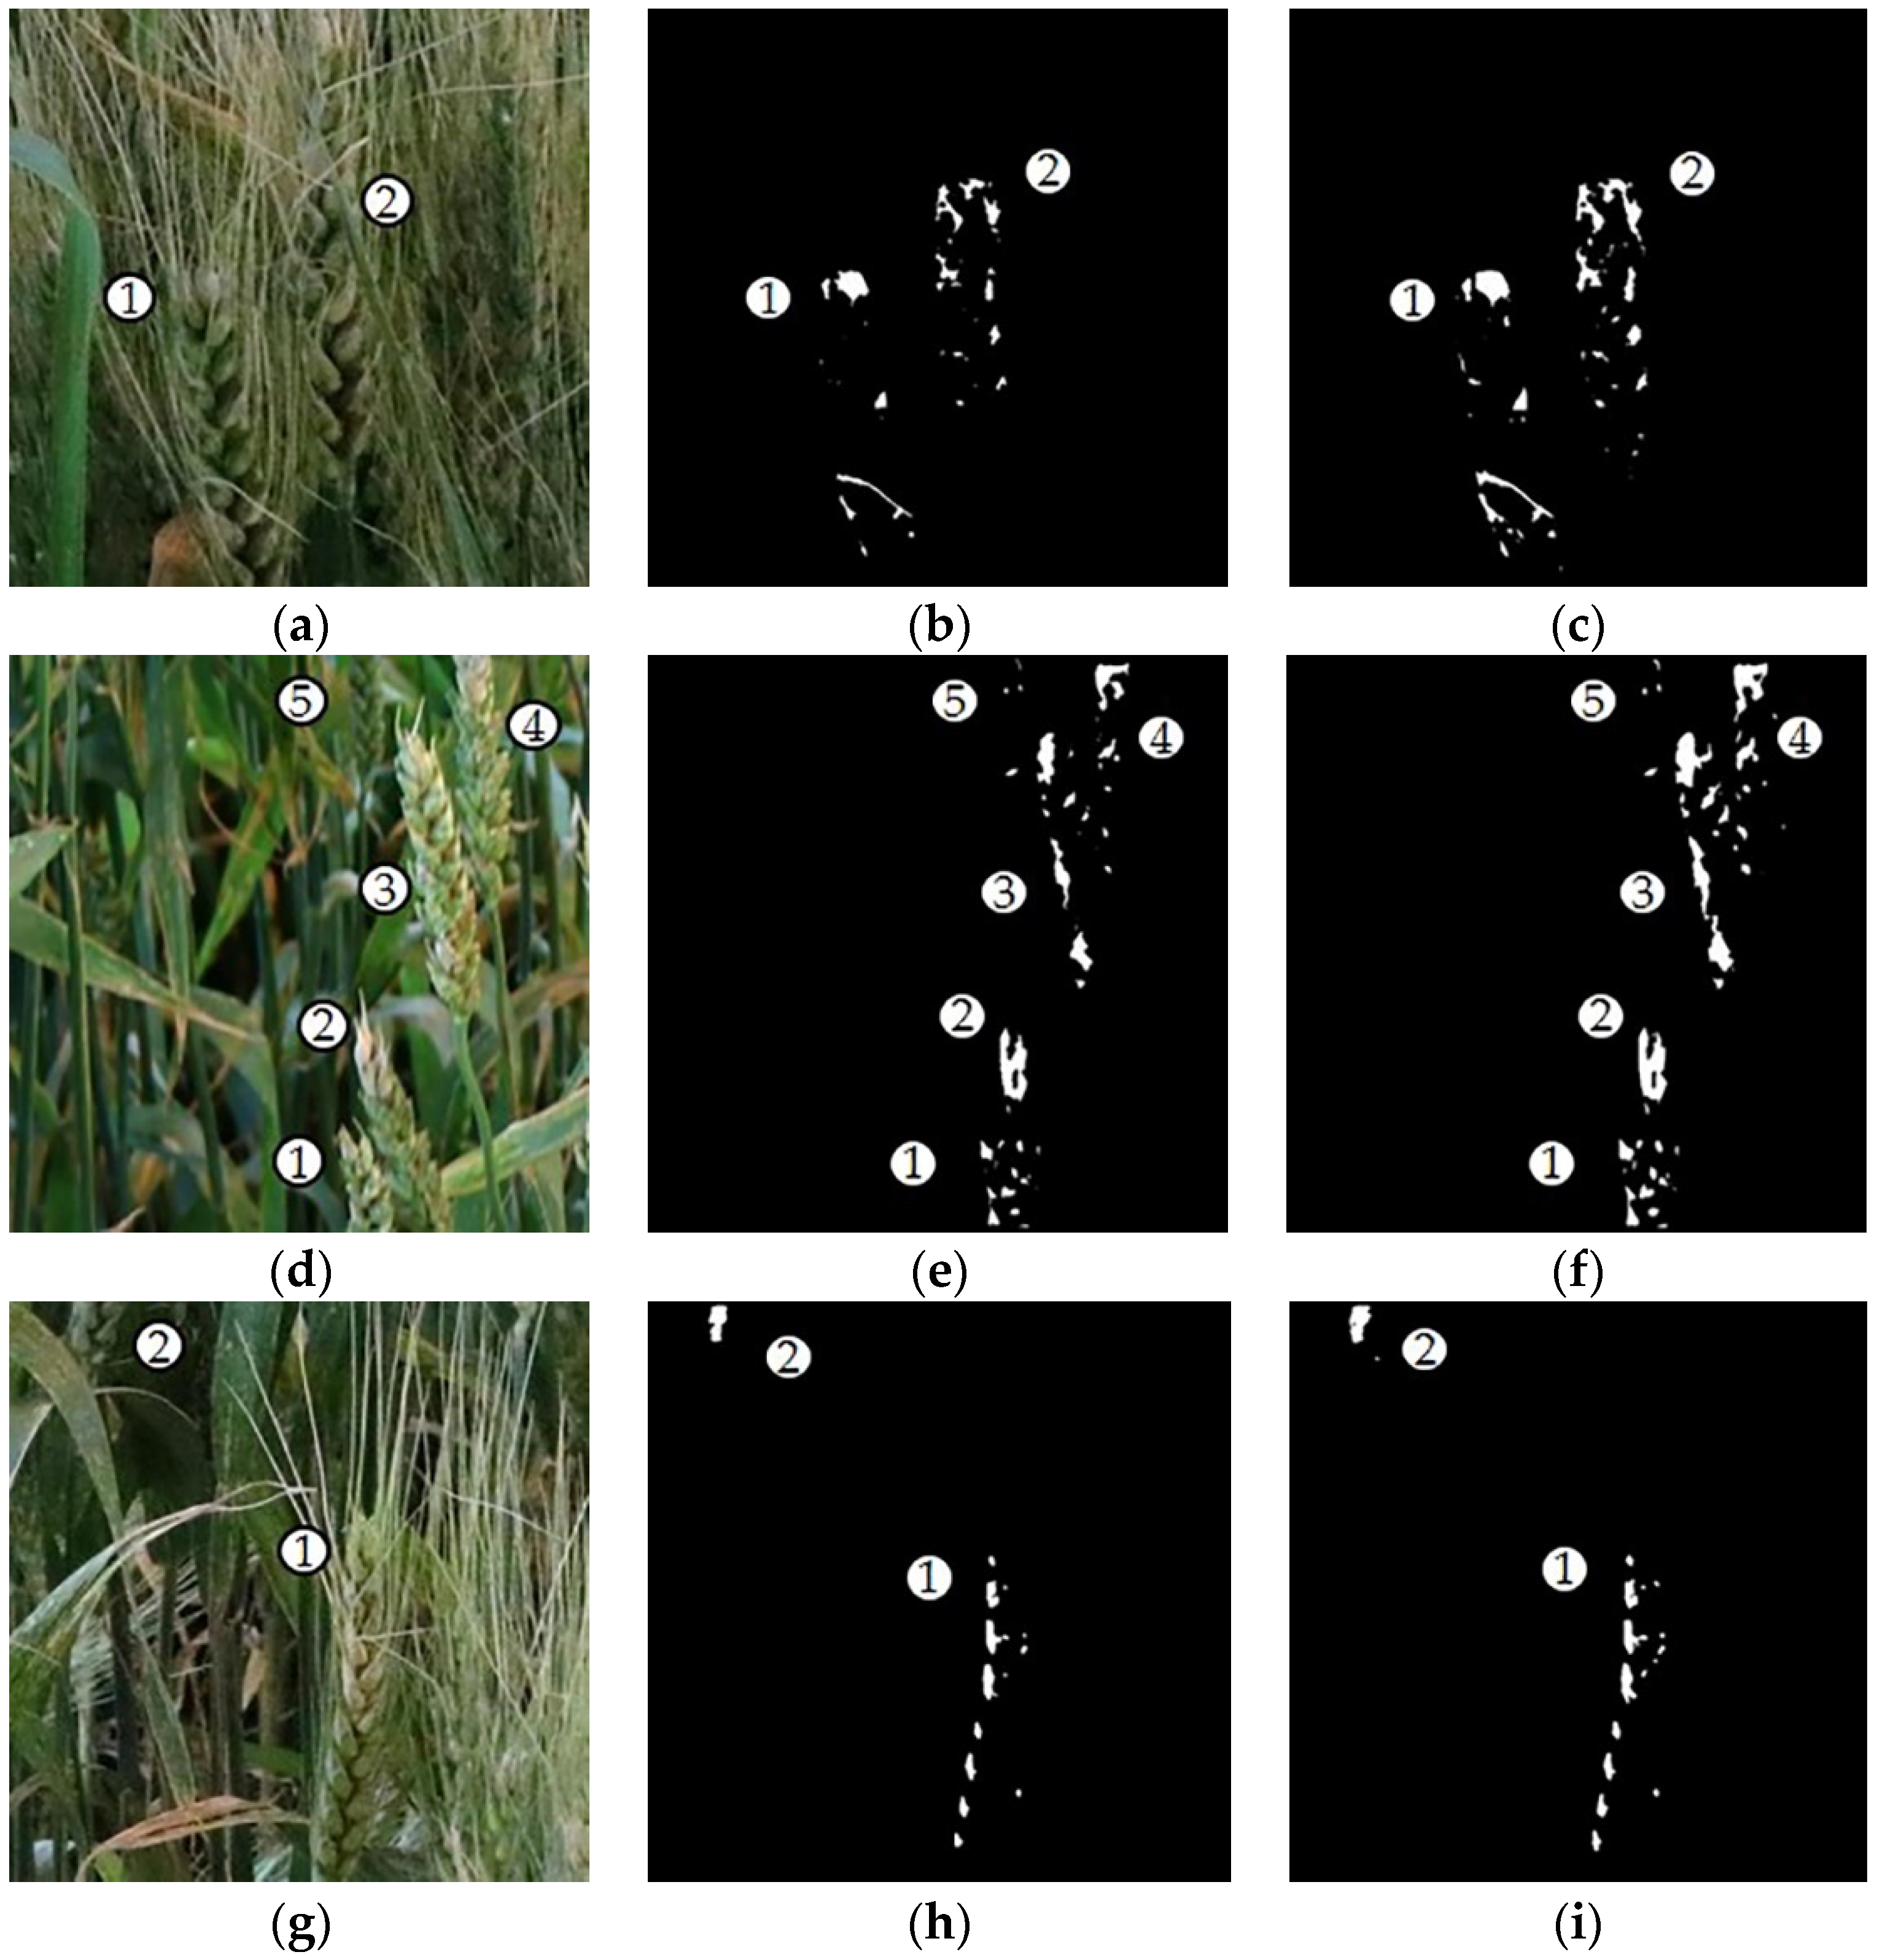
2.4. FHB Detection
In contrast to the green hues of chlorophyll in healthy spikes, FHB-infected spikes are tan or straw-colored, similar to senescing tissue. For this reason, it is best to assess FHB at a stage prior to the initiation of senescence in the spike. Occasionally, infected spikelets may exhibit a pinkish or salmon-colored hue. This is due to the mycelium and conidia of the Fusarium fungus growing on the surface of the tissue. Within an individual spike, the extent of symptomatic spikelets can range from 0% to 100%. The DCNN was able to segment the spikes from the background and output their boundaries, which aided the detection of diseased areas. The spike is a very complex structure consisting of the spikelets, rachis (the axis of the spike to which the spikelets are attached), and awns. Additionally, image analysis of individual spikes must also consider the spaces in between these structures. Therefore, further steps were performed to process the segmented spikes and extract the diseased areas accurately.
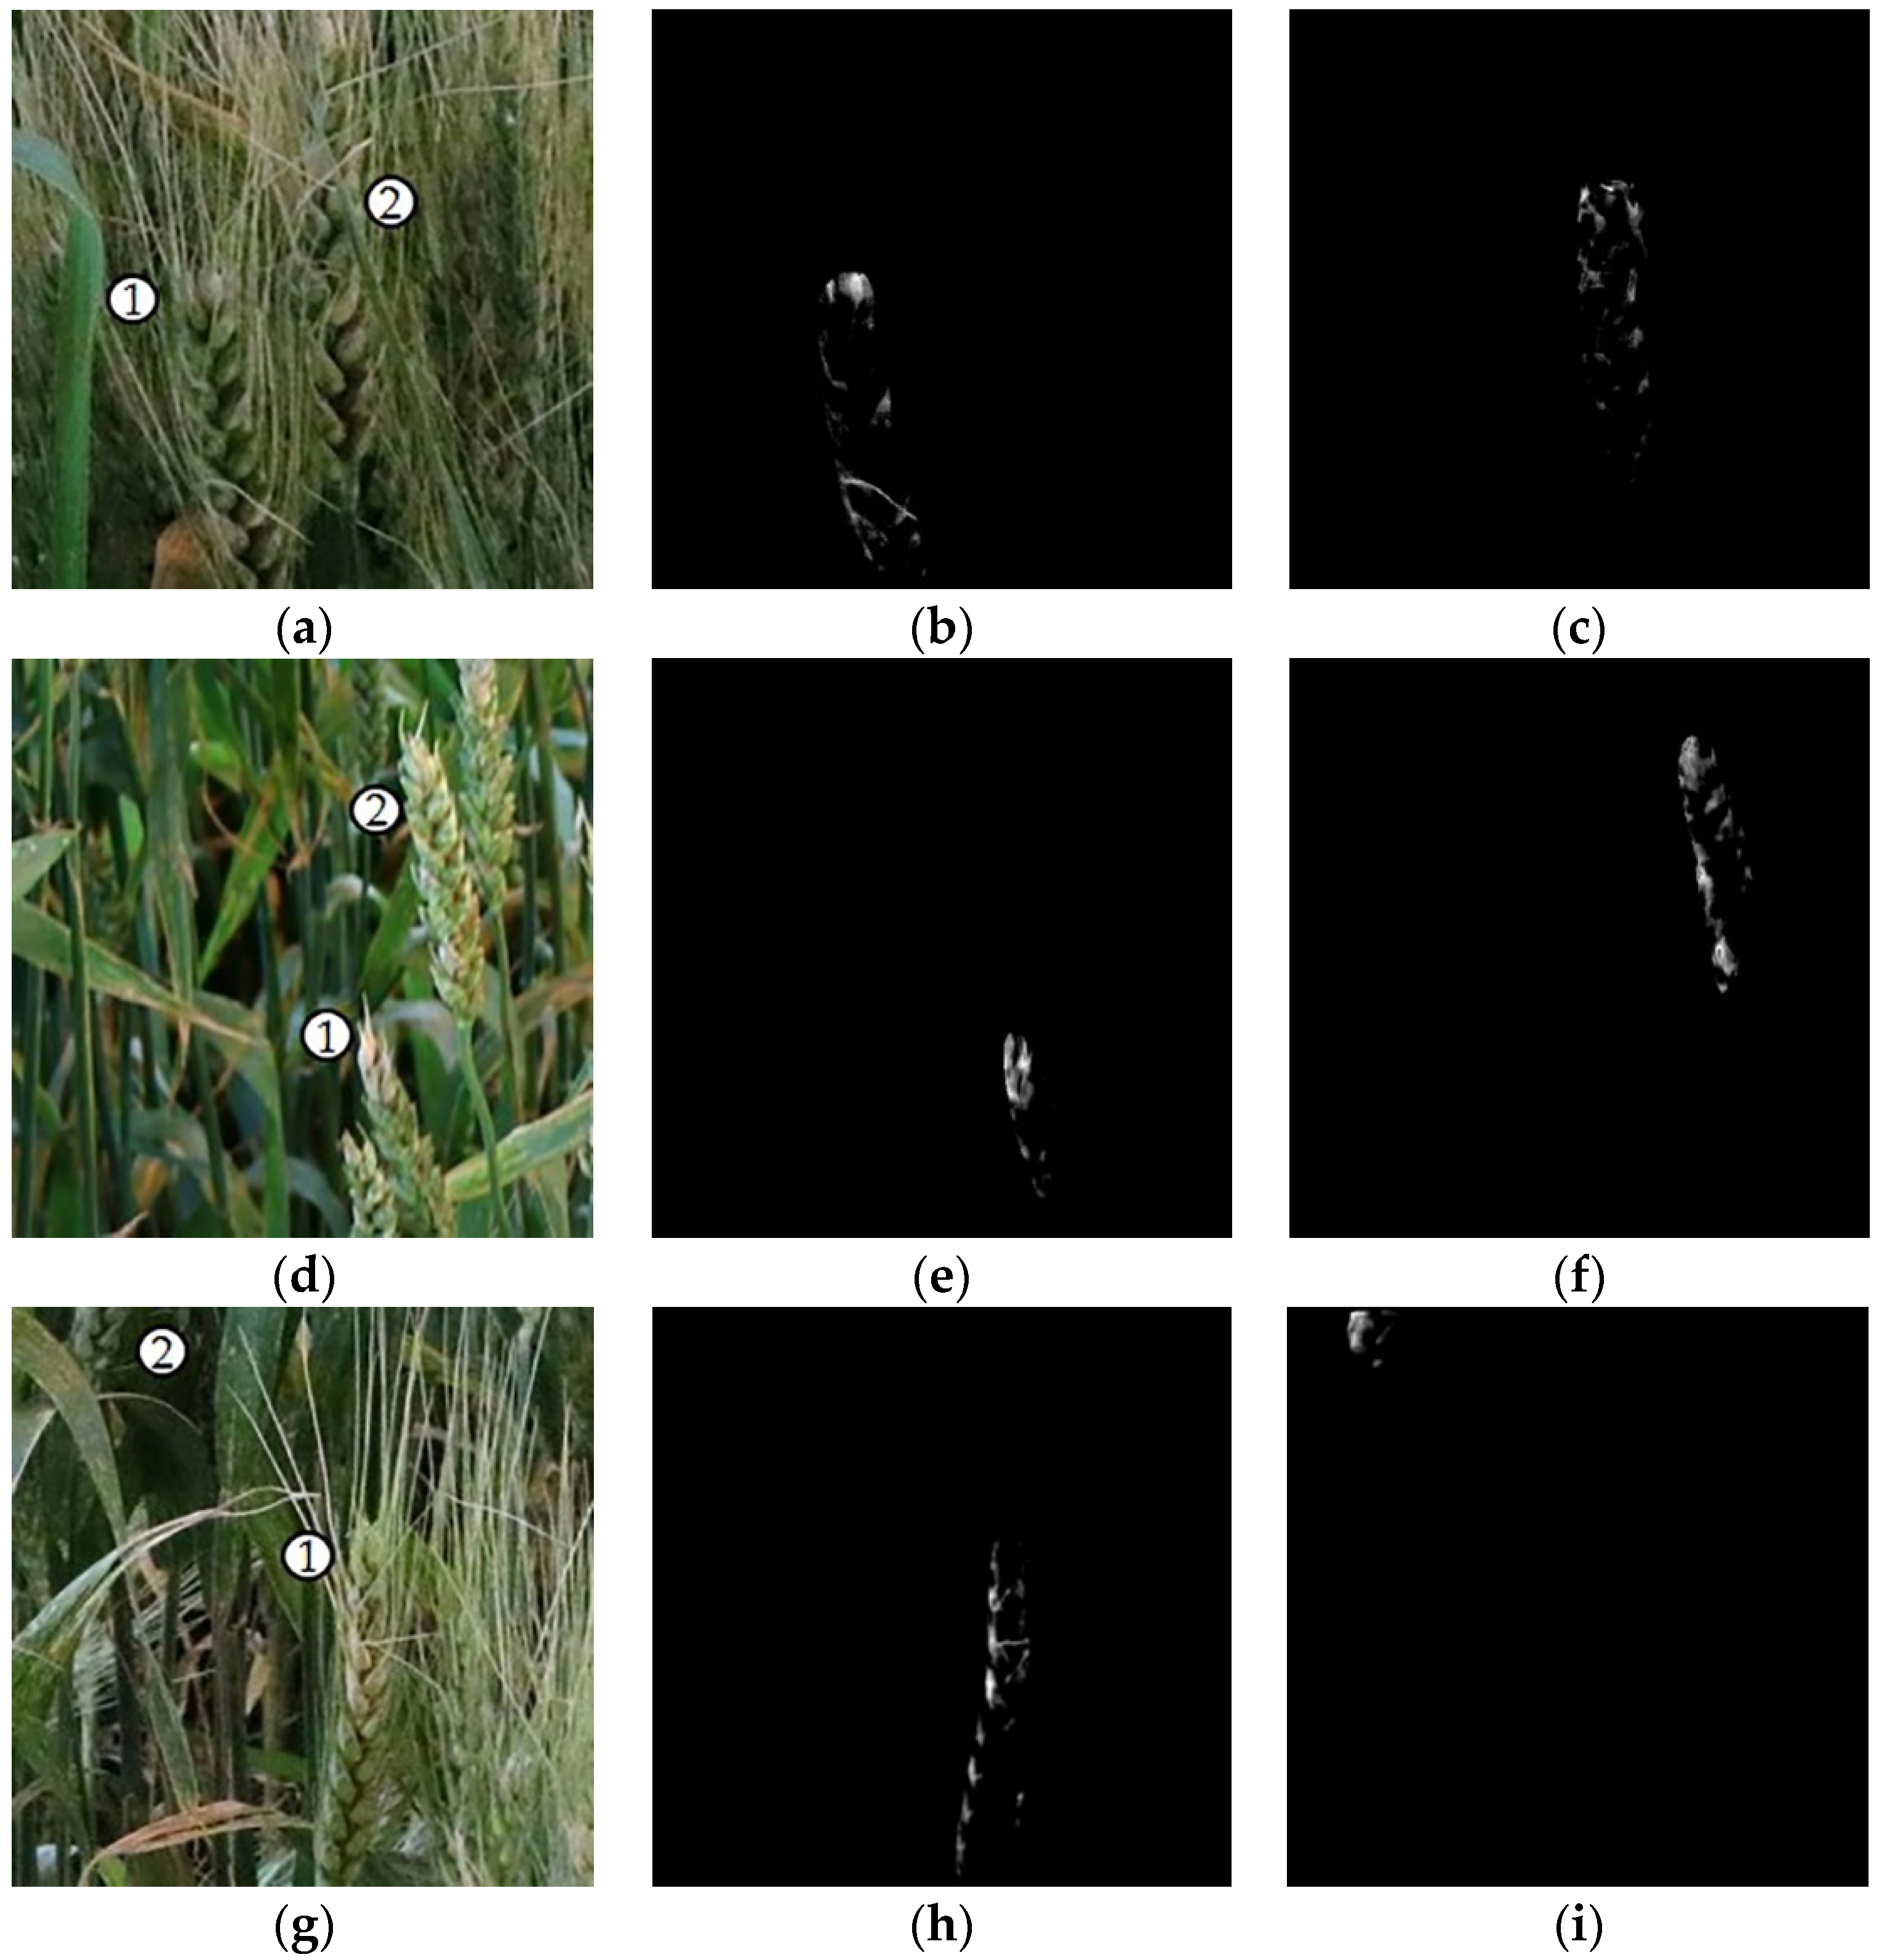
The stark color differences of healthy vs. diseased spikelets were exploited for assessing the percentage of FHB infection in individual spikes. In accordance with previous tests [
36], a new color feature (GB) was proposed by using the green and blue components to highlight the diseased areas of each spike. This new color feature was calculated using function (7).
where
α is a coefficient,
B is the blue component value, and
G is the green component value.
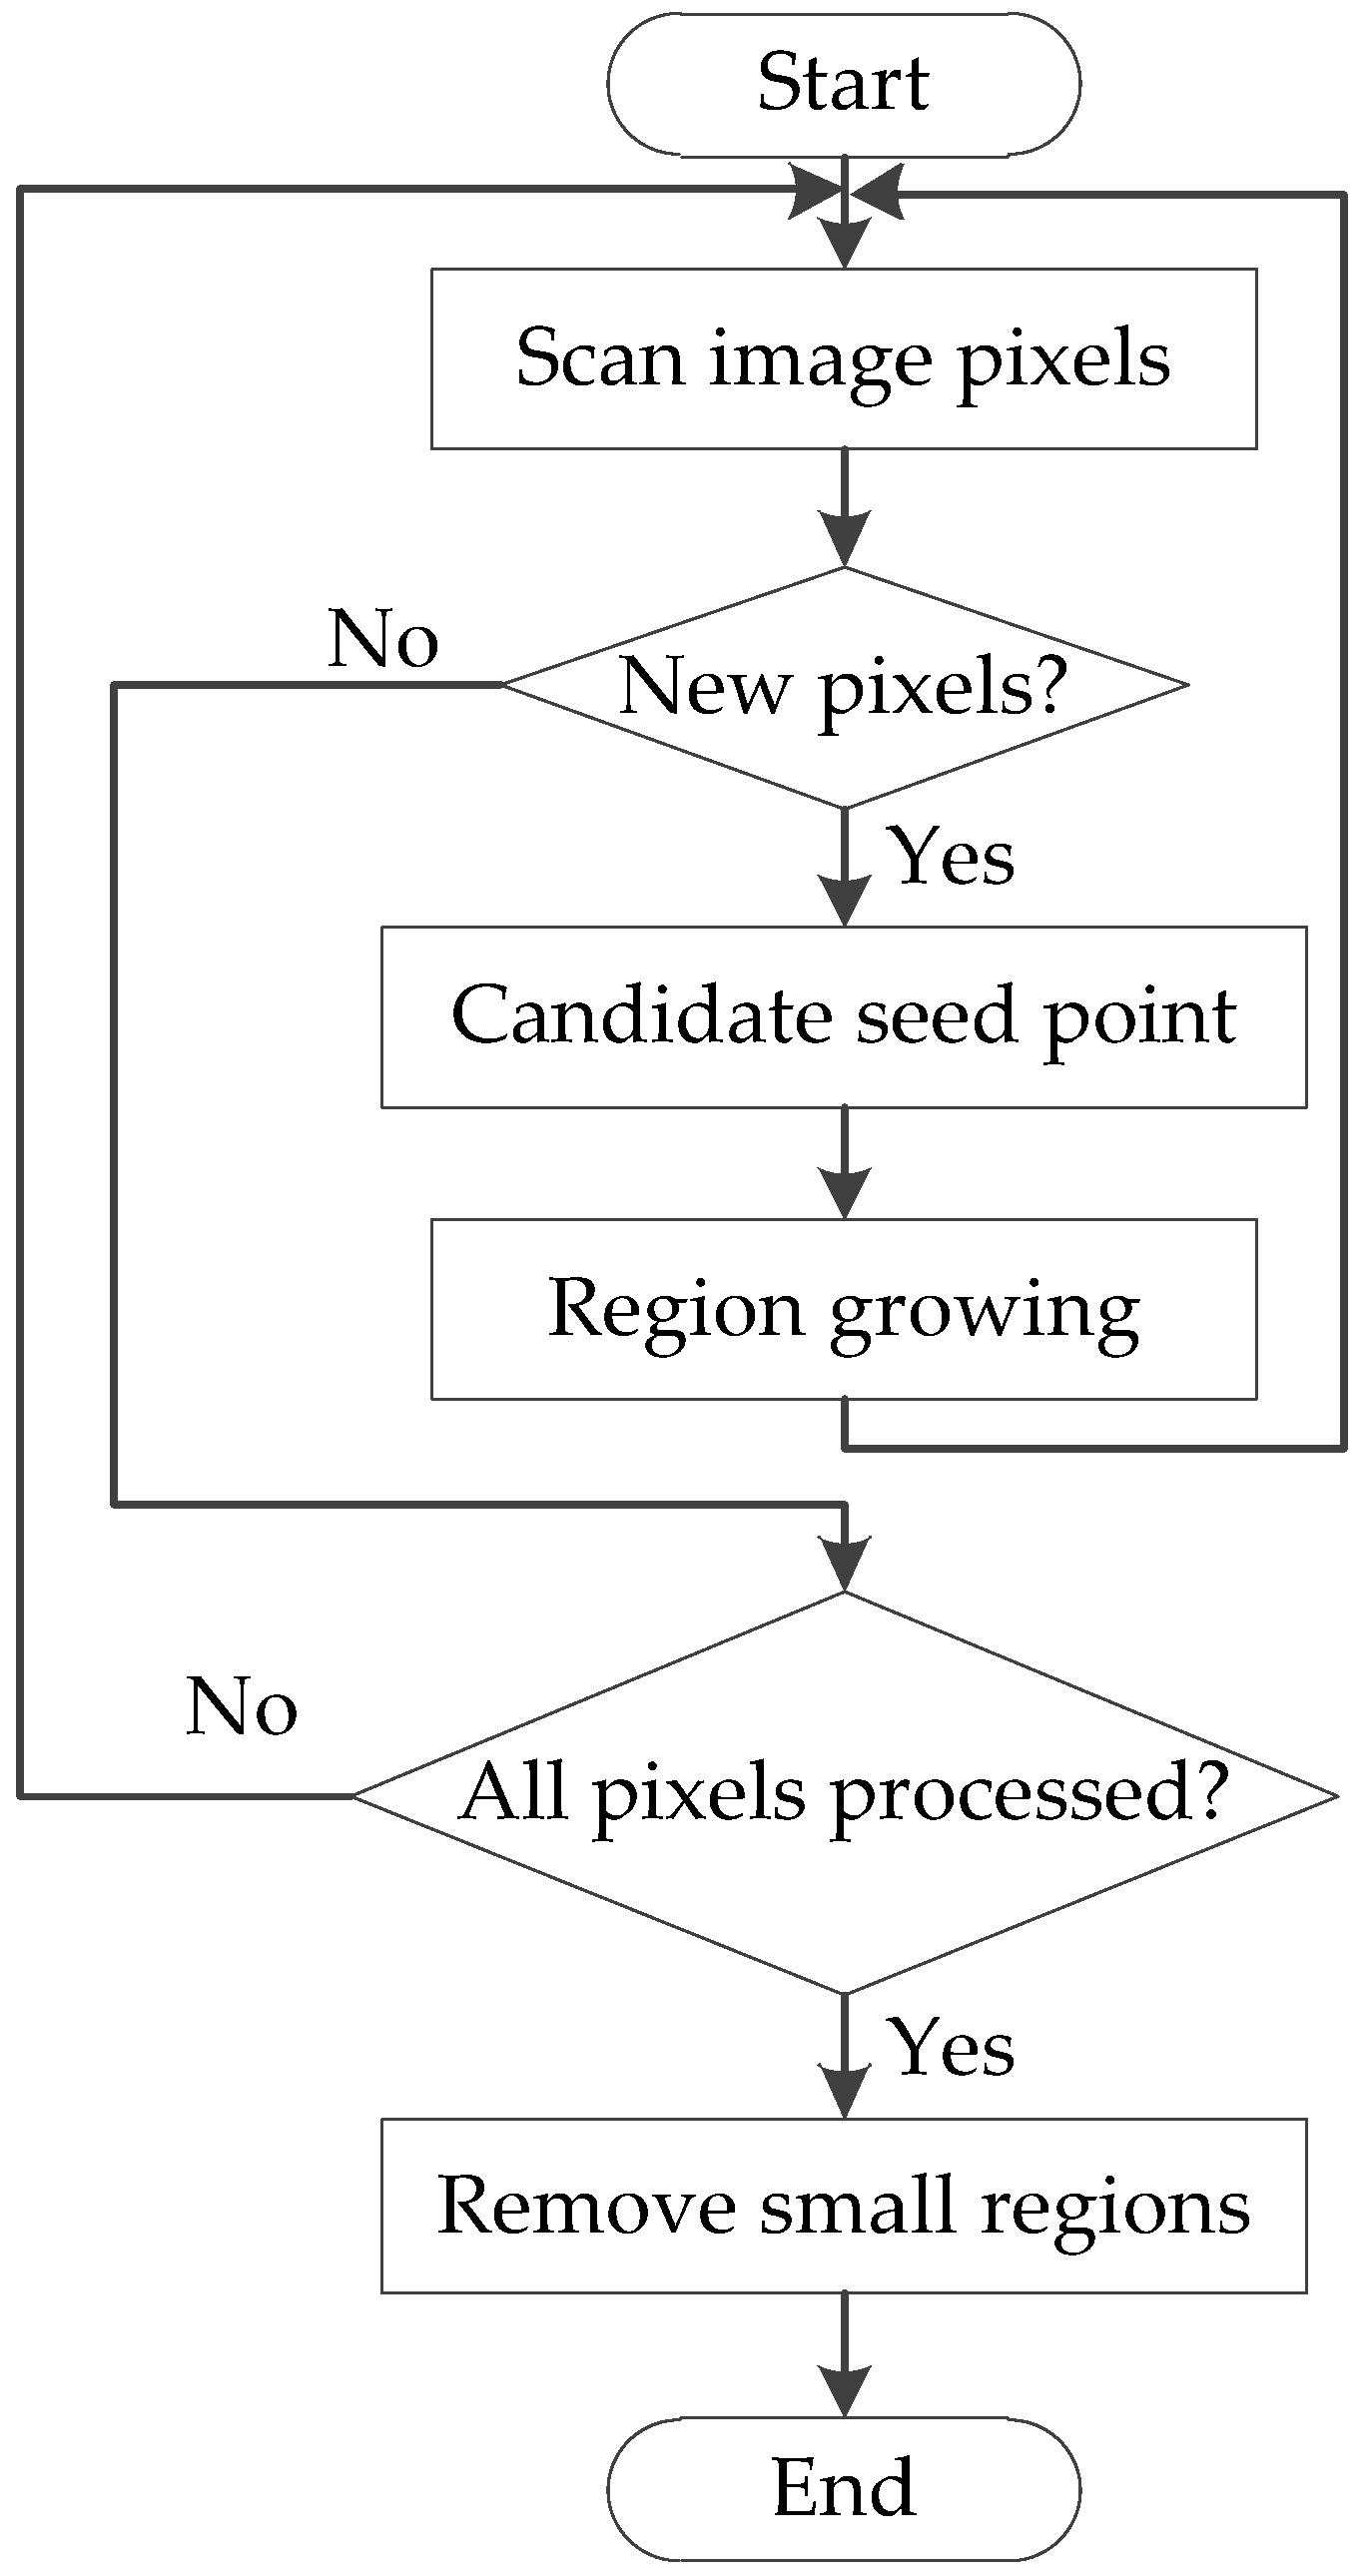
The GB components of the segmented spikes in the color images were calculated to obtain their gray images. Although the diseased areas of a spike can sometimes be scattered in wheat, they do show a similar appearance. In accordance with this characteristic, every pixel could be classified on the basis of the correlations between such a pixel and adjacent pixels. Region growing is an effective segmentation algorithm and widely used in machine learning. In general, a pixel is initially selected as the seed point, and then its surrounding pixels are compared and evaluated with it. If their similarities are consistent with the set rules, the pixels are classified into the same class. The selection of the initial seed point and setting of the growing rules are crucial to the region-growing algorithm. However, in the present study, a single initial seed point setting was insufficient to recognize all unconcentrated diseased areas. Therefore, a modified region growing algorithm was applied to process the gray image [
37]. The flowchart of this algorithm is displayed in
Figure 5. First, the pixels of the gray spike images were scanned to find an unmarked pixel (
x0,
y0), which was tagged as the
Kth class and saved into the “stack.” Second, a pixel was selected from the “stack” as the seed point, and the pixels around the seed point (eight neighbors) were processed. When the gray difference between the seed point and the processing pixel was in the setting range, the pixel was regarded as being in the same class and saved into the “stack.” Third, the second operation was repeated until the “stack” was empty. Lastly, Steps 1–3 were repeated until every pixel was marked. Many small areas are inevitably generated because of background noise, especially at the junctions of the spikelets and rachis. Thus, the area of each region was calculated, and small diseased regions were removed. At this point, the region-growing algorithm was completely implemented.
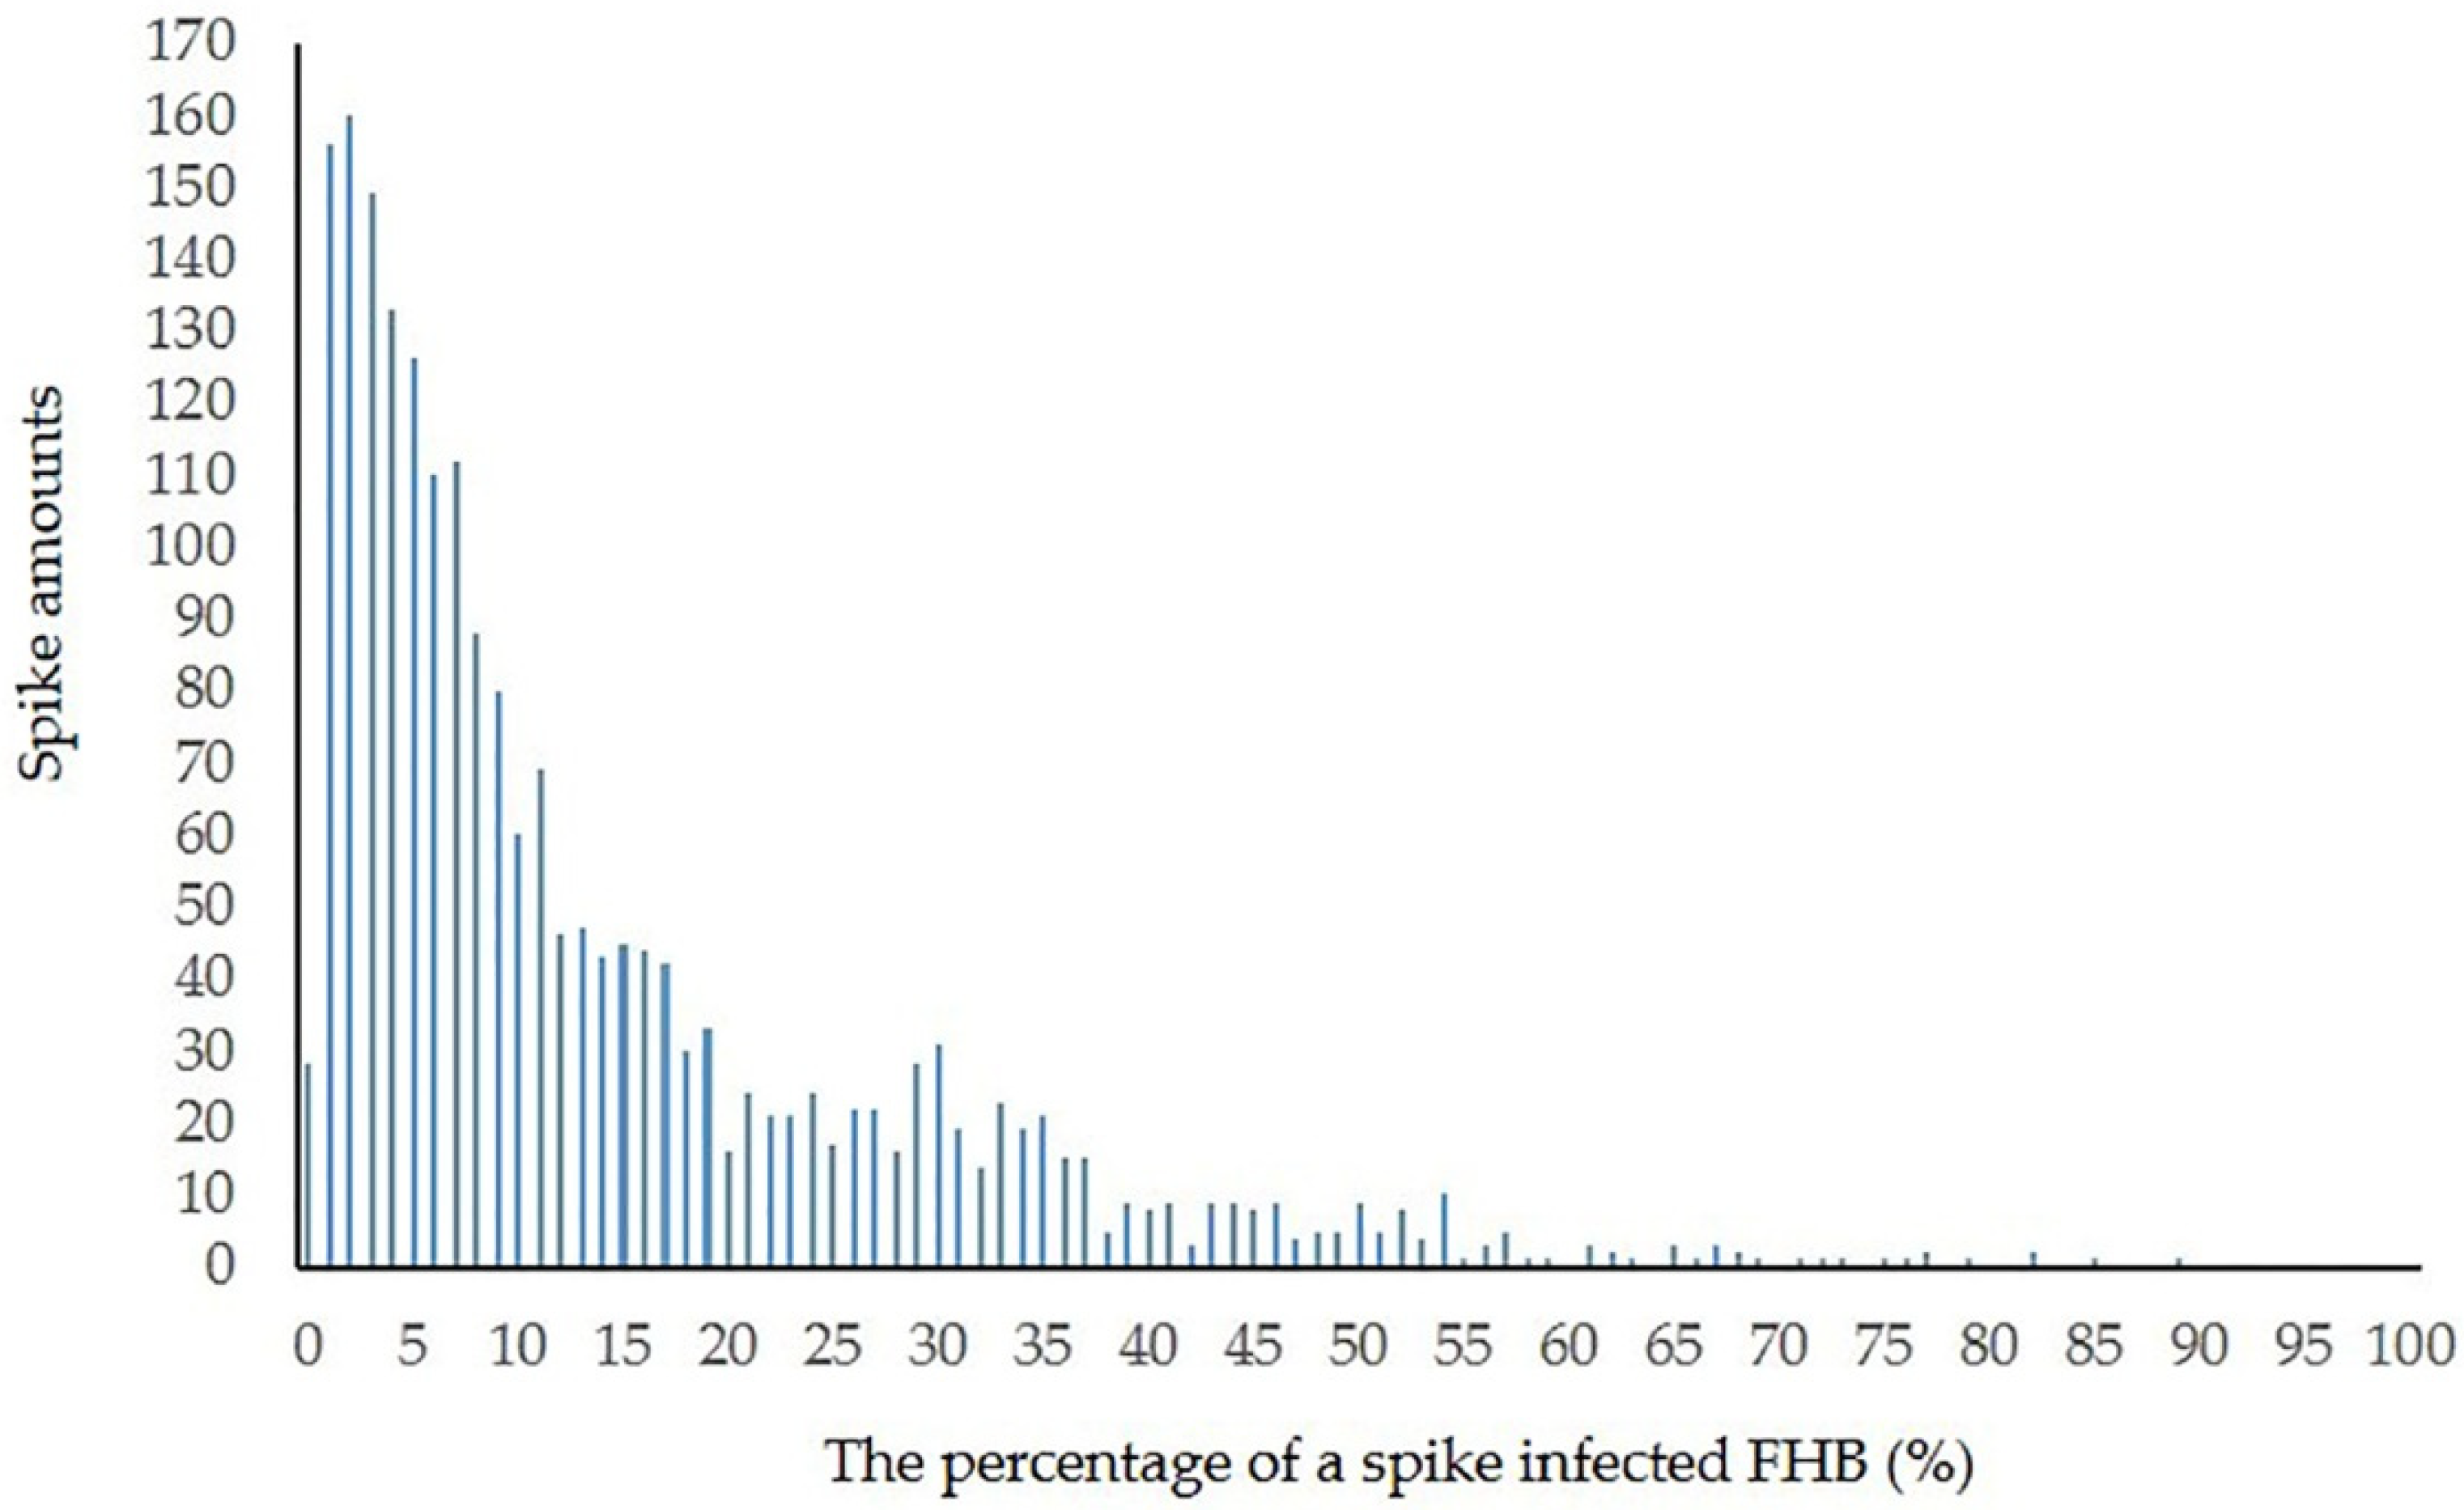
Subsequently, the close operation was performed on the results. Lastly, the ratio of FHB-infected areas to the entire spike area was calculated in accordance with the standard [
38,
39]. The methods for classifying the reaction of wheat to FHB can vary depending on the intended purpose. For the general selection of resistant wheat lines in breeding programs, FHB severities are classified into four classes [
2]. However, for other purposes (e.g., inheritance and molecular mapping studies), FHB assessments are made to the nearest integer on a 0% to 100% severity scale. The latter assessment was applied and the severity scoring was calculated using MATLAB r2016a software.
4. Discussion
4.1. Analysis of Mask RCNN Model Performance
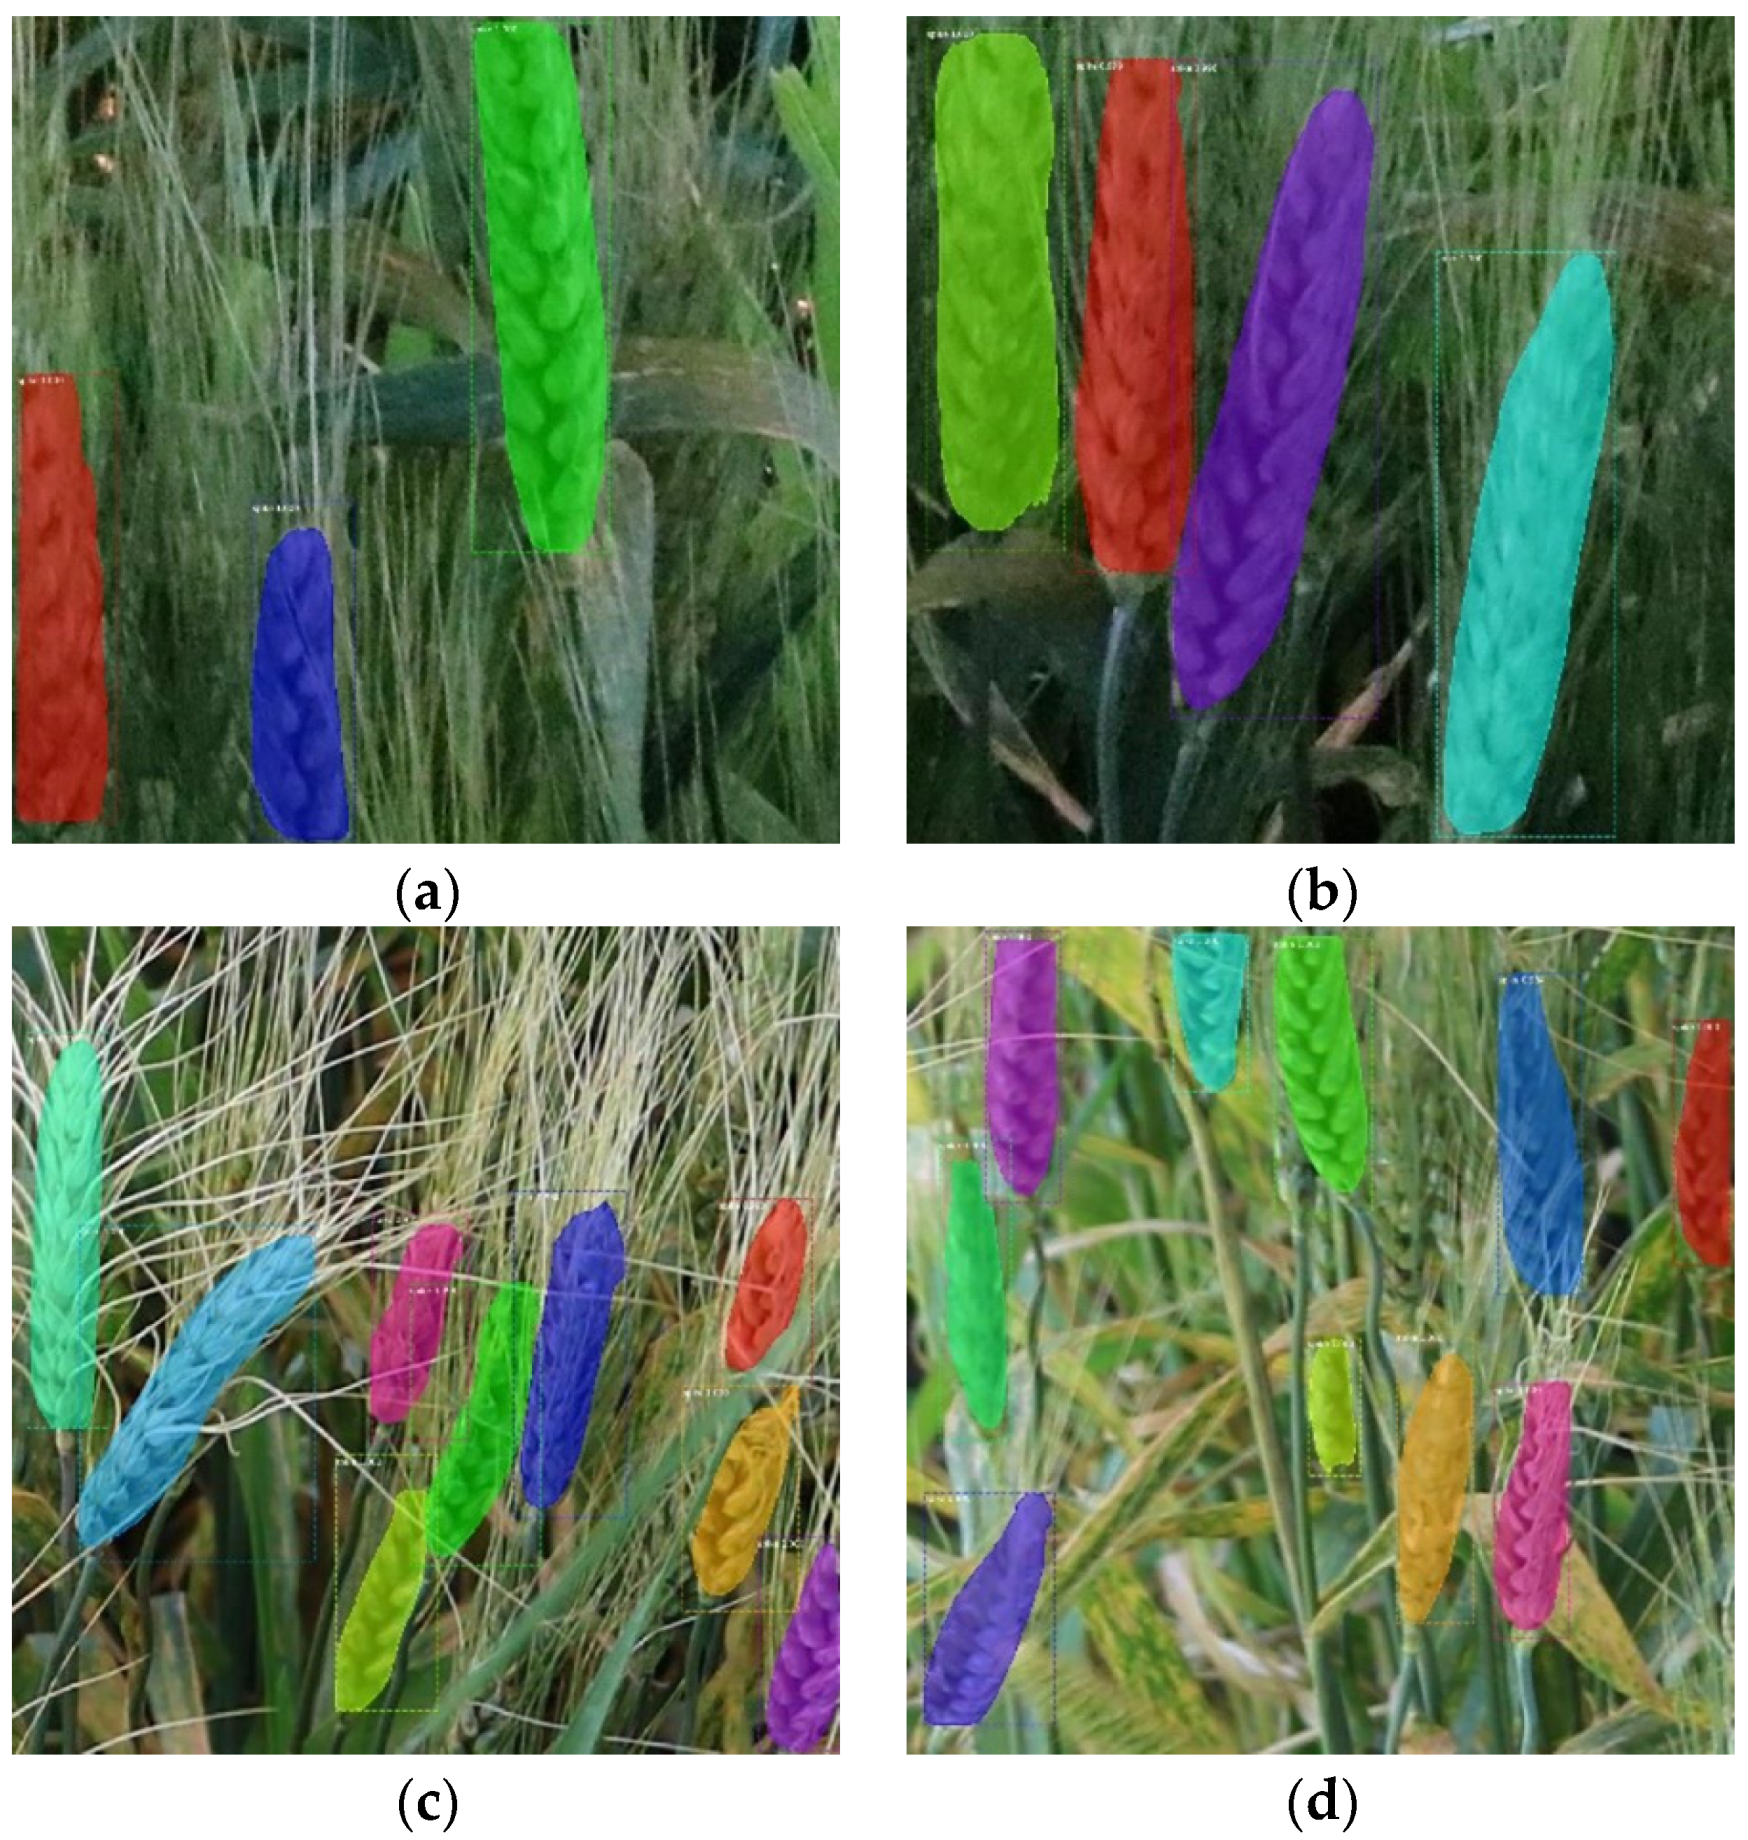
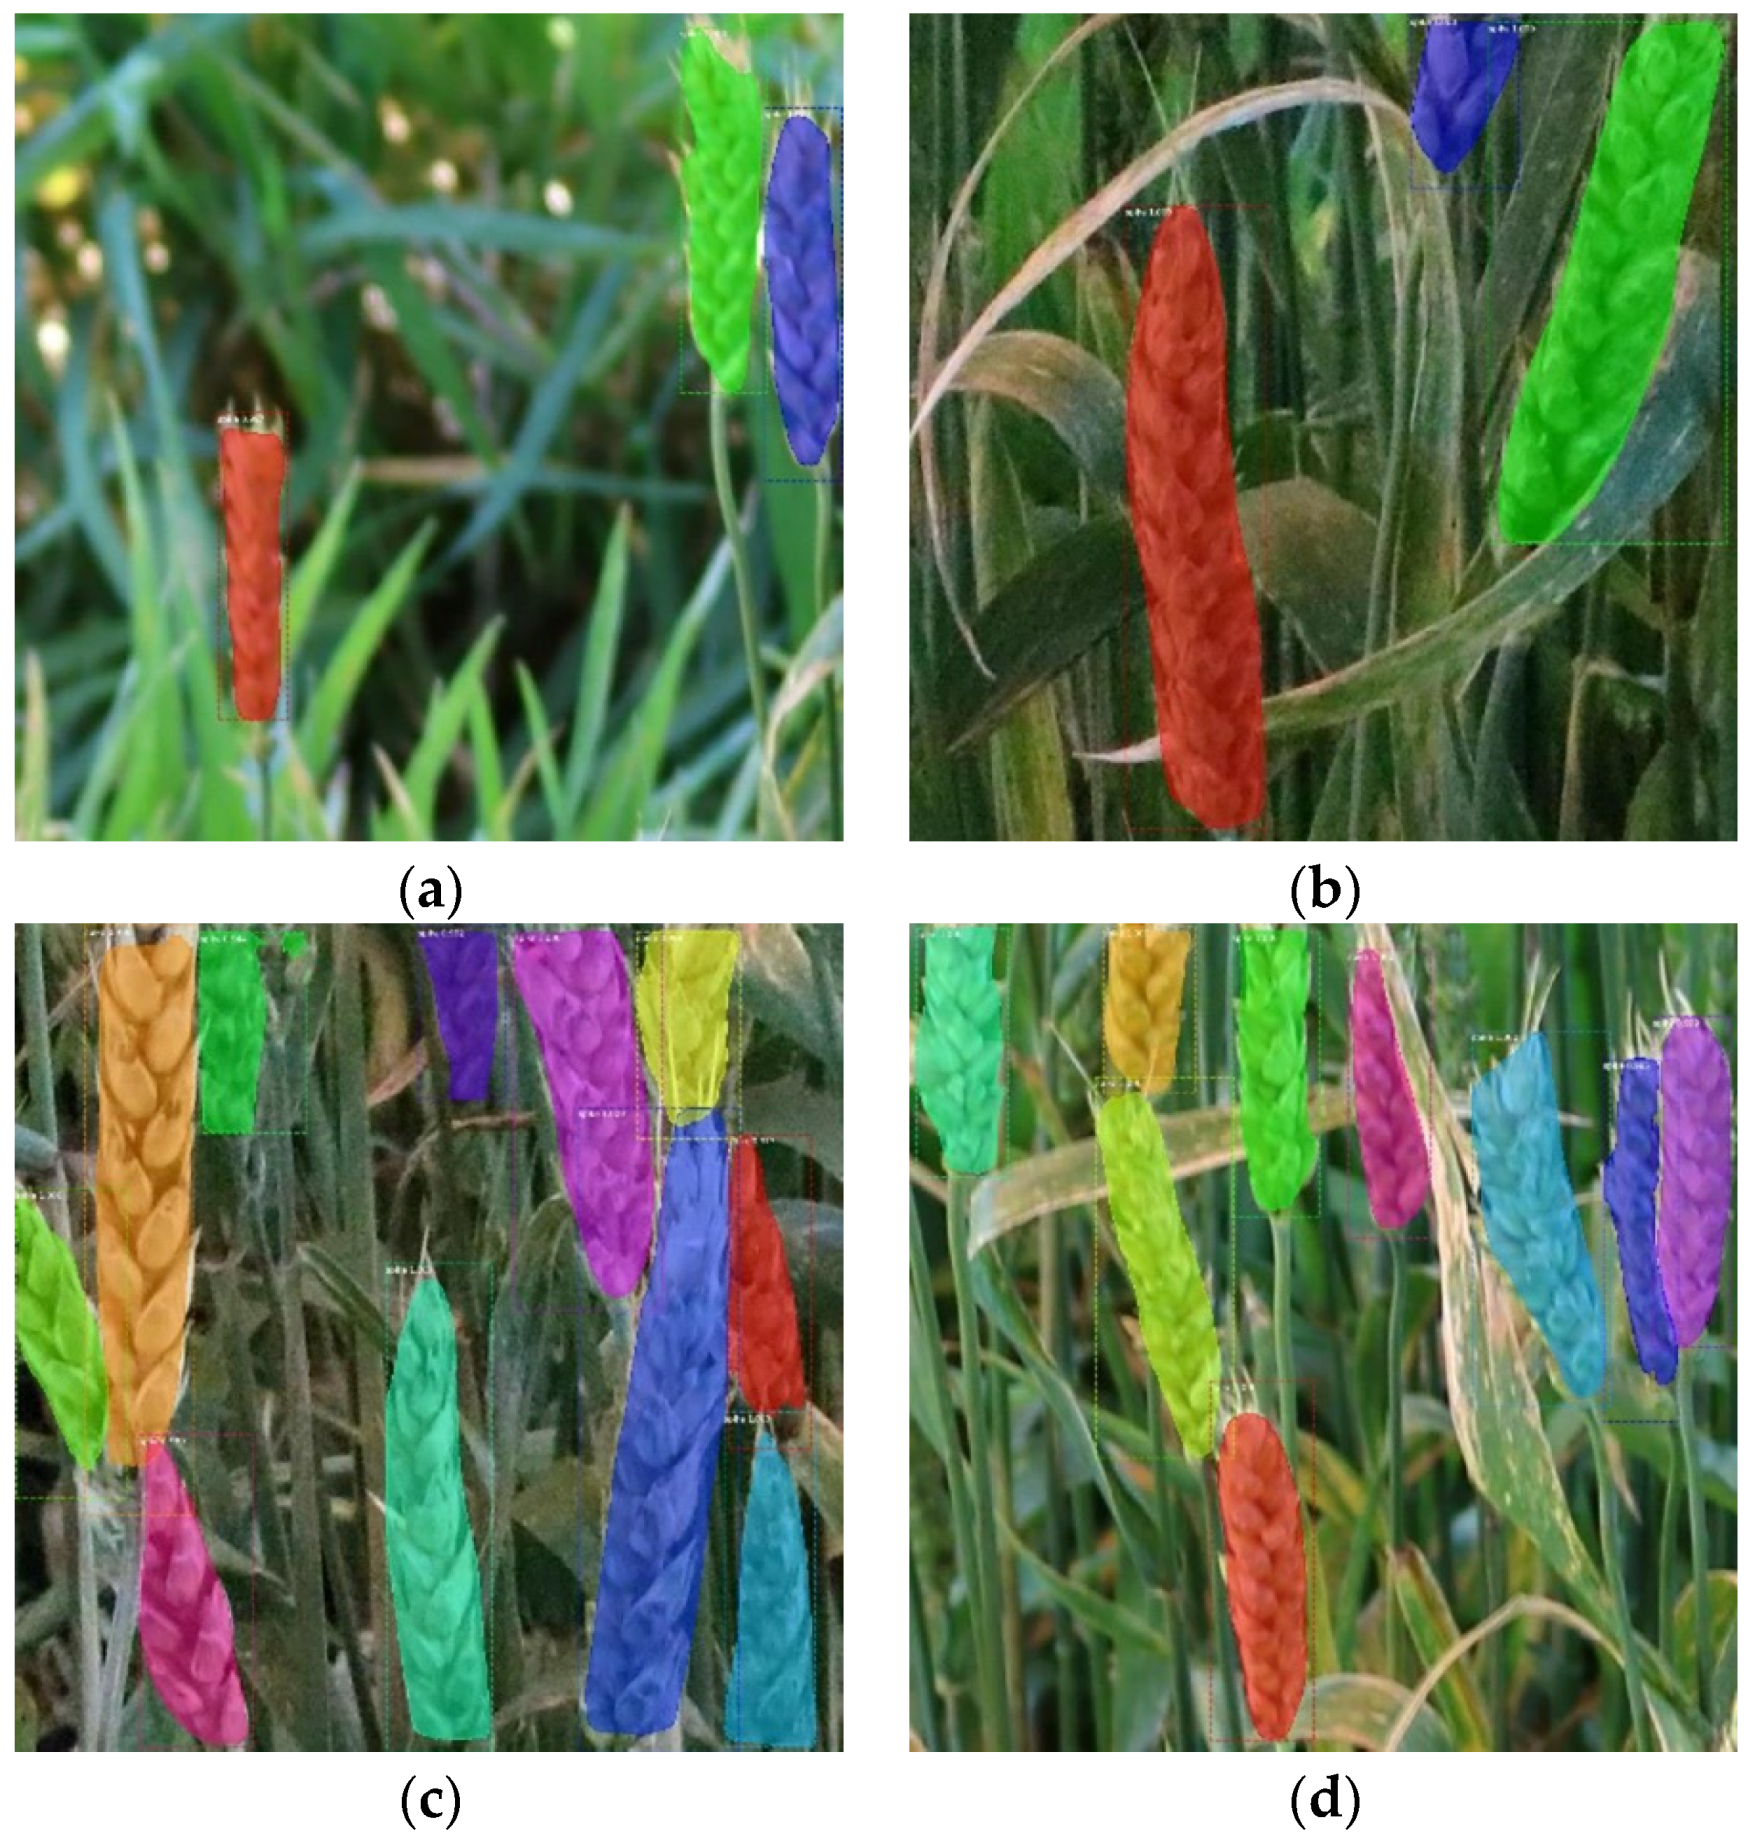
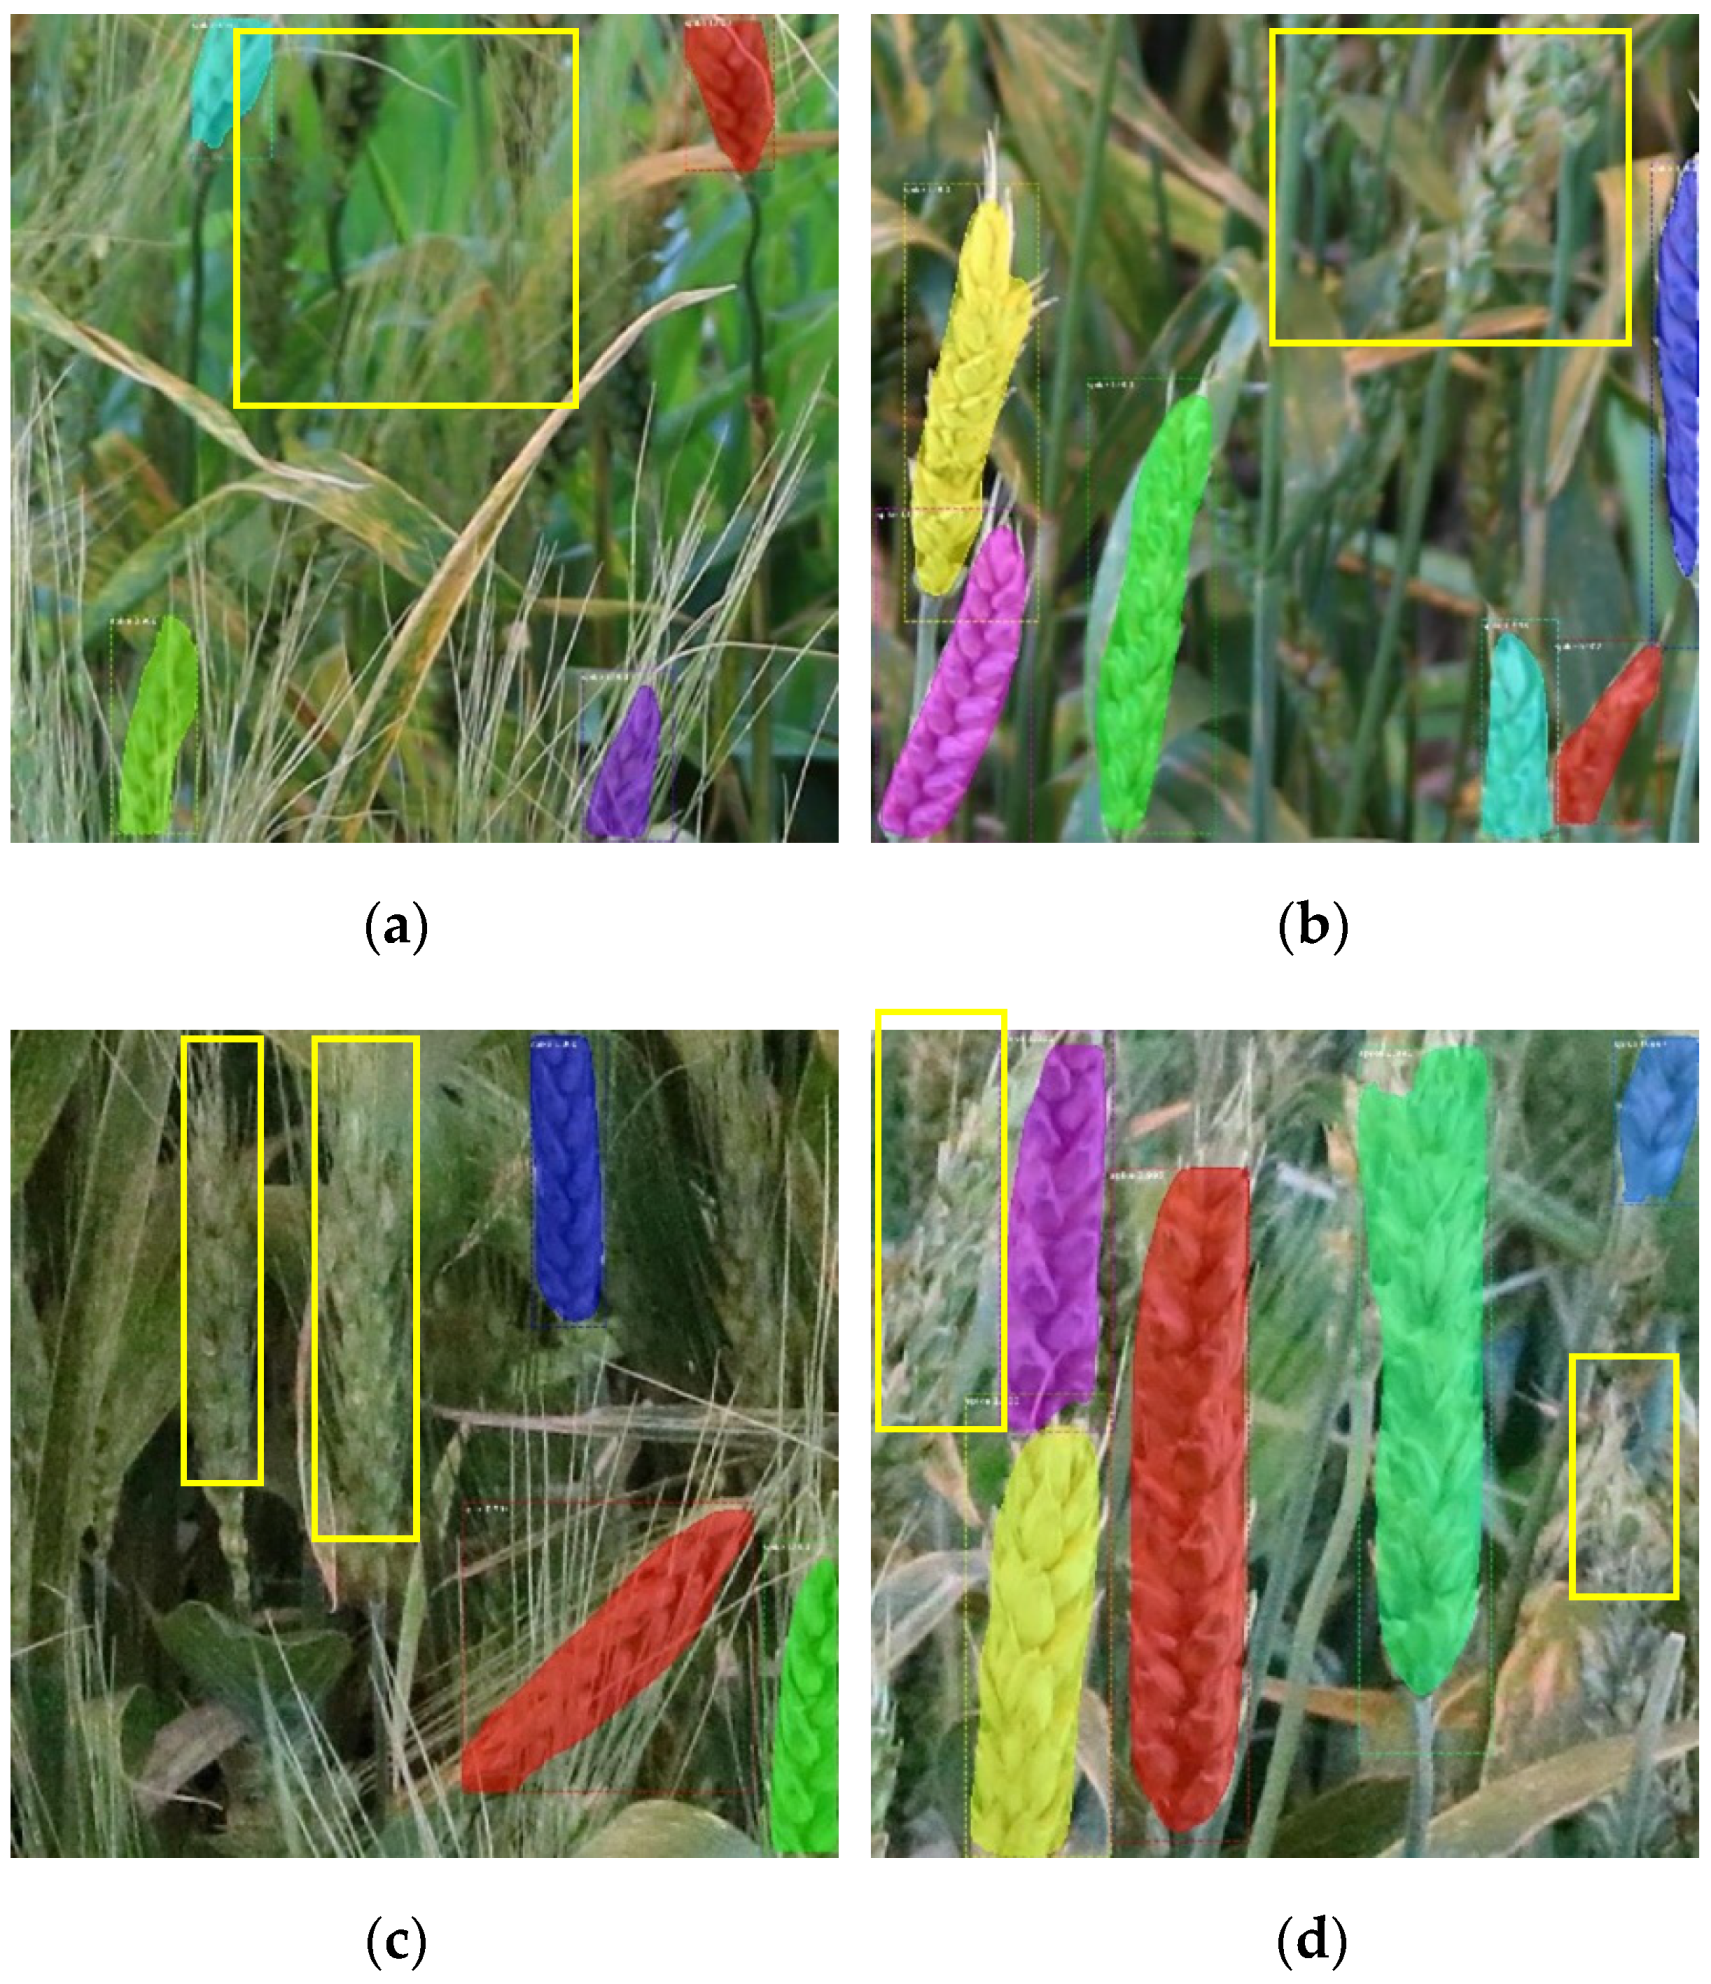
A Mask RCNN model was retrained and used to recognize the spikes in color images and generate masks for every spike, which is the basis for FHB detection. Therefore, the performance of the Mask RCNN model is essential. In this study, recall, precision, and mAP were implemented to assess the model. The retrained model demonstrated favorable performance in spike detection (mAP is 0.9201). However, some questions should be addressed and analyzed further. First, the spikes represent various orientations in the color images. Some neighboring spikes overlapped or their edges touched, which made detecting each spike difficult. This difficulty is also the shortcoming of the Mask RCNN model. Second, the color images contain not only entire spikes, but also many partial spikes. The tests showed that the retrained model could detect some partial spikes in the middle of the color images. However, it was less effective at recognizing spikes located at the edges of an image or those not in the depth of field focus. Lastly, the setting of anchor parameters will affect the precision of spike detection. The spike sizes in color images need to be considered. Thus, the anchor parameters should be consistent with the spike sizes. If these parameters are not established, small spikes will be missed and only a portion of large spikes will be detected.
In addition, the tests showed that the awns of wheat could slightly influence spike detection. The DCNN model was retrained using the labeled spikes. The labeled spikes contain spikelets, and no leaves for both awned and awnless wheat lines, so other leaf diseases (e.g., leaf rust, leaf spot) can not affect spike detection. For awned spikes, some labeled regions may contain many awns, but the spikelets are visible. If the spikes are not completely covered by surrounding awns, the model is able to detect spikelets and recognize spikes.
4.2. Analysis of FHB Detection
A new color feature, GB, was proposed in this study. The results showed that this color feature adequately used the differences between healthy and diseased spikelets to recognize and segment the FHB-infected areas of spikes. However, some factors negatively affecting FHB detection remain. First, the timing for image capture is critical. The best time to assess FHB in wheat is when maximum disease severity has been reached, but before senescence due to maturity starts to occur in the healthy tissue. The reason for this is due to the color of senescent tissue closely resembling tissue infected by FHB. The greater the contrast between the colors of healthy vs. diseased tissue, the better the model will perform for segmenting FHB-infected areas. Since different wheat varieties have different maturation dates, assessments for FHB must be made several times during the season to capture the optimal timing for each. Another potential problem is that many diseased areas are too small to be preserved when the close operation was conducted, which results in an underestimation of FHB infection. This is particularly true of diseased areas on the edges of spikelets, which are likely to be ignored.
Furthermore, the effect of wheat awns on detecting diseased areas should be considered. This effect is likely due to the colors of wheat awn being similar to the diseased spikes being similar to the diseased spikes as they begin to senesce.
4.3. Next Steps
The implementation of a DL technique increases the feasibility of FHB detection in wheat under field conditions, but further work needs to be conducted in the future to improve the precision of FHB detection. First, images should be taken across different developmental stages to obtain the optimal timing for capturing maximum disease progression before the beginning of senescence. Second, additional images of wheat spikes from diverse lines (i.e., with different shapes, sizes, and hues), with different views, should be captured and tested, to enlarge the training dataset and improve the robustness and applicability of the trained model and FHB detection. Third, in this paper, spikes were first detected and then FHB-infected areas of each spike were segmented. A new thought can be verified to train a model that can detect FHB-infected areas in wheat directly. In this case, FHB-diseased samples must be labeled. Fourth, for applications related to genetic inheritance and mapping studies, greater precision is required for severity. With data for pixels distinguishing healthy and diseased areas or spikelets of a sample population of spikes, one could derive a mean FHB severity for individual wheat varieties at a tremendous savings in time, labor, and cost over manual scoring methods that are currently utilized.
Eventually, based on the results of this study, special attention can be given to processing the color images collected in the natural ambient illumination environment.


 ,
, 


