Article

Lunar Calibration for ASTER VNIR and TIR with Observations of the Moon in 2003 and 2017

1
Artificial Intelligence Research Center, National Institute of Advanced Industrial Science and Technology, 2-4-7 Aomi, Koto-ku, Tokyo 135-0064, Japan
2
Research and Development Division, Japan Space Systems, 3-5-8 Shibakoen, Minato-ku, Tokyo 105-0011, Japan
3
Geological Survey of Japan, National Institute of Advanced Industrial Science and Technology, Central 7, Higashi 1-1-1, Tsukuba 305-8567, Japan
4
Department of Information Science and Technology, Aichi Prefectural University, 1522-3 Ibaragabasama, Nagaute, Aichi 480-1198, Japan
*
Author to whom correspondence should be addressed.
Remote Sens. 2019, 11(22), 2712; https://doi.org/10.3390/rs11222712
Submission received: 21 October 2019 / Revised: 15 November 2019 / Accepted: 17 November 2019 / Published: 19 November 2019
(This article belongs to the Special Issue ASTER 20th Anniversary)

Abstract

:
The Advanced Spaceborne Thermal Emission and Reflection Radiometer (ASTER), which is a multiband pushbroom sensor suite onboard Terra, has successfully provided valuable multiband images for approximately 20 years since Terra’s launch in 1999. Since the launch, sensitivity degradations in ASTER’s visible and near infrared (VNIR) and thermal infrared (TIR) bands have been monitored and corrected with various calibration methods. However, a unignorable discrepancy between different calibration methods has been confirmed for the VNIR bands that should be assessed with another reliable calibration method. In April 2003 and August 2017, ASTER observed the Moon (and deepspace) for conducting a radiometric calibration (called as lunar calibration), which can measure the temporal variation in the sensor sensitivity of the VNIR bands enough accurately (better than 1%). From the lunar calibration, 3–6% sensitivity degradations were confirmed in the VNIR bands from 2003 to 2017. Since the measured degradations from the other methods showed different trends from the lunar calibration, the lunar calibration suggests a further improvement is needed for the VNIR calibration. Sensitivity degradations in the TIR bands were also confirmed by monitoring the variation in the number of saturated pixels, which were qualitatively consistent with the onboard and vicarious calibrations.

Graphical Abstract

1. Introduction

The Advanced Spaceborne Thermal Emission and Reflection Radiometer (ASTER), which is a multiband-sensor suite composed of visible and near infrared (VNIR), shortwave infrared (SWIR), and thermal infrared (TIR) sensors onboard Terra [1], has successfully operated for 20 years since Terra’s launch in 1999, and ASTER has provided numerous multiband images for those 20 years [2]. Similar to other spaceborne sensors, accurate radiometric calibration has been a center issue for the ASTER mission to provide reliable datasets. During the mission, characteristics of the radiometric performance of ASTER have been continuously monitored with several calibration methods, such as onboard calibration [3], vicarious calibration [4,5,6] and cross calibration [7,8], and sensitivity degradations in the VNIR, SWIR, and TIR have been confirmed. Since the measurement of the sensitivity degradations is used for correcting the observed brightness in ASTER products as radiometric correction coefficients (RCC), the accurate measurement for the degradation is important to maintain the reliability of the ASTER products. The latest version of the RCC is version 4, which has been used since February 2014 for Level 1A processing, and the RCC was developed based on both onboard and vicarious calibration methods [9].
Due to the unresolved uncertainty in each calibration method, however, it has been confirmed there are large discrepancies among the results from the calibration methods for the VNIR bands [10]. For instance, the onboard calibration method measured a 10% larger sensitivity degradation for the shortest-wavelength band of the VNIR bands than that from the vicarious calibration method in 2015 [10]. Because the current RCC for the VNIR products uses a degradation trend based on both onboard and vicarious calibration methods, an additional calibration method for assessing the inconsistency between them has been expected to improve the RCC [10].
For the visible and near-infrared wavelength regions, lunar calibration has become a common calibration method and a standard calibration approach in an international satellite community [11], because it can accurately evaluate a temporal (i.e., relative) variation in a senor’s sensitivity (on the order of 0.1%) [12,13,14]. Thus it is good for stability monitoring of a sensor [15], although the absolute accuracy of the lunar calibration method has been considered insufficient yet (5–10%) [16]. The better accuracy of the lunar calibration method for the relative degradation can be used for assessing the validity of onboard and vicarious calibration methods for the VNIR bands.
The lunar calibration method can be conducted through a comparison of the observed Moon brightness with the expected Moon brightness derived from lunar brightness models, such as a model developed based on radiance images acquired by the ground-based RObotic Lunar Observatory (ROLO) [17], and a model developed from observations by Spectral Profiler (SP) onboard SELENE, which was a Japanese lunar exploration orbiter. SP observed whole lunar surfaces with various illumination conditions without any significant degradation [18,19]. The ROLO models allows to simulate irradiance of the Moon observed from the Earth or from a low Earth orbit [17], and the SP model allows the simulate of any observation of the Moon with any observation geometry [20].
In addition to VNIR calibration, the Moon can be used to confirm the sensitivity degradation of the TIR bands by monitoring variation in the number of saturated pixels in a TIR image when the TIR sensor observes the Moon. This is because if sensitivity degradation of a TIR band occurs (i.e., the dynamic range of the TIR band is broadened) then the TIR band can capture areas of higher temperature without saturation. In 2003, because of the high temperature of the lunar surface around the sub-solar point (more than 120 °C [21]), the TIR images of the Moon had many saturated pixels. On the other hand, based on the degradation trend in the TIR bands [6], it is expected that the TIR sensor captured images of the Moon with a much smaller number of saturated pixels in 2017 if the TIR observes the Moon with a lunar surface temperature profile similar to that in 2003. Therefore, if we see a smaller number of saturated pixels in TIR images in 2017 as we expected, it supports the sensitivity degradation of the TIR bands, at least qualitatively.
In this study, we present a lunar calibration result for ASTER based on two lunar observations conducted in 2003 and 2017. For the VNIR bands, we will compare the observed lunar brightness with the expected lunar brightness from the lunar surface reflectance models (the SP and ROLO models). For the TIR bands, we will confirm the distribution of saturated pixels in 2003 and 2017. Each lunar calibration result will be used to assess validity of the results from other calibration approaches.

2. Lunar Observations and Data

Lunar calibration has a good ability for measuring relative variations in the sensor sensitivity of a sensor with a small uncertainty (the order of 0.1%) [13]. To measure the relative variation in a sensor sensitivity, at least two lunar observations are required. ASTER first observed the Moon in April 2003 with special pitch maneuver of Terra, which was required to observe the Moon with sensors that have narrow fields of view, especially for the ASTER VNIR, SWIR and TIR. Fourteen years later, in August 2017, ASTER successfully observed the Moon again. Therefore, we can apply the lunar calibration method for ASTER by using the two observations of the Moon in 2003 and 2017. Because the Moon is an irregular observation target for Terra, the lunar observation required careful discussion and well-prepared operations of the pitch maneuver in terms of reducing any operational risk. This is a part of reasons we needed the 14 years between the two lunar observations. In this study, we focused on the ASTER VNIR and TIR sensors that observed the Moon in both 2003 and 2017 (the SWIR sensor observed the Moon only in 2003 due to the rise in temperature of the detectors since May 2008, which has resulted in saturation and severe striping [22]).
Both the VNIR and the TIR sensors are multi band sensors; the VNIR sensor has three observation bands, and the TIR sensor has five bands. The specifications of both sensors are listed in Table 1. Because of the high spatial resolution of ASTER images, the Moon can be resolved with several hundred of pixels by the VNIR bands and ~100 pixels by the TIR bands. Note that to construct pairs of stereo images, the VNIR sensor is composed of two telescopes: a nadir-looking telescope and a backward-looking direction. The nadir-looking telescope has three bands (Band 1, Band2, and Band 3N), and the backward-looking telescope has one band (Band 3B) whose wavelength range is the same as that of Band 3N.
In Table 2, the geometries of ASTER’s observations of the Moon in 2003 and 2017 are summarized. Each parameter is required for using both the ROLO and SP models. Although the lunar surface condition is photometrically stable (e.g., changes that influence lunar irradiance at the 1% level are expected at intervals of the order of 108 years [23]), it has been known that different observation geometries may cause a calibration uncertainty of up to 1% due to the complicated surface features of the Moon [17]. To reduce this uncertainty, we choose the observation date of 2017 when ASTER could observe the Moon with an observation geometry similar to that from 2003. In both observations, deepspace was also in ASTER’s field of view and was observed before and after capturing the Moon, which can be used for assessing the bias level of the observation.

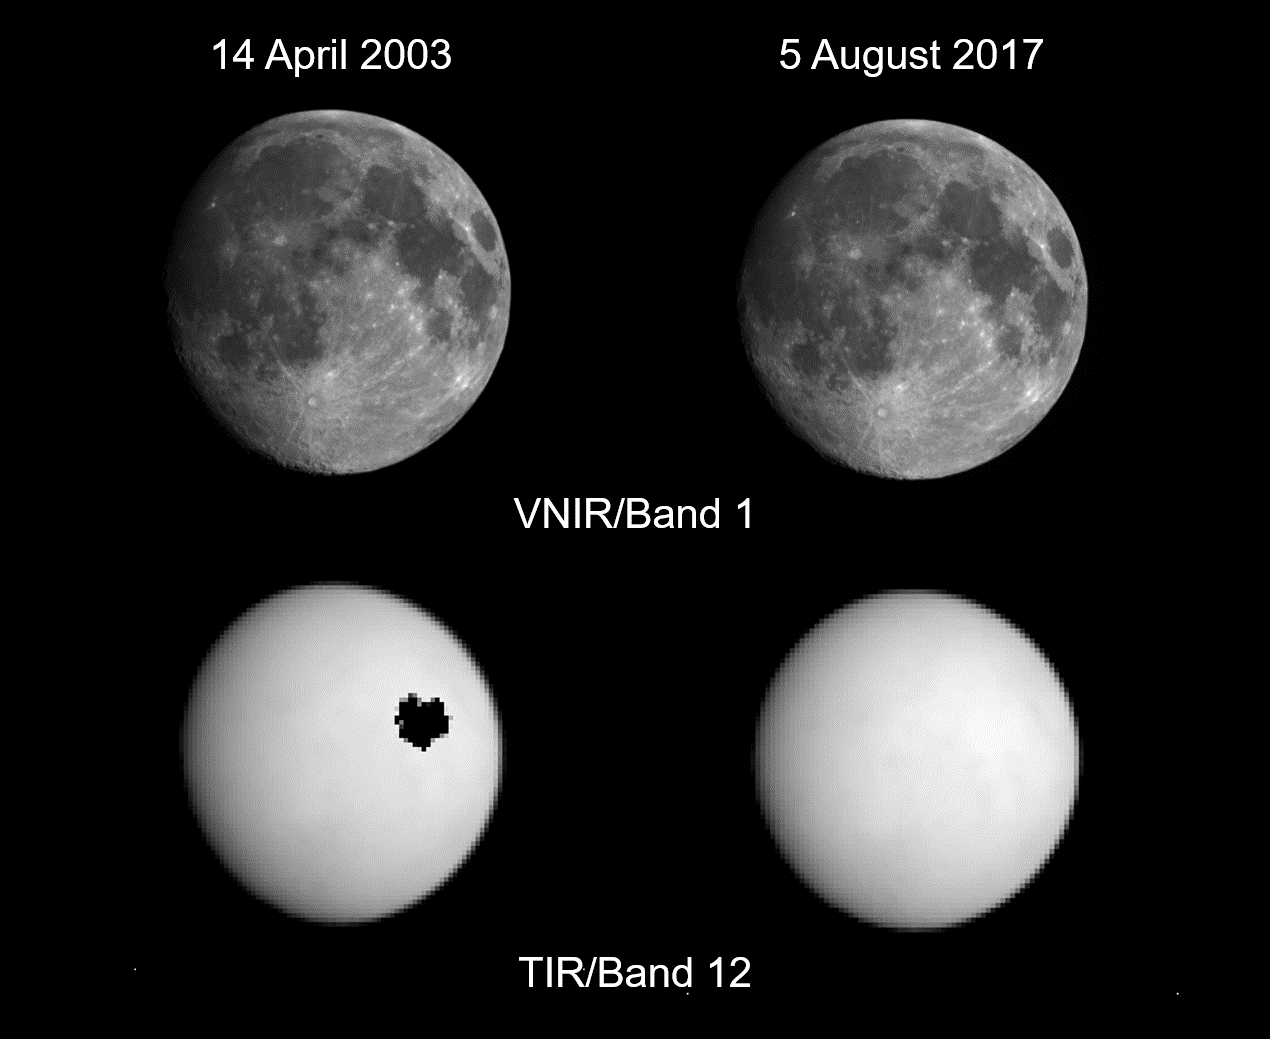
2.1. Lunar Images Taken by the Visible and Near Infrared Bands

At the lunar observations, Terra changed its attitude with pitch maneuver from its nominal one to the attitude in which sensors onboard Terra could see the deepspace and the Moon. According to the pitch rotation, the VNIR and TIR scanned the Moon almost from north to south. To avoid the “undersampling” condition in which ASTER may miss observing some regions of the lunar surface, ASTER observed the Moon at a slower rotation speed for Terra than usual, so that the same region of the Moon was observed several times (called the “oversampling” condition). Figure 1 shows an example of lunar images obtained by the VNIR bands whose oversampling effect was not corrected. Due to the oversampling effect, the silhouette of the observed Moon was an ellipse, whereas the actual shape of the Moon is circle.
The factor of the oversampling effect can be measured from information on the attitude control of a satellite in an observation of the Moon or can be measured with an image-processing method, such as fitting an ellipse to the elongated Moon (Appendix A). By adopting the ellipse-fitting method based on [24], we found that the oversampling factors were 4.57 in 2003 and 4.58 in 2017 whose uncertainties were less than 0.03 measured from residuals of the fitting, and we confirmed that these values were consistent with information on the attitude control provided by the Terra Flight Dynamics Team, 4.55 measured from the planned pitch maneuver rate of 0.122 degree s−1 [25] (Appendix A).

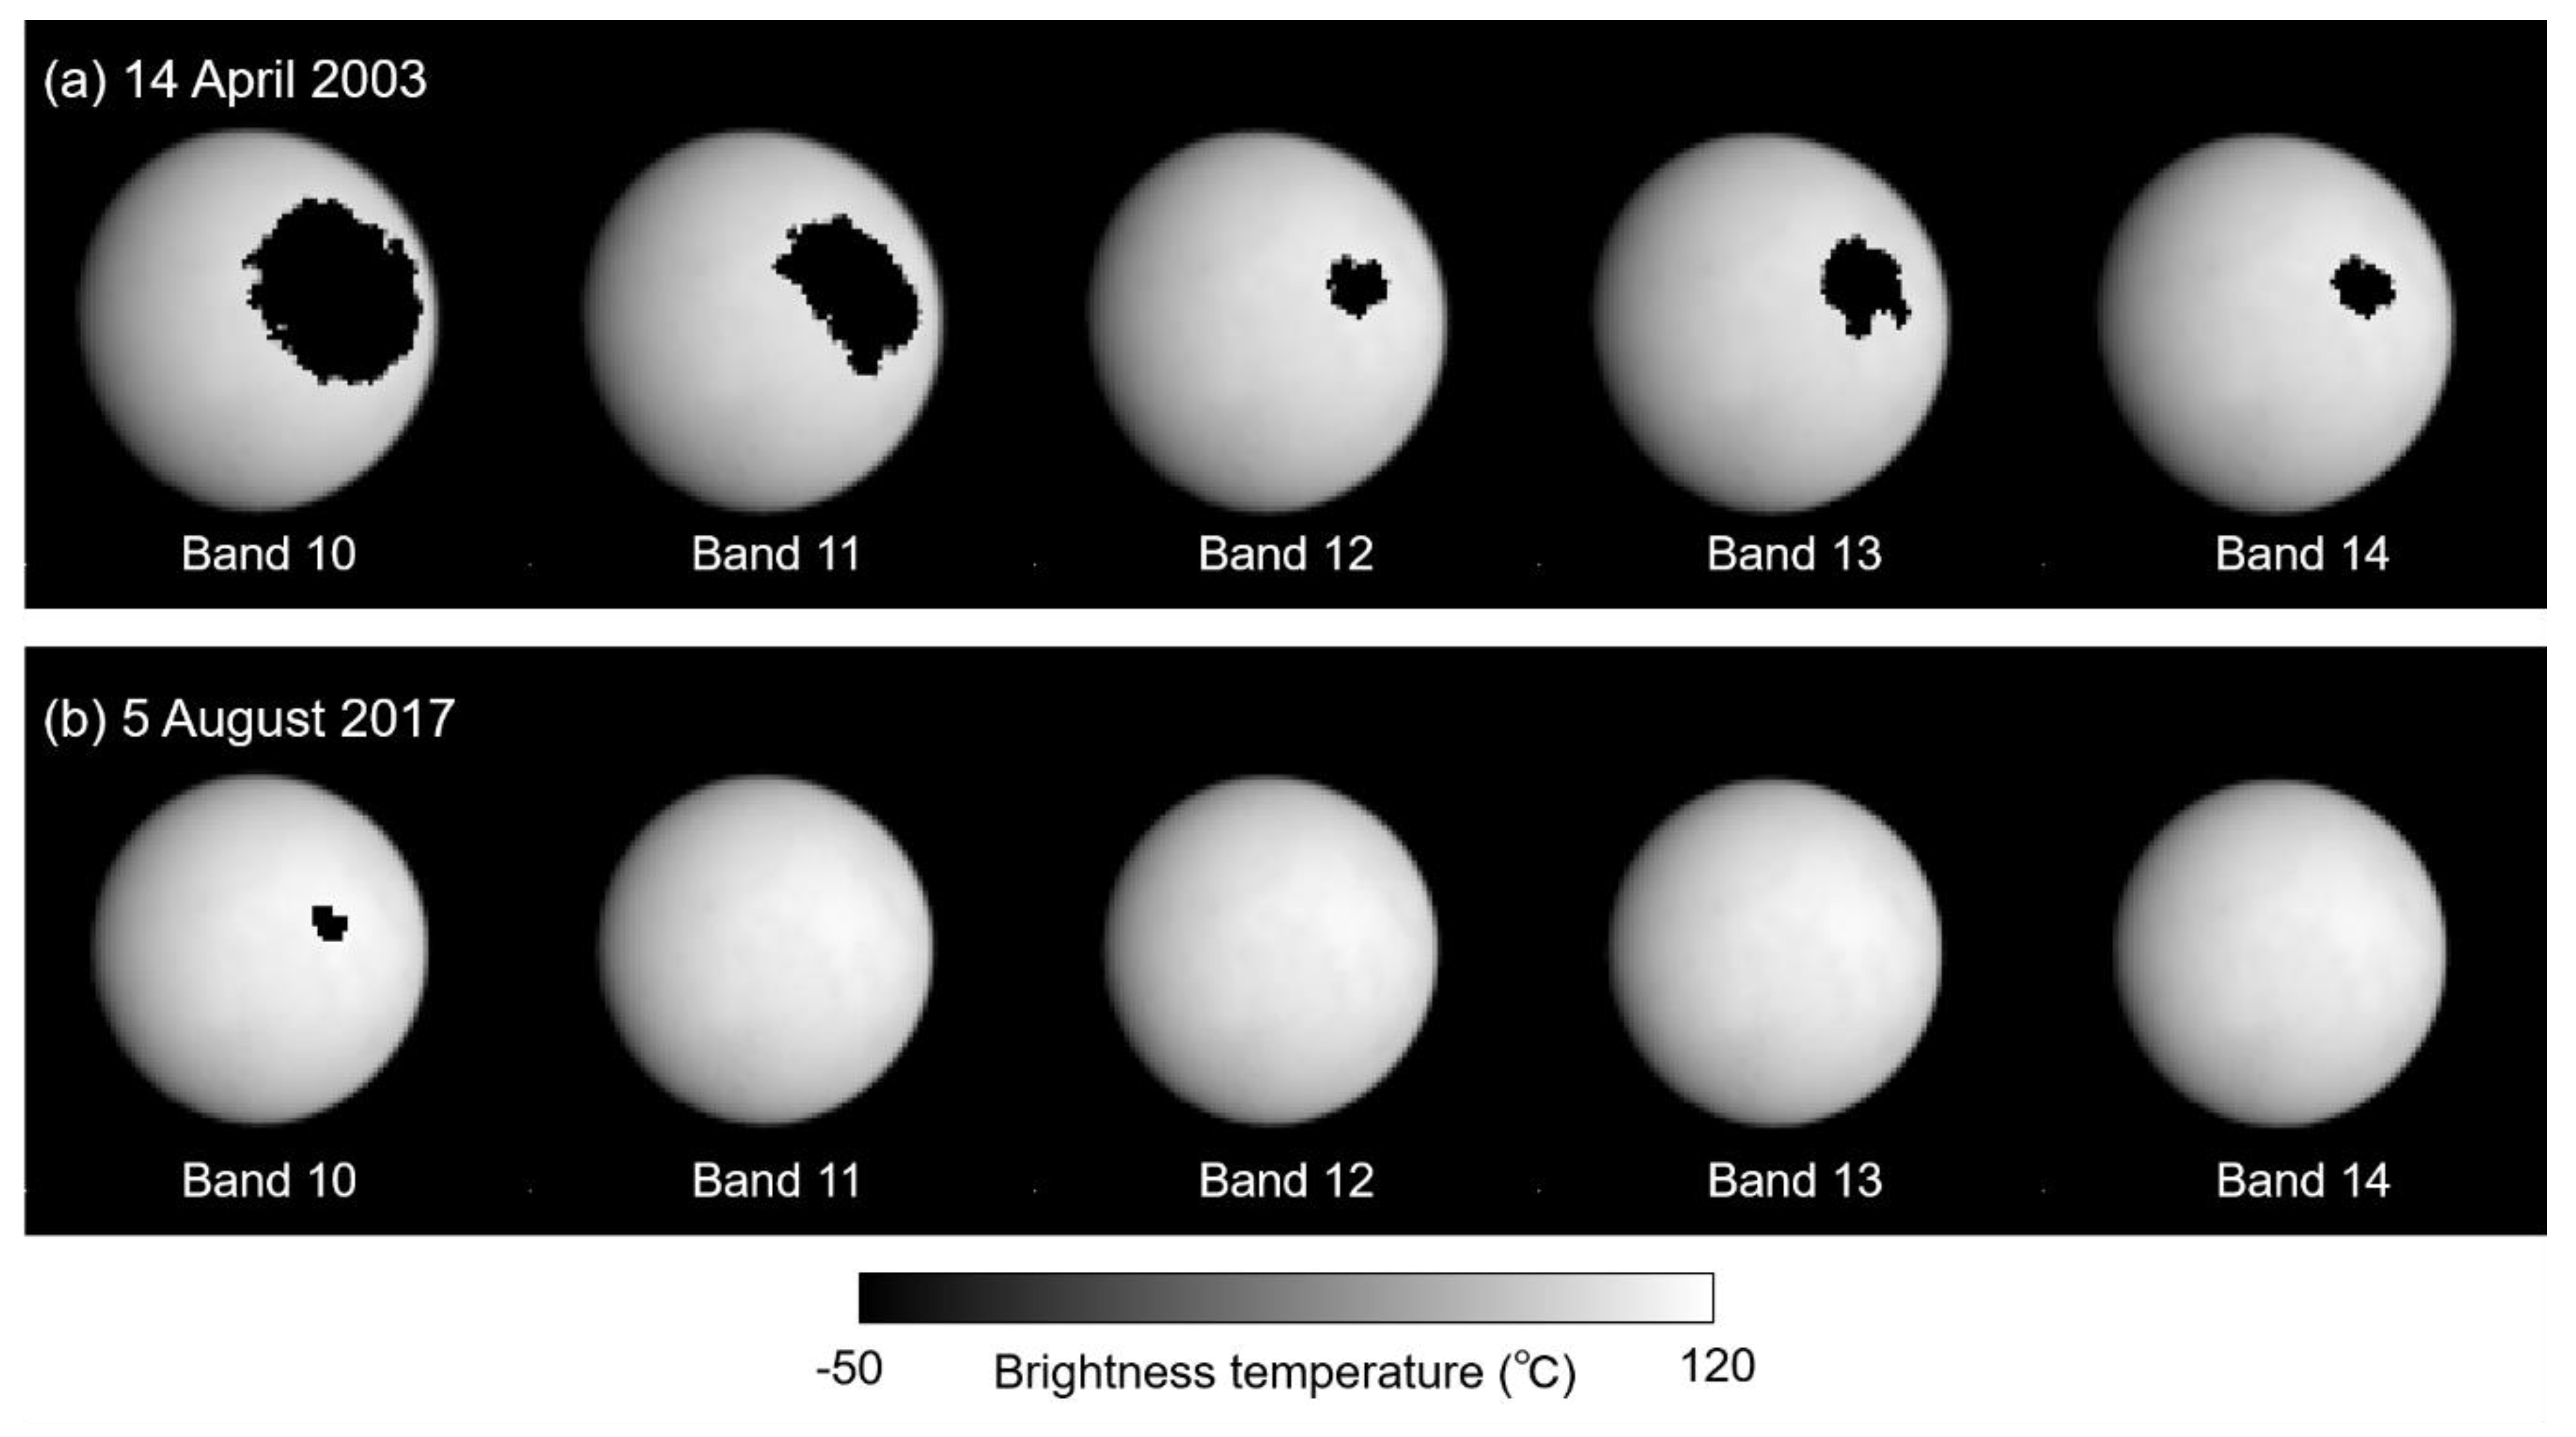
2.2. Lunar Images Taken by the Thermal Infrarred Bands

At the same time as the VNIR observations, the TIR sensor observed the Moon with Bands 10 to 14 in both 2003 and 2017. Figure 2 shows examples of the lunar images taken by the TIR sensor in 2003 and 2017 with Band 10. Since the TIR sensor is a whisk-broom sensor with 10 detectors for each band and the lunar observations were conducted under oversampling conditions same as the VNIR, the Moon was observed as a discrete shape, though the TIR sensor observed the whole lunar disk without any observation gaps (Appendix A). In 2003, due to the high temperature of the lunar surface around the sub-solar point (more than 120 °C), many pixels around the subsolar location were saturated. This saturation occurred because the specifications of the TIR bands were adjusted to monitor the temperature profile of the terrestrial surface. On the other hand, there were fewer saturated pixels in the images from 2017 and the saturation level was higher in 2017 than in 2003, which should reflect the sensitivity degradation over the 14 years. The validity of the saturation level is discussed in Section 4.

3. Lunar Calibration for the Visible and Near Infrared Bands: Evaluating the Sensitivity Degradation

Because the brightness of the Moon depends on several geometric parameters (such as the distance between the Sun and the Moon, distance between the Moon and an observer, the phase angle between the Sun, the Moon, and an observer), it is difficult to investigate the VNIR’s sensitivity variation simply by comparing the lunar brightness observed at different times. In the lunar calibration approach, to address the dependence of the lunar brightness on geometric parameters, a simulation of the lunar brightness that can reproduce the geometric dependence is required. Then, by comparing the ratio between the observed and the simulated lunar brightness (the former is affected by the sensor sensitivity degradation and the latter is not affected), we can investigate how much the sensor experiences a sensitivity degradation.
In addition to simulating the lunar brightness, several basic image-processing procedures are also required to achieve better accuracy in measuring the sensitivity variation. To convert the digital numbers in the image of the Moon, which are the original output from the VNIR sensor, to a physical quantity, i.e., the radiance (W m−2 sr−1 μm−1), we used the latest version (version 4) of the RCC that was distributed by the ASTER Science Team and Japan Space Systems [22]. The RCC contains parameters for flat-fielding, removing bias, and correcting temporal variations in the sensor sensitivities of the VNIR bands, which are derived from ASTER’s onboard calibration and a vicarious calibration. Note that in this study, the correction of the temporal variations in the sensitivities of the VNIR bands was not performed for investigating the variations in the sensitivity by lunar calibration.
In this section, we will first show the additional correction for the remaining bias that was found through analyzing the deepspace region, and then we will show the lunar calibration result based on the lunar reflectance models (the SP and ROLO models).

3.1. Bias Reduction by Deepspace Observations

Ideally, if no energy is input into a detector, no digital count is expected. However, due to dark currents, stray light, and other reasons, offset counts are usually observed, which may affect the uncertainty in the radiometric measurements of a target. Therefore, the temporal variations in the offset levels in the VNIR bands are monitored with an onboard calibration system and night-side observations [3].
Deepspace is an ideal target to validate offset monitoring because a detector receives no energy input from deepspace. Before and after scanning the Moon, ASTER also observed deepspace with several thousand lines. Figure 3 shows an example of averaged offsets in deepspace regions that were measured from a lunar and deepspace image taken by VNIR Band 1 in 2003. Small but nonzero offsets remained in all bands in both 2003 and 2017, even after the expected offsets based on the RCC were subtracted from the images. Even pixels and odd pixels have different amplification circuits, and the difference may affect profiles of the offset values for even and odd pixels [26]. Since the remaining offsets may affect the lunar calibration accuracy for which we assumed no remaining offset, we subtracted the offset at each pixel and successfully reduced the offsets to less than 10−3 W m−2 sr−1 μm−1 that can be ignored when measuring the lunar brightness.

3.2. Sensitivity Degradation from 2003 to 2017

Because the appearance of the Moon is different under different observation conditions (phase angles and libration conditions), it is difficult to evaluate the sensor sensitivity degradation by directly comparing the lunar brightness in different observations. Instead, in the lunar calibration method, the sensor sensitivity degradation is investigated by monitoring the variation in the ratio between the observed and expected brightness levels of the Moon. To evaluate the expected lunar brightness, we used two different lunar surface reflectance models, the SP model [19,20] and the ROLO model [17], to validate the consistency in the lunar calibration result.
The SP model is a map-base lunar surface reflectance model with a resolution of 0.5° × 0.5° that covers the whole lunar surface. Each grid in the SP model has hyper-spectral radiance factors that correspond to standardized lunar surface reflectance with a specified observation geometry (incident angle = 30°, emission angle = 0°, and phase angle = 30°). The wavelength coverage of the SP model is 512–1650 nm with 6–8 nm spectral intervals, which covers the wavelengths of the VNIR bands. In addition, the photometric dependence of the surface reflectance on incident, emission, and phase angles was also modeled in the SP model [19]. By utilizing the reflectance map and the modeled photometric dependence, we can simulate the lunar brightness as an image with any observation geometry [20]. On the other hand, the ROLO model provides an expected lunar irradiance that corresponds to integrated brightness over the whole lunar disk in an observed image. By modeling the dependence of disk-equivalent reflectance of the Moon on observation geometries as listed in Table 1, the ROLO model allows to simulate the lunar irradiance observed from the Earth or from a low-Earth orbit [17].
Figure 4a shows examples of the observed lunar images in 2003 and 2017 with VNIR Band 1, whose oversampling effects were corrected (Appendix B), and Figure 4b shows their SP simulations. Both the observed and simulated images were sufficiently similar (correlation coefficients > 0.99), which enables a pixel-by-pixel comparison between the observed and simulated lunar images [20].
Figure 5 shows the brightness ratios in 2003 and 2017 for Band 1 derived from the observed and simulated images of the Moon shown in Figure 4. As in Figure 5, the brightness ratio in 2017 was smaller than that in 2003 for the whole luanr disk, indicating that VNIR Band 1 experienced a sensitivity degradation during the 14 years. This tendency was the same in other bands. The amount of sensitivity degradation from 2003 to 2017 (i.e., the relative degradation) from the SP model can be measured by
r 2003 2017 = ( I o b s I s i m ) ¯ 2017 / ( I o b s I s i m ) ¯ 2003 ,
where I o b s represents the observed brightness, and I s i m represents the simulated brightness at each observation. The overbars in (1) indicate averaging over the region we used (incident angle < 60°, and emission angle < 45°). Similarly, the degradation can be measured from the ROLO model by using the total irradiance of the Moon as
r 2003 2017 = ( I r r o b s I r r R O L O ) 2017 / ( I r r o b s I r r R O L O ) 2003 ,
where I r r o b s is the observed irradiance and I r r R O L O is an expected irradiance of the Moon with the ROLO model (Appendix C).
Note that the reason why the lunar disk size in 2003 was larger than that in 2017 is that the distances to the Moon at the lunar observation in 2003 was 10% shorter than that in 2017 (see Table 2). Evaluations from both the ROLO and SP models are not affected by the distance variation, because the ROLO model includes a distance correction, whereas the SP models simulates a lunar image with a consideration of the distance.
Table 3 shows the sensor sensitivity degradations observed in VNIR Bands 1, 2, 3N, and 3B from 2003 to 2017 measured from the lunar calibration based on the SP and ROLO models. Note that following [20], only the limited regions (incident angle < 60° and emission angle < 45°) in the lunar disks were used for lunar calibration with the SP model, where the SP model provides valid brightness values [19]. For comparing observations with simulations from the ROLO model, which simulates the irradiance of the Moon, we integrated the observed radiance of whole lunar-disk pixels in the VNIR images to measure the irradiance of the Moon (see Appendix C).
Considering that the error ranges in lunar calibration can be up to 1% from the discussion in [16], the lunar calibration results from SP and ROLO models were consistent with each other for all bands within the error range. Since the two models were developed independently, the consistency between the two models indicates the validity of the lunar calibration results. The lunar calibration results suggested that the VNIR bands experienced the sensitivity degradations of three to six percent from 2003 to 2017.
Although the SP model is expected not to be accurate at an observation condition with large incident and emission angles [19], it is worth to investigate how the result from the SP model changes when we use the whole lunar disk that includes both large incident and emission angle conditions to understand the performance of the SP model more. A planetary exploration mission, Hayabusa 2, conducted the lunar calibration with such a severe condition in which it had to use the whole lunar disk because of the small disk size of the Moon [27,28], although only the SP model was applicable because Hayabusa 2 observed the far-side of the Moon. We confirmed that the results from using the whole lunar disk provided basically lager degradation values, but the difference was only 1% from the results of the SP model (nominal case) and the ROLO model (Table 3). In addition, because an image registration technique is performed for simulation of the lunar image with the SP model [20], the accuracy of the lunar calibration with the SP model should not be sensitive to the accuracy of the oversampling factor. Indeed, even when we used a wrong oversampling factor (we tested with the factor of 4.2), we confirmed the measured degradation for the VNIR Band 1 from 2003 to 2017 was 3.1%, which was the same as the degradation when we used the correct oversampling factor. The robustness of the SP model against the accuracy of the oversampling factor should be worth to be investigated in future studies.
Finally, we confirmed the linearity of the VNIR bands by comparing the simulated and observed lunar brightness in 2003 and 2017 (Figure 6 for Band 1). In both years, the brightness distributions had clear linear relationship in all bands as in Figure 6, indicating no significant linearity variation happened in the VNIR bands.

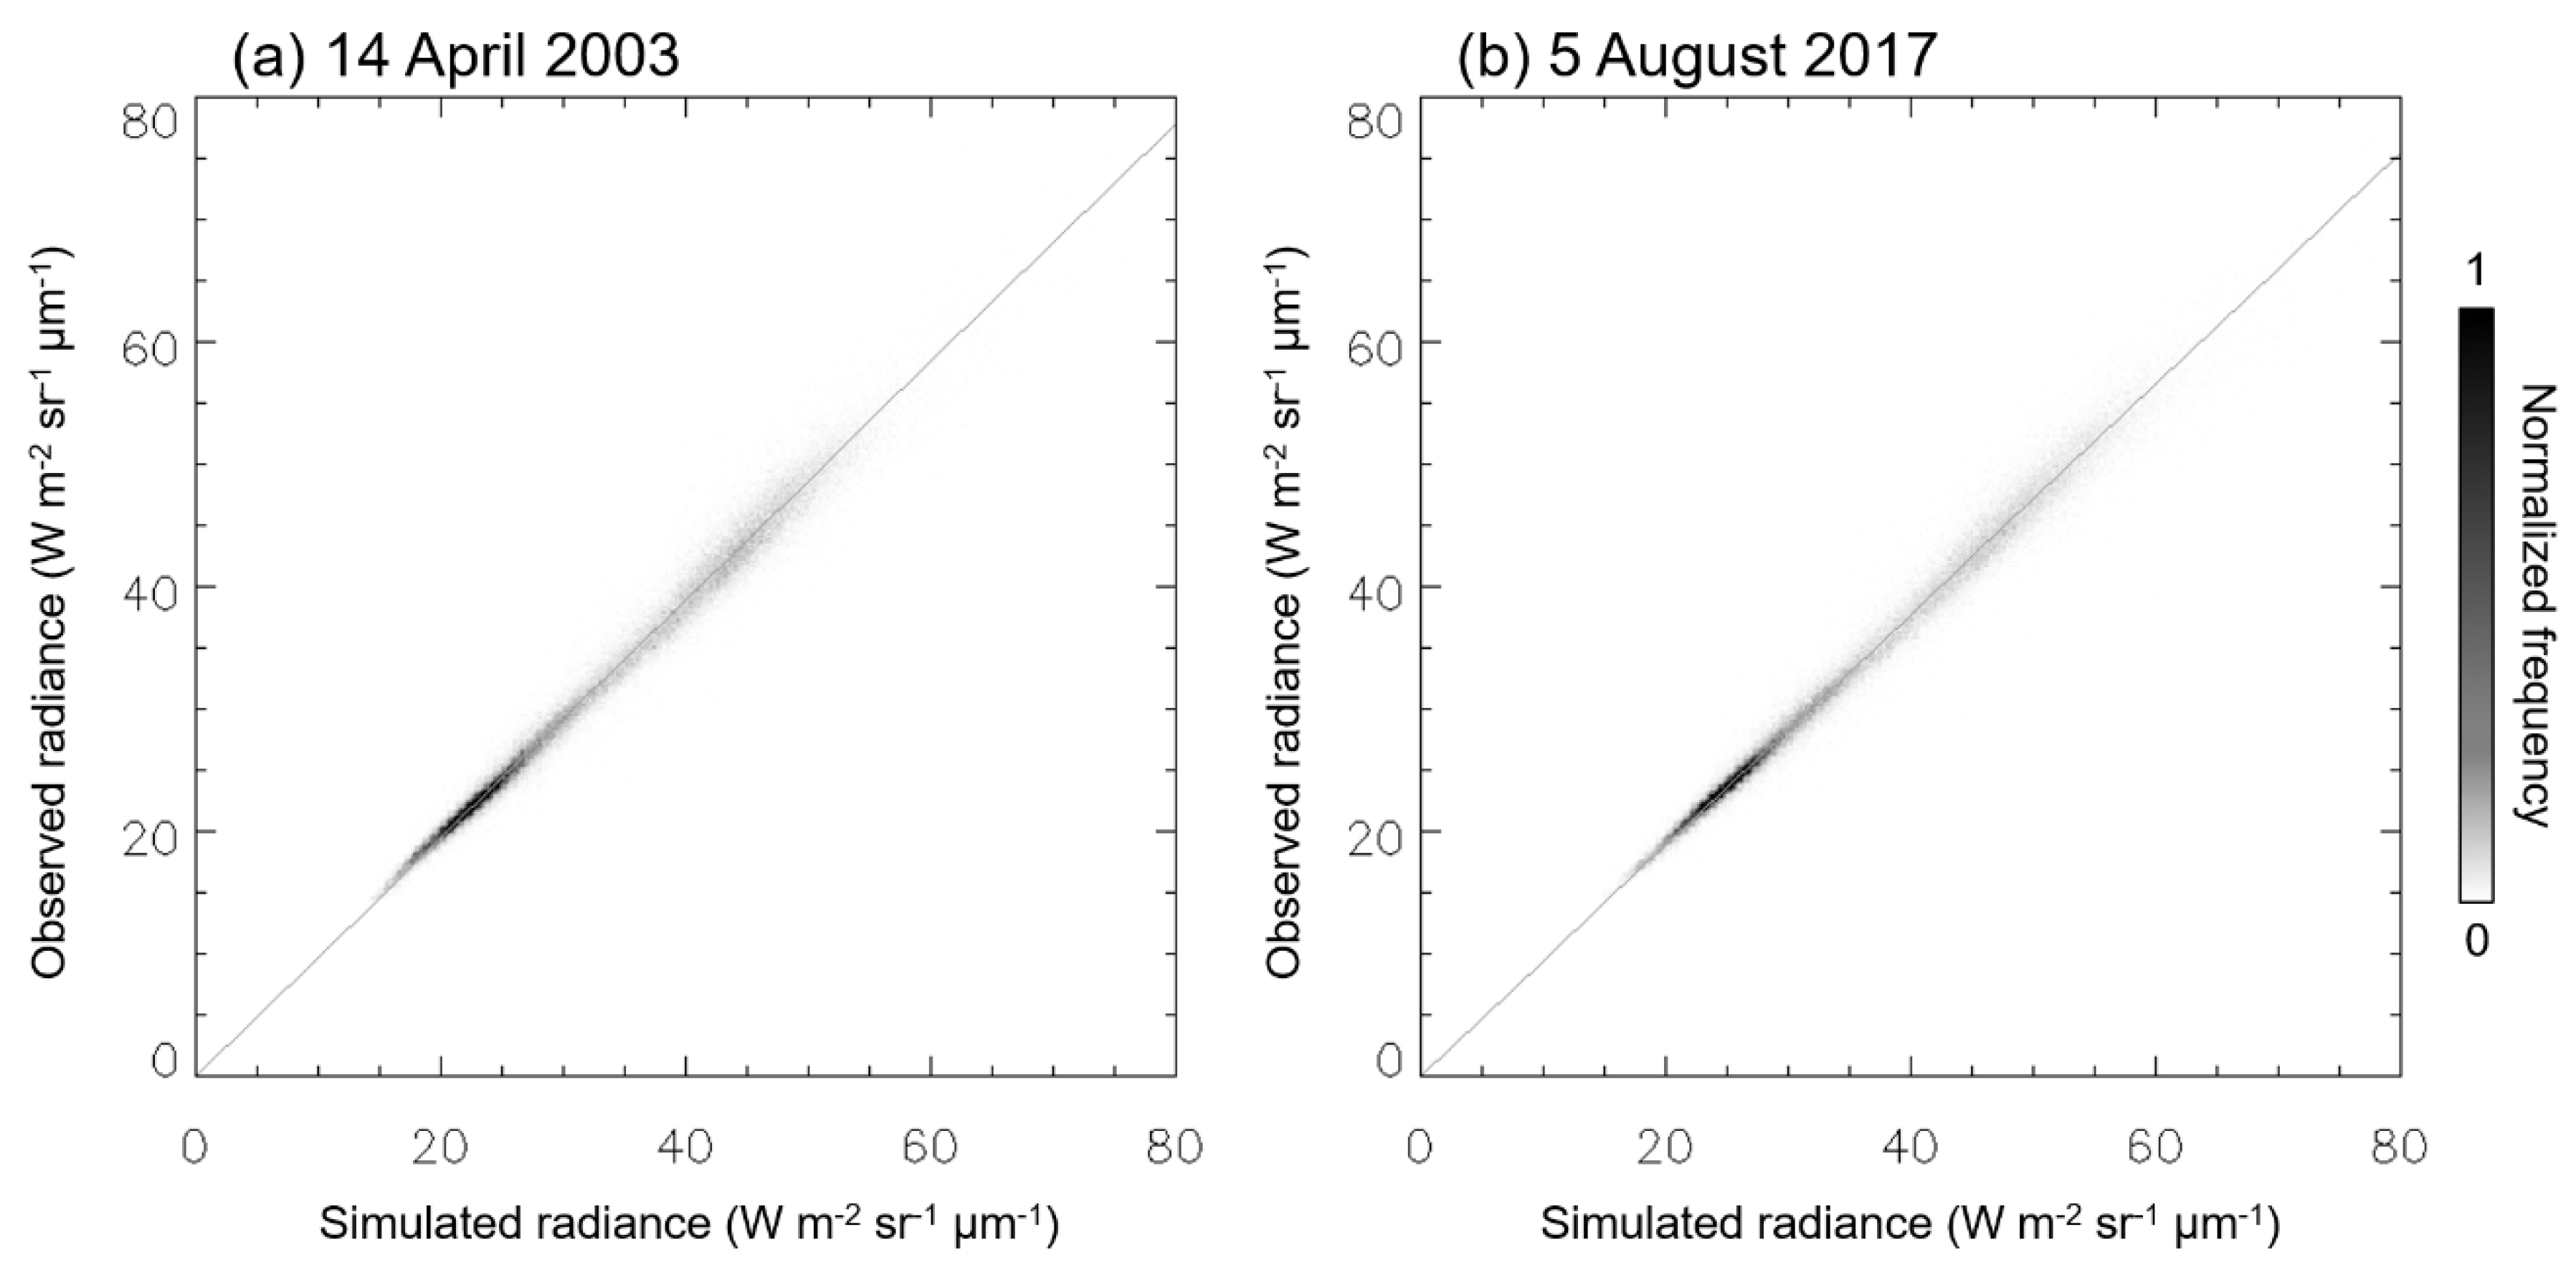
4. Lunar Calibration for the Thermal Infrared Bands: Validation of the Measured Sensitivity Degradation

For the TIR bands, the amount of sensitivity degradation has been validated within 1 K uncertainty by onboard calibration and vicarious calibration, and both methods have shown consistent calibration results with each other since Terra’s launch [6]. Based on the calibration, variation in the saturation levels can be expected in each band for 2003 and 2017. Considering that the highest temperature on the lunar surface can exceed 120 °C [21], there should be many saturated pixels in TIR images, especially in Band 10 in 2003 (Figure 7). In Figure 7, the saturation temperature was determined as the brightness temperature converted from the highest unsaturated digital counts of the TIR with the on-orbit calibration coefficients at each observation, thought the temperature could be an approximation value because 120 °C is out of the calibration range for the TIR [6].
On the other hand, it is expected that the TIR sensor could observe the Moon surface with a smaller number of saturated pixels in 2017 even with Band 10. For this expectation, we assumed the temperature profile at the observation in 2017 was similar to that in 2003 at least around the sub-solar point, because the lunar surface has a good repeatability of the surface temperature in terms of the solar elevation [21] due to lack of atmosphere and water and the slow rotation speed of the Moon, and the observations in 2003 and 2017 were conducted with almost the same solar distance and the similar illumination and viewing conditions (Table 2).
Although it is difficult to determine the TIR’s sensitivity degradation quantitatively with only the Moon due to the lack of a published surface brightness model in the TIR range, the degradation can be qualitatively confirmed by monitoring the variations in the saturation levels and the number of saturated pixels in the TIR images from 2003 to 2017.
Figure 8 shows sets of the TIR images of the Moon from 2003 and 2017 whose oversampling effects were corrected. In 2003, saturation occurred in all bands, whereas saturation occurred only in Band 10 in 2017, which has the lowest saturation temperature of the TIR bands. Although there were still saturated pixels in Band 10 in 2017, the number of saturated pixels was significantly reduced (from 3370 pixels in 2003 to 63 pixels in 2017). Saturation occurred only in Band 10 in 2017, which was consistent with the expectation of the TIR sensor’s sensitivity degradation from the onboard and vicarious calibrations (Figure 6), assuming that the maximum temperature on the Moon is 120 °C. Quantitative evaluations will be possible when we conduct another lunar observation with the TIR sensor in the future for which we can compare TIR images that have no saturated pixels.

5. Discussion

Since lunar calibration can measure a temporal variation in a sensor sensitivity accurately (within 1% uncertainty), the validity of other calibration methods can be assessed through the comparison of their results with the result from the lunar calibration. Figure 9 shows a comparison of the relative sensitivity degradations from 2003 to 2017 measured by the lunar calibration with those from other calibration methods in Bands 1, 2, 3N, and 3B of the VNIR sensor. To estimate the relative degradation with onboard calibration, we used degradation values at the lunar observations measured by the onboard calibration system of ASTER, that is, 0.771, 0.844, and 0.895 for Bands 1, 2, and 3N on April 13 2003 and 0.694, 0.749, and 0.794 on August 11 2017, respectively. The onboard calibration for the VNIR bands is performed with onboard halogen lamps whose performances have been monitored with photodiodes [26]. For vicarious calibration, we used the degradation trends obtained from three selected observation sites (Railroad Valley, Alkari Lake, and Ivanpah Playa) as reported in [4,10].
From Figure 9, somewhat large discrepancies in the onboard calibration from other calibration methods can be confirmed. This finding indicates that the uncertainty in the onboard calibration increases with time. On the other hand, the lunar calibration results were more consistent with the results from the vicarious calibration. Although there were still a few percent discrepancies between them, especially in Band 3N, they were consistent with each other within the range of the uncertainties by considering the possible uncertainties of 3–5% in the vicarious calibration results [29]. The benefit from the lunar calibration is that we may determine the magnitude of the degradation within the smaller uncertainty, in other words, the vicarious calibration has a room for improvement in terms of the uncertainty. Obata et al. [10] proposed an approach for correcting vicarious calibrations by considering the surface reflectance spectra at the calibration sites with a band transition technique for inter-band comparisons (called “inter-band calibration”). The measured sensitivity degradations from the inter-band calibration were much more consistent with those from the lunar calibration than those from the vicarious calibration (Figure 8).
It should be noted that the current RCC for the VNIR bands is developed by mixing degradation trends from the onboard calibration and the vicarious calibration [9]. This feature is the reason that the magnitude of the degradation based on the RCC was different from that of others (Figure 9). The discrepancy between the RCC and the lunar calibration results was beyond the error ranges of the lunar calibration, indicating that a further update is also required for the RCC.
Note that it is still unclear what things cause the large uncertainty in the onboard calibration. The possible candidates of the unresolved uncertainty are degradation of optical transparency of the calibration optics, sensitivity degradation of the monitoring photodiodes, and degradation of filters for the photodiodes [3] that have not been monitored, and thus their performances are highly uncertain.

6. Conclusions

ASTER successfully observed the Moon in 2003 and 2017. Based on the two observations of the Moon, the temporal variations in the sensor sensitivities of ASTER’s visible and near-infrared bands (Bands 1, 2, and 3N) were evaluated. The lunar calibration results indicate that sensor sensitivity degradations of several percent occurred in all the VNIR bands. The lunar calibration was basically consistent with the vicarious calibration, but there were still a few percent discrepancies between both results, which indicates further improvement is needed for ASTER calibration. For the TIR bands, the Moon can be used for validating the onboard and the vicarious calibration results by monitoring saturated pixels in images of the Moon. As expected of the onboard and the vicarious calibrations, there were fewer saturated pixels in 2017 than 2003, which supports the validity of the calibration for the TIR bands.
Although the lunar calibration for the VNIR bands can provide only one-point information about the sensitivity degradation from 2003 to 2017, the information can be used as a constraint when we fit a degradation trend measured from other calibration methods. In addition, other instruments onboard Terra, such as Moderate Resolution Imaging Spectroradiometer (MODIS), Multi-angle Imaging Spectroradiometer (MISR), Measurements Of Pollution In the Troposphere (MOPITT), observed the Moon at exactly the same time of ASTER’s observations, indicating an ideal cross-calibration condition among these instruments via the Moon. Further analysis on the combination of all the calibration methods and collaborations with other calibration approaches, such as a calibration with the pseudo invariant calibration method [30] that can also provide high quality results for long-term stability trending, will provide a better RCC in the future and will enhance consistency among sensors.

Author Contributions

Conceptualization, T.K., M.K., and F.S.; methodology, T.K. and S.K.; validation, T.K., S.K. and F.S.; formal analysis, T.K., S.K. and F.S.; investigation, T.K., S.K., F.S. and K.O.; resources, T.T.; data curation, A.M., and T.T.; writing—original draft preparation, T.K.; writing—review and editing, T.K., S.T., F.S. and K.O.; visualization, T.K. and S.K.; supervision, M.K., S.T., and R.N.

Funding

This research was supported partly by JSPA/KAKENHI 16H02225, 19K14789.

Acknowledgments

The authors appreciate Kurtis Thome, Hirokazu Yamamoto, and Koki Iwao for their special support for the lunar calibration activity, and all members in ASTER Science team. The authors also appreciate Thomas Stone for confirmation of ROLO estimation, Xiaoxiong Xiong for commenting the cross calibration, and members in Terra Flight Dynamics Team for the ASTER attitude information. The authors thank Satoru Yamamoto who provided the onboard calibration trend. The authors also thank the three anonymous reviewers for providing valuable comments and suggestions on the draft of the paper.

Conflicts of Interest

The authors declare no conflict of interest. The funders had no role in the design of the study; in the collection, analyses, or interpretation of data; in the writing of the manuscript, or in the decision to publish the results.

Appendix A

In this section, we will show estimations of oversampling factors for the VNIR and the TIR bands based on attitude control information and image processing.
For the VNIR, which is a pushbroom sensor, if the pitch rotation rate is given from the attitude control information of Terra and the rate is constant during the lunar observation, the oversampling factor for the VNIR can be estimated as
f o s ( V N I R ) = θ i F O V ( V N I R ) r p t e ( V N I R )
where θ i F O V ( V N I R ) is the instantaneous field of view of the VNIR (i.e., angular size of one pixel), r p is a pitch rotation rate, and t e ( V N I R ) is a scan interval. From the specification of the VNIR [31], θ i F O V ( V N I R ) = 21.3 μrad, t e ( V N I R ) = 2.199 ms, and from the attitude control information, r p = 0.122 degree s−1 [25]. The estimated oversampling factor for the VNIR bands was 4.55. Note that the pitch rotation rate was common with the TIR bands.
For the TIR, which is a whiskbroom sensor, the oversampling factor can be estimated from the attitude control information as
f o s ( T I R ) = θ i F O V ( T I R ) r p t e ( T I R ) × n d e t e c t o r
where n d e t e c t o r represents number of detectors of each TIR band aligned with an along-track direction. Because the TIR is a whiskbroom-type sensor, the TIR repeats cross-track scans by utilizing oscillation of an observation mirror, and t e means an interval of cross-track scans. The configuration of the oversampling condition for the TIR bands is illustrated in Figure A1.
Figure A1. Schematic views of TIR’s whiskbroom observations in (a) a nominal observation condition and (b) an oversampling condition. Note that each TIR band has 10 detectors and the actual TIR detectors are aligned with a stagger configuration.
Remotesensing 11 02712 g0a1
By substituting the TIR’s specification [31], θ i F O V = 127.8 μm, t e = 131.94 ms, and n d e t e c t o r = 10, then we have f o s ( T I R ) = 4.55, which is same as the factor for VNIR. The effect from the orbital motion of Terra (~7 km s−1) can be ignored in above calculation because the distance between the Moon and Terra at the observation was too large (more than 350,000 km).
On the other hand, since the VNIR has an enough resolution for capturing the Moon with a several hundred pixels, an ellipse fitting technique is applicable to estimate the oversampling factor. Figure A2a shows an example of our fitting results for the VNIR’s lunar images with a robust ellipse fitting technique based on [24]. As illustrated in Figure A2b, by using the horizontal length of the ellipse, l a , which represents an actual radius of the Moon in a VNIR image, and the vertical length, l e , which is longer than l a due to the oversampling condition, we can estimate the oversampling factor simply as
f o s ( V N I R ) = l e l a .
The estimated f o s ( V N I R ) was 4.57 for 2003 images and 4.58 for 2017 images with an uncertainty of 0.03. The uncertainty was evaluated from a standard deviation of residuals between the fitted ellipse and the locations of the extracted limb points of the Moon. The standard deviation was up to 1.1 pixels whereas the size of the lunar disk was more than 400 pixels, thus we concluded that the uncertainty of the estimated oversampling factors from the image processing can be less than 0.5%.
Figure A2. (a) An example of ellipse fitting for elongated lunar images (Band 1 for 2017). The standard deviation of residuals between the fitted ellipse and the locations of the extracted limb points in this example was 0.5 pixel whereas l a and l e as shown in (b) were 413 and 1893 pixels, respectively.
Remotesensing 11 02712 g0a2

Appendix B

In this section, we will show our procedure of generating a corrected lunar image with a resampling technique for a lunar calibration with the SP model. To evaluate a brightness for a resampled pixel at (I, J) position in the corrected image, we calculated a weighted mean brightness as
I c ( I , J ) = j w j I r ( I , j ) j w j
where I c ( I , J ) means the brightness for the resampled pixel, I r ( I , j ) is an observed brightness at (I, j) position in a raw image, and w j represents a weighting factor for j-th line in the raw image. w j is determined from the projected position of a pixel in the corrected image as illustrated in Figure A3.
Because the oversampling factors for the VNIR and TIR bands are not integer, the values of the total weight j w j can be different at different J. We confirmed the values of the total weight were from 4.53 to 4.62 for the Band 1 lunar image in 2003. But since we used a weighted mean value for the resampling, the effect from the difference in the total weight was canceled. For the TIR bands, the correction of the oversampling effect can be done with the same manner.
Figure A3. (a) Schematic view of correcting the oversampling effect for the VNIR bands in this study. (b) An example of calculating a weighted mean brightness for a pixel in a corrected image for the case 4 < f o s < 5. Note that the distributions of w j are different for different lines in the corrected image due to the non-integer f o s .
Remotesensing 11 02712 g0a3

Appendix C

We measured the observed lunar irradiance from the VNIR images by
I r r o b s = 1 f o s Ω p i , j I i , j
where f o s is an oversampling factor, Ω p is a solid angle of each pixel, and I i , j is the radiance of a pixel at (i, j). We integrated pixels not only in the lunar disk but also surrounding deepspace regions within approximately 200-pixel distance from the lunar disk limb. We confirmed the selection of the width for the deepspace did not so affect the measured irradiance (the order of 0.1%, we tested with 100, 200, and 300 pixels).
For computing the simulated irradiance from the ROLO model, we followed the calculation proposed in [17] as
I k = A k Ω M E k π f d
where I k represents modeled irradiance for k-th ROLO band (k = 1–32, corresponding to 350–2383 nm), A k is the disk-equivalent albedo for band k, Ω M is the solid angle of the Moon observed from a standard distance (384,400 km), and E k is the solar irradiance (derived from the model of Wehrli [32]) at 1 AU for the band k. f d is a distance parameter for canceling the distance effect to the irradiance as
f d = ( D S M 1   AU ) 2 ( D V M 384 , 400   km ) 2
Note that A k is a function of geometry parameters [17], such as phase angle, sub-solar longitude, sub-observer latitude and longitude on the Moon that are listed in Table 3.
Above calculation is for ROLO bands (i.e., irradiance will be obtained at discrete wavelengths). To obtain a continuous irradiance spectrum, following to [17], we fitted a mixed spectrum of a returned Apollo soil sample [33] and a lunar breccia sample [34] to A k . Then we performed (A6) and (A7) for the fitted reflectance spectrum. Finally, we obtained the modeled irradiance for a VNIR band as
I r r R O L O = λ I f i t ( λ )   S V N I R ( λ ) d λ λ S V N I R ( λ ) d λ
where I f i t represents the fitted ROLO irradiance, S V N I R is the spectral response function of the target band. Then the amount of sensitivity degradation from 2003 to 2017 (i.e., the relative degradation) can be measured by
r 2003 2017 = ( I r r o b s I r r R O L O ) 2017 / ( I r r o b s I r r R O L O ) 2003 .

References

  1. Yamaguchi, Y.; Kahle, A.B.; Tsu, H.; Kawakami, T.; Pniel, M. Overview of advanced spaceborne thermal emission and reflection radiometer (ASTER). IEEE Trans. Geosci. Remote Sens. 1998, 36, 1062–1071. [Google Scholar] [CrossRef]
  2. Abram, M.; Yamaguchi, Y. Twenty Years of ASTER Contributions to Lithologic Mapping and Mineral Exploration. Remote Sens. 2019, 11, 1394. [Google Scholar] [CrossRef]
  3. Arai, K.; Ohgi, N.; Sakuma, F.; Kikuchi, M.; Tsuchida, S.; Inada, H. Onboard Trend Analysis of Onboard Calibration Data of Terra/ASTER/VNIR and One of the Suspected Causes of Sensitivity Degradation. IJAS 2011, 2, 71–83. [Google Scholar]
  4. Tsuchida, S.; Yamamoto, H.; Kamei, A. Long-term vicarious calibration of ASTER VNIR bands. In Proceedings of the 52nd Conference of the Remote Sensing Society of Japan, Tokyo, Japan, 23 May 2012; pp. 85–86. [Google Scholar]
  5. Thome, K.; Arai, K.; Tsuchida, S.; Biggar, S. Vicarious calibration of ASTER via the reflectance-based approach. IEEE Trans. Geosci. Remote Sens. 2008, 46, 3285–3295. [Google Scholar] [CrossRef]
  6. Tonooka, H.; Palluconi, F.D.; Hook, S.J.; Matsunaga, T. Vicarious Calibration of ASTER Thermal Infrared Bands. IEEE Trans. Geosci. Remote Sens. 2005, 43, 2733–2746. [Google Scholar] [CrossRef]
  7. Yamamoto, H.; Kamei, A.; Nakamura, R.; Tsuchida, S. Long-term cross-calibration of the Terra ASTER and MODIS over the CEOS calibration sites. In Earth Observing Systems XVI; International Society for Optics and Photonics: Bellingham, WA, USA, 2011; Volume 8153, p. 815318. [Google Scholar]
  8. Obata, K.; Tsuchida, S.; Yamamoto, H.; Thome, K. Cross-Calibration between ASTER and MODIS Visible to Near-Infrared Bands for Improvement of ASTER Radiometric Calibration. Sensors 2017, 17, 1793. [Google Scholar] [CrossRef]
  9. Tachikawa, T. ASTER Science Team Meeting. Earth Obs. 2014, 26, 18–21. [Google Scholar]
  10. Obata, K.; Tsuchida, S.; Iwao, K. Inter-Band Radiometric Comparison and Calibration of ASTER Visible and Near-Infrared Bands. Remote Sens. 2015, 7, 15140–15160. [Google Scholar] [CrossRef]
  11. Wagner, S.C.; Hewison, T.; Stone, T.; Lachérade, S.; Fougnie, B.; Xiong, X. A summary of the joint GSICS—CEOS/IVOS lunar calibration workshop: Moving towards intercalibration using the Moon as a transfer target. In Sensors, Systems, and Next-Generation Satellites XIX; International Society for Optics and Photonics: Bellingham, WA, USA, 2015; p. 96390Z. [Google Scholar]
  12. Eplee, R.E.; Barnes, R.A.; Patt, F.S.; Meister, G.; McClain, C.R. SeaWiFS lunar calibration methodology after six years on orbit. In Earth Observing Systems IX; International Society for Optics and Photonics: Bellingham, WA, USA, 2004; pp. 1–13. [Google Scholar]
  13. Eplee, R.E.; Sun, S.-Q.; Meister, G.; Patt, F.S.; Xiong, X.; McClain, C.R. Cross calibration of SeaWiFS and MODIS using on-orbit observations of the Moon. Appl. Opt. 2012, 51, 8702–8730. [Google Scholar] [CrossRef]
  14. Kouyama, T.; Nakamura, R.; Kato, S.; Miyashita, N. One-year Lunar Calibration Result of Hodoyoshi-1, Moon as an Ideal Target for Small Satellite Radiometric Calibration. In Proceedings of the Small Satellite Conference, Logan, UT, USA, 4–9 August 2018. SSC18-III-04. [Google Scholar]
  15. Choi, T.; Shao, X.; Cao, C.; Weng, F. Radiometric Stability Monitoring of the Suomi NPP Visible Infrared Imaging Radiometer Suite (VIIRS) Reflective Solar Bands Using the Moon. Remote Sens. 2016, 8, 15. [Google Scholar] [CrossRef]
  16. Stone, T. Radiometric calibration stability and intercalibration of solar-band instruments in orbit using the Moon. In Earth Observing Systems XIII; International Society for Optics and Photonics: Bellingham, WA, USA, 2008; Volume 7081, p. 70810X. [Google Scholar]
  17. Kieffer, H.H.; Stone, T.C. The spectral irradiance of the Moon. Astron. J. 2005, 129, 2887–2901. [Google Scholar] [CrossRef]
  18. Yamamoto, S.; Matsunaga, T.; Ogawa, Y.; Nakamura, R.; Yokota, Y.; Ohtake, M.; Haruyama, J.; Morota, T.; Honda, C.; Hiroi, T.; et al. Preflight and In-Flight Calibration of the Spectral Profiler on Board SELENE (Kaguya). IEEE Trans. Geosci. Remote Sens. 2011, 49, 4660–4676. [Google Scholar] [CrossRef]
  19. Yokota, Y.; Matsunaga, T.; Ohtake, M.; Haruyama, J.; Nakamura, R.; Yamamoto, S.; Ogawa, Y.; Morota, T.; Honda, C.; Saiki, K.; et al. Lunar photometric properties at wavelengths 0.5–1.6 μm acquired by SELENE Spectral Profiler and their dependency on local albedo and latitudinal zones. Icarus 2011, 215, 639–660. [Google Scholar] [CrossRef]
  20. Kouyama, T.; Yokota, Y.; Ishihara, Y.; Nakamura, R.; Yamamoto, S.; Matsunaga, T. Development of an application scheme for the SELENE/SP lunar reflectance model for radiometric calibration of hyperspectral and multispectral Sensors. Planet. Space Sci. 2016, 214, 76–83. [Google Scholar] [CrossRef]
  21. Williams, J.P.; Piage, D.A.; Greenhagen, B.T.; Sefton-Nash, E. The global surface temperatures of the Moon as measured by the Diviner Lunar Radiometer Experiment. Icarus 2017, 283, 300–325. [Google Scholar] [CrossRef]
  22. ASTER Science Office ASTER SWIR Data Status Report. Available online: http://www.aster.jspacesystems.or.jp/en/about_aster/swir_en.pdf (accessed on 7 October 2019).
  23. Kieffer, H.H. Photometric stability of the lunar surface. Icarus 1997, 130, 323–327. [Google Scholar] [CrossRef]
  24. Ogohara, K.; Kouyama, T.; Yamamoto, H.; Sato, N.; Takagi, M.; Imamura, T. Automated cloud tracking system for the Akatsuki Venus Climate Orbiter data. Icarus 2012, 217, 661–668. [Google Scholar] [CrossRef]
  25. Bruegge, C.J.; Abdou, W.; Diner, D.J.; Gaitley, B.J.; Helmlinger, M.; Kahn, R.A.; Martonchik, J.V. Validating the MISR radiometric scale for the ocean aerosol science communities. In Proceedings of the International Workshop on Radiometric and Geometric Calibration, Gulfport, MS, USA, 2 December 2004. [Google Scholar]
  26. Sakuma, F.; Kikuchi, M.; Inada, H.; Akagi, S.; Ono, H. Onboard Calibration of the ASTER Instrument over Twelve Year. In Proceedings of the International Society for Optics and Photonics, Bellingham, WA, USA, 19 November 2012; Volume 8533, p. 853305. [Google Scholar]
  27. Suzuki, H.; Yamada, M.; Kouyama, T.; Tatsumi, E.; Kameda, S.; Honda, R.; Sawada, H.; Ogawa, N.; Morota, T.; Honda, C.; et al. Initial inflight calibration for Hayabusa2 optical navigation camera (ONC) for science observations of asteroid Ryugu. Icarus 2018, 300, 341–359. [Google Scholar] [CrossRef]
  28. Tatsumi, E.; Kouyama, T.; Suzuki, H.; Yamada, M.; Sakatani, N.; Kameda, S.; Yokota, Y.; Honda, R.; Morota, T.; Moroi, K.; et al. Updated inflight calibration of Hayabusa2’s optical navigation camera (ONC) for scientific observations during the cruise phase. Icarus 2019, 325, 153–195. [Google Scholar] [CrossRef]
  29. Biggar, S.; Slater, P.; Gellman, D. Uncertainties in the in-flight calibration of sensors with reference to measured ground sites in the 0.4–1.1 m range. Remote Sens. Environ. 1994, 48, 245–252. [Google Scholar] [CrossRef]
  30. Helder, D.; Thome, K.J.; Mishra, N.; Chander, G.; Xiong, X.; Angal, A.; Choi, T. Absolute Radiometric Calibration of Landsat Using a Pseudo Invariant Calibration Site. IEEE Trans. Geosci. Remote Sens. 2013, 51, 1360–1369. [Google Scholar] [CrossRef]
  31. ERSDAC. Algorithm Theoretical Basis Document for ASTER Level-1 Data Processing (Ver. 3.0). Available online: https://eospso.nasa.gov/sites/default/files/atbd/atbd-ast-01.pdf (accessed on 18 November 2019).
  32. Wehrli, C. Spectral Solar Irradiance Data, WMO ITD 149; WMO: Geneva, Switzerland, 1986. [Google Scholar]
  33. Pieters, C.M. The Moon as a Spectral Calibration Standard Enabled by Lunar Samples: The Clementine Example. In Proceedings of the New Views of the Moon II: Understanding the Moon through the Integration of Diverse Datasets, Flagstaff, AZ, USA, 22–24 September 1999; pp. 47–48. [Google Scholar]
  34. Pieters, C.M.; Mustard, J.F. Exploration of crustal/mantal material for the Earth and Moon using reflectance spectroscopy. Remote Sens. Environ. 1998, 24, 151–178. [Google Scholar] [CrossRef]
Figure 1. Images of the Moon obtained by ASTER VNIR Band 1 on 14 April 2003 and on 5 August 2017. Because the observation was conducted under oversampling conditions, the Moon’s shape is elongated in the image frame.
Remotesensing 11 02712 g001
Figure 2. Images of the Moon taken by the TIR Band 10 on (a) 14 April 2003 and (b) 5 August 2017, whose oversampling effects were not corrected. Black pixels in the Moon disks indicate saturation due to the high temperature of the Moon that exceeds the observable range of the band.
Remotesensing 11 02712 g002
Figure 3. (a) An example of offset patterns observed in the VNIR images (Band 1, 2003). The brightness level was stretched to enhance the offset. (b) Measured offsets for each pixel obtained from averaging the apparent brightness in deepspace regions (indicated by the rectangular regions shown in (a)). “Even” and “Odd” represent offset values for even pixels and odd pixels, respectively.
Remotesensing 11 02712 g003
Figure 4. (a) Observed images of the Moon by VNIR Band 1 (520–600 nm) on 14 April 2003 and 5 August 2017 whose oversampling effects were corrected, whereas the effects from the sensor sensitivity degradation were not corrected. (b) Simulated images of the Moon for the two observations using the SP model.
Remotesensing 11 02712 g004
Figure 5. Brightness ratios for the observed and simulated brightness of the Moon for Band 1 in (a) 2003 and (b) 2017. The regions surrounded by solid black lines (incident angle < 60°, emission angle < 45°) were used for evaluating the sensitivity degradation.
Remotesensing 11 02712 g005
Figure 6. Comparison of simulated and observed radiance for Band 1 in (a) 2003 and (b) 2017. The simulated radiance was measured from the SP model. The gray scale represents the normalized frequency, and the gray line represents a line with a slope of the mean ratio between simulated and observed brightness in each plot.
Remotesensing 11 02712 g006
Figure 7. Expected saturation brightness temperature for each detector of each TIR band in 2003 (gray dots) and in 2017 (black dots). The higher saturated brightness temperatures in 2017 are due to the TIR sensor’s sensitivity degradation that caused a wider dynamic range in the sensor. Note that the surface temperature of the Moon can exceed 120 °C (dashed line).
Remotesensing 11 02712 g007
Figure 8. Observed images of the Moon in (a) 2003 and (b) 2017. The oversampling effects were corrected by averaging pixels whose field of views overlapped. The black pixels in the lunar disk represent regions where at least one pixel in the original image was saturated when averaging.
Remotesensing 11 02712 g008
Figure 9. Comparison of the sensor sensitivity degradations in the VNIR bands from 2003 to 2017 measured from the onboard calibration (triangles), the vicarious calibration (white rectangles), and the lunar calibration (SP and ROLO models, crosses). The degradations measured from the inter-band calibration and the current RCC (version 4) are also shown (gray rectangles and black circles, respectively).
Remotesensing 11 02712 g009
Table 1. Specifications of visible and near infrared (VNIR) and thermal infrared (TIR) bands of Advanced Spaceborne Thermal Emission and Reflection Radiometer (ASTER).
VNIRTIR
WavelengthsBand 1: 520–600 nm
Band 2 630–690 nm
Band 3N/3B: 760–860 nm
Band 10: 8125–8475 nm
Band 11: 8475–8825 nm
Band 12: 8925–9275 nm
Band 13: 10250–10950 nm
Band 14: 10950–11650 nm
Ground sampling distance15 m90 m
Swath width60 km60 km
Bit depth8 bits12 bits
Spatial resolution for the Moon (from a 384,400 km distance)8.2 km25 km
Table 2. Observation geometries in the ASTER lunar observations on 14 April 2003 and 5 August 2017.
14 April 20035 August 2017
Phase angle−27.7°−20.3°
Sub solar latitude−0.9°−0.3°
Sub solar longitude22.1°17.5°
Sub observer latitude−6.8°−4.2°
Sub observer longitude−5.1°−2.6°
Sub observer local time10.2 h10.7 h
Distance: Sun-Moon1.005 AU1.017 AU
Distance: Moon-Terra359,021 km394,856 km
Table 3. Percentages of the sensor sensitivity degradation of the ASTER/VNIR bands from 2003 to 2017 measured from the lunar calibration based on Spectral Profiler (SP) and RObotic Lunar Observatory (ROLO) models. SP model (nominal) indicates the lunar calibration results using a limited region of the lunar disk according to the recommendation of [19], and SP model (whole Moon) indicates using the whole lunar disk.
Calibration MethodsROLO ModelSP Model
(Nominal)
SP Model (Whole Moon)
Band 13.0%3.1%3.6%
Band 25.4%5.2%5.6%
Band 3N6.3%5.8%6.3%
Band 3B3.0%3.2%3.9%

