Article

High-Spatial-Resolution Population Exposure to PM2.5 Pollution Based on Multi-Satellite Retrievals: A Case Study of Seasonal Variation in the Yangtze River Delta, China in 2013

1
School of Atmospheric Physics, Nanjing University of Information Science and Technology, Nanjing 210044, China
2
School of Geography, Nanjing University of Information Science and Technology, Nanjing 210044, China
3
Department of Geography and Resource Management, Chinese University of Hong Kong, Hong Kong 999077, China
4
Institute of Environment, Energy and Sustainability, Chinese University of Hong Kong, Hong Kong 999077, China
5
School of Resource and Environmental Sciences, Wuhan University, Wuhan 430072, China
6
Department of Urban Planning and Design, University of Hong Kong, Hong Kong 999077, China
7
Chinese Antarctic Center of Surveying and Mapping, Wuhan University, Wuhan 430072, China
8
State Key Laboratory of Loess and Quaternary Geology, Institute of Earth Environment, Chinese Academy of Sciences, Xi’an 710061, China
*
Author to whom correspondence should be addressed.
These authors contributed equally to this work.
Remote Sens. 2019, 11(23), 2724; https://doi.org/10.3390/rs11232724
Submission received: 18 October 2019 / Revised: 17 November 2019 / Accepted: 18 November 2019 / Published: 20 November 2019
(This article belongs to the Special Issue Remote Sensing for Urban Human Health)

Abstract

:
To assess the health risk of PM2.5, it is necessary to accurately estimate the actual exposure level of the population to PM2.5. However, the spatial distribution of PM2.5 may be inconsistent with that of the population, making it necessary for a high-spatial-resolution and refined assessment of the population exposure to air pollution. This study takes the Yangtze River Delta (YRD) Region as an example since it has a high-density population and a high pollution level. The brightness reflectance of night-time light, and MODIS-based (Moderate Resolution Imaging Spectroradiometer) vegetation index, elevation, and slope information are used as independent variables to construct a random-forest (RF) model for the estimation of the population spatial distribution, before any combination with the PM2.5 data retrieved from MODIS. This enables assessment of the population exposure to PM2.5 (i.e., intensity of population exposure to PM2.5 and population-weighted PM2.5 concentration) at a 3-km resolution, using the year 2013 as an example. Results show that the variance explained for the RF-model-estimated population density reaches over 80%, while the estimated errors in half of counties are < 20%, indicating the high accuracy of the estimated population. The spatial distribution of population exposure to PM2.5 exhibits an obvious urban–suburban–rural difference consistent with the population distribution but inconsistent with the PM2.5 concentration. High and low PM2.5 concentrations are mainly distributed in the northern and southern YRD Region, respectively, with the mean proportions of the population exposed to PM2.5 concentrations > 35μg/m3 close to 100% in all four seasons. A high-level population exposure to PM2.5 is mainly found in Shanghai, most of the Jiangsu Province, the central Anhui Province, and some coastal cities of the Zhejiang Province. The highest risk of population exposure to PM2.5 occurs in winter, followed by spring and autumn, and the lowest in summer, consistent with the PM2.5 seasonal variation. Seasonal-averaged population-weighted PM2.5 concentrations are different from PM2.5 concentrations in the region, which are closely related to the urban-exposed population density and pollution levels. This work provides a novel assessment of the proposed population-density exposure to PM2.5 by using multi-satellite retrievals to determine the high-spatial-resolution risk of air pollution and detailed regional differences in the population exposure to PM2.5.

Graphical Abstract

1. Introduction

Particulate matter of aerodynamic diameter ≤ 2.5 μm (PM2.5) is extremely harmful to public health due to the small particle size, and its physical properties and complex chemical composition [1,2,3,4]. Population exposure to PM2.5 can result in an increased risk of various diseases, such as those affecting the respiratory, cardiovascular, and reproductive systems, leading to premature deaths or reduced cognitive performance [4,5,6,7,8]. For instance, the Global Burden of Disease study reported that ambient PM2.5 caused around 4.1 million premature deaths globally in 2016 [9]. The annual average ambient PM2.5 concentration in China is substantially higher than that in the U.S. or Europe [10,11,12], and long-term exposure to air pollution can cause high levels of attributable deaths, including 11.1% [95% confidence interval: 9.7–12.7] of all deaths in China [13]. In particular, in China’s densely-populated regions, the PM2.5 levels may even exceed 100 μg/m3 during severe haze events [14]. For instance, in January and December 2013, extensive and frequent haze events occurred in eastern China, where the daily-averaged PM2.5 exceeded 150 μg/m3 and reached > 500 μg/m3, resulting in significant economic losses and serious impacts on public health [15,16]. Therefore, the assessment of the spatial characteristics of the actual population exposure to PM2.5 is of great significance. The health risk of PM2.5 is closely related to the PM2.5 concentration, but the level of public exposure to PM2.5 is the determinant of the public health risk [17]. However, the correspondence between the relatively sparse spatial distribution of PM2.5 and the denser spatial distribution of the population is usually inconsistent. This leads to errors in the direct use of site-based PM2.5 concentrations for the representation of the actual large-scale population-exposure levels, making it necessary to develop a high-spatial-resolution PM2.5 database together with population data to obtain consistent population-exposure levels to pollution [18].
Recently, researchers in various countries have investigated standards applicable for either a local or global evaluation of the public-exposure risks of PM2.5 [19,20]. In terms of obtaining the spatial distribution of PM2.5 concentration, high-spatial-resolution values of the aerosol optical depth (AOD) from the Moderate Resolution Imaging Spectroradiometer (MODIS) have been widely used to retrieve relatively reliable PM2.5 values at a large scale when combined with site-based PM2.5 observations, meteorological variables, and traditional statistical or machine-learning methods [21,22,23,24,25,26,27,28]. Therefore, satellite-retrieved PM2.5 alone with census-population data were traditionally used to estimate the average PM2.5 pollution exposure level for the quantification of the spatial distribution of the intensity of population exposure to past air pollution [29,30,31]. In addition, an air-pollution-exposure risk-assessment method based on the population-weighted PM2.5 concentration can also reflect the real exposure of the population to the level of air pollution [32]. In contrast to the acquisition of high-spatial-resolution PM2.5, methods for obtaining a high-spatial-resolution population distribution are not yet mature. Previously, administrative census-population data have been uniformly allocated to each spatial grid [33], which is inconsistent with the actual spatial distribution of the population [34].
In recent years, high-precision night-time-light (NTL) data from satellites [DMSP/OLS (Defense Meteorological Satellite Program/Operational Line scan System) and NPP-VIIRS (National Polar-orbiting Partnership, NPP; Visible Infrared imaging Radiometer Suite, VIIRS)] have been used to estimate the spatial distribution of the population [35,36,37,38,39], because the information from such satellite imagery is closely related to human activities. Random-forest (RF) model is a non-parametric method that can model complex nonlinear relationships between predictions and heterogeneous predictor variables. One of the strengths of the Random Forest algorithm is the ability to incorporate many covariates with a minimum of tuning and supervision. The RF-based methodology was successfully used in many studies for population mapping with NTL data [38,40,41,42]. For instance, by using a RF model, Ye et al. [38] introduced point-of-interest information, Day/Night Band (DNB) radiance of NTL DMSP/OLS, road networks, the Normalized Difference Vegetation Index (NDVI), digital elevation model (DEM) data, street-level census-population data and other independent variables to establish a suitable population-estimation framework for China, enabling the realization of a high-precision and high-resolution population map for 2010. In summary, the combination of high-spatial-resolution population and PM2.5 data from multi-satellite retrievals has made possible the refinement of the spatial-distribution differences in the risk of population exposure to PM2.5 in China.
The Yangtze River Delta (YRD) region in eastern China (Figure 1) is a high-population-density region consisting of Shanghai, Jiangsu, Zhejiang and Anhui, is one of the three largest economic and high-emission zones in China, and frequently suffers from serious pollution in unfavorable meteorological conditions, e.g., calm/weak wind, low planetary boundary layer, strong temperature inversion, high relative humidity, northerly wind related to transport, and weakened monsoon circulations [43,44,45,46]. Since the urban areas of the YRD region are densely distributed, NTL satellite data are more reliable for the estimation of the spatial distribution of population [47]. Previous studies on PM2.5 exposure in the YRD region have mainly used the total-census-population data sourced from administrative divisions or the total population of public health data around sampling sites with PM2.5 observations [2,48,49,50,51], leaving large spatial gaps in the seasonal differences in population-exposure risks to PM2.5 pollution.
To address these gaps, while providing a basis for the reduction, in control of and adaptation to PM2.5 pollution [51,52], we deploy a combination of machine-learning and geographic-information-system (GIS) technology to build an RF model of population estimation, taking the year 2013 as an example, based on NTL, DEM, county-level population-census data, and the MODIS-based vegetation index to derive the spatial distribution of population. Then, combined with seasonal-scale PM2.5 from MODIS retrievals [23], we investigate the spatial difference and seasonal variation in population-exposure risk to PM2.5 pollution at a 3-km resolution in the YRD region. Below, Section 2 and Section 3 introduce the employed data and methodology, respectively, the results are presented and discussed in Section 4, and the conclusions are given in Section 5.

2. Data

The data and their sources are summarized in Table 1. Census population in 2013 from all 318 counties or districts across the YRD Region were collected from governmental annual reports of each province. Then, population density was obtained based on dividing total population by the area of each county or district. Note that Li et al. [23] developed a national-scale generalized-regression neural-network (GRNN) model to estimate PM2.5 concentration distributions retrieved from 3-km MODIS-AOD products, with the estimated PM2.5 concentrations agreeing quite well with the station measurements. Here, seasonal-scale PM2.5 at a 3-km resolution, as estimated by the GRNN model is determined for the YRD region.
According to MODIS-retrieved PM2.5, the average PM2.5 mass concentration in the YRD region in 2013 exceeded the Interim Target-1 (IT-1, 35 μg/m3) for developing countries proposed by the World Health Organization. The ambient air-quality index (AQI) according to technical regulations in China are accordingly divided into six health-impact categories: 1) daily-averaged PM2.5 concentration (DAMC) ≤ 35 µg/m3, excellent; 2) 35 µg/m3 < DAMC ≤ 75 µg/m3, good; 3) 75 µg/m3 < DAMC ≤ 115 µg/m3, slight pollution, uncomfortable for sensitive groups; 4) 115µg/m3 < DAMC ≤ 150µg/m3, moderate pollution, uncomfortable for some healthy groups; 5) 150 µg/m3 < DAMC ≤ 250 µg/m3, severe pollution, uncomfortable for most healthy groups; 6) DAMC > 250µg/m3, very severe pollution, hazardous for healthy groups. In addition, for consistency with the PM2.5 resolution, all data are resampled and interpolated to the 3-km resolution with ArcGIS software.

3. Method

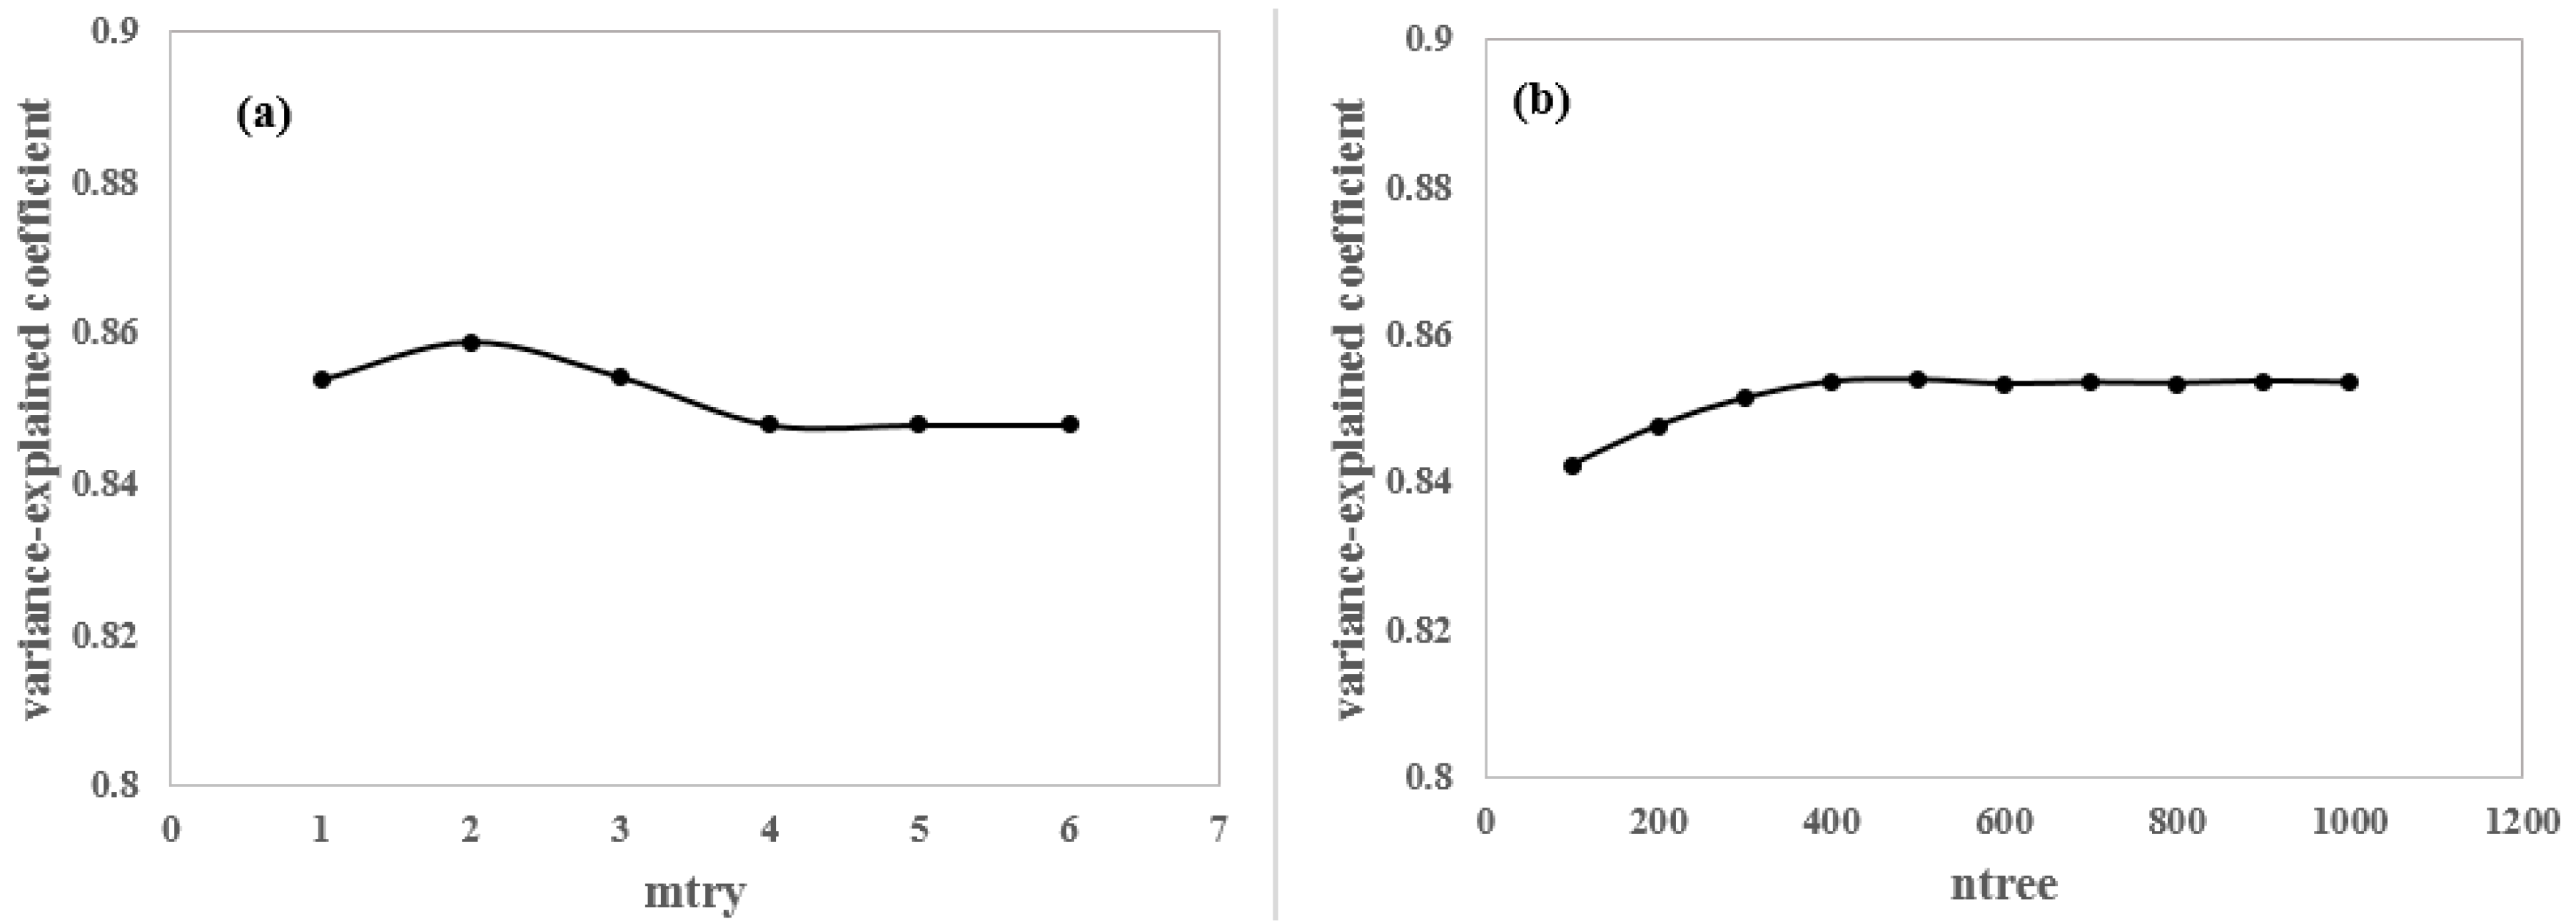
3.1. Dasymetric Population Estimation

The RF model, which is a popular and highly-flexible machine-learning algorithm, is capable of analyzing the characteristics of complex interactions, while being sufficiently robust for the handling of data with noise or missing values [53]. The RF model has been widely used as a feature-selection tool for high-dimensional data to identify variable importance, and has certain advantages in analyzing variable relationships compared with other methods, such as contrast neural networks and support-vector machines [54,55]. Following Ye et al. [38], this study applies a three-stage model with the use of RF to conduct a dasymetric population mapping across the study area.
For the first stage, we estimate the prediction density of population with the RF data. The input variables for RF model of prediction density are DNB radiance of NTL, DEM, NDVI and slope (Table 1) as they are all related to population pattern and urban characteristics [38]. Population density in county-level is used as dependent variable of density and natural logarithm is applied to this dependent variable to consider curve-linearity. In order to apply a RF model with the best performance, this study also tunes the two parameters of the RF model: the number of trees to grow Ntree and the number of variables randomly sampled as candidates at each split Mtry. In details, the default value of Mtry is the square root of p in classification and p/3 in regression, where p is the number of all characteristic variables [38,53].
Figure 2 shows the relationships of the parameters Ntree and Mtry with the coefficient of determination R2, which is a measure of how well out-of-bag prediction errors explain the target variance of the training set. Based on the results, since the change of R2 is very small (~0.01), it implies the model performance is very stable and default model can be used for modelling without tuning. However, as the values of R2 are maximized and become stable for Mtry = 2 and Ntree = 500, respectively, these values have been selected for the final RF model. In addition, we validate the RF model using the 10-fold cross-validation (CV) method [42], in order to repeatedly estimate the expected model performance based on each subset of training data in general during prediction. Specifically, the coefficient of determination (R2), the root-mean-square error (RMSE), and the relative error (RE) are used to assess the predictive performance of this 10-fold cross validation.
R 2 = ( i = 1 n ( y i y ¯ i ) ( x i x ¯ i ) ) 2 i = 1 n ( y i y ¯ i ) 2 i = 1 n ( x i x ¯ i ) 2
R M S E = 1 n i = 1 n ( y i x i ) 2
R E = y i x i x i × 100 %
where n denotes the County number, x i represents the census population for County i, y i represents the estimated population for the County i, x ¯ i and y ¯ i represent the average of x i and y i for the County n, respectively.
Furthermore, a variance importance analysis is conducted to determine the contribution of each variable. Specifically, mean Decrease Accuracy (%IncMSE) and Mean Decrease Gini (IncNodePurity) (sorted decreasingly from top to bottom) of attributes are used. The %IncMSE is the most robust and informative measure that determines the increase in the mean-square error of predictions (estimated with the out-of-bag CV) as a result of a variable being permuted (values randomly shuffled), when this variable is removed from the RF model. IncNodePurity relates to the loss function to which the best splits are chosen. A higher value of %IncMSE or IncNodePurity indicates a more important input variable. Based on the variable importance analysis, it reveals that the NTL data with the maximum %IncMSE and IncNodePurity values contribute the most to the RF model of population estimation (Table 2), followed by NDVI, which is consistent with the results of Ye et al. [38].
For the second stage, DEM, NTL and NDVI at 1-km resolution presented in Figure 1 are applied to the RF model in the first stage for the creation of prediction density surface. This approach can estimate the spatial variations of population density [38] that cannot be simply generated by interpolation of census data. In addition, the prediction density surface can include fine-spatial-scale urban elements related to population variability.
For the final stage, we redistribute the dasymetric population as follow:
P o p d a s y m e t r i c = P o p u l a t i o n c o u n t y × D e n s i t y g r i d D e n s i t y s u m
where Popdasymetric is the dasymetric population (1km) within each county, Populationcounty is the total population of each county, Densitygrid is the value of prediction density surface (1 km) of each county, and Densitysum is the sum of all values of prediction density surface of each county. This result can provide population across the study area in a finer spatial scale which is more related to the reality.

3.2. Intensity of Population Exposure to PM2.5

According to the assessment of population-exposure level to air pollution proposed by Kousa et al. [56], the population density and specific pollutant concentration are employed to evaluate the population-exposure level to PM2.5 at the grid level in the YRD region during the four seasons of 2013. The intensity of population exposure to PM2.5 (μg people/m3 km2) is defined as
E i = P i C i
where Ei is the population-exposure intensity of grid point i, Ci is the concentration of PM2.5 at grid point i, and Pi is the population density within the grid point i based on the final RF-model output.

3.3. Population-Weighted PM2.5 Pollution

The population-weighted PM2.5 pollution, which mainly considers population as weights at different exposure to PM2.5 concentrations [32], is used to reflect the actual total impact of PM2.5 on the population under normalized population conditions for different regions. The population-weighted PM2.5 pollution is defined as
E P = i = 1 n ( P i × C i ) P
where EP is the population-weighted PM2.5 concentration of the YRD Region/Province/city, Ci is the PM2.5 concentration in the grid point i, Pi is the population in the grid point i, n is the total number of grids in the YRD Region/Province/city, and P is the total population in the entire YRD Region/Province/city.

4. Results and Discussion

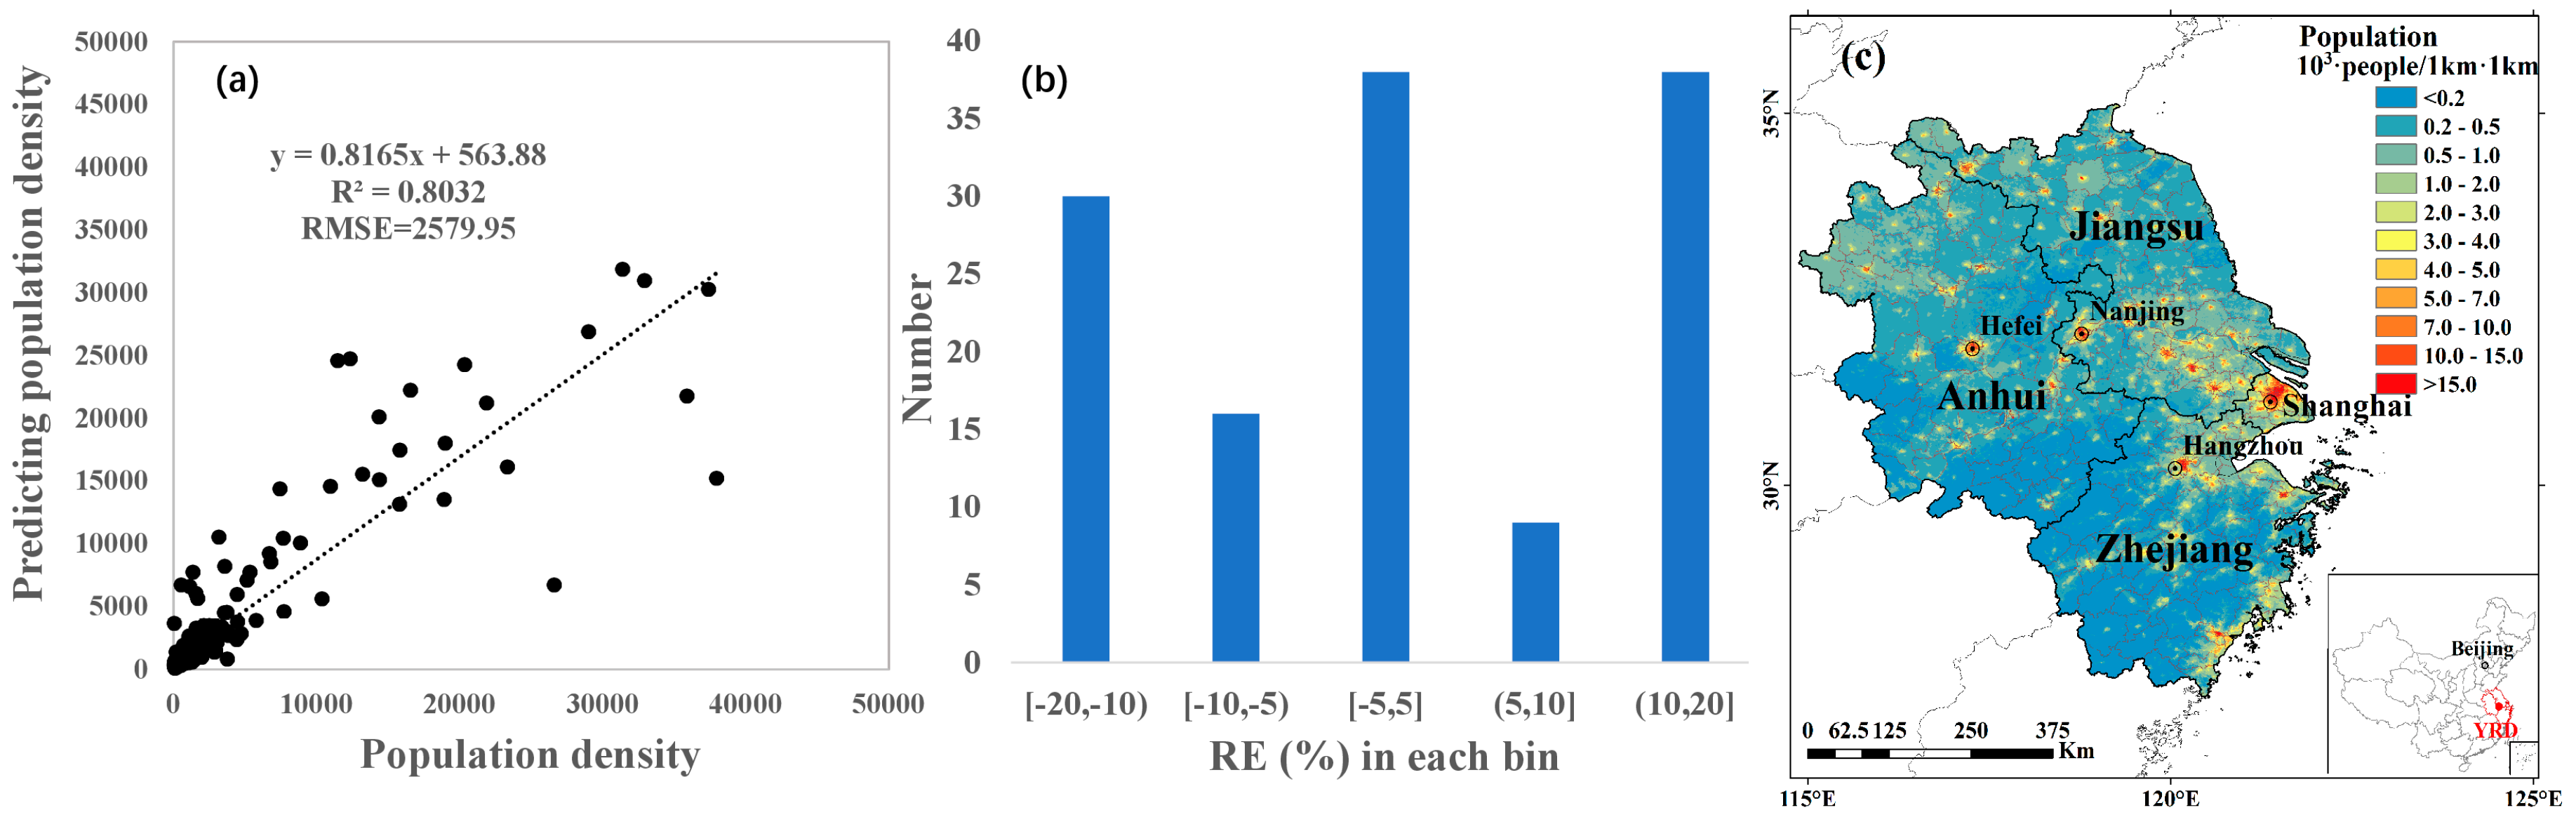
4.1. Spatial Population Intensity

Figure 3a presents the observed and estimated population density from the results of the 10-fold CV of the RF model at the County level in 2013. The population intensities estimated from the RF model are in good agreement with the actual averaged-population intensity (logarithmic scale); and the R2 and RMSE values of the CV results are 0.83 and 0.5people/km2, respectively. Furthermore, half of the total Counties exhibit predictions with RE < 20% (Figure 3b). Compared with the spatial NTL and NDVI in Figure 1, larger RE (> 20%) are noticeable for farms, sparsely-populated villages, and towns of high-vegetation coverage (figure not shown). Therefore, a reasonable population spatial distribution is obtained by using the RF method and multi-source data. In addition, note that the spectral coverage of NTL DNB is wide, DNB is shown to be sensitive to the change of aerosol loadings [57]. Therefore, DNB radiance will be weakened by high-concertation PM2.5 through the scattering/absorption of light, resulting in underestimate population in heavy pollution conditions.
Figure 3c shows the spatial distribution of the population at a 1-km resolution in the YRD Region in 2013, showing an in homogenous spatial distribution with obvious urban–suburban–rural differences in population density. The high-density population is mainly found in cities and towns, with population densities of the centers of all four major cities >15,000 people/km2, and a decreasing density with increasing distance from the urban center. A large number of mountainous and high-vegetation-coverage areas have a population density < 200 people/km2. In contrast, the maximum population densities at the grids of Shanghai, Nanjing, Hangzhou and Hefei exceed 190,000, 90,000, 50,000 and 20,000 people/km2, respectively (Figure 3c), implying that frequent pollution incidents can affect as many as tens of thousands or even hundreds of thousands of people/km2 in the central area of these provincial capitals.

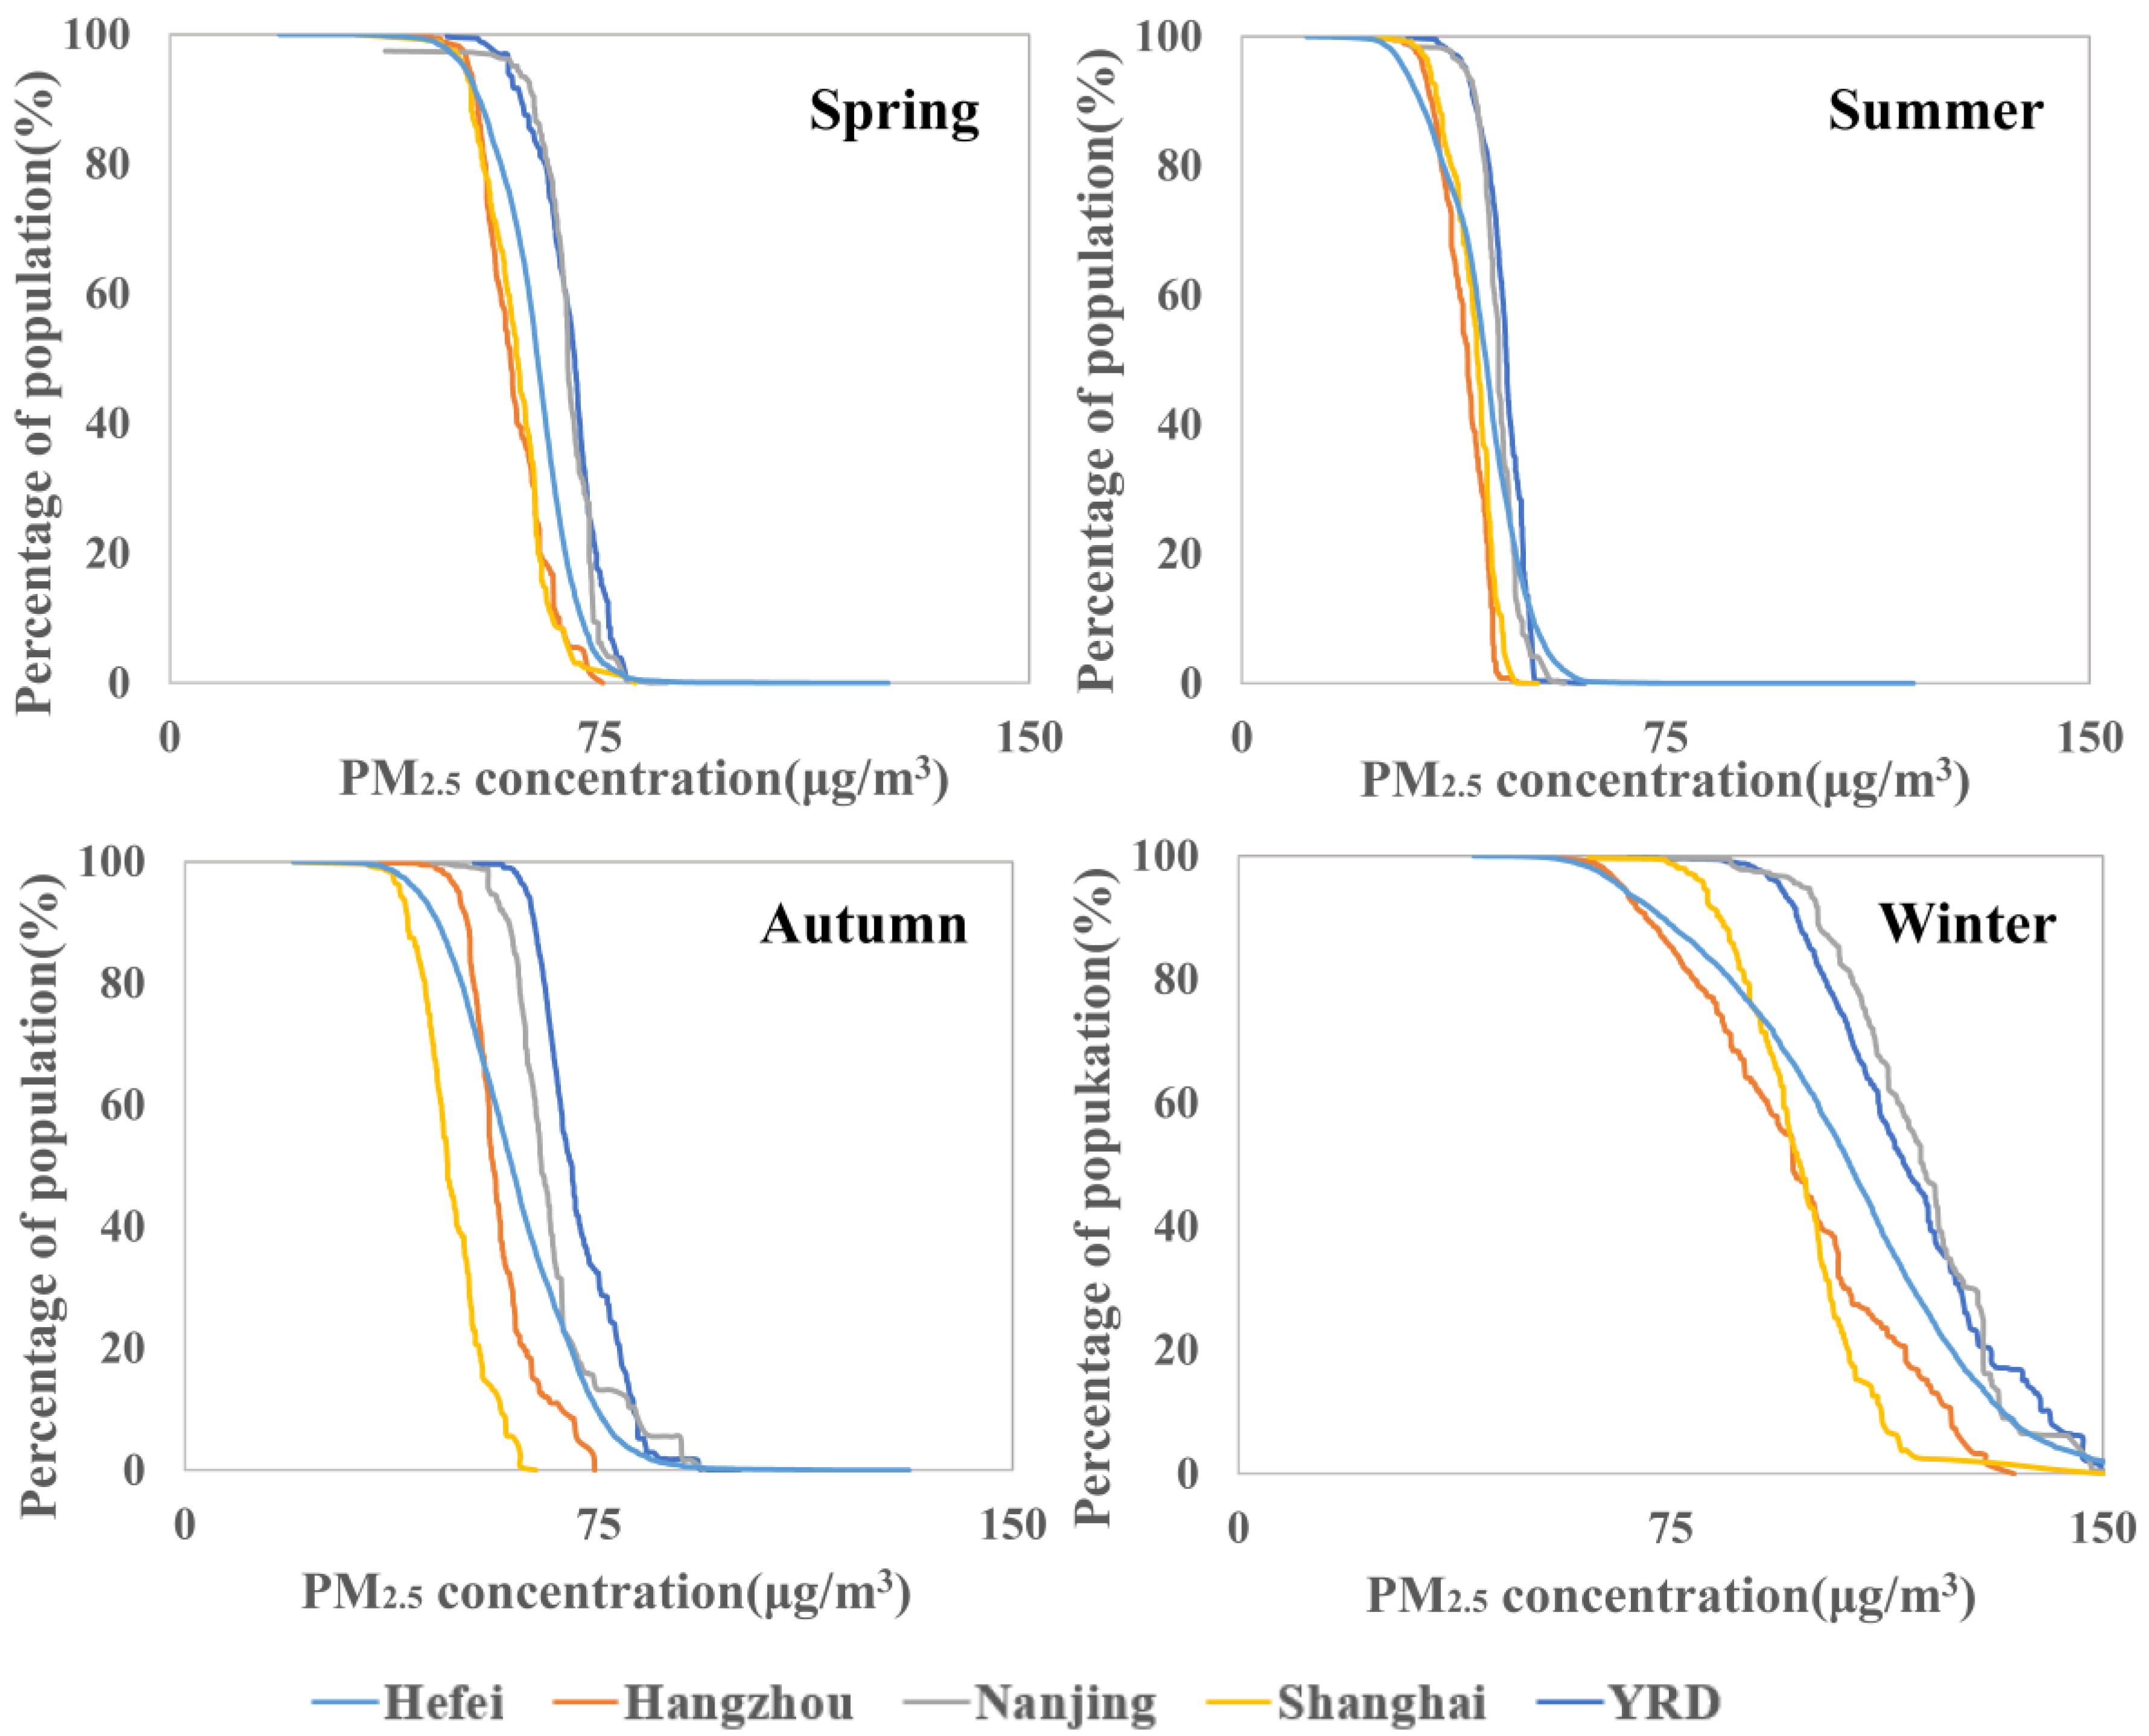
4.2. Spatial and Seasonal Variations in PM2.5 Concentration

Figure 4 shows the spatial and seasonal variations in PM2.5 concentration from MODIS retrievals. In the spring, autumn, and winter, PM2.5 in the central and northern parts of the YRD Region (including the Jiangsu Province, Shanghai and the most of the Anhui Province) exceeded 35 μg/m3 (the IT-1 threshold), while for the southern part of the YRD Region, including most of the Zhejiang Province and the southeastern part of it, the pollution levels reached or approached the IT-1 threshold. For the Provinces and Municipalities in the YRD Region, the provincial capitals are usually the economic centers, and suffer from more serious pollution. For example, in Nanjing, the average and lowest PM2.5 concentrations of the four seasons of 2013 were 112.1 μg/m3 and 44.3 μg/m3, respectively, and in Hefei, the corresponding values are 109.4 μg/m3 and 45.1 μg/m3. Compared with Figure 3c, areas of high PM2.5 concentration usually coincide with areas of high-density population, indicating that high concentrations of PM2.5 are mostly related to human activities in the YRD Region (Figure 3c and Figure 4), which is consistent with the Pearl River Delta region investigated by Lin et al. [58].
In all seasons, the PM2.5 concentrations in the north part of the region are clearly higher than those in the southern one, with the negative trend from north to south particularly evident in spring, autumn and winter. The heavy industrial cities in the northern part of the YRD Region, which may be contributing to the spatial variation, emit large volumes of pollutants and are covered by less vegetation, so that when meteorological conditions are not conducive to the timely diffusion of pollutants, their accumulation causes significant spatial differences [59,60]. Overall, for the seasonal characteristics, the PM2.5 concentration in winter is significantly higher than that in the other seasons, because of the increase of coal combustion caused by heating activities in winter and the resultant large emission of PM2.5 together with the unfavorable meteorological conditions [15,16,43,61]—the seasonal-averaged PM2.5 concentration in the YRD Region can reach 98.0 μg/m3. In summer, due to the strong convection with large amounts of precipitation [62,63], pollutants are diffused or deposited, so that the PM2.5 concentration shows no significant spatial difference, resulting in the lowest PM2.5 pollution level in summer with an average of 40.4 μg/m3. The pollution levels in spring and autumn are between those of winter and summer. In spring, because of the north-west flow and topographic influence, high PM2.5 values are mainly distributed in the northern urban areas. In autumn, the average concentration is slightly lower than that in spring, with the high PM2.5 values mainly distributed in the north-west of the northern urban areas [62].

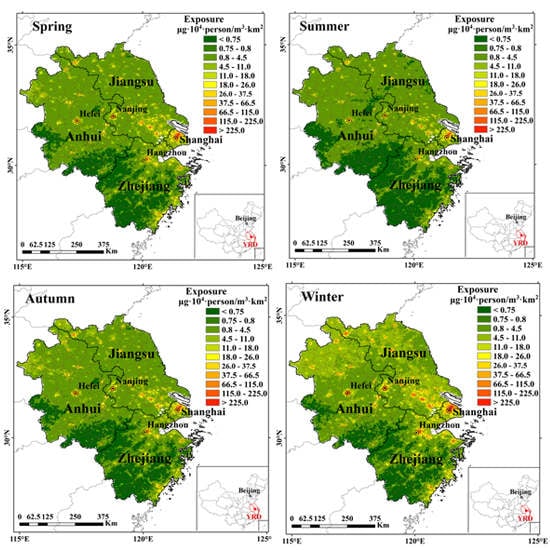
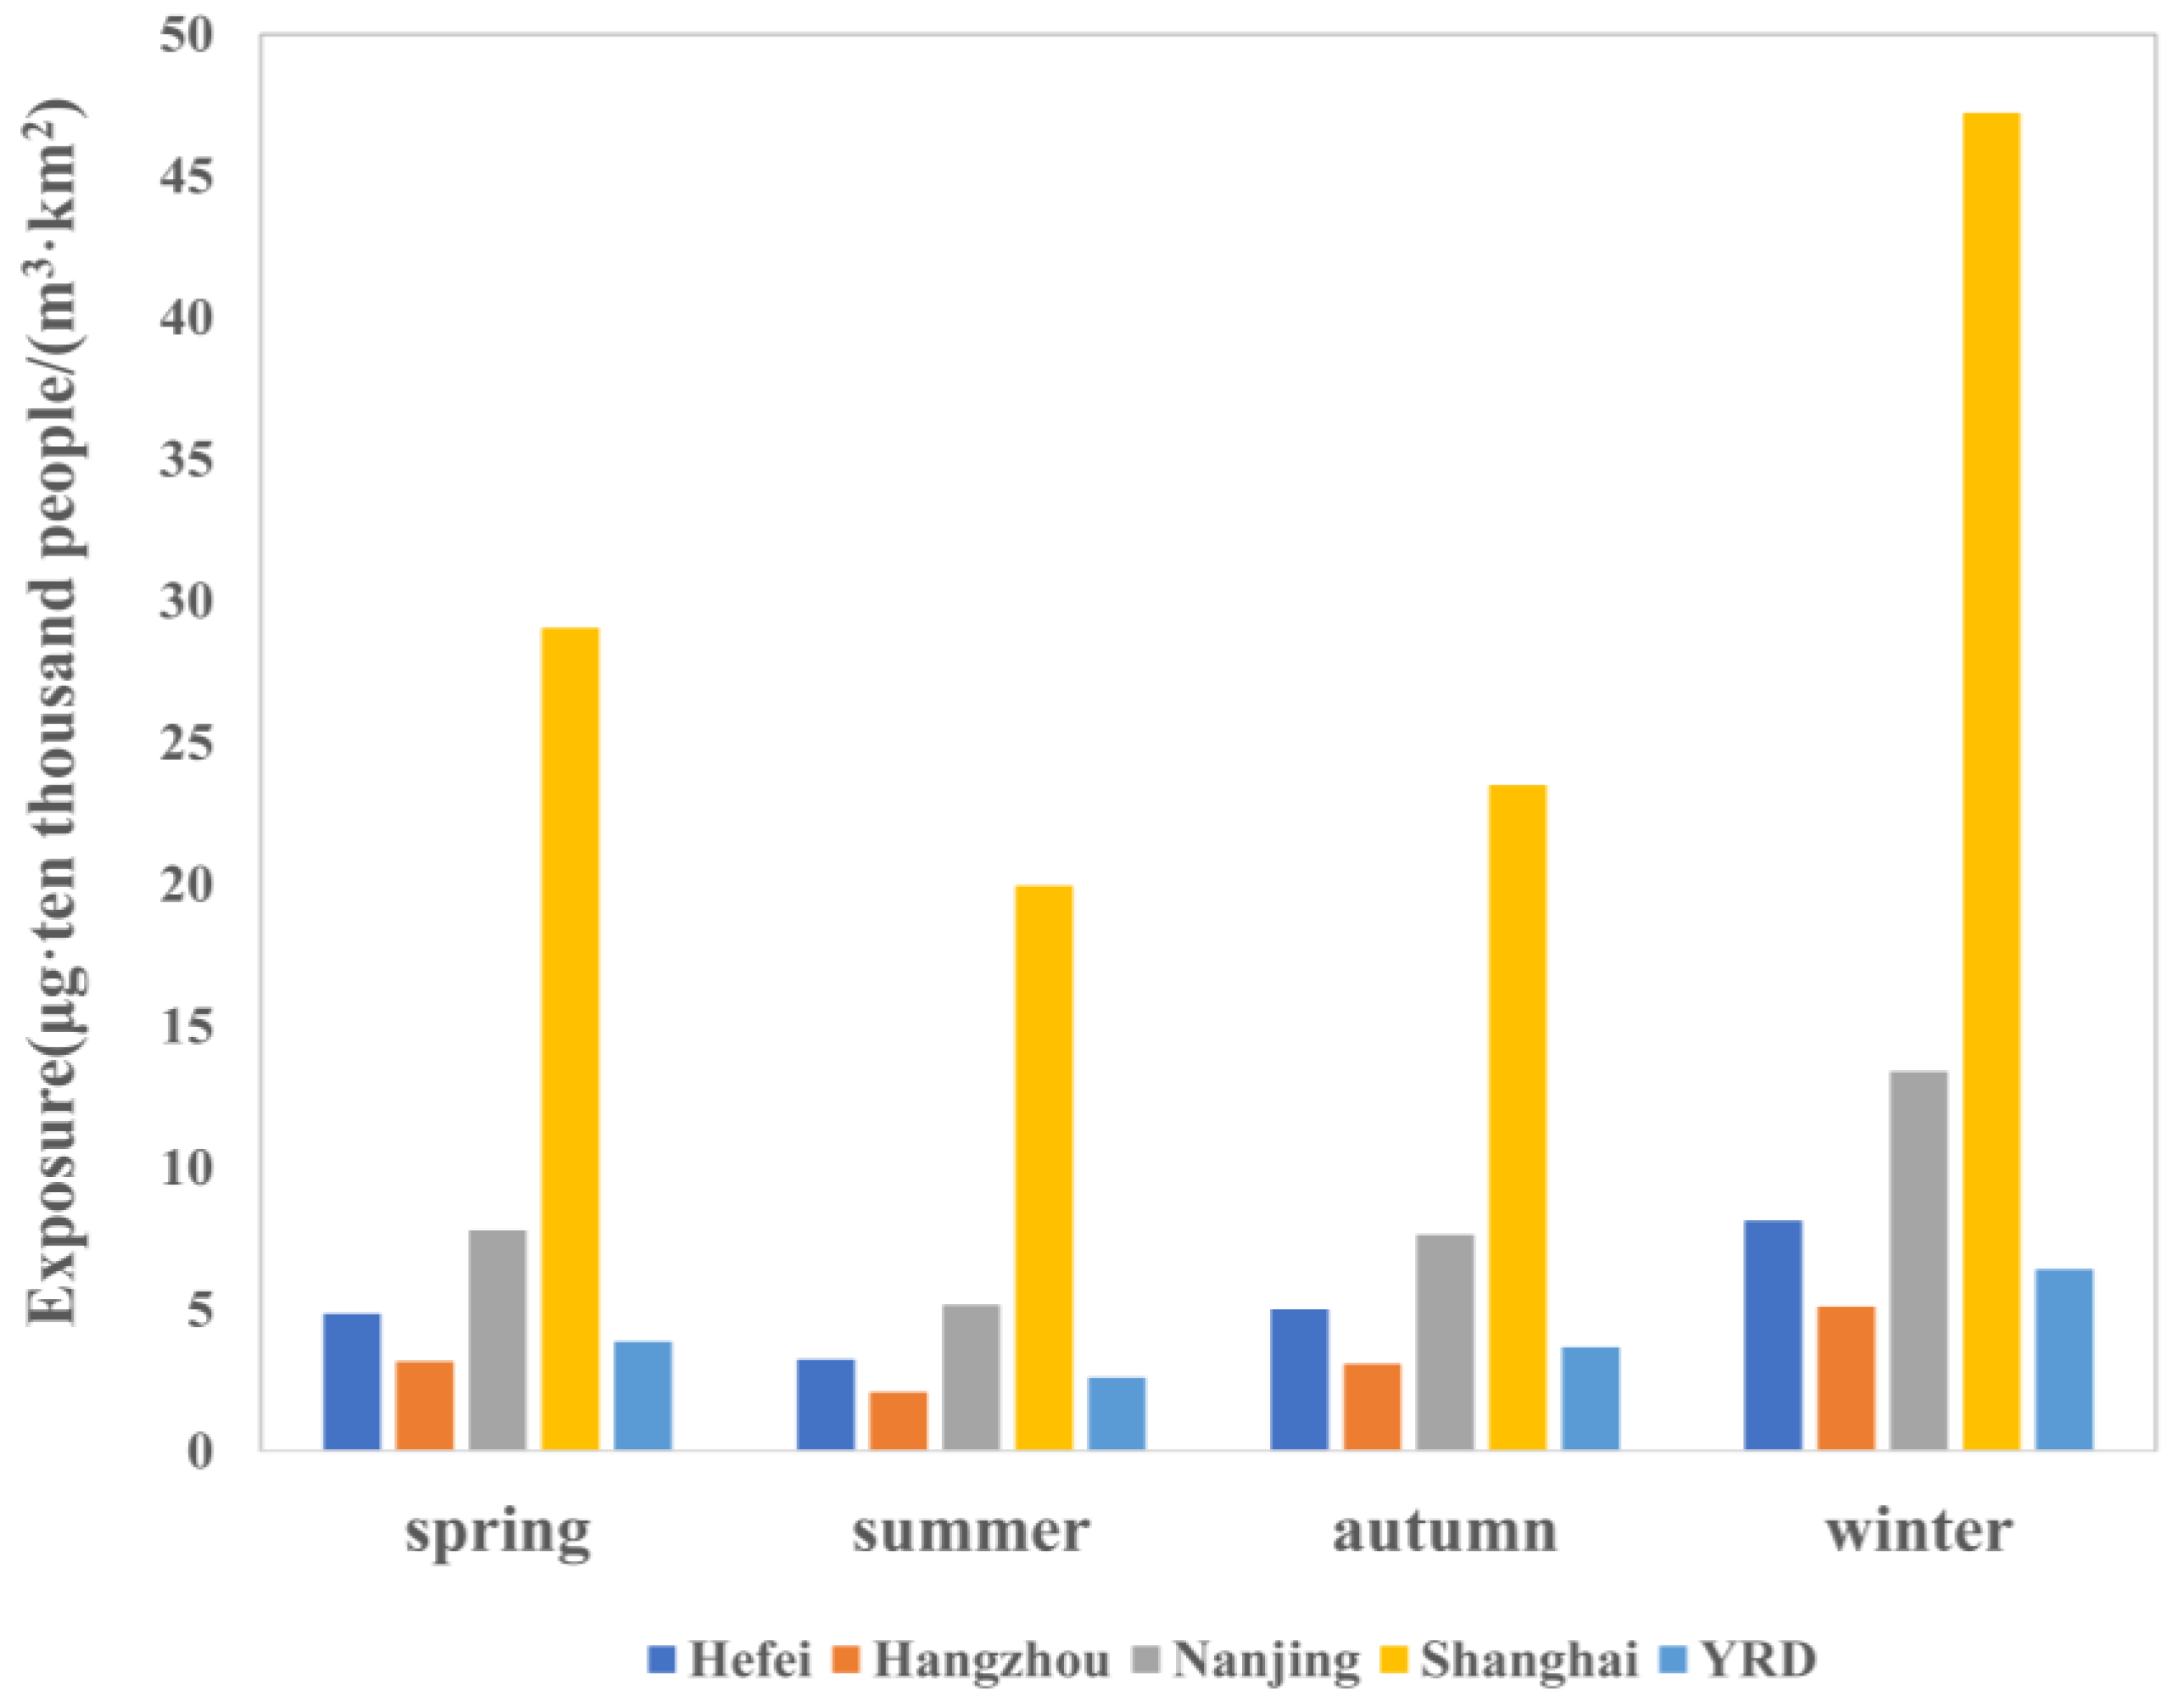
4.3. Spatial and Seasonal Variations in PM2.5 Exposure Intensity

Figure 5 shows that the population-exposure intensity of PM2.5 for the four seasons in the YRD Region in 2013 is well correlated with the spatial distribution of population. The population-exposure intensities of PM2.5 are high in Shanghai, in most of the Jiangsu province, in the middle and southern half of Anhui province, and in the individual coastal cities in the Zhejiang Province, but low in the southeastern inland areas of the YRD Region. The areas with high population-exposure intensities are basically the densely-populated areas. The population in the city-center areas of Shanghai, Suzhou, Wuxi, Nanjing, Hangzhou and Hefei are at higher risk of exposure to PM2.5. Among the four main cities, the intensity and area of population exposure to PM2.5 in Shanghai is the largest, and the gridded maximum value is also the highest in Shanghai, followed by Nanjing, Hefei, and Hangzhou, indicating that the intensities of population exposure in these major cities are larger than the mean intensity in the whole YRD Region (Figure 6).
The population-exposure intensity of PM2.5 is the highest in winter, followed by spring and autumn, and the lowest in summer, which is consistent with the seasonal variation of PM2.5. The grids with higher intensities of population exposure to PM2.5 pollutions are mainly located in the city centers. Although the pollution is more serious in other parts of the central and northern regions of the YRD Region, the population density in these areas is lower, meaning the population-exposure intensities are smaller than those in some coastal areas (Figure 3a and Figure 5). The PM2.5 population-exposure intensity decreases significantly in summer, with an average of 2.59 μg·104 people/(m3·km2). In spring and autumn, the high population-exposure-intensity areas expand, with an average of more than 3.60 μg·104 people/(m3·km2). In winter, the PM2.5 population-exposure intensity is the highest at an average of 6.34 μg·104 people/(m3·km2).
Figure 7 shows the proportional distribution of population exposure to certain PM2.5 concentrations for major cities and the YRD Region. The curves show that, except in summer, 100% of people are exposed to PM2.5 concentrations >35 μg/m3, which indicates that there is a high health risk of PM2.5 exposure in the YRD Region. In 2013, the proportion of population exposed to PM2.5 > 75 μg/m3 in Nanjing was 6.3%, 13.3% and 99.8% in spring, autumn and winter, respectively, 17.6%, 0% and 98.84% in Shanghai, 4.3%, 0% and 85.2% in Hangzhou, and 17.2%, 32.19% and 99.69% in Hefei, respectively, which means the pollution and its exposure in Hefei is more serious.
In general, due to the difference in spatial distribution between PM2.5 concentration and population density, the actual health impacts of PM2.5 pollution on the overall population exhibit predominant differences in terms of the spatial distribution of the YRD Region. A greater proportion of the population are exposed to long-term high PM2.5 concentrations, with averages exceeding 115 μg/m3 in urban centers for these four cities, leading to significant economic losses, serious impacts on public health, and higher levels of mortality, particularly in winter [13,15,16]. Note that we assumed population density over the YRD region is a constant throughout the year of 2013 in the present work, due to a lack of dynamical variation of census data for validation. This may induce some bias in calculating the seasonal variation of population-exposure intensity to PM2.5 across the study area. In brief, we suggest that the development of dynamic assessment of PM2.5 exposure and health risk at different time-resolution using multi-satellite retrievals and geo-spatial big data may solve this problem, and this suggestion is recommended based on the finding of a recent study [64].

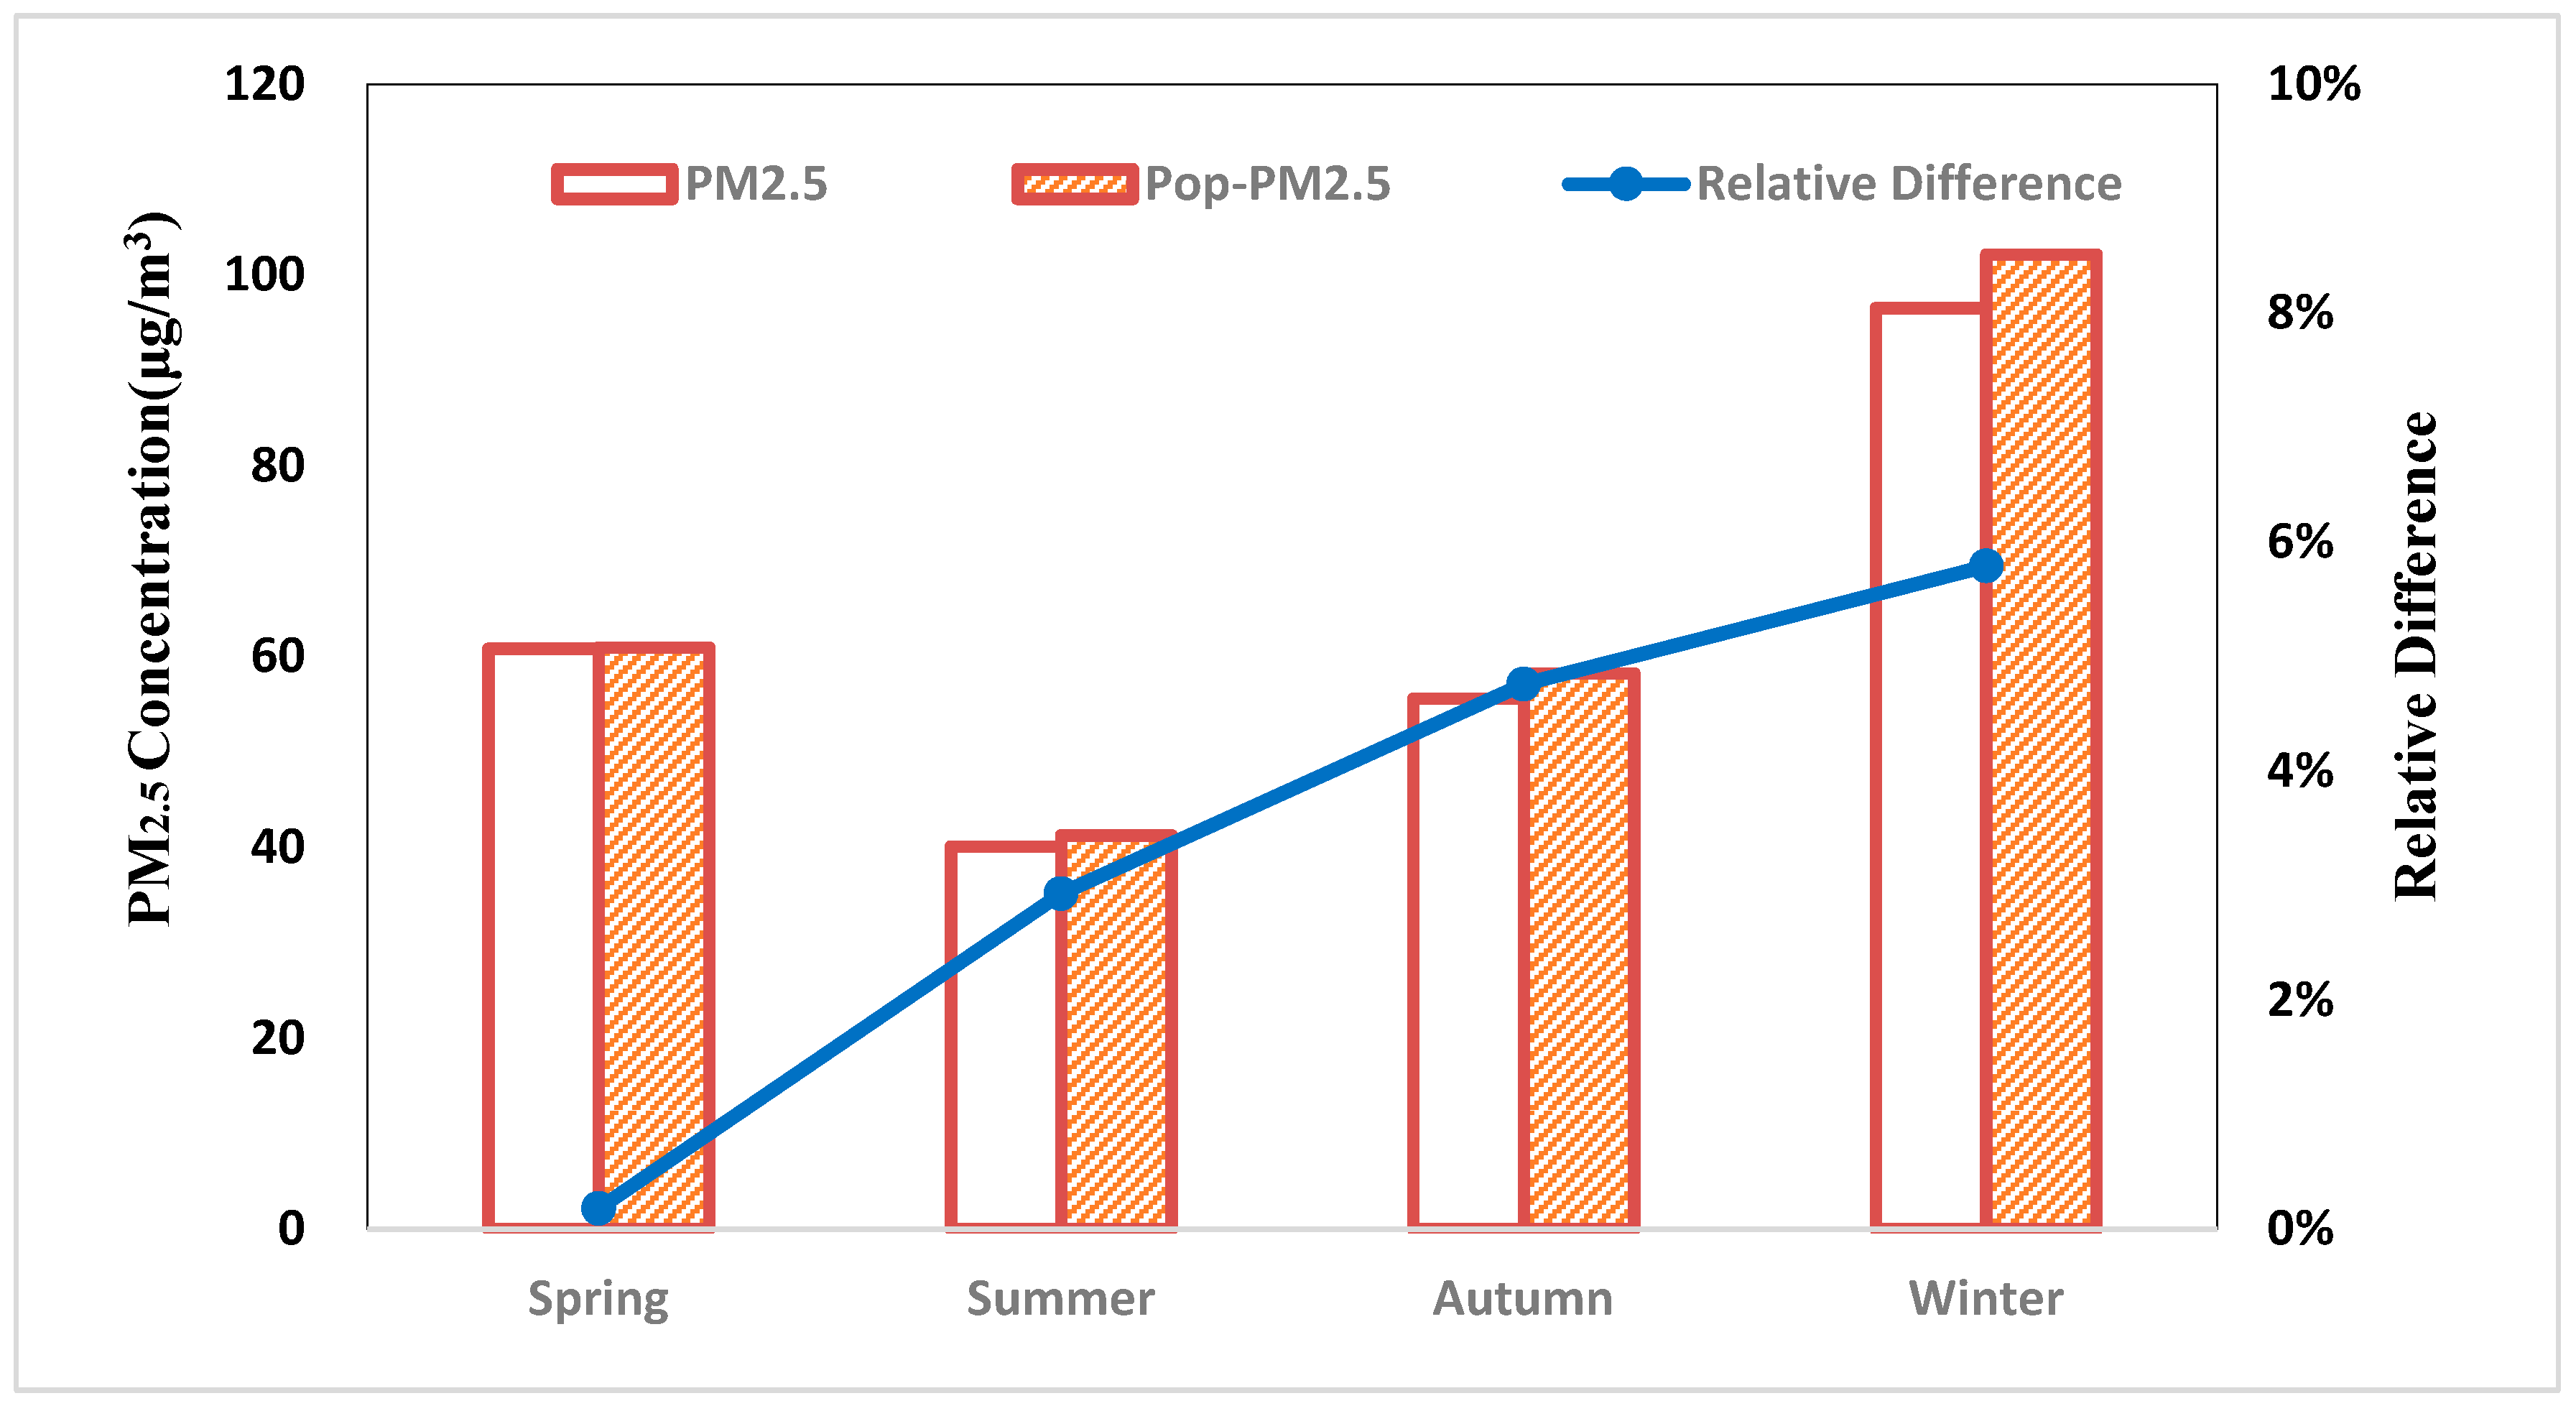
4.4. Population-Weighted PM2.5 Pollution

Figure 8 shows the PM2.5 concentrations averaged in the YRD Region for the four seasons are 60.8 μg/m3, 40.1 μg/m3, 55.6 μg/m3 and 96.5 μg/m3 in spring, summer, autumn and winter, respectively, but the population-weighted PM2.5 concentrations are 61.8 μg/m3, 41.3 μg/m3, 58.2 μg/m3 and 102.1 μg/m3, increasing by 0.62%, 2.93%, 4.76% and 5.79%, respectively, indicating that the actual health impacts in this region are higher than that estimated by the PM2.5 concentration, especially in winter and autumn.
Given a certain region, the higher the relative difference is, the larger the spatial variations in PM2.5 pollutions are. The population-weighted PM2.5 concentration and the unweighted PM2.5 concentration for the four major cities listed in Table 3 illustrate smaller differences in spring than for the other seasons, with the exception of Hefei, whose difference is only 0.12% and can almost be ignored. However, the difference is more significant in winter in general, with the biggest difference found for Hangzhou where the population-weighted PM2.5 concentration (97.2 μg/m3) is 26.5% higher than the unweighted PM2.5 concentration (76.8 μg/m3), suggesting that the population in Hangzhou is concentrated in heavily polluted areas in winter. Moreover, the difference between the population-weighted and unweighted PM2.5 concentrations in spring and summer was small, indicating that the spatial variation of PM2.5 was also small in this period.
With the exception of Shanghai, differences in the population-weighted and unweighted PM2.5 concentrations are found for the other three Provinces, with the biggest difference for Anhui, suggesting that a greater fraction of the population in Anhui is distributed in heavily polluted areas due to the closer proximity with the more polluted north (see Figure 4 and Figure 5). This highlights the potential role for city planning in implementing exposure-reduction measures (e.g., the restriction of high-population-density areas) for mitigating negative impacts on public health [52]. Therefore, to assess the risk level of population exposure to PM2.5 pollution, especially in different administrative Regions, the deployment of the population-weighted PM2.5 concentration may be considered, especially at a fine-resolution grid or for smaller administrative units (e.g., at town, street or village level).

5. Conclusions

By using multi-satellite data with machine-learning methods, we derived high-spatial-resolution population density and PM2.5 concentration, using the YRD Region as an example of the expected spatial and seasonal variations in PM2.5 exposure level. The 3-km-resolution results are suitable for accurately estimating the public-health risks caused by PM2.5 pollution over large scales in China.
Overall, relatively high and low PM2.5 concentrations were mainly found in the north and south, respectively, while the average fraction of the population exposed to PM2.5 > 35 μg/m3 is close to 100% during all four seasons. The spatial distribution of population exposure to PM2.5 is discontinuous and exhibits obvious urban–suburban–rural difference across the YRD Region. In other words, a relatively high PM2.5 concentration is not necessarily connected to a high population exposure to PM2.5 pollution, but high-density populations are usually associated with high PM2.5 population-exposure risks in the YRD Region. The high-level exposure of PM2.5 was mainly found in Shanghai, most of the Jiangsu Province, central and southern Anhui, and individual coastal cities in Zhejiang. For the four major cities, the highest exposure intensity to PM2.5 appeared in Shanghai, followed by Nanjing and Hefei, and the lowest in Hangzhou.
There is a significant difference in PM2.5 pollution between the four seasons due to the emissions combined with the unfavorable meteorological conditions. As a result, the highest risk of population exposure to PM2.5 occurs in winter, followed by spring and autumn, with the lowest risk in summer, which is consistent with the seasonal variation of PM2.5 in the YRD Region. Seasonal-averaged values of population-weighted PM2.5 concentrations are different from the unweighted PM2.5 concentration in the YRD Region, with the largest difference found in winter, followed by autumn and summer, and marginal differences found in spring. These differences are closely related to the urban-exposed population density and pollution levels. Therefore, due to the difference in spatial distributions of the PM2.5 concentration and the population density, the actual health impacts of PM2.5 pollution on the overall population exhibited spatial differences in the YRD Region. Therefore, assessment of the risk level of population exposure to PM2.5 pollution, especially depending on the particular administrative Region, needs to be considered, with the population-weighted PM2.5 concentration on a fine-resolution grid or at a smaller administrative scale (e.g., towns, streets, villages), one parameter that may serve as a more detailed assessment of the PM2.5 pollution-exposure risk.
This study provided more detailed information on the spatial and seasonal differences at the 3-km scale across a broad PM2.5 exposure in the YRD Region. Our high-spatial-resolution estimates of PM2.5 exposure using multi-satellite retrievals may further serve analogous investigations for other Regions of China or in other developing countries having high concentrations of PM2.5 and high-density populations.

Author Contributions

Supervision, Z.G. and Y.Y.; Conceptualization, Y.Y. and H.W.; Methodology, J.L. and H.W.; Software, J.L.; Writing–original draft, H.W. and J.L.; Writing—review & editing, S.H.L.Y., H.S., H.C.H., Z.L., Z.Z., C.L., Y.L., Z.G., G.N., Y.Y.

Funding

This study was supported by the National Key Research and Development Program of China (2018YFC1506502 and 2016YFC0203300), the National Natural Science Foundation of China (No. 41601550) and the open funding of State Key Laboratory of Loess and Quaternary Geology (SKLLQG1842).

Acknowledgments

We thank anonymous reviewers and editors for their constructive comments and suggestions.

Conflicts of Interest

The authors declare no conflict of interest.

References

  1. Pope, C.A., III; Burnett, R.T.; Thun, M.J.; Calle, E.E.; Krewski, D.; Ito, K.; Thurston, G.D.; Pope, C.A. Lung Cancer, Cardiopulmonary Mortality, and Long-term Exposure to Fine Particulate Air Pollution. JAMA 2002, 287, 1132–1141. [Google Scholar] [CrossRef] [PubMed]
  2. Wang, H.; Gao, Z.; Ren, J.; Liu, Y.; Chang, L.T.-C.; Cheung, K.; Feng, Y.; Li, Y. An urban-rural and sex differences in cancer incidence and mortality and the relationship with PM2.5 exposure: An ecological study in the southeastern side of Hu line. Chemosphere 2019, 216, 766–773. [Google Scholar] [CrossRef] [PubMed]
  3. Zeng, X.-W.; Vivian, E.; Mohammed, K.A.; Jakhar, S.; Vaughn, M.; Huang, J.; Zelicoff, A.; Xaverius, P.; Bai, Z.; Lin, S.; et al. Long-term ambient air pollution and lung function impairment in Chinese children from a high air pollution range area: The Seven Northeastern Cities (SNEC) study. Atmos. Environ. 2016, 138, 144–151. [Google Scholar] [CrossRef]
  4. Chen, X.; Zhang, L.-W.; Huang, J.-J.; Song, F.-J.; Zhang, L.-P.; Qian, Z.-M.; Trevathan, E.; Mao, H.-J.; Han, B.; Vaughn, M.; et al. Long-term exposure to urban air pollution and lung cancer mortality: A 12-year cohort study in Northern China. Sci. Total Environ. 2016, 571, 855–861. [Google Scholar] [CrossRef] [PubMed]
  5. Saikawa, E.; Naik, V.; Horowitz, L.W.; Liu, J.; Mauzerall, D.L. Present and potential future contributions of sulfate, black and organic carbon aerosols from China to global air quality, premature mortality and radiative forcing. Atmos. Environ. 2009, 43, 2814–2822. [Google Scholar] [CrossRef]
  6. Zhong, M.; Chen, F.; Saikawa, E. Sensitivity of projected PM2.5- and O3-related health impacts to model inputs: A case study in mainland China. Environ. Int. 2019, 123, 256–264. [Google Scholar] [CrossRef]
  7. González-Flecha, B. Oxidant mechanisms in response to ambient air particles. Mol. Asp. Med. 2004, 25, 169–182. [Google Scholar] [CrossRef]
  8. Hu, X.; Zhang, Y.; Ding, Z.; Wang, T.; Lian, H.; Sun, Y.; Wu, J. Bioaccessibility and health risk of arsenic and heavy metals (Cd, Co, Cr, Cu, Ni, Pb, Zn and Mn) in TSP and PM2.5 in Nanjing, China. Atmos. Environ. 2012, 57, 146–152. [Google Scholar] [CrossRef]
  9. Gakidou, E.; Afshin, A.; Abajobir, A.A.; Abate, K.H.; Abbafati, C.; Abbas, K.M.; Abd-Allah, F.; Abdulle, A.M.; Abera, S.F.; Aboyans, V.; et al. Global, regional, and national comparative risk assessment of 84 behavioural, environmental and occupational, and metabolic risks or clusters of risks, 1990–2016: A systematic analysis for the Global Burden of Disease Study 2016. Lancet 2017, 390, 1345–1422. [Google Scholar] [CrossRef]
  10. Van Donkelaar, A.; Martin, R.V.; Brauer, M.; Boys, B.L. Use of satellite observations for long-term exposure assessment of global concentrations of fine particulate matter. Environ. Health Perspect. 2014, 123, 135–143. [Google Scholar] [CrossRef]
  11. Apte, J.S.; Marshall, J.D.; Cohen, A.J.; Brauer, M. Addressing Global Mortality from Ambient PM2.5. Environ. Sci. Technol. 2015, 49, 8057–8066. [Google Scholar] [CrossRef] [PubMed]
  12. Lin, C.Q.; Liu, G.; Lau, A.K.H.; Li, Y.; Li, C.C.; Fung, J.C.H.; Lao, X.Q. High-resolution satellite remote sensing of provincial PM5 trends in China from 2001 to 2015. Atmos. Environ. 2018, 180, 110–116. [Google Scholar] [CrossRef]
  13. An, Z.; Huang, R.-J.; Zhang, R.; Tie, X.; Li, G.; Cao, J.; Zhou, W.; Shi, Z.; Han, Y.; Gu, Z.; et al. Severe haze in northern China: A synergy of anthropogenic emissions and atmospheric processes. Proc. Natl. Acad. Sci. USA 2019, 116, 8657–8666. [Google Scholar] [CrossRef] [PubMed]
  14. Zheng, Z.; Xu, G.; Yang, Y.; Wang, Y.; Li, Q. Statistical characteristics and the urban spillover effect of haze pollution in the circum-Beijing region. Atmos. Pollut. Res. 2018, 9, 1062–1071. [Google Scholar] [CrossRef]
  15. Wang, Z.; Li, J.; Wang, Z.; Yang, W.; Tang, X.; Ge, B.; Yan, P.; Zhu, L.; Chen, X.; Chen, H.; et al. Modeling study of regional severe hazes over Mid-Eastern China in January 2013 and its implications on pollution prevention and control. Sci. China Earth Sci. 2014, 57, 3–13. [Google Scholar] [CrossRef]
  16. Renhe, Z.; Li, Q.; Zhang, R. Meteorological conditions for the persistent severe fog and haze event over eastern China in January 2013. Sci. China Earth Sci. 2014, 57, 26–35. [Google Scholar] [CrossRef]
  17. Li, Z.; Che, W.; Frey, H.C.; Lau, A.K.; Lin, C. Characterization of PM2.5 exposure concentration in transport microenvironments using portable monitors. Environ. Pollut. 2017, 228, 433–442. [Google Scholar] [CrossRef]
  18. Zhang, X.; Hu, H. Risk Assessment of Exposure to PM2.5 in Beijing Using Multi-Source Data. Acta Sci. Nat. Univereitatie Pekineneie 2018, 54, 1103–1113. (In Chinese) [Google Scholar]
  19. Shaddick, G.; Thomas, M.L.; Green, A.; Brauer, M.; van Donkelaar, A.; Burnett, R.; Chang, H.H.; Cohen, A.; Van Dingenen, R.; Dora, C.; et al. Data integration model for air quality: A hierarchical approach to the global estimation of exposures to ambient air pollution. J. R. Stat. Soc. 2018, 67, 231–253. [Google Scholar] [CrossRef]
  20. Liu, C.; Chen, R.; Sera, F.; Vicedo-Cabrera, A.M.; Guo, Y.; Tong, S.; Coelho, M.S.; Saldiva, P.H.; Lavigne, E.; Matus, P.; et al. Ambient Particulate Air Pollution and Daily Mortality in 652 Cities. N. Engl. J. Med. 2019, 381, 705–715. [Google Scholar] [CrossRef]
  21. Lee, H.J.; Chatfield, R.B.; Strawa, A.W. Enhancing the Applicability of Satellite Remote Sensing for PM2.5 Estimation Using MODIS Deep Blue AOD and Land Use Regression in California, United States. Environ. Sci. Technol. 2016, 50, 6546–6555. [Google Scholar] [CrossRef] [PubMed]
  22. Van Donkelaar, A.; Martin, R.V.; Brauer, M.; Hsu, N.C.; Kahn, R.A.; Levy, R.C.; Lyapustin, A.; Sayer, A.M.; Winker, D.M. Global Estimates of Fine Particulate Matter using a Combined Geophysical-Statistical Method with Information from Satellites, Models, and Monitors. Environ. Sci. Technol. 2016, 50, 3762. [Google Scholar] [CrossRef] [PubMed]
  23. Li, T.; Shen, H.; Zeng, C.; Yuan, Q.; Zhang, L. Point-surface fusion of station measurements and satellite observations for mapping PM2.5 distribution in China: Methods and assessment. Atmos. Environ. 2017, 152, 477–489. [Google Scholar] [CrossRef]
  24. Li, T.; Shen, H.; Yuan, Q.; Zhang, X.; Zhang, L. Estimating Ground-Level PM2.5 by Fusing Satellite and Station Observations: A Geo-Intelligent Deep Learning Approach. Geophys. Res. Lett. 2017, 44, 11–985. [Google Scholar] [CrossRef]
  25. He, Q.; Huang, B. Satellite-based mapping of daily high-resolution ground PM2.5 in China via space-time regression modeling. Remote Sens. Environ. 2018, 206, 72–83. [Google Scholar] [CrossRef]
  26. Wei, J.; Huang, W.; Li, Z.; Xue, W.; Peng, Y.; Sun, L.; Cribb, M. Estimating 1-km-resolution PM2.5 concentrations across China using the space-time random forest approach. Remote Sens. Environ. 2019, 231, 111221. [Google Scholar] [CrossRef]
  27. Guo, J.-P.; Zhang, X.-Y.; Che, H.-Z.; Gong, S.-L.; An, X.; Cao, C.-X.; Guang, J.; Zhang, H.; Wang, Y.-Q.; Zhang, X.-C.; et al. Correlation between PM concentrations and aerosol optical depth in eastern China. Atmos. Environ. 2009, 43, 5876–5886. [Google Scholar] [CrossRef]
  28. Wu, Y.; Guo, J.; Zhang, X.; Tian, X.; Zhang, J.; Wang, Y.; Duan, J.; Li, X. Synergy of satellite and ground based observations in estimation of particulate matter in eastern China. Sci. Total Environ. 2012, 433, 20–30. [Google Scholar] [CrossRef]
  29. Jerrett, M.; Arain, A.; Kanaroglou, P.; Beckerman, B.; Potoglou, D.; Sahsuvaroglu, T.; Morrison, J.; Giovis, C. A review and evaluation of intraurban air pollution exposure models. J. Expo. Anal. Environ. Epidemiol. 2005, 15, 185–204. [Google Scholar] [CrossRef]
  30. Kloog, I.; Koutrakis, P.; Coull, B.A.; Lee, H.J.; Schwartz, J. Assessing temporally and spatially resolved PM2.5 exposures for epidemiological studies using satellite aerosol optical depth measurements. Atmos. Environ. 2011, 45, 6267–6275. [Google Scholar] [CrossRef]
  31. Zhang, A.; Qi, Q.; Jiang, L.; Zhou, F.; Wang, J. Population Exposure to PM2.5 in the Urban Area of Beijing. PLoS ONE 2013, 8, e63486. [Google Scholar] [CrossRef] [PubMed]
  32. Gui, K.; Che, H.; Wang, Y.; Wang, H.; Zhang, L.; Zhao, H.; Zheng, Y.; Sun, T.; Zhang, X. Satellite-derived PM2.5 concentration trends over Eastern China from 1998 to 2016: Relationships to emissions and meteorological parameters. Environ. Pollut. 2019, 247, 1125–1133. [Google Scholar] [CrossRef] [PubMed]
  33. Langford, M.; Unwin, D.J. Generating and mapping population density surfaces within a geographical information system. Cartogr. J. 1994, 31, 21–26. [Google Scholar] [CrossRef] [PubMed]
  34. Deichmann, U.; Balk, D.; Yetman, G. Transforming Population Data for Interdisciplinary Usages: From Census to Grid; Documentation for GPW Version 2; Center for International Earth Science Information Network: Washington, DC, USA, 2001; Available online: http://sedac.ciesin.columbia.edu/plue/gpw/GPWdocumentation.pdf (accessed on 15 November 2019).
  35. Li, K.; Chen, Y.; Li, Y. The Random Forest-Based Method of Fine-Resolution Population Spatialization by Using the International Space Station Nighttime Photography and Social Sensing Data. Remote Sens. 2018, 10, 1650. [Google Scholar] [CrossRef] [Green Version]
  36. Wang, L.; Wang, S.; Zhou, Y.; Liu, W.; Hou, Y.; Zhu, J.; Wang, F. Mapping population density in China between 1990 and 2010 using remote sensing. Remote Sens. Environ. 2018, 210, 269–281. [Google Scholar] [CrossRef]
  37. Li, X.; Zhou, W. Dasymetric mapping of urban population in China based on radiance corrected DMSP-OLS nighttime light and land cover data. Sci. Total Environ. 2018, 643, 1248–1256. [Google Scholar] [CrossRef]
  38. Ye, T.; Zhao, N.; Yang, X.; Ouyang, Z.; Liu, X.; Chen, Q.; Hu, K.; Yue, W.; Qi, J.; Li, Z.; et al. Improved population mapping for China using remotely sensed and points-of-interest data within a random forests model. Sci. Total Environ. 2019, 658, 936–946. [Google Scholar] [CrossRef]
  39. Yang, Y.J.; Gao, Z.; Shi, T.; Wang, H.; Li, Y.; Zhang, N.; Zhang, H.; Huang, Y. Assessment of urban surface thermal environment using MODIS with a population-weighted method: A case study. J. Spat. Sci. 2019, 64, 287–300. [Google Scholar] [CrossRef]
  40. Stevens, F.R.; Gaughan, A.E.; Linard, C.; Tatem, A.J. Disaggregating census data for population mapping using random forests with remotely-sensed and ancillary data. PLoS ONE 2015, 10, e0107042. [Google Scholar] [CrossRef] [Green Version]
  41. Sorichetta, A.; Hornby, G.M.; Stevens, F.R.; Gaughan, A.E.; Linard, C.; Tatem, A.J. High-resolution gridded population datasets for Latin America and the Caribbean in 2010, 2015, and 2020. Sci. Data 2015, 2, 150045. [Google Scholar] [CrossRef] [Green Version]
  42. Yang, X.; Ye, T.; Zhao, N.; Chen, Q.; Yue, W.; Qi, J.; Zeng, B.; Jia, P. Population Mapping with Multisensor Remote Sensing Images and Point-Of-Interest Data. Remote Sens. 2019, 11, 574. [Google Scholar] [CrossRef] [Green Version]
  43. Yang, Y.; Zheng, X.; Gao, Z.; Wang, H.; Wang, T.; Li, Y.; Lau, G.N.C.; Yim, S.H.L. Long-Term Trends of Persistent Synoptic Circulation Events in Planetary Boundary Layer and Their Relationships with Haze Pollution in Winter Half Year Over Eastern China. J. Geophys. Res. Atmos. 2018, 123, 10–991. [Google Scholar] [CrossRef]
  44. Wang, J.; De Leeuw, G.; Niu, S.; Kang, H. Contrasting Aerosol Optical Characteristics and Source Regions During Summer and Winter Pollution Episodes in Nanjing, China. Remote Sens. 2019, 11, 1696. [Google Scholar] [CrossRef] [Green Version]
  45. Xing, C.; Liu, C.; Wang, S.; Chan, K.L.; Gao, Y.; Huang, X.; Su, W.; Zhang, C.; Dong, Y.; Fan, G.; et al. Observations of the vertical distributions of summertime atmospheric pollutants and the corresponding ozone production in Shanghai, China. Atmos. Chem. Phys. Discuss. 2017, 17, 14275–14289. [Google Scholar] [CrossRef] [Green Version]
  46. Kang, H.; Zhu, B.; Gao, J.; He, Y.; Wang, H.; Su, J.; Pan, C.; Zhu, T.; Yu, B. Potential impacts of cold frontal passage on air quality over the Yangtze River Delta, China. Atmos. Chem. Phys. Discuss. 2019, 19, 3673–3685. [Google Scholar] [CrossRef] [Green Version]
  47. Yu, S.; Zhang, Z.; Liu, F. Monitoring Population Evolution in China Using Time-Series DMSP/OLS Nightlight Imagery. Remote Sens. 2018, 10, 194. [Google Scholar] [CrossRef] [Green Version]
  48. Zhou, Y.; Fu, J.S.; Zhuang, G.; Levy, J.I. Risk-Based Prioritization among Air Pollution Control Strategies in the Yangtze River Delta, China. Environ. Heal. Perspect. 2010, 118, 1204–1210. [Google Scholar] [CrossRef]
  49. Song, C.; He, J.; Wu, L.; Jin, T.; Chen, X.; Li, R.; Ren, P.; Zhang, L.; Mao, H. Health burden attributable to ambient PM2.5 in China. Environ. Pollut. 2017, 223, 575–586. [Google Scholar] [CrossRef]
  50. Chen, J.; Zhou, C.; Wang, S.; Hu, J. Identifying the socioeconomic determinants of population exposure to particulate matter (PM2.5) in China using geographically weighted regression modeling. Environ. Pollut. 2018, 241, 494–503. [Google Scholar] [CrossRef]
  51. Li, T.; Guo, Y.; Liu, Y.; Wang, J.; Wang, Q.; Sun, Z.; He, M.Z.; Shi, X. Estimating mortality burden attributable to short-term PM2.5 exposure: A national observational study in China. Environ. Int. 2019, 125, 245–251. [Google Scholar] [CrossRef]
  52. Lin, C.; Lau, A.K.H.; Lu, X.; Fung, J.C.H.; Li, Z.; Li, C.; Wong, A.H.S. Assessing Effect of Targeting Reduction of PM2.5 Concentration on Human Exposure and Health Burden in Hong Kong Using Satellite Observation. Remote Sens. 2018, 10, 2064. [Google Scholar] [CrossRef] [Green Version]
  53. Breiman, L. Random forests. Mach. Learn. 2001, 45, 5–32. [Google Scholar] [CrossRef] [Green Version]
  54. Dietterich, T.G. An experimental comparison of three methods for constructing ensembles of decision trees: Bagging, boosting, and randomization. Mach. Learn. 2000, 40, 139–157. [Google Scholar] [CrossRef]
  55. Esteban, J.; McRoberts, R.E.; Fernández-Landa, A.; Tomé, J.L.; Nӕsset, E. Estimating Forest Volume and Biomass and Their Changes Using Random Forests and Remotely Sensed Data. Remote Sens. 2019, 11, 1944. [Google Scholar] [CrossRef] [Green Version]
  56. Kousa, A.; Kukkonen, J.; Karppinen, A.; Aarnio, P.; Koskentalo, T. A model for evaluating the population exposure to ambient air pollution in an urban area. Atmos. Environ. 2002, 36, 2109–2119. [Google Scholar] [CrossRef]
  57. Fu, D.; Xia, X.; Duan, M.; Zhang, X.; Li, X.; Wang, J.; Liu, J. Mapping nighttime PM5 from VIIRS DNB using a linear mixed-effect model. Atmos. Environ. 2018, 178, 214–222. [Google Scholar] [CrossRef]
  58. Lin, C.; Li, Y.; Lau, A.K.; Deng, X.; Tse, T.K.; Fung, J.C.; Li, C.; Li, Z.; Lu, X.; Zhang, X.; et al. Estimation of long-term population exposure to PM2.5 for dense urban areas using 1-km MODIS data. Remote Sens. Environ. 2016, 179, 13–22. [Google Scholar] [CrossRef] [Green Version]
  59. Hu, J.; Wang, Y.; Ying, Q.; Zhang, H. Spatial and temporal variability of PM2.5 and PM10 over the North China Plain and the Yangtze River Delta, China. Atmos. Environ. 2014, 95, 598–609. [Google Scholar] [CrossRef]
  60. Hua, Y.; Cheng, Z.; Wang, S.; Jiang, J.; Chen, D.; Cai, S.; Fu, X.; Fu, Q.; Chen, C.; Xu, B.; et al. Characteristics and source apportionment of PM2.5 during a fall heavy haze episode in the Yangtze River Delta of China. Atmos. Environ. 2015, 123, 380–391. [Google Scholar] [CrossRef]
  61. Wang, H.-J.; Chen, H.-P. Understanding the recent trend of haze pollution in eastern China: Roles of climate change. Atmos. Chem. Phys. Discuss. 2016, 16, 4205–4211. [Google Scholar] [CrossRef] [Green Version]
  62. Ming, L.; Jin, L.; Li, J.; Fu, P.; Yang, W.; Liu, D.; Zhang, G.; Wang, Z.; Li, X. PM2.5 in the Yangtze River Delta, China: Chemical compositions, seasonal variations, and regional pollution events. Environ. Pollut. 2017, 223, 200–212. [Google Scholar] [CrossRef] [PubMed]
  63. Yang, Y.; Wang, H.; Chen, F.; Zheng, X.; Fu, Y.; Zhou, S. TRMM-Based Optical and Microphysical Features of Precipitating Clouds in Summer Over the Yangtze–Huaihe River Valley, China. Pure Appl. Geophys. 2019, 176, 357–370. [Google Scholar] [CrossRef]
  64. Song, Y.; Huang, B.; He, Q.; Chen, B.; Wei, J.; Mahmood, R. Dynamic assessment of PM2.5 exposure and health risk using remote sensing and geo-spatial big data. Environ. Pollut. 2019, 253, 288–296. [Google Scholar] [CrossRef] [PubMed]
Figure 1. Spatial distribution in the Yangtze River Delta (YRD) region of the parameters (a) digital elevation model (DEM), (b) Day/Night Band (DNB) radiance of night-time-light (NTL), and (c) Normalized Difference Vegetation Index (NDVI) at 1-km resolution.
Remotesensing 11 02724 g001
Figure 2. Dependence of the variance-explained coefficient R2 on the parameters Mtry (a) and Ntree (b).
Remotesensing 11 02724 g002
Figure 3. (a) 10-fold cross-validation (CV) for the random-forest (RF) model of population density estimation in 2013; (b) RE analysis of estimated population and census population in 2013; (c) spatial distribution of population at 1-km resolution estimated from the RF model in the Yangtze River Delta in 2013.
Remotesensing 11 02724 g003
Figure 4. Seasonal spatial distribution of MODIS-based PM2.5 concentration at 3-km resolution in the YRD Region in 2013.
Remotesensing 11 02724 g004
Figure 5. Spatial distribution of population-exposure intensity to PM2.5 in the YRD region at 3-km resolution for the four seasons of 2013.
Remotesensing 11 02724 g005
Figure 6. Intensity of population exposure to PM2.5 in the major cities during the four seasons of 2013 in the YRD Region.
Remotesensing 11 02724 g006
Figure 7. The percentage cumulative distribution (%) of the population exposed to PM2.5 in the four major cities and the YRD Region.
Remotesensing 11 02724 g007
Figure 8. PM2.5 concentration vs population-weighted PM2.5 (Pop-PM2.5) concentration and their relative difference in the YRD Region for the four seasons of 2013.
Remotesensing 11 02724 g008
Table 1. Summary of data used in this study.
DATAPeriodsSpatial ResolutionData Source
PM2.520133 km ✕ 3 kmEstimation from the method of Li et al. [23]
Population2013county levelAnnual reports published by the Department of Civil Affairs, National Bureau of Statistics of China
NDVI20131 km ✕ 1 kmhttps://modis.gsfc.nasa.gov/data/dataprod/mod13.php
DEM (Slope)20131 km ✕ 1 kmhttp://www.dsac.cn/
NTL (DMSP/OLS)20131 km ✕ 1 kmhttps://ngdc.noaa.gov/eog/dmsp/downloadV4composites.html
Table 2. The importance of input variables for random-forest (RF) model of population estimation.
Input Variable%IncMSEIncNodePurity
NTL33.61200.51
NDVI25.45160.74
DEM12.3290.47
Slope19.0980.16
Table 3. PM2.5 concentration (μg/m3) and Pop-PM2.5 concentration (μg/m3), and their difference degrees (D-value, %) in key cities and Province of four seasons in 2013.
RegionSpringSummerAutumnWinter
PM2.5Pop-PM2.5D-ValuePM2.5Pop-PM2.5D-ValuePM2.5Pop-PM2.5D-ValuePM2.5Pop-PM2.5D-Value
Anhui
(Hefei)
64.3
(69.9)
65.5
(70.0)
1.9
(0.1)
42.1
(45.0)
44.5
(46.1)
5.7
(2.5)
63.7
(67.1)
67.4
(71.3)
5.8
(6.2)
100.1
(109.5)
108.8
(115.7)
8.7
(5.6)
Jiangsu
(Nanjing)
65.7
(68.0)
65.2
(68.9)
−0.7
(1.3)
45.9
(44.4)
45.4
(45.4)
−1.2
(2.2)
61.2
(62.6)
60.9
(66.7)
−0.5
(6.6)
116.2
(111.8)
114.6
(118.1)
−1.4
(5.6)
Zhejiang
(Hangzhou)
54.5
(55.2)
54.3
(59.9)
−0.4
(8.4)
32.2
(35.3)
32.6
(38.8)
1.2
(9.8)
50.5
(53.4)
49.0
(58.5)
−3.1
(9.5)
75.3
(76.8)
80.3
(97.2)
6.6
(26.5)
Shanghai58.958.7−0.240.239.8−1.146.947.51.494.595.51.0

