Letter

The Influence of Vegetation Characteristics on Individual Tree Segmentation Methods with Airborne LiDAR Data

1
State Key Laboratory of Vegetation and Environmental Change, Institute of Botany, Chinese Academy of Sciences, Beijing 100093, China
2
University of Chinese Academy of Sciences, No.19A Yuquan Road, Beijing 100049, China
3
Department of Environmental Sciences, Policy and Management, University of California, Berkeley, CA 94720-3114, USA
4
Division of Agriculture and Natural Resources, University of California, Berkeley, CA 94720-3114, USA
5
Department of Forestry, Mississippi State University, Mississippi State, MS 39762, USA
6
College of Resources and Environmental Sciences, Xinjiang University, Urumqi 8300026, China
7
Xinjiang Lidar Applied Engineering Technology Research Center, Urumqi 830002, China
8
Xinjiang Land and Resources Information Center, Urumqi 830002, China
*
Author to whom correspondence should be addressed.
Remote Sens. 2019, 11(23), 2880; https://doi.org/10.3390/rs11232880
Submission received: 16 October 2019 / Revised: 15 November 2019 / Accepted: 27 November 2019 / Published: 3 December 2019
(This article belongs to the Special Issue Trends in UAV Remote Sensing Applications)

Abstract

:
This study investigated the effects of forest type, leaf area index (LAI), canopy cover (CC), tree density (TD), and the coefficient of variation of tree height (CVTH) on the accuracy of different individual tree segmentation methods (i.e., canopy height model, pit-free canopy height model (PFCHM), point cloud, and layer stacking seed point) with LiDAR data. A total of 120 sites in the Sierra Nevada Forest (California) and Shavers Creek Watershed (Pennsylvania) of the United States, covering various vegetation types and characteristics, were used to analyze the performance of the four selected individual tree segmentation algorithms. The results showed that the PFCHM performed best in all forest types, especially in conifer forests. The main forest characteristics influencing segmentation methods were LAI and CC, LAI and TD, and CVTH in conifer, broadleaf, and mixed forests, respectively. Most of the vegetation characteristics (i.e., LAI, CC, and TD) negatively correlated with all segmentation methods, while the effect of CVTH varied with forest type. These results can help guide the selection of individual tree segmentation method given the influence of vegetation characteristics.

Graphical Abstract

1. Introduction

Forests cover approximately 30% of the Earth’s land surface and play an important role in the carbon and water cycles, biodiversity conservation, and sustainable development [1,2]. The quantitative characterization of forest structure can contribute to better understanding, utilization, and management of forests [3,4,5]. Individual tree segmentation, such as a prerequisite for obtaining accurate forest structure information (e.g., tree location, tree height, diameter at breast height (DBH), and biomass), has gained tremendous attention in the last few decades [3,6,7,8,9].
Light detection and ranging (LiDAR), an active remote sensing technology, can provide an accurate distance between a sensor and a target by recording the time of flight between the laser transmitter and receiver [10]. It can penetrate forest canopy and capture data from multiple echoes to create a three-dimensional (3D) representation of forests. Light detection and ranging data have been widely applied in forest studies to characterize forest structures from precise 3D point cloud data [9,11,12,13,14,15]. Among these studies, individual tree segmentation is a prerequisite to fully quantify forest structures.
Numerous individual tree segmentation methods have been proposed for different situations, and these can be grouped into two types: canopy height model (CHM)-based, and point cloud-based (Table 1) methods. The CHM-based methods, such as watershed, moving window maximum, and multi-scale segmentation methods [16], segment individual trees to derive an upper contour of a tree canopy and a treetop determined by the maximum value in the contour [17,18]. Canopy height model-based methods have been applied successfully in many studies due to the fact their high efficiency. For example, Hyyppa et al. [19] proposed a regional growth individual segmentation method which achieved individual tree segmentation in a conifer forests for the first time. Chen [11] proposed a marker-controlled watershed method to isolate individual trees by detecting treetops with a moving window of variable sizes. Khosravipour et al. [20] proposed a new algorithm that removed pits from the CHM raster (i.e., pit-free CHM) obtained by first-return triangulated irregular network (TIN) interpolation using raster-based techniques, and the pit-free CHM was further used to conduct segmentation with a moving window. However, these CHM-based methods showed weakness when trees tightly overlap and in homogenous multilayered conifer forests [15,21].
Point cloud-based methods segment individual trees from discrete point cloud data directly using clustering methods (e.g., k-means clustering, fuzzy c-means, and hierarchical clustering) or voxel-based methods (e.g., normalized cut) [16,21,27,33]. For example, Morsdorf et al. [34] used k-means to segment individual trees in a conifer forest. Reitberger et al. [24] proposed the normalized cut method to isolate trees which aimed to solve the problem of segmenting small trees under the CHM. Li et al. [25] proposed a point cloud-based method that utilized a regional growth algorithm to judge the relative spacing threshold between trees, achieving an overall accuracy of 90% in a mixed conifer forest. Ayrey et al. [27] proposed a layer stacking algorithm by slicing the entire forest point cloud into multilayers at a 1 m height intervals and clustering trees in each layer, which were then merged to extract the individual tree.
Although numerous individual tree segmentation methods have been proposed, it’s difficult to compare their accuracies as the LiDAR datasets used were acquired for different forest conditions, and the reported accuracy assessment methods often differ (Table 1). For example, Chen [11] evaluated the absolute accuracy for tree isolation using manually delineated benchmark data; Li et al. [25] compared the segmented trees with the reference trees using GPS measurement and used the F-score to evaluate the segmentation accuracy [35]. A systematic evaluation of different individual tree segmentation methods is needed.
Additionally, the influence of different forest characteristics on segmentation accuracy has also been rarely studied. Some studies have suggested that tree density, vegetation type, and canopy cover affect the performance of individual segmentation [36]. For instance, Falkowski et al. [37] analyzed the accuracy of two kinds of tree detection algorithms across a full range of canopy covers and found that the algorithms performed well when canopy cover was lower than 50%. Vauhkonen et al. [38] compared six kinds of tree detection algorithms in different types of forest, and their results showed that tree density and clustering were the key vegetation characteristics affecting segmentation. Forzieri et al. [39] demonstrated that when the ratio between the average plant spacing and the average crown diameter was greater than 0.59, tree detection was improved. These studies show that the influence of different vegetation characteristics on segmentation accuracy is considerable. It is thus necessary to analyze vegetation characteristics’ influence on different segmentation methods in different forest types [39].
In this study, we aimed to compare the performances of different individual tree segmentation methods (i.e., CHM-based/CHM, pit-free CHM-based/PFCHM, point cloud-based/PCS, and layer stacking seed point-based/LSS) using the same data (i.e., airborne LiDAR) and evaluation methods (i.e., F-score and overall accuracy). Moreover, we analyzed the influence of different vegetation conditions (i.e., forest type, leaf area index, canopy cover, tree density, and coefficient of variation of tree height) on different segmentation methods.

2. Data and Methods

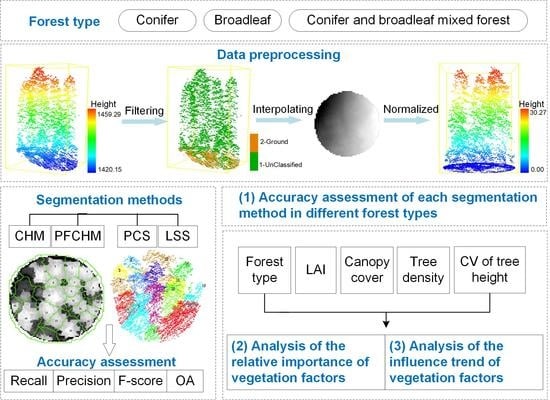
2.1. Study Area and Data

This work took place at 120 sites covering three vegetation types (i.e., conifer forest, broadleaf forest, and conifer and broadleaf mixed forests) in two areas of the United States (Figure 1). The conifer forest is located on the western slope of the Sierra Nevada Forest, California (37°26′N, 119°35′W). The dominant species in the conifer forest were Pinus ponderosa, Calocedrus decurrens, Pinus lambertiana, and Sequoiadendron giganteum. The broadleaf forest and the mixed forest are located west and east of the ridge and valley ecoregions of Shavers Creek Watershed, Pennsylvania (40°38′N, 77°56′W), respectively. The broadleaf forests are dominated by Quercus rubra, Pinus strobus, and Nyssa sylvatica. In addition to these broadleaf trees, some evergreen conifers such as Tsuga canadensis also appear often in this region.
A total of 40 circular plots were selected for each forest type (Figure 1); plots had a radius of 12.62 m, 15 m, and 15 m in conifer, broadleaf, and mixed forests, respectively. The plots were selected based on the fact of their representativeness of different levels of vegetation complexity. LAI ranged between 0.14 and 4.59; canopy cover varied from 7% to 97%; tree density ranged from 85 to 538 trees/ha; the CVTH ranged from 0.05 to 1.19 (Table 2).
Due to the lack of in situ measurements, a ground truth for each plot was assembled by visually identifying individual trees and manually delineating them by three experienced researchers who worked independently (Figure 2) using Esri ArcScene® software. The number of trees in the ground truth of conifer, broadleaf, and mixed forests were 675, 785, and 1072, respectively.
The airborne LiDAR data were acquired using an Optech GEMINI Airborne Laser Terrain Mapper (ALTM) mounted on a twin-engine Cessna Skymaster in September 2007 for the conifer forest plots [25] and in December 2010 for the broadleaf forest and mixed forest plots [21]. The relative flight height was between 600 m and 700 m and the flight speed was 60 m/s. The scanning frequency, swath width, and scanning angle were 40 Hz, 509.56 m, and ±24°, respectively. The scanner recorded up to four echoes for each pulse, which enabled a high point density (~10 pts/m2) in the obtained data.

2.2. Data Preprocessing

The quality of data preprocessing (i.e., noise removal and ground filtering) can directly affect subsequent processing and analysis [40,41]. In this study, preprocessing was implemented using LAStools [42], Esri ArcGIS, and Green Valley International® LiDAR360 software. Noise resulting from equipment accuracy, characteristics of the measured object itself, and environmental factors were removed from the raw LiDAR point cloud, and then the data were filtered into the ground and non-ground points using the improved progressive TIN densification [43] which performs well in a complex forest and terrain conditions with airborne LiDAR data. The filtered ground points were used to generate a digital elevation model (DEM) at a 0.5 m resolution using the TIN interpolation algorithm as developed in References [44,45,46]. The LiDAR points were normalized by subtracting the ground points (DEM) from the LiDAR point cloud to eliminate the influence of terrain on point cloud data processing [47]. After normalization, a CHM was generated using the same method as for the DEM. The resolution of the CHM was also set to 0.5 m so that it would be less than half of the minimum canopy size [48].

2.3. Segmentation Methods

In this study, four of the most commonly used segmentation algorithms (i.e., CHM, PFCHM, PCS, and LSS) were chosen for comparison with data from 120 plots in three forest types (Figure 3). Of these, CHM and PFCHM were based on the CHM generated from the raw point cloud, while PCS and LSS were directly based on the normalized point cloud. The CHM segmentation method uses the watershed segmentation algorithm to segment individual trees which is affected by three important parameters: minimum tree height, Gaussian smoothing factor, and Gaussian smoothing radius [49,50]. In this study, the minimum tree height was set to 2 m, which meant that trees under 2 m were not considered in the segmentation. The smoothing factor and radius were set to a range of 0.5–1.5 and 5–9 pixels, respectively, which were used to alleviate over-segmentation according to the specific conditions of each sample plot.
The PFCHM segmentation method was also implemented with the watershed segmentation algorithm, but based on the pit-free CHM. The pit-free CHM was generated by removing pits in the CHM using a pit-free algorithm [20] which uses all the first echoes to generate the standard CHM raster and construct several partial CHM grids at each height threshold (e.g., 2 m, 5 m, 10 m, and 15 m). The highest value in all CHMs was used as the value of the corresponding pixel of the merged CHM raster. The parameter setting in the watershed segmentation was the same as in the CHM segmentation method.
The PCS segmentation method used a regional growth and spacing threshold to segment the trees [25]. The regional growth starts from the maximum point of the treetop to the lowest and from the center to the boundary, then it classifies points by judging the spacing threshold and the target point to the two-dimensional projection distance of all points in the tree. If the projection distance is less than the set spacing threshold and the distance to the target tree is less than the distance from the other trees, the target point is considered to belong to the target tree. In this study, we set the spacing threshold (0.5–2) based on the average spacing of the trees in each plot.
The LSS segmentation method is also a point cloud-based method that combines the layer stacking algorithm [27] and PCS algorithm [25]. The layer stacking algorithm is used to identify the position of trees in each plot which is achieved by looking for local maxima. The local maxima are then used as seed points to segment individual trees using the PCS algorithm. The resolution of the CHM used for layer stacking was set as 0.5 m. The setting for the smoothing radius and vegetation characteristics were the same as in the CHM segmentation method. The minimum tree spacing in PCS was set according to the average spacing of the trees under different forest conditions.

2.4. Accuracy Assessment of Different Individual Tree Segmentation Methods

The segmentation results of the four segmentation methods were quantitatively evaluated at the individual tree level. If a tree existed in the ground truth and was segmented correctly, it was called a true positive (TP). If a tree did not exist in the ground truth but was segmented, it was called a false positive (FP). If a tree existed in the ground truth but was not segmented, it was called a false negative (FN). High TP, low FP, and low FN indicated better segmentation results. We calculated the recall (r), precision (p), F-score (F), and overall accuracy (OA) in each plot using Equations (1)–(4) [12,35,51]. The recall is the tree detection rate, the precision is the accuracy rate, the F-Score is the weighted harmonic average of precision and recall, and the OA is the overall accuracy calculated as the percentage of trees segmented correctly in each plot.
r = T P T P + F N
P = T P T P + F P
F = 2 × r × p r + p
O A = T P N
where N represents the number of trees in each plot.

2.5. Extraction of Vegetation Characteristics

To analyze the influence of vegetation characteristics on different individual segmentation methods, we calculated commonly used forest structural parameters, such as leaf area index, canopy cover, tree density, and coefficient of variation of tree height, for each plot.
Leaf area index (LAI) is the unilateral total area of green leaves on a unit ground surface area which is one of the most important structural parameters of vegetation canopy [52] and has been successfully retrieved using remotely sensed data at different scales. In this paper, the LAI was extracted indirectly from the airborne LiDAR data using Equations (5)–(7).
L A I = 1 k θ l n g a p   f r a c t i o n
k θ = G θ cos θ
gap fraction = (number of returns < height break)/(total number of returns)
where θ is the incident angle which is calculated by the scanning angle. k(θ) is the extinction coefficient and G(θ) is the leaf angle distribution.
Canopy cover is defined as the proportion of the forest floor covered by the vertical projection of the tree crowns [13,16]. The LiDAR data can calculate the canopy coverage either by using the three-dimensional point cloud method or the two-dimensional CHM method [53]. In this study, we used the point cloud method because the data had echo information. The point cloud of each plot was first gridded into n grids, and then the CC could be calculated using Equation (8):
C C = 1 n n v e g f i r s t n f i r s t n
where n v e g f i r s t is the number of vegetation first returns and n f i r s t is the total number of first returns.
Tree density is a quantitative measure of the number of trees per hectare (trees/ha) in each plot. The ratio of standard deviation of tree height to the mean tree height is the equation for calculating coefficient of variation of tree height (CVTH), which is a good indicator of the degree of dispersion of tree height variation. In this study, CVTH was calculated using Equation (9):
C V T H = 1 n 1 n c Z i Z ¯ 2 Z
where Z i is the height of tree i in a plot, n is the number of trees in a plot, and Z ¯ is the average tree height in a plot.

2.6. The Relative Importance of Vegetation Characteristics

In this study, the multiple regression was used to analyze the influence of vegetation characteristics on different segmentation methods. The multiple regression method can quantify the relative contribution (i.e., relative importance) of predictor values by decomposing the total variance predicted in a regression model into weights that accurately reflect the proportional contribution of the various (often correlated) predictor variables. This helps to reduce predictor collinearity [54]. The predictor variables were ranked on the basis of the degree of interpretation of model variances (% of R2). The predictor with a higher weight has more influence on the model performance. In this study, the independent and dependent variables of the model were the influential vegetation characteristics (i.e., LAI, canopy cover, tree density, and CVTH) and the four segmentation methods (i.e., CHM, PFCHM, PCS, and LSS).

2.7. Trends in the Influence of Vegetation Characteristics

We also investigated the relative influence of the vegetation characteristics on the segmentation methods. The four selected attributes (i.e., LAI, canopy cover, tree density, and CVTH), which were significant variables in the multiple regression results (p < 0.05 and a large relative contribution to the segmentation model), were divided into three levels based on the range of vegetation characteristics (Table 3). We compared the accuracy of each individual tree segmentation method at three different levels of each vegetation characteristics in each forest type. Note that the forest type was a non-parametric variable that was not added to the regression analysis. Therefore, the regression analysis of the influence of the vegetation characteristics on the segmentation model was carried out under different forest types.

3. Results

3.1. Accuracy Assessment of Different Segmentation Methods in Different Forest Types

We compared the segmentation accuracy of four segmentation methods in three forest types (Figure 4). The quantitative accuracy assessment results showed that, in terms of forest type, all segmentation methods showed the best accuracy (the highest F-score and OA) and stability (the lowest standard deviation of F-score and OA) in conifer forests, followed by mixed forest and broadleaf forests. In addition, the recall of all segmentation methods was larger than the precision in all three vegetation types, especially broadleaf forest. The differences between precision and recall were also larger on point cloud-based segmentations (PCS, LSS) than CHM-based segmentations (CHM, PFCHM), which means that the point cloud-based methods were more sensitive to different vegetation types than the CHM-based methods. The differences among the segmentation algorithms mainly arise from differences in the precision of the segmentation rather than from differences in the recall of the segmentation.
Among the four segmentation methods, the PFCHM performed best in all forest types (Figure 5, Table 4). Specifically, in the conifer forest, the F-score, and OA of PFCHM were 0.88 and 0.9, respectively, followed by LSS, PCS, and CHM. In the broadleaf forest, the F-score and OA of the PFCHM were 0.8 and 0.83, respectively, followed by CHM, LSS, and PCS. In the mixed forest, the F-score and OA of the PFCHM were 0.85 and 0.87, respectively, followed by LSS, CHM, and PCS. In addition, PFCHM and LSS had the best stability in conifer and broadleaf forests, respectively.

3.2. Analysis of the Relative Importance of Vegetation Characteristics

The difference between stability and the mis-segmentation rate for CHM, PFCCM, PCS, and LSS displayed a decreasing trend in conifer forests, mixed forests, and broadleaf forests, respectively (Figure 5 and Table 4). This suggests that forest type was a significant factor affecting the effectiveness (F-score) of the different segmentation methods. The multiple regression analysis showed that the interpretation rates of the vegetation characteristics for the four segmentation models were 0.30, 0.20, 0.13, and 0.34 in conifer forest plots, respectively (Table 5). Although the correlations coefficients (R2) were weak, the influence of LAI and canopy cover on the accuracy of segmentation accounted for more than 50% of the relative weight (Figure 6). The CVTH was another vegetation characteristic that strongly influenced PCS segmentation. In broadleaf forest plots, vegetation characteristics accounted for 78% of the variance of the CHM, PFCHM, PCS, and LSS segmentation models, and the reported R2 were 0.19, 0.07, 0.49, and 0.36 in Table 5, respectively. The LAI and tree density had a significant influence on PFCHM, PCS, and LSS (p < 0.01) except for the CVTH. In the mixed forest plots, the R2 of the vegetation characteristics on the segmentation models (CHM, PFCHM, PCS, and LSS) was 0.48, 0.56, 0.50, and 0.29 in Table 5, respectively. Among them, the CVTH had significant influence on the four segmentation methods (p < 0.001).
In general, different vegetation characteristics had different degrees of influence on each segmentation method in different forest types. The LAI and canopy cover, LAI and tree density, and CVTH had large influences on the segmentation in conifer, broadleaf, and mixed forest, especially.

3.3. Analysis of the Influence Trend of Vegetation Characteristics

The LAI exhibited a negative correlation with the accuracy (F-score) of the four analyzed segmentation methods in the three forest types (Figure 7). Especially in the conifer and broadleaf forests, there was a significant downward trend in segmentation accuracy with the increase of LAI (p < 0.01), and with an increase in LAI, PFCHM corresponded earlier to the influence of LAI than LSS. The F-score of CHM, PFCHM, and LSS was significantly reduced by the influence of canopy cover (p < 0.001) in the conifer forest, especially when the canopy cover was greater than 0.5. However, the F-scores of various segmentation methods increased first and then decreased with the increase of canopy cover which showed a consistent downward trend when the canopy cover was larger than 0.8 in broadleaf and mixed forests. Next, the four segmentation methods generally showed a downward trend under the influence of tree density in conifer and broadleaf forests. When the tree density was greater than 200 trees/ha, the accuracy of CHM, PFCHM, and LSS decreased, and PCS was affected when the tree density was greater than 325 trees/ha (the sensitivity to tree density was relatively weak).
We also found that CVTH was another important factor in all forest types, especially in the mixed forests. In conifer forests, when the CVTH was larger than 0.6, the accuracy of the CHM-based segmentation methods (CHM, PFCHM) increased relative to the point cloud-based segmentation methods (PCS, LSS). In broadleaf forests, especially when CVTH was larger than 0.3, segmentation accuracy was affected more in point cloud-based segmentation methods than the CHM-based segmentation methods. In mixed forests, the four segmentation methods showed a significant downward trend with the increase of CVTH (p < 0.001), and the downward trend was more obvious when CVTH was larger than 0.25.

4. Discussion

4.1. Differences in Segmentation Accuracies of Different Methods in Three Forest Types

The segmentation accuracy (F-score) of PFCHM was the highest in all three forest types. The possible reasons are threefold. First, the pit-free method generated a pit-free CHM with a higher accuracy than the traditional CHM, resulting in a more accurate segmentation. Second, PFCHM can reduce the mis-segmentation by removing the pit in the canopy during the process of generating CHM using the pit-free algorithm and avoiding “over-segmentation” using Gaussian filters [55,56] before the watershed segmentation. Finally, the commission rate of the PCS and LSS methods was higher than that from the method based on PFCHM, which may be caused by the uncertainty of the spacing threshold in the tree segmentations, and the appropriate threshold was difficult to determine in large CVTH and dense forests [25]. Our results were also consistent with Ayrey et al. [27] who showed that the point cloud is split into smaller pieces (Figure 4d) in emergent conifer and deciduous trees in leaf-on conditions (mostly Pinus Strobus), because the crown edge provides more overlap than the center of trees. Especially in the broadleaf forest with more shrubs under the canopy, the LSS algorithm may have led to errors in each cluster layer. In addition, the segmentation accuracy of the PCS was lower than the other methods in the broadleaf forest but was better in the conifer forest which might be caused by the fact that it was initially developed for conifer forests [25].

4.2. The Influence of Vegetation Characteristics on Segmentation Accuracies

The analysis of the influence of vegetation characteristics on different segmentation methods is critical for the choice of segmentation methods and the improvement of segmentation algorithms. The variable importance ranking showed that LAI and canopy cover, LAI and tree density, and CVTH contributed more than the other vegetation characteristics in conifer, broadleaf, and mixed forests, respectively. To some extent, our results support the conclusions of Vauhkonen et al. [38] who found that tree density and clustering were the key vegetation characteristics affecting tree detection accuracy. Besides, Falkowski et al. [37] showed that when canopy cover is greater than 50% in conifer forests, segmentation accuracy is significantly reduced. Furthermore, Peuhkurinen et al. [36] suggested that individual tree segmentation is influenced by the number of stems, canopy cover, a regular or Poisson-distributed spatial pattern of tree location, tree size, and the amount of variations in tree size in boreal Scots pine stands. Magnussen et al. [57] suggested that small trees were inclined to be undetected in a heterogeneous canopy structures, since they might be covered by large trees. The heterogeneous nature of canopy morphology can be characterized by CVTH, and the results from this study further support this. Our study also found that different forest types had a great impact on the performance of segmentation algorithms which was mainly due to the difference in canopy morphology and canopy structure of different forest types. The results of Wang et al. [33] are consistent with ours, indicating that the correct tree crown detection was influenced by species, height, and crown shape of its neighboring trees.
The regression models between the LAI and the individual tree segmentation accuracy of the three forest types showed significant correlation (p < 0.01) and decreased with the increase of LAI. A larger LAI indicates more leaves per unit area, more complex canopy structure [25,58], greater tree density, or higher tree height. When the LAI is large in broadleaf forests, there is also the possibility that many shrubs are distributed in the understory [56,59]. Wang et al. [33] suggested that forest canopy characteristics, such as canopy closure and leaf area, influence the segmentation accuracy for suppressed trees. In addition, we found that the segmentation accuracy of CHM, PFCCM, and LSS in conifer forests was significantly reduced in areas of high canopy cover (p < 0.001), and the accuracy decreased more when the canopy cover was larger than 0.5. This result is well supported by the conclusions of Falkowski et al. [37,60] and Peuhkurinen et al. [36]. If the initial filtering of raw data into ground and vegetation is poor or there are shrubs higher than two meters [33], the extraction of canopy coverage and the performance of segmentation will be adversely affected. In broadleaf and mixed forests, when the canopy coverage is low, the spatial distribution and degree of aggregation of the trees are different and the segmentation accuracy can fluctuate greatly, as in Figure 7. When the canopy coverage is greater than 0.8, no matter how trees are distributed, the edge of a tree may inevitably be overlapped [21], and the segmentation accuracy decreases with the increase of canopy coverage. This might help to explain why the individual tree detection could not be employed when the canopy cover was larger than 70% in the study by Peuhkurinen et al. [36]. Tree density is a vegetation characteristic that has indisputably a great influence on individual tree segmentation [15,21,61]. In conifer and broadleaf forests, the F-score of the four segmentation methods showed a downward trend overall, and the CHM, PFCHM, and LSS decreased when the tree density was greater than 200 trees/ha, and PCS was affected when the tree density was greater than 325 trees/ha.
We also found CVTH to be a very important vegetation characteristic (Figure 8), which was significantly correlated with segmentation accuracy in all three forest types but has rarely been mentioned in previous studies [36]. A larger CVTH corresponds to a more heterogeneous structure of the canopy and a greater possibility that small trees are covered by large trees (Figure 8a) which may significantly reduce tree detection accuracy. This finding is consistent with studies by Magnussen et al. [62] and Ozdemir et al. [63]. To begin with, the more heterogeneous the structure of the canopy, the larger the CVTH, the greater the possibility that small trees will be covered by large trees (Figure 8a), and the greater the impact on the success of tree detection; this is also consistent with the studies by Magnussen et al. [62] and Ozdemir et al. [63]. In mixed forests, the canopy of conifer and broadleaf trees is very different which can increase the value of CVTH and bring more omission and commission segmentation errors [16,39,64,65,66]. This explains why the CVTH showed a negative correlation among segmentation accuracies, especially in mixed forests.

4.3. Limitations of the Present Study

This study compared the four current popular segmentation methods (i.e., point cloud-based and CHM-based methods) and explored which and how vegetation characteristics (i.e., forest type, LAI, canopy cover, tree density, and CVTH) affect segmentation accuracy. This study is key to selecting appropriate segmentation methods under different forest conditions. However, a shortcoming of this study was the lack of ground truth of filed investigations. In this study, ground truth was generated through visual identification and manual delineation of individual trees. However, there may still be errors in the manual delineation results which therefore influence the accuracy assessment results. Nevertheless, using manual delineation results as ground truth is believed to be accurate enough and is a very commonly used method for evaluating individual tree segmentation accuracy in the literature [21,22,25,67]. The ground truth was manually delineated by three experienced researchers who worked independently. Overall, 120 plots, representative of all possible forest conditions, were used in the evaluation, which further helped reduce the influence of random errors. Future studies evaluating the performance of individual tree segmentation algorithms on more complex rainforests or simpler plantation forests will need to be conducted. Additionally, the influence of vertical stratification [33], the standardized Morisot’s index [68], and the distribution of tree location [69] in the forest on segmentation are also important which should be considered in future studies.

5. Conclusions

This study compared four segmentation methods in three forest types and analyzed the influence of vegetation characteristics on the accuracy of different segmentation methods. The results showed that PFCHM performed best with the highest F-score (0.88) and overall accuracy (0.90), followed by LSS, PCS, and CHM. The performance of individual tree segmentation algorithms was found to be dependent on forest type, LAI, canopy cover, tree density, and CVTH. In conifer forest, PFCHM performed best overall, but LSS generated the highest individual tree segmentation accuracy when the canopy cover was lower than 0.3, while the PCS-based method was the least influenced by the change in canopy cover. In the broadleaf forest, the individual tree segmentation accuracy of all methods was lower than that in the conifer forest, and LSS is a better choice when the tree density is lower than 200 trees/ha. When tree density is higher than 325 trees/ha, PFCHM can generate individual tree segmentation results equivalent to the LSS method but with higher efficiency. In mixed forest, CVHT was the best indicator for determining the choice of segmentation methods. When CVTH was lower than 0.25, PFCHM performed best; when CVHT was higher than 0.25, LSS was a better choice. We believe these results can provide guidance for users to choose the appropriate individual tree segmentation methods under different conditions.

Author Contributions

Conceptualization, Q.Y., Y.S., J.W. and Q.G.; Data curation, Q.Y., Y.S., M.K. and Q.G.; Formal analysis, Q.Y., Y.S. and S.J.; Funding acquisition, Y.S. and Q.G.; Investigation, Q.Y., S.S., J.Z. and G.X.; Methodology, Q.Y., Y.S. and S.J.; Project administration, Q.Y., Y.S. and Q.G.; Resources, Y.S., J.W. and Q.G.; Software, Q.Y. and T.H.; Supervision, Y.S.; Validation, Y.S., T.H. and Q.G.; Visualization, Q.Y.; Writing—original draft, Q.Y.; Writing—review and editing, Y.S., S.J., M.K., Q.M. and Y.L.

Funding

This work was supported by the Key Deployment Project of the Chinese Academy of Sciences (No. KFZD-SW-319-06), the National Key R&D Program of China (No. 2017YFC0503905), the CAS Pioneer Hundred Talents Program, the Provincial Key Technology Research and Development Program of Sichuan Ministry of Natural Resources for Ecological Geohazard Prevention and Mitigation in the “8•8” Jiuzhaigou Earthquake Area (No. KJ-2018-21), and the Provincial Key R&D Program of the Sichuan Ministry of Science and Technology (No. 2019YFS0074).

Acknowledgments

We thank the Sierra Nevada Adaptive Management Project (SNAMP). The SNAMP is funded by the USDA Forest Service Region 5, the USDA Forest Service Pacific Southwest Research Station, US Fish and Wildlife Service, California Department of Water Resources, California Department of Fish and Game, the California Department of Forestry and Fire Protection, and the Sierra Nevada Conservancy. The authors would also like to thank the anonymous reviewers who helped strengthen the paper.

Conflicts of Interest

The authors declare no conflict of interest.

References

  1. Craw, D.; Upton, P.; Burridge, C.P.; Wallis, G.P.; Waters, J.M. Rapid biological speciation driven by tectonic evolution in New Zealand. Nat. Geosci. 2016, 9, 140–144. [Google Scholar] [CrossRef]
  2. Siepielski, A.M.; Morrissey, M.B.; Buoro, M.; Carlson, S.M.; Caruso, C.M.; Clegg, S.M.; Coulson, T.; DiBattista, J.; Gotanda, K.M.; Francis, C.D.; et al. Precipitation drives global variation in natural selection. Science 2017, 355, 959–962. [Google Scholar] [CrossRef] [PubMed] [Green Version]
  3. Naesset, E.; Orka, H.O.; Solberg, S.; Bollandsas, O.M.; Hansen, E.H.; Mauya, E.; Zahabu, E.; Malimbwi, R.; Chamuya, N.; Olsson, H.; et al. Mapping and estimating forest area and aboveground biomass in miombo woodlands in Tanzania using data from airborne laser scanning, TanDEM-X, RapidEye, and global forest maps: A comparison of estimated precision. Remote Sens. Environ. 2016, 175, 282–300. [Google Scholar] [CrossRef]
  4. White, J.C.; Coops, N.C.; Wulder, M.A.; Vastaranta, M.; Hilker, T.; Tompalski, P. Remote Sensing Technologies for Enhancing Forest Inventories: A Review. Can. J. Remote Sens. 2016, 42, 619–641. [Google Scholar] [CrossRef] [Green Version]
  5. Wulder, M.A.; White, J.C.; Nelson, R.F.; Naesset, E.; Orka, H.O.; Coops, N.C.; Hilker, T.; Bater, C.W.; Gobakken, T. Lidar sampling for large-area forest characterization: A review. Remote Sens. Environ. 2012, 121, 196–209. [Google Scholar] [CrossRef] [Green Version]
  6. Korpela, I.; Dahlin, B.; Schäfer, H.; Bruun, E.; Haapaniemi, F.; Honkasalo, J.; Ilvesniemi, S.; Kuutti, V.; Linkosalmi, M.; Mustonen, J. Single-tree forest inventory using lidar and aerial images for 3D treetop positioning, species recognition, height and crown width estimation. In Proceedings of the ISPRS Workshop on Laser Scanning and SilviLaser, Espoo, Finland, 12–14 September 2007; IAPRS, 2007; Volume XXXVI, Part 3/W52. pp. 227–233. [Google Scholar]
  7. Mei, C.; Durrieu, S. Tree crown delineation from digital elevation models and high resolution imagery. International Archives of the Photogrammetry, Remote Sensing and Spatial Information Sciences. Dir. Open Access J. 2004, 36, 3–6. [Google Scholar]
  8. Zhao, K.; Suarez, J.C.; Garcia, M.; Hu, T.; Wang, C.; Londo, A. Utility of multitemporal lidar for forest and carbon monitoring: Tree growth, biomass dynamics, and carbon flux. Remote Sens. Environ. 2018, 204, 883–897. [Google Scholar] [CrossRef]
  9. Nuijten, R.J.; Coops, N.C.; Goodbody, T.R.; Pelletier, G. Examining the Multi-Seasonal Consistency of Individual Tree Segmentation on Deciduous Stands Using Digital Aerial Photogrammetry (DAP) and Unmanned Aerial Systems (UAS). Remote Sens. 2019, 11, 739. [Google Scholar] [CrossRef] [Green Version]
  10. Lefsky, M.A.; Cohen, W.B.; Parker, G.G.; Harding, D.J. Lidar remote sensing for ecosystem studies. Bioscience 2002, 52, 19–30. [Google Scholar] [CrossRef]
  11. Chen, Q. Airborne lidar data processing and information extraction. Photogramm. Eng. Remote Sens. 2007, 73, 109. [Google Scholar]
  12. Csillik, O.; Cherbini, J.; Johnson, R.; Lyons, A.; Kelly, M. Identification of citrus trees from unmanned aerial vehicle imagery using convolutional neural networks. Drones 2018, 2, 39. [Google Scholar] [CrossRef] [Green Version]
  13. Jennings, S.B.; Brown, N.D.; Sheil, D. Assessing forest canopies and understorey illumination: Canopy closure, canopy cover and other measures. Forestry 1999, 72, 59–73. [Google Scholar] [CrossRef]
  14. Kelly, M.; Di Tommaso, S. Mapping forests with Lidar provides flexible, accurate data with many uses. Calif. Agric. 2015, 69, 14–20. [Google Scholar] [CrossRef]
  15. Koch, B.; Heyder, U.; Weinacker, H. Detection of individual tree crowns in airborne lidar data. Photogramm. Eng. Remote Sens. 2006, 72, 357–363. [Google Scholar] [CrossRef] [Green Version]
  16. Jakubowski, M.; Li, W.; Guo, Q.; Kelly, M. Delineating individual trees from LiDAR data: A comparison of vector-and raster-based segmentation approaches. Remote Sens. 2013, 5, 4163–4186. [Google Scholar] [CrossRef] [Green Version]
  17. Jing, L.; Hu, B.; Li, J.; Noland, T. Automated delineation of individual tree crowns from LiDAR data by multi-scale analysis and segmentation. Photogramm. Eng. Remote Sens. 2012, 78, 1275–1284. [Google Scholar] [CrossRef]
  18. Kaartinen, H.; Hyyppä, J.; Yu, X.; Vastaranta, M.; Hyyppä, H.; Kukko, A.; Holopainen, M.; Heipke, C.; Hirschmugl, M.; Morsdorf, F. An international comparison of individual tree detection and extraction using airborne laser scanning. Remote Sens. 2012, 4, 950–974. [Google Scholar] [CrossRef] [Green Version]
  19. Hyyppa, J.; Kelle, O.; Lehikoinen, M.; Inkinen, M. A segmentation-based method to retrieve stem volume estimates from 3-D tree height models produced by laser scanners. IEEE Trans. Geosci. Remote Sens. 2001, 39, 969–975. [Google Scholar] [CrossRef]
  20. Khosravipour, A.; Skidmore, A.K.; Isenburg, M.; Wang, T.; Hussin, Y.A. Generating Pit-free Canopy Height Models from Airborne Lidar. Photogramm. Eng. Remote Sens. 2014, 80, 863–872. [Google Scholar] [CrossRef]
  21. Lu, X.; Guo, Q.; Li, W.; Flanagan, J. A bottom-up approach to segment individual deciduous trees using leaf-off lidar point cloud data. ISPRS J. Photogramm. Remote Sens. 2014, 94, 1–12. [Google Scholar] [CrossRef]
  22. Chen, Q.; Baldocchi, D.; Gong, P.; Kelly, M. Isolating individual trees in a savanna woodland using small footprint lidar data. Photogramm. Eng. Remote Sens. 2006, 72, 923–932. [Google Scholar] [CrossRef] [Green Version]
  23. Smits, I.; Prieditis, G.; Dagis, S.; Dubrovskis, D. Individual tree identification using different LIDAR and optical imagery data processing methods. Biosyst. Inf. Technol. 2012, 1, 19–24. [Google Scholar] [CrossRef]
  24. Reitberger, J.; Schnörr, C.; Krzystek, P.; Stilla, U. 3D segmentation of single trees exploiting full waveform LIDAR data. ISPRS J. Photogramm. Remote Sens. 2009, 64, 561–574. [Google Scholar] [CrossRef]
  25. Li, W.; Guo, Q.; Jakubowski, M.K.; Kelly, M. A New Method for Segmenting Individual Trees from the Lidar Point Cloud. Photogramm. Eng. Remote Sens. 2012, 78, 75–84. [Google Scholar] [CrossRef] [Green Version]
  26. Hamraz, H.; Contreras, M.A.; Zhang, J. Vertical stratification of forest canopy for segmentation of understory trees within small-footprint airborne LiDAR point clouds. ISPRS J. Photogramm. Remote Sens. 2017, 130, 385–392. [Google Scholar] [CrossRef] [Green Version]
  27. Ayrey, E.; Fraver, S.; Kershaw, J.A., Jr.; Kenefic, L.S.; Hayes, D.; Weiskittel, A.R.; Roth, B.E. Layer Stacking: A Novel Algorithm for Individual Forest Tree Segmentation from LiDAR Point Clouds. Can. J. Remote Sens. 2017, 43, 16–27. [Google Scholar] [CrossRef]
  28. Duncanson, L.I.; Cook, B.D.; Hurtt, G.C.; Dubayah, R.O. An efficient, multi-layered crown delineation algorithm for mapping individual tree structure across multiple ecosystems. Remote Sens. Environ. 2014, 154, 378–386. [Google Scholar] [CrossRef]
  29. Tochon, G.; Feret, J.B.; Valero, S.; Martin, R.E.; Knapp, D.E.; Salembier, P.; Chanussot, J.; Asner, G.P. On the use of binary partition trees for the tree crown segmentation of tropical rainforest hyperspectral images. Remote Sens. Environ. 2015, 159, 318–331. [Google Scholar] [CrossRef] [Green Version]
  30. Paris, C.; Valduga, D.; Bruzzone, L. A hierarchical approach to three-dimensional segmentation of LiDAR data at single-tree level in a multilayered forest. IEEE Trans. Geosci. Remote Sens. 2016, 54, 4190–4203. [Google Scholar] [CrossRef]
  31. Leckie, D.; Gougeon, F.; Hill, D.; Quinn, R.; Armstrong, L.; Shreenan, R. Combined high-density lidar and multispectral imagery for individual tree crown analysis. Can. J. Remote Sens. 2003, 29, 633–649. [Google Scholar] [CrossRef]
  32. Pouliot, D.A.; King, D.J.; Pitt, D.G. Development and evaluation of an automated tree detection-delineation algorithm for monitoring regenerating coniferous forests. Can. J. For. Res. Rev. Can. Rech. For. 2005, 35, 2332–2345. [Google Scholar] [CrossRef] [Green Version]
  33. Wang, Y.; Hyyppä, J.; Liang, X.; Kaartinen, H.; Yu, X.; Lindberg, E.; Holmgren, J.; Qin, Y.; Mallet, C.; Ferraz, A. International benchmarking of the individual tree detection methods for modeling 3-D canopy structure for silviculture and forest ecology using airborne laser scanning. IEEE Trans. Geosci. Remote Sens. 2016, 54, 5011–5027. [Google Scholar] [CrossRef] [Green Version]
  34. Morsdorf, F.; Meier, E.; Kotz, B.; Itten, K.I.; Dobbertin, M.; Allgower, B. LIDAR-based geometric reconstruction of boreal type forest stands at single tree level for forest and wildland fire management. Remote Sens. Environ. 2004, 92, 353–362. [Google Scholar] [CrossRef]
  35. Sokolova, M.; Japkowicz, N.; Szpakowicz, S. Beyond accuracy, F-Score and ROC: A family of discriminant measures for performance evaluation. In Proceedings of the Ai 2006: Advances in Artificial Intelligence, Hobart, Australia, 4–8 December 2006; Sattar, A., Kang, B.H., Eds.; Springer: Berlin/Heidelberg, Germany, 2006; Volume 4304, pp. 1015–1021. [Google Scholar]
  36. Peuhkurinen, J.; Mehtätalo, L.; Maltamo, M. Comparing individual tree detection and the area-based statistical approach for the retrieval of forest stand characteristics using airborne laser scanning in Scots pine stands. Can. J. For. Res. 2011, 41, 583–598. [Google Scholar] [CrossRef]
  37. Falkowski, M.J.; Smith, A.M.S.; Gessler, P.E.; Hudak, A.T.; Vierling, L.A.; Evans, J.S. The influence of conifer forest canopy cover on the accuracy of two individual tree measurement algorithms using lidar data. Can. J. Remote Sens. 2008, 34, S338–S350. [Google Scholar] [CrossRef]
  38. Vauhkonen, J.; Ene, L.; Gupta, S.; Heinzel, J.; Holmgren, J.; Pitkanen, J.; Solberg, S.; Wang, Y.; Weinacker, H.; Hauglin, K.M.; et al. Comparative testing of single-tree detection algorithms under different types of forest. Forestry 2012, 85, 27–40. [Google Scholar] [CrossRef] [Green Version]
  39. Forzieri, G.; Guarnieri, L.; Vivoni, E.R.; Castelli, F.; Preti, F. Multiple attribute decision making for individual tree detection using high-resolution laser scanning. For. Ecol. Manag. 2009, 258, 2501–2510. [Google Scholar] [CrossRef]
  40. Flood, M. LiDAR activities and research priorities in the commercial sector. Int. Arch. Photogramm. Remote Sens. Spat. Inf. Sci. 2001, 34, 3–8. [Google Scholar]
  41. Smith, A.M.S.; Falkowski, M.J.; Hudak, A.T.; Evans, J.S.; Robinson, A.P.; Steele, C.M. A cross-comparison of field, spectral, and lidar estimates of forest canopy cover. Can. J. Remote Sens. 2009, 35, 447–459. [Google Scholar] [CrossRef]
  42. Isenburg, M. LAStools: Software for rapid LiDAR processing. Plaça Ferrater Mora 2014, 1, 17071. Available online: http://www. liblas. org/ (accessed on 23 August 2019).
  43. Zhao, X.; Su, Y.; Li, W.; Hu, T.; Liu, J.; Guo, Q. A Comparison of LiDAR Filtering Algorithms in Vegetated Mountain Areas. Can. J. Remote Sens. 2018, 44, 287–298. [Google Scholar] [CrossRef]
  44. Axelsson, P. Processing of laser scanner data—Algorithms and applications. ISPRS J. Photogramm. Remote Sens. 1999, 54, 138–147. [Google Scholar] [CrossRef]
  45. Meng, X.; Currit, N.; Zhao, K. Ground filtering algorithms for airborne LiDAR data: A review of critical issues. Remote Sens. 2010, 2, 833–860. [Google Scholar] [CrossRef] [Green Version]
  46. Guo, Q.; Li, W.; Yu, H.; Alvarez, O. Effects of Topographic Variability and Lidar Sampling Density on Several DEM Interpolation Methods. Photogramm. Eng. Remote Sens. 2010, 76, 701–712. [Google Scholar] [CrossRef] [Green Version]
  47. Lee, H.; Slatton, K.C.; Roth, B.E.; Cropper, W.P., Jr. Adaptive clustering of airborne LiDAR data to segment individual tree crowns in managed pine forests. Int. J. Remote Sens. 2010, 31, 117–139. [Google Scholar] [CrossRef]
  48. Nyquist, H. Certain topics in telegraph transmission theory. Trans. Am. Inst. Electr. Eng. 1928, 47, 617–644. [Google Scholar] [CrossRef]
  49. Soille, P. Morphological Image Analysis: Principles and Applications; Springer Science & Business Media: Berlin, Germany, 2013. [Google Scholar]
  50. Pitkänen, J.; Maltamo, M.; Hyyppä, J.; Yu, X. Adaptive methods for individual tree detection on airborne laser based canopy height model. Int. Arch. Photogramm. Remote Sens. Spat. Inf. Sci. 2004, 36, 187–191. [Google Scholar]
  51. Goutte, C.; Gaussier, E. A probabilistic interpretation of precision, recall and F-score, with implication for evaluation. In Advances in Information Retrieval, Proceedings of the European Conference on Information Retrieval, Spain, 21–23 March 2005; Losada, D.E., FernandezLuna, J.M., Eds.; Springer: Berlin/Heidelberg, Germany, 2005; Volume 3408, pp. 345–359. [Google Scholar]
  52. Chen, J.M.; Pavlic, G.; Brown, L.; Cihlar, J.; Leblanc, S.; White, H.; Hall, R.; Peddle, D.; King, D.; Trofymow, J. Derivation and validation of Canada-wide coarse-resolution leaf area index maps using high-resolution satellite imagery and ground measurements. Remote Sens. Environ. 2002, 80, 165–184. [Google Scholar] [CrossRef]
  53. Ma, Q.; Su, Y.; Guo, Q. Comparison of Canopy Cover Estimations From Airborne LiDAR, Aerial Imagery, and Satellite Imagery. IEEE J. Sel. Top. Appl. Earth Obs. Remote Sens. 2017, 10, 4225–4236. [Google Scholar] [CrossRef]
  54. Johnson, J.W. A heuristic method for estimating the relative weight of predictor variables in multiple regression. Multivar. Behav. Res. 2000, 35, 1–19. [Google Scholar] [CrossRef]
  55. Dralle, K.; Rudemo, M. Stem number estimation by kernel smoothing of aerial photos. Can. J. For. Res. 1996, 26, 1228–1236. [Google Scholar] [CrossRef]
  56. Persson, A.; Holmgren, J.; Soderman, U. Detecting and measuring individual trees using an airborne laser scanner. Photogramm. Eng. Remote Sens. 2002, 68, 925–932. [Google Scholar]
  57. Magnussen, S.; Eggermont, P.; LaRiccia, V.N. Recovering Tree Heights from Airborne Laser Scanner Data. For. Sci. 1999, 45, 407–422. [Google Scholar]
  58. Zheng, G.; Moskal, L.M. Computational-Geometry-Based Retrieval of Effective Leaf Area Index Using Terrestrial Laser Scanning. IEEE Trans. Geosci. Remote Sens. 2012, 50, 3958–3969. [Google Scholar] [CrossRef]
  59. Maltamo, M.; Mustonen, K.; Hyyppä, J.; Pitkänen, J.; Yu, X. The accuracy of estimating individual tree variables with airborne laser scanning in a boreal nature reserve. Can. J. For. Res. 2004, 34, 1791–1801. [Google Scholar] [CrossRef]
  60. Falkowski, M.J.; Smith, A.M.S.; Hudak, A.T.; Gessler, P.E.; Vierling, L.A.; Crookston, N.L. Automated estimation of individual conifer tree height and crown diameter via two-dimensional spatial wavelet analysis of lidar data. Can. J. Remote Sens. 2006, 32, 153–161. [Google Scholar] [CrossRef] [Green Version]
  61. Zawawi, A.A.; Shiba, M.; Jemali, N.J.N. Accuracy of LiDAR-based tree height estimation and crown recognition in a subtropical evergreen broad-leaved forest in Okinawa, Japan. For. Syst. 2015, 24, 1–11. [Google Scholar] [CrossRef]
  62. Magnussen, S.; Boudewyn, P. Derivations of stand heights from airborne laser scanner data with canopy-based quantile estimators. Can. J. For. Res. 1998, 28, 1016–1031. [Google Scholar] [CrossRef]
  63. Ozdemir, I.; Norton, D.A.; Ozkan, U.Y.; Mert, A.; Senturk, O. Estimation of Tree Size Diversity Using Object Oriented Texture Analysis and Aster Imagery. Sensors (Basel) 2008, 8, 4709–4724. [Google Scholar] [CrossRef] [Green Version]
  64. Alteyrac, J.; Cloutier, A.; Zhang, S.Y. Characterization of juvenile wood to mature wood transition age in black spruce (Picea mariana (Mill.) BSP) at different stand densities and sampling heights. Wood Sci. Technol. 2006, 40, 124–138. [Google Scholar] [CrossRef]
  65. Jung, S.E.; Kwak, D.A.; Park, T.; Lee, W.K.; Yoo, S. Estimating Crown Variables of Individual Trees Using Airborne and Terrestrial Laser Scanners. Remote Sens. 2011, 3, 2346–2363. [Google Scholar] [CrossRef] [Green Version]
  66. Stonge, B.A.; Cavayas, F. Estimating forest stand structure from high resolution imagery using the directional variogram. Int. J. Remote Sens. 1995, 16, 1999–2021. [Google Scholar] [CrossRef]
  67. Graves, S.J.; Caughlin, T.T.; Asner, G.P.; Bohlman, S.A. A tree-based approach to biomass estimation from remote sensing data in a tropical agricultural landscape. Remote Sens. Environ. 2018, 218, 32–43. [Google Scholar] [CrossRef]
  68. García, M.; Gajardo, J.; Riaño, D.; Zhao, K.; Martín, P.; Ustin, S. Canopy clumping appraisal using terrestrial and airborne laser scanning. Remote Sens. Environ. 2015, 161, 78–88. [Google Scholar] [CrossRef]
  69. Mehtätalo, L. Eliminating the effect of overlapping crowns from aerial inventory estimates. Can. J. For. Res. 2006, 36, 1649–1660. [Google Scholar] [CrossRef]
Figure 1. Location of the study areas and plots in (d) conifer forest in California, (e) broadleaf forest and (f) mixed forest in Pennsylvania. Examples of National Agriculture Imagery Program (NAIP) imagery at 1 m resolution of (a) conifer forest, (b) broadleaf forest, and (c) mixed forest in the study area.
Remotesensing 11 02880 g001
Figure 2. (a) The 3D view of the raw point cloud in a plot, (b) the top view of the raw point cloud, and the (c) manually delineated individual trees overlaid on the pit-free canopy height model.
Remotesensing 11 02880 g002
Figure 3. The general workflow of the proposed study. Note that CHM-based/CHM, pit-free CHM-based/PFCHM, point cloud-based/PCS, and layer stacking seed point-based/LSS represent the four individual segmentation algorithms used in this study. LAI and CVTH represent leaf area index and the coefficient of variation of tree height. OA represents overall accuracy.
Remotesensing 11 02880 g003
Figure 4. The individual tree segmentation results of (a) CHM, (b) PFCHM, (c) PCS, and (d) LSS in a coniferous plot.
Remotesensing 11 02880 g004
Figure 5. Accuracy comparison of the four segmentation methods in (a) conifer, (b) broadleaf, and (c) mixed forests.
Remotesensing 11 02880 g005
Figure 6. The relative weights of all vegetation characteristics on segmentation in (a) conifer, (b) broadleaf, and (c) mixed forests. CC and TD represent canopy cover and tree density.
Remotesensing 11 02880 g006
Figure 7. The accuracy of the four individual tree segmentation methods varied with the four vegetation characteristic variables in the three forest types. The blue, red, yellow, and green bars represent CHM, PFCHM, PCS, and LSS, respectively, and the three levels of vegetation characteristics (shown in Table 3) increase from left to right in each color bar.
Remotesensing 11 02880 g007
Figure 8. Tree density of two typical plots: (a) 400 trees/ha and (b) 680 trees/ha.
Remotesensing 11 02880 g008
Table 1. Accuracies of different individual tree segmentation methods listed in the literature.
AlgorithmReferenceVegetation TypePoint Density (pts/m2)Accuracy (%)Evaluation Method
Region growing aHyyppä et al. (2001) [19]Conifer8–10--
Pouring aKoch et al. (2006) [15]Conifer, Broadleaf5/1062MARA
Watershed aJing et al. (2012) [17]Conifer, Broadleaf4569C, O
Marker-controlled Watershed aChen et al. (2006) [22]Conifer9.564AATI
Local maxima aSmits et al. (2012) [23]Conifer, Broadleaf987.50D
Pit-free canopy height model/PFCHM aKhosravipour et al. (2014) [20]Conifer, Broadleaf16074AI
Normalized cut bReitberger et al. (2009) [24]Conifer, Broadleaf25/1066-
Point cloud segmentation bLi et al. (2012) [25]Conifer690F-score
Bottom-up region growing bLu et al. (2014) [21]Broadleaf10.2884F-score
Region growing bHamraz et al. (2017) [26]Broadleaf25/1.5--
Layer stacking bAyrey et al. (2017) [27]Conifer, Broadleaf21/6/572D, C, O
Iterative watershed bDuncanson et al. (2014) [28]Broadleaf1870-
Watershed + k-means bTochon et al. (2015) [29]Conifer, Broadleaf-69.86D, US, M, OS
Hierarchical approach bParis et al. (2016) [30]Conifer (Multilayer)50/892–97D, C, O
Note that “-” means that information was not available. a The segmentation methods are based on a CHM grid. b Point cloud-based methods. MARA: manual to automated recognition accuracy [31]; AATI: comparison of the overlay area of the segment crown polygon and reference crown polygon; AI: accuracy index = ((n – O + C)/n) × 100 [32]; D: detection; C: commission; O: omission; OA: over accuracy; US: under segmented; M: missed; OS: over segmented.
Table 2. Vegetation characteristics for each plot in the study area.
Forest TypeLeaf Area Index (LAI)Canopy Cover (%)Tree Density (Trees/ha)Coefficient of Variation of Tree Height (CVTH)
MaximumMinimumMeanSDMaximumMinimumMeanSDMaximumMinimumMeanSDMaximumMinimumMeanSD
Conifer2.410.141.250.540.790.070.600.185201003141131.190.210.470.17
Broadleaf4.590.322.660.440.960.450.820.0743985278730.700.060.230.14
Mixed4.510.613.400.380.970.690.900.03538255397740.500.050.180.11
Table 3. The division of the vegetation characteristic levels in three forest types based on LAI, canopy cover, tree density, and CVTH.
Forest TypeLAICanopy Cover (%)Tree Density (Trees/ha)CVTH
Level 1Level 2Level 3Level 1Level 2Level 3Level 1Level 2Level 3Level 1Level 2Level 3
Conifer<11–1.7>1.7<0.30.3–0.55>0.55<240240–360>3600.50.5–0.80.8
Broadleaf<22–3.2>3.2<0.650.65–0.85>0.85<226226–325>3250.20.2–0.30.3
Mixed<2.72.7–3.6>3.6<0.80.8–0.9>0.9<254254–439>4390.20.2–0.30.3
Table 4. Accuracy of each segmentation method in different forest types.
Forest TypeCHMPFCHMPCSLSS
F-ScoreOAF-ScoreOAF-ScoreOAF-ScoreOA
Conifer0.800.820.880.900.820.830.840.86
Broadleaf0.780.780.800.830.680.790.760.80
Mixed0.790.790.850.870.770.820.800.83
Table 5. Interpretation rate (R2) of the vegetation characteristics for the different segmentation models.
Forest TypeCHMPFCHMPCSLSS
Conifer0.300.200.130.34
Broadleaf0.190.070.490.36
Mixed0.480.560.500.29

