High-Throughput Phenotyping of Indirect Traits for Early-Stage Selection in Sugarcane Breeding


1
Sugar Research Australia, 30962 Bruce Highway, Brandon, QLD 4808, Australia
2
Sugarcane Research Institute, Guangxi Academy of Agricultural Sciences, Nanning 530007, China
3
Interdisciplinary Research Center for Agriculture Green Development in Yangtze River Basin (CAGD), College of Resources and Environment, Southwest University, Chongqing 400715, China
4
Sugar Research Australia, 50 Meiers Road, Indooroopilly, QLD 4068, Australia
*
Authors to whom correspondence should be addressed.
Remote Sens. 2019, 11(24), 2952; https://doi.org/10.3390/rs11242952
Submission received: 30 October 2019
/
Revised: 26 November 2019
/
Accepted: 6 December 2019
/
Published: 10 December 2019
(This article belongs to the Special Issue High-Throughput Phenotyping of Crop Traits: Progresses, Opportunities, and Challenges)
Abstract
:One of the major limitations for sugarcane genetic improvement is the low heritability of yield in the early stages of breeding, mainly due to confounding inter-plot competition effects. In this study, we investigate an indirect selection index (Si), developed based on traits correlated to yield (indirect traits) that were measured using an unmanned aerial vehicle (UAV), to improve clonal assessment in early stages of sugarcane breeding. A single-row early-stage clonal assessment trial, involving 2134 progenies derived from 245 crosses, and a multi-row experiment representative of pure-stand conditions, with an unrelated population of 40 genotypes, were used in this study. Both experiments were screened at several stages using visual, multispectral, and thermal sensors mounted on a UAV for indirect traits, including canopy cover, canopy height, canopy temperature, and normalised difference vegetation index (NDVI). To construct the indirect selection index, phenotypic and genotypic variance-covariances were estimated in the single-row and multi-row experiment, respectively. Clonal selection from the indirect selection index was compared to single-row yield-based selection. Ground observations of stalk number and plant height at six months after planting made from a subset of 75 clones within the single-row experiment were highly correlated to canopy cover (rg = 0.72) and canopy height (rg = 0.69), respectively. The indirect traits had high heritability and strong genetic correlation with cane yield in both the single-row and multi-row experiments. Only 45% of the clones were common between the indirect selection index and single-row yield based selection, and the expected efficiency of correlated response to selection for pure-stand yield based on indirect traits (44%–73%) was higher than that based on single-row yield (45%). These results highlight the potential of high-throughput phenotyping of indirect traits combined in an indirect selection index for improving early-stage clonal selections in sugarcane breeding.
1. Introduction
A long breeding cycle and slow rate of genetic improvement are constraining the development of improved sugarcane varieties to meet the rising demand for sucrose and bioenergy around the world. Indeed, in the past few decades, genetic gain in sugarcane yield and sucrose content appears to have stagnated across most sugarcane breeding programs [1,2]. The principal objective of breeding programs worldwide is to deliver productive, sustainable, and profitable varieties to maximise the economic returns. Development of new sugarcane varieties is resources intense and time-consuming, taking 12–14 years from crossing to variety release. Typically, sugarcane breeding programs rely on end-of-season yield alone for clonal selections because measuring growth at different stages of crop cycle is not feasible using conventional approaches. High-throughput phenotyping using unmanned aerial vehicles (UAV) and remote sensors provides an opportunity to overcome the phenotyping bottlenecks in traditional breeding programs [3]. They may bring about a step-change in genetic gain by improving the efficiency and effectiveness of clonal selection systems by shifting the traditional plant phenotyping paradigm that is labour intensive and relatively low accuracy, especially at early stages of selection, to an approach that is more comprehensive, high-throughput, and accurate [4].
Among the several challenges, one of the main constraints of traditional breeding programs is the low heritability of yield in the early stages of selection and its poor genetic correlation with yield in pure-stand [5]. In early-stage selection, small plots with one or two rows are typically used to maximise the sampling for population size [6]. Limitations in estimating true yield potential of clones in the early stages of breeding due to large inter-plot competition have long been recognised [7,8]. Results from studies of inter-plot competition demonstrate that large variance associated with between-genotype competition can significantly bias early generation selection in small plots [5]. Significant competition effects were observed among sugarcane families grown in single-row plots with the suggestion that 10% of families might be overlooked if not accounted for competition effects [9]. Statistical models to quantify the bias caused by competition in single-row plot trials to improve the efficiency of selection have been suggested [10,11]. However, they do not account for all the competition effects, particularly when evaluating the yield of a genetically diverse population with limited replications and do not explain the physical or biological causes. The large residual error variation, compared to genetic variation, associated with limited replications and inter-plot competition in the early stage of sugarcane breeding trials, reduces the accuracy and efficiency of selection.
Sugarcane breeding could be greatly accelerated if yield potential can be quantitatively assessed during early growth prior to the onset of inter-plot competition effects. One approach to improve the prediction of yield potential in early stages of selection is by either complementing or substituting yield measured at harvest with yield-correlated indirect traits measured over multiple time points during the growing season. Rebetzke et al. [12] considered early-stage plant vigour via larger specific leaf area as an indirect selection target in wheat, and more recently, Kipp et al. [13] and Duan et al. [14] reported a high-throughput scoring method for early vigour using visual images that may improve wheat selections at early growth stage. Further, a strong correlation of sugarcane stalk population and yield with normalised difference vegetation index (NDVI) and reflectance at specific wavelengths was reported, suggesting that canopy reflectance measurements at the early growth stage can be used as a screening tool to estimate yield potential [15]. In maize, combining data from 62 wavebands and vegetation indices measured across multiple times using aerial phenotyping lead to an increase in prediction accuracy compared with using single-time-point data [16].
The ability to quantitatively assess adaptive mechanisms and traits driven by variable water environments offers significant value for selection programs [17,18]. In sugarcane, the importance of specific physiological traits, such as stomatal conductance [18], canopy temperature [19], and transpiration efficiency [20,21], from a breeding perspective have been discussed in the past [22]. Extensive measurements of canopy conductance, the product of leaf area and stomatal conductance, in sugarcane made during the early growth stage (2–6 months) had a range of genetic correlation (rg: −0.29 to 0.94) with average cane yield in multi-row plots across multiple environments [18]. The broad-sense heritability of canopy conductance was relatively high (H2b: 0.8 to 0.9, in some environments), which makes it a good yield predictor in early-stage sugarcane breeding trials when plot yield from small plots itself has low heritability and poor genetic correlation with yield in pure-stand conditions. Canopy temperature, a surrogate trait for canopy conductance, has been previously monitored in sugarcane, and it showed a significant genotypic variation and a strong negative genetic correlation with biomass [19,23].
Selection based on a linear combination of indirect traits that are less affected by inter-plot competition effects and that have high covariance with cane yield will likely improve prediction of the true genetic value of clones in early-stage selections. This is because cane yield estimation in small plots in early-stage selection trials can be biased and prone to inter-plot competition effects, as described above. A selection index is designed to put together information in an optimal way to enable selection of individuals likely to have the highest overall performance for the traits of interest. Implications of applying a multi-traits indirect selection index have been studied and reviewed extensively in cereals [24]. In sugarcane, Yang et al. [25] provided a theoretical assessment of applying a multi-trait selection system in conventional breeding in China and predicted their value across the production chain. However, optimal selection indices based on indirect traits are not widely applied in breeding programs, partly due to the practical difficulties in measuring multiple traits from a large number of clones in large-scale breeding programs.
In recent years, rapid advances in field-based high-throughput phenotyping have enabled precise and rapid measurement of multiple traits in breeding programs that would otherwise be impractical using traditional approaches [26]. Unmanned aerial vehicles fitted with remote sensors are affordable and are becoming an increasingly crucial component of plant phenotyping for crop production and crop improvement [27]. The operational cost of a UAV is much lower than manned aircraft, satellites, or manual data collection, and it allows information collection from all crop stages, unlike ground vehicles that are inoperable after 3–4 months of crop growth in sugarcane. To our knowledge, little or no previous assessment has been done on the potential use of UAV-based high-throughput phenotyping for improving sugarcane clone selection in breeding and related activities.
The objective of this study was to evaluate the potential of indirect traits, viz. canopy height, canopy cover, NDVI, and canopy temperature, measured using UAV-based high-throughput phenotyping to assess clonal performance in early-stage sugarcane selection trials. We demonstrate that high-throughput UAV-based field phenotyping is a potentially effective strategy to overcome certain barriers of genetic gain in conventional sugarcane breeding.
2. Materials and Methods
In this study, multiple sensors mounted on a UAV were used to monitor an early stage single-row experiment and a multi-row experiment representative of pure-stand conditions on multiple occasions for the indirect traits canopy height, canopy cover, NDVI, and canopy temperature. Heritability of the indirect traits were estimated in both experiments, and genetic correlation of the indirect traits with single-row and multi-row yield was estimated. An indirect selection index was developed using phenotypic variance-covariance of the traits estimated in the single-row experiment, and genetic covariance of indirect traits with the trait of economic value, i.e., pure-stand yield, in the multi-row experiment. The clones that were likely to be selected using the indirect selection index and the single-row yield-based selection were compared. Finally, correlated response to selection for pure-stand yield based on indirect selection index and single-row yield were estimated. In addition, indirect traits and yield of the potential selections were compared with known commercially-grown standard cultivars to investigate their relative value in environments with different water availability. These are detailed in the following sections.
2.1. Single-Row Experiment
This experiment was carried out within the Sugar Research Australia (SRA) regional breeding program in Burdekin, Queensland, Australia (19°34.0926′ S 147°19.3842′ E). A stage 2 variety selection trial, termed clonal assessment trial, was established with 2134 clones in August 2016. The clones were vegetatively propagated and planted using a whole stick planter in 6 m single-row plots with a row-spacing of 1.52 m and plots within a row separated by 0.5 m. Two replicates of each clone were in a randomised complete block design. Regional sugar industry best management practices were followed for irrigation, fertiliser applications, and weed and pest control. The experiment received 0.5 ML/ha of water at each irrigation event through furrows at approximately three-week intervals. To obtain cane yield, each single-row plot was harvested (single-row yield) with a commercial harvester and weighed using an electronic weigh bin in September 2017. The harvested crop was ratooned (regrown from the crop stubble for the next crop cycle) twice. Weather data for the growing period was obtained from a ‘Bureau of Meteorology’ weather station approx. 8 km away from the field experiment (longpaddock.qld.gov.au/silo/).
2.2. Multi-Row Experiment
A four-row field experiment was established in July 2017 with a population of 40 genetically diverse genotypes containing both commercial and unselected clones in 3 replicates in a randomised block design; an unselected clone and 4 commercial genotypes were in common with the single-row experiment. Each experimental plot was 11 m long and 4 rows wide with a row spacing of 1.52 m and plot spacing of 0.5 m. This experiment was also located in Burdekin (19°35.9485′ S 147°18.0538′ E) and was maintained like the single-row experiment. In July 2018, the middle two rows of each plot were mechanically harvested to estimate pure-stand yield [7].
2.3. Ground-Truthing
A sub-population of 75 clones in two replications (150 plots) within the single-row experiment was used for comparing manual measurements of plant height, stalk number, and early biomass with UAV estimates. Manual and UAV data were collected simultaneously from the sub-population in February 2017, approximately six months after planting.
Early biomass was determined by harvesting a sub-sample of 6 stalks from each plot, partitioned to leaf and stem portions and dried in an oven at 60 °C until constant weight. The product of total leaf and stem dry weights and the number of stalks per plot was calculated to estimate early biomass per plot.
Stalk number, an important yield determining trait in sugarcane [28], was manually counted in each 6 m plot of the sub-population. Plant height was measured manually using a ruler in a sub-sample of 4 plants per plot in the sub-population.
2.4. UAV Mission
A customised quadcopter (DJI Matrice 100) with a flight time of 15 min and a payload capacity of approx. 1.2 kg was used. Date and time, height, and ground sampling distance (GSD) of each UAV flight is shown in Table 1. Sixteen flights were conducted in the single-row experiment from November 2016 to December 2018, involving a plant crop and two ratoon crops. In the multi-row experiment, three flights were conducted at the 4- and 6-months stage in the plant crop, which provided data for estimating early-stage indirect traits genetic correlation with the pure-stand yield.
Multispectral images were captured using a five narrow-band camera (MicaSense, Inc., USA); the bands centred at 475 nm, 560 nm, 668 nm, 717 nm, and 840 nm corresponding to the blue, green, red, red edge, and near-infrared (NIR) regions, respectively. Images of a calibration panel captured before and after each flight along with a sun irradiance sensor mounted on the UAV were used for calibrating multispectral images. Thermal images were captured using a FLIR TAU2 640 (13 mm) camera that captures images in the long-wave infrared region (7.5 µm to 13.5 µm) at a resolution of 640 × 512 pixels. The camera was integrated with a capture board (TeAx ThermalCapture, Germany) that records and stores temperature and location data onto a removable flash memory card on-board the UAV as well as perform automatic flat-field corrections. The UAV was customised to carry two cameras at a time; therefore, in each flight, visual and either multispectral or thermal images were captured simultaneously.
The UAV was programmed to fly autonomously along a pre-defined single grid path controlled by a ground control station. The UAV mission plan was optimised by varying flight height and speed in order to capture the experimental area within the 15 min flight time, with a GSD less than 5 and 8 cm for the multispectral and thermal camera, respectively, and a minimum overlap of 80% in both X and Y directions. The multispectral and visual cameras captured images at one-second intervals while the thermal camera acquired video at a rate of 9 Hz.
To geo-rectify the images, 6 highly visible ground control points (GCP) were placed in the corners of the experimental block. Coordinates of the GCP were obtained using a global navigation satellite systems (GNSS) receiver connected to a correction network (HxGN SmartNet, Australia) for receiving horizontal and vertical position accuracy of less than 2 cm.
2.5. Image Processing
Individual thermal images were extracted from the thermal video after applying a thermal drift compensation and non-uniformity correction following manufacture instructions (TeAX Technology, Germany). Thermal, multispectral, and visual images were triangulated and mosaicked using a photogrammetric software (Pix4dMapper, Switzerland) based on the structure from motion algorithm to generate an orthomosaic of the experimental field. The orthomosaic images were geo-rectified using the GCP captured within the experimental block.
A digital terrain model (DTM) of bare earth was generated from visual imagery of the first flight after planting, and a digital surface model (DSM) was generated for each flight from visual imagery in Pix4dMapper. Canopy height at each flight was estimated as the difference in DSM to the average DTM.
Canopy cover was estimated from the visual orthomosaic by classifying the orthomosaic to vegetation, soil, and other background using the support vector machine (SVM) algorithm in ENVI 5.5 (Exelis Visual Information Solutions, Boulder, Colorado). In this method, vegetation and background pixels on the visual orthomosaic were specified manually to train the algorithm, and subsequently, all pixels in the orthomosaic were segmented into vegetation and background.
Spectral index NDVI was calculated from the 5 band multispectral images using the NIR and red band reflectance, as shown in Equation (1).
To estimate canopy temperature, the temperature of pixels corresponding to the classified vegetation pixels were extracted from the thermal orthomosaic, and subsequently, Otsu thresholding was applied to remove any mixed pixels (pixels with both vegetation and background) [29].
Individual plot boundaries were identified on the orthomosaic by segmenting the experimental field into regularly shaped plot polygons along with a buffer around the plots to minimise neighbouring plot edge effects based on a supplied field experimental design, similar to the method described in Haghighattalab et al. [30]. Mean and other zonal statistics from each plot polygon were extracted from the underlying orthomosaic. The segmentation and zonal statistics operations were performed in R [31].
2.6. Statistical Analysis
Variance and covariance of all traits were estimated using restricted maximum likelihood (REML) method in the lme4 package in R [32]. The following statistical model was used to partition the variance components:
where Yij is the observed value of the ith genotype in jth block; μ is the mean of observations; gi is the effect of the ith genotype; bj is the effect of jth block, and eij is experimental error. Best linear unbiased predictors (BLUP) were estimated for each trait and genotype from the model in Equation (2) using the ‘ranef’ (random effect) command in the lme4 package [32].
Yij = μ + gi + bj + eij
The genetic coefficient of variation (GCV %) was calculated as:
where σg is the square root of genetic variance, and is the mean.
Genetic and error variances were estimated, and broad-sense heritability (H2b) from the genotype plot means was estimated for each of the measurements, as described by Fehr [33]:
where σ2g and σ2e are genetic and error variances, and nr is the number of replications.
Genetic correlations between traits were estimated using the method in Kempthorne [34]:
where Covg(xy) is the genetic covariance of the two traits (x and y), and σ2gx and σ2gy are the genetic variances of the two traits, x and y, respectively.
2.7. Selection Methods
Two sets of clones were selected from the single-row experiment based on: 1) single-row yield and 2) indirect selection index. The indirect selection index (Si) was developed based on the selection index theory, as described in Wei et al. [35].
where Xi is the phenotypic values of traits estimated in the single-row experiment, and bi is the index coefficients of traits that were estimated by the following equation in matrix form.
where P−1 is an inverse matrix of the phenotypic variance-covariance of indirect traits in the single-row experiment, and G is a genetic covariance matrix between the indirect traits and pure-stand yield in the multi-row experiment. To construct G, genetic correlation of indirect traits under pure-stand conditions with yield in pure-stand were obtained from the multi-row experiment, while, Jackson and McRae [5] had previously determined 0.49 as the genetic correlation of single-row yield with pure-stand yield.
Si = b1X1 + b2X2 + …. bnXn
b = P−1G
2.8. Response to Selection
The efficiency of indirect selection (CRx/Rx) was estimated according to Falconer and Mackay [36]. Expected response to selection (Rx) is the genetic improvement of a trait in response to selection upon that trait itself:
where h2x and σx are the heritability, and phenotypic standard deviation for the trait, respectively.
Rx = h2x σx
Correlated response (CRx) is the genetic improvement of a target trait in response to selection of an indirectly associated trait:
where hx and hy are the square roots of the heritability of the target and indirect trait, respectively, rgxy is the genetic correlation between the two traits, and σx is the phenotypic standard deviation for the target trait. In the estimation of these parameters, the selection differential (i) was considered unity and ignored.
CRx = hx hy rgxy σx
Subsequently, relative efficiency of indirect selection (CRx/Rx) was estimated as:
CRx/Rx = hy rgxy/hx.
2.9. Principal Component Analysis
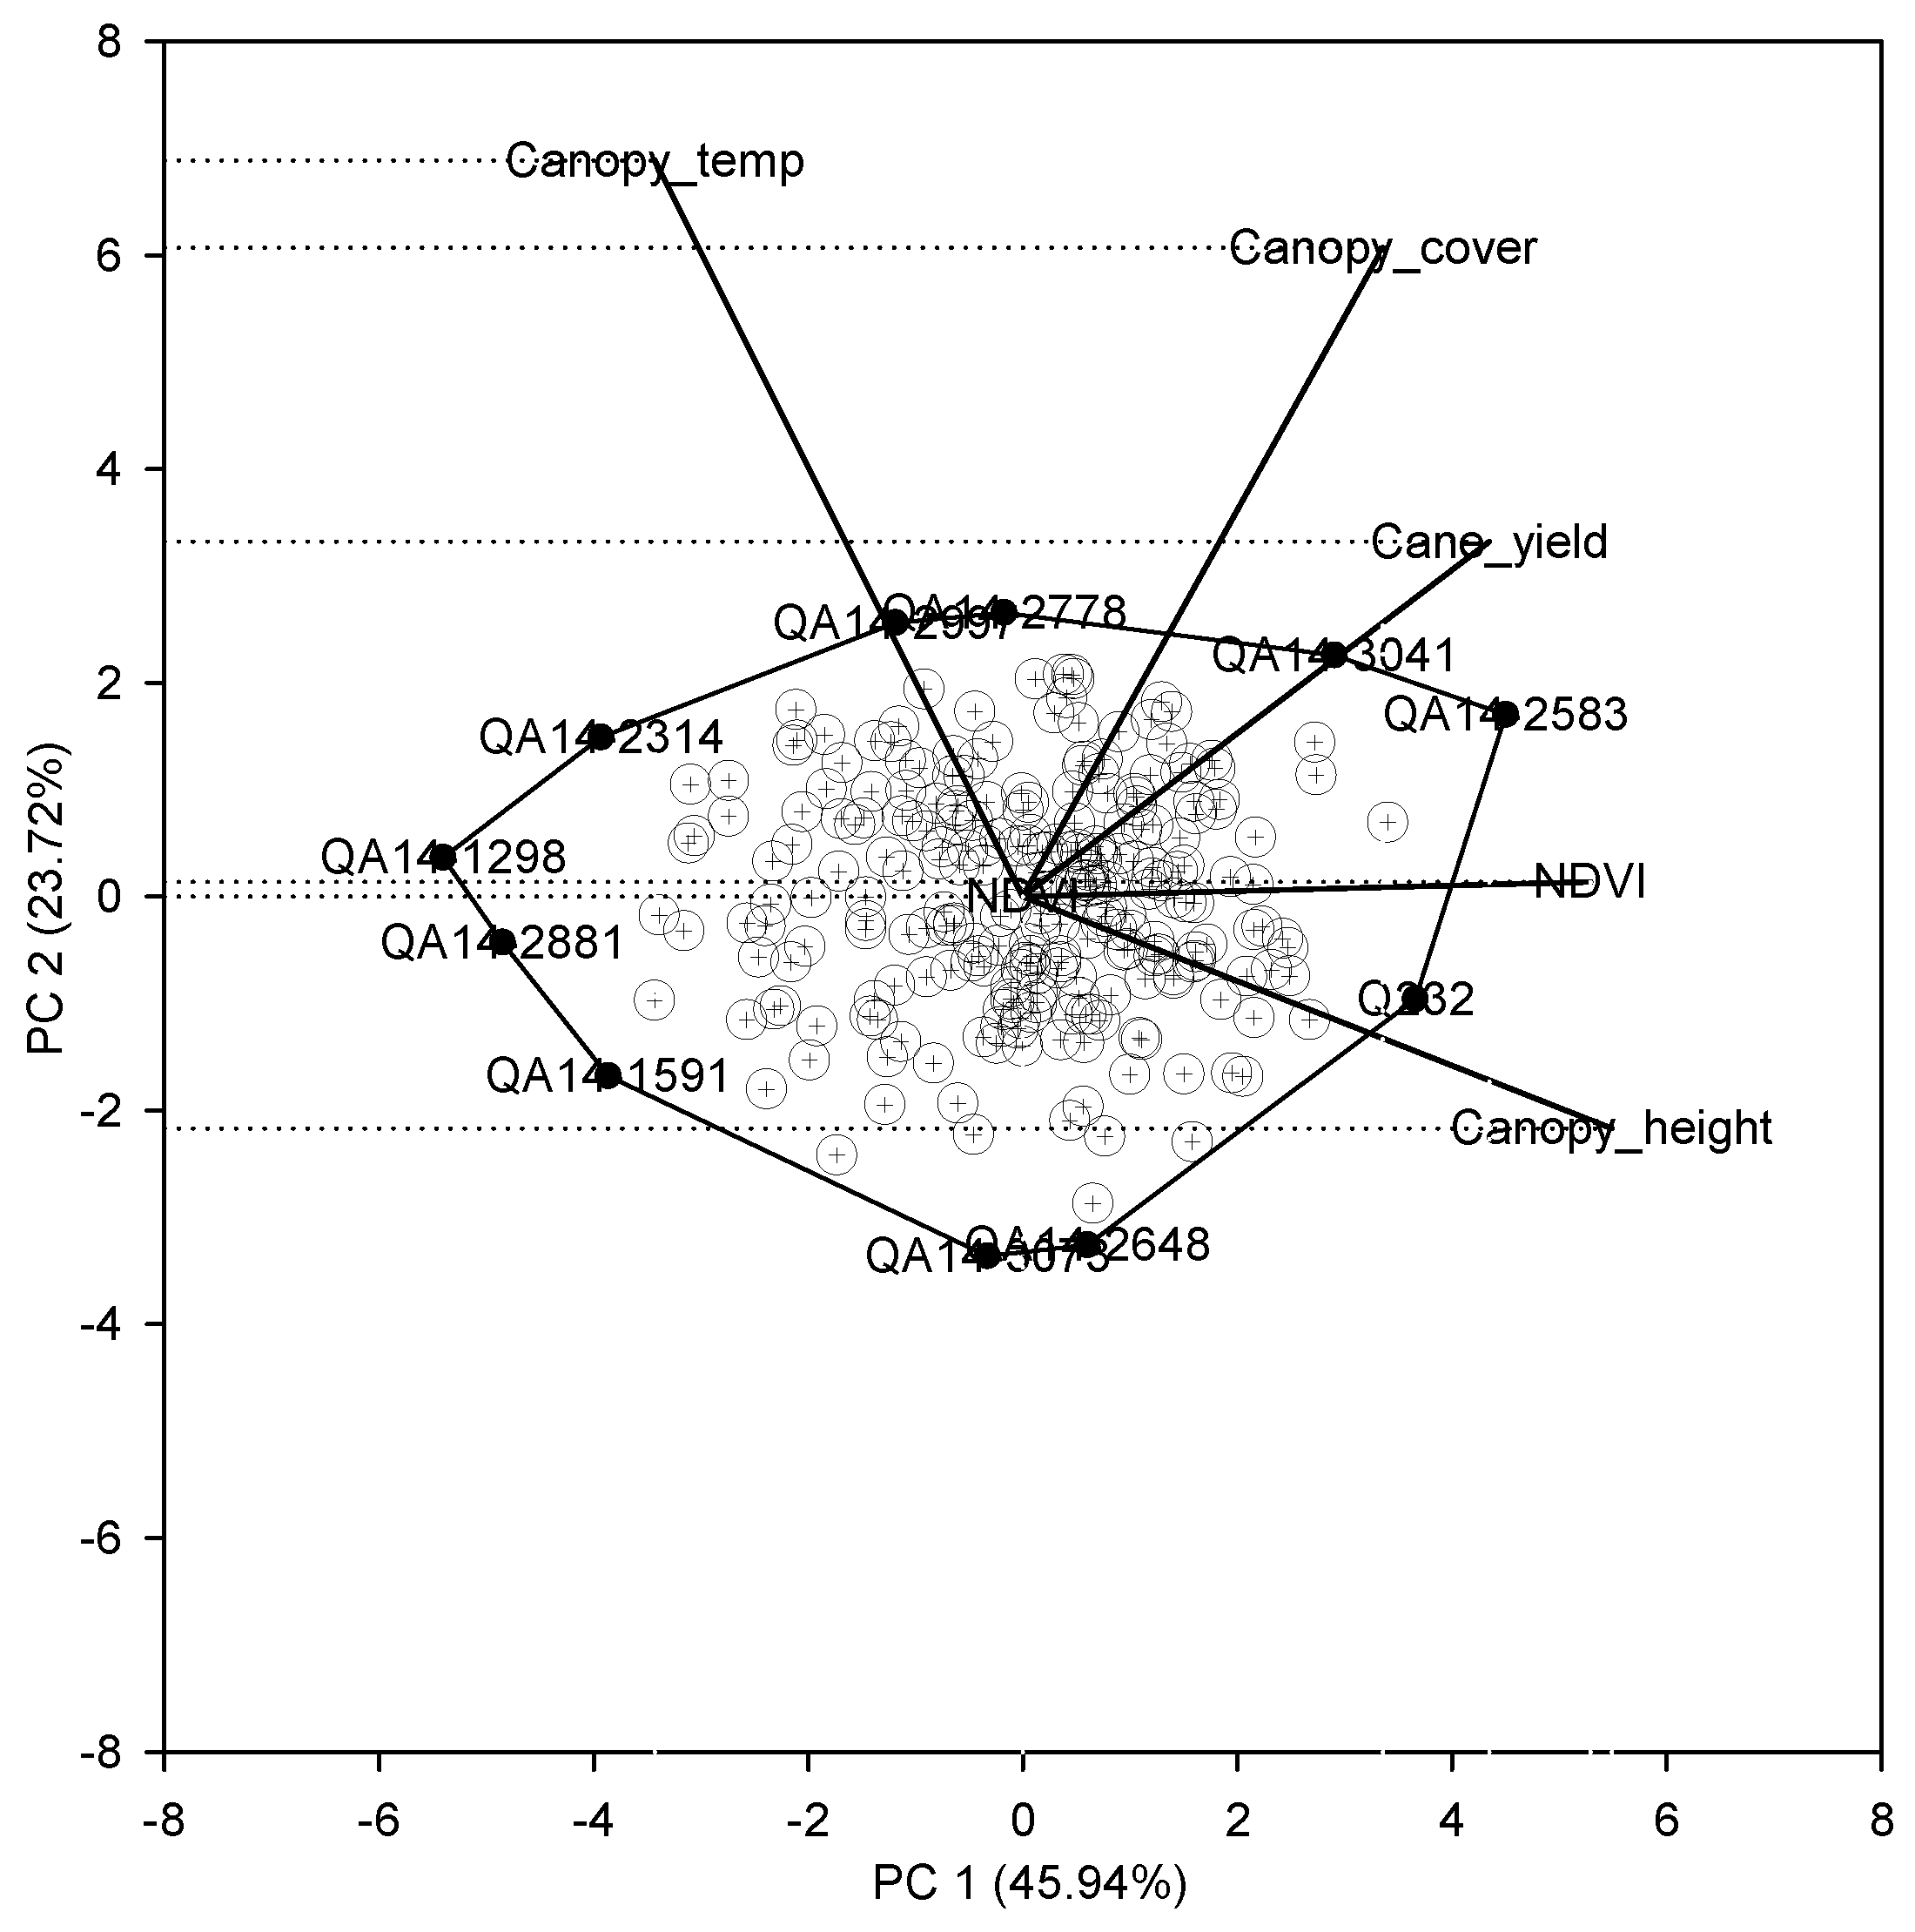
Principal component analysis (PCA) was performed for the top 10% of clones (250) selected using the single-row yield based selection. PCA was performed using the ‘princomp’ function in R [31], and a PCA biplot was generated in SigmaPlot (Systat Software Inc.). A correlation matrix of the indirect traits (canopy height, canopy cover, NDVI, and canopy temperature) and single-row yield were entered in the analysis. A PCA biplot was constructed by plotting the PC1 score against the PC2 score for each clone and trait. The aim of the analysis was to examine the relationship among the indirect traits and single-row yield of clones to evaluate their relative growth and transpiration characteristics.
3. Results
3.1. Weather Conditions
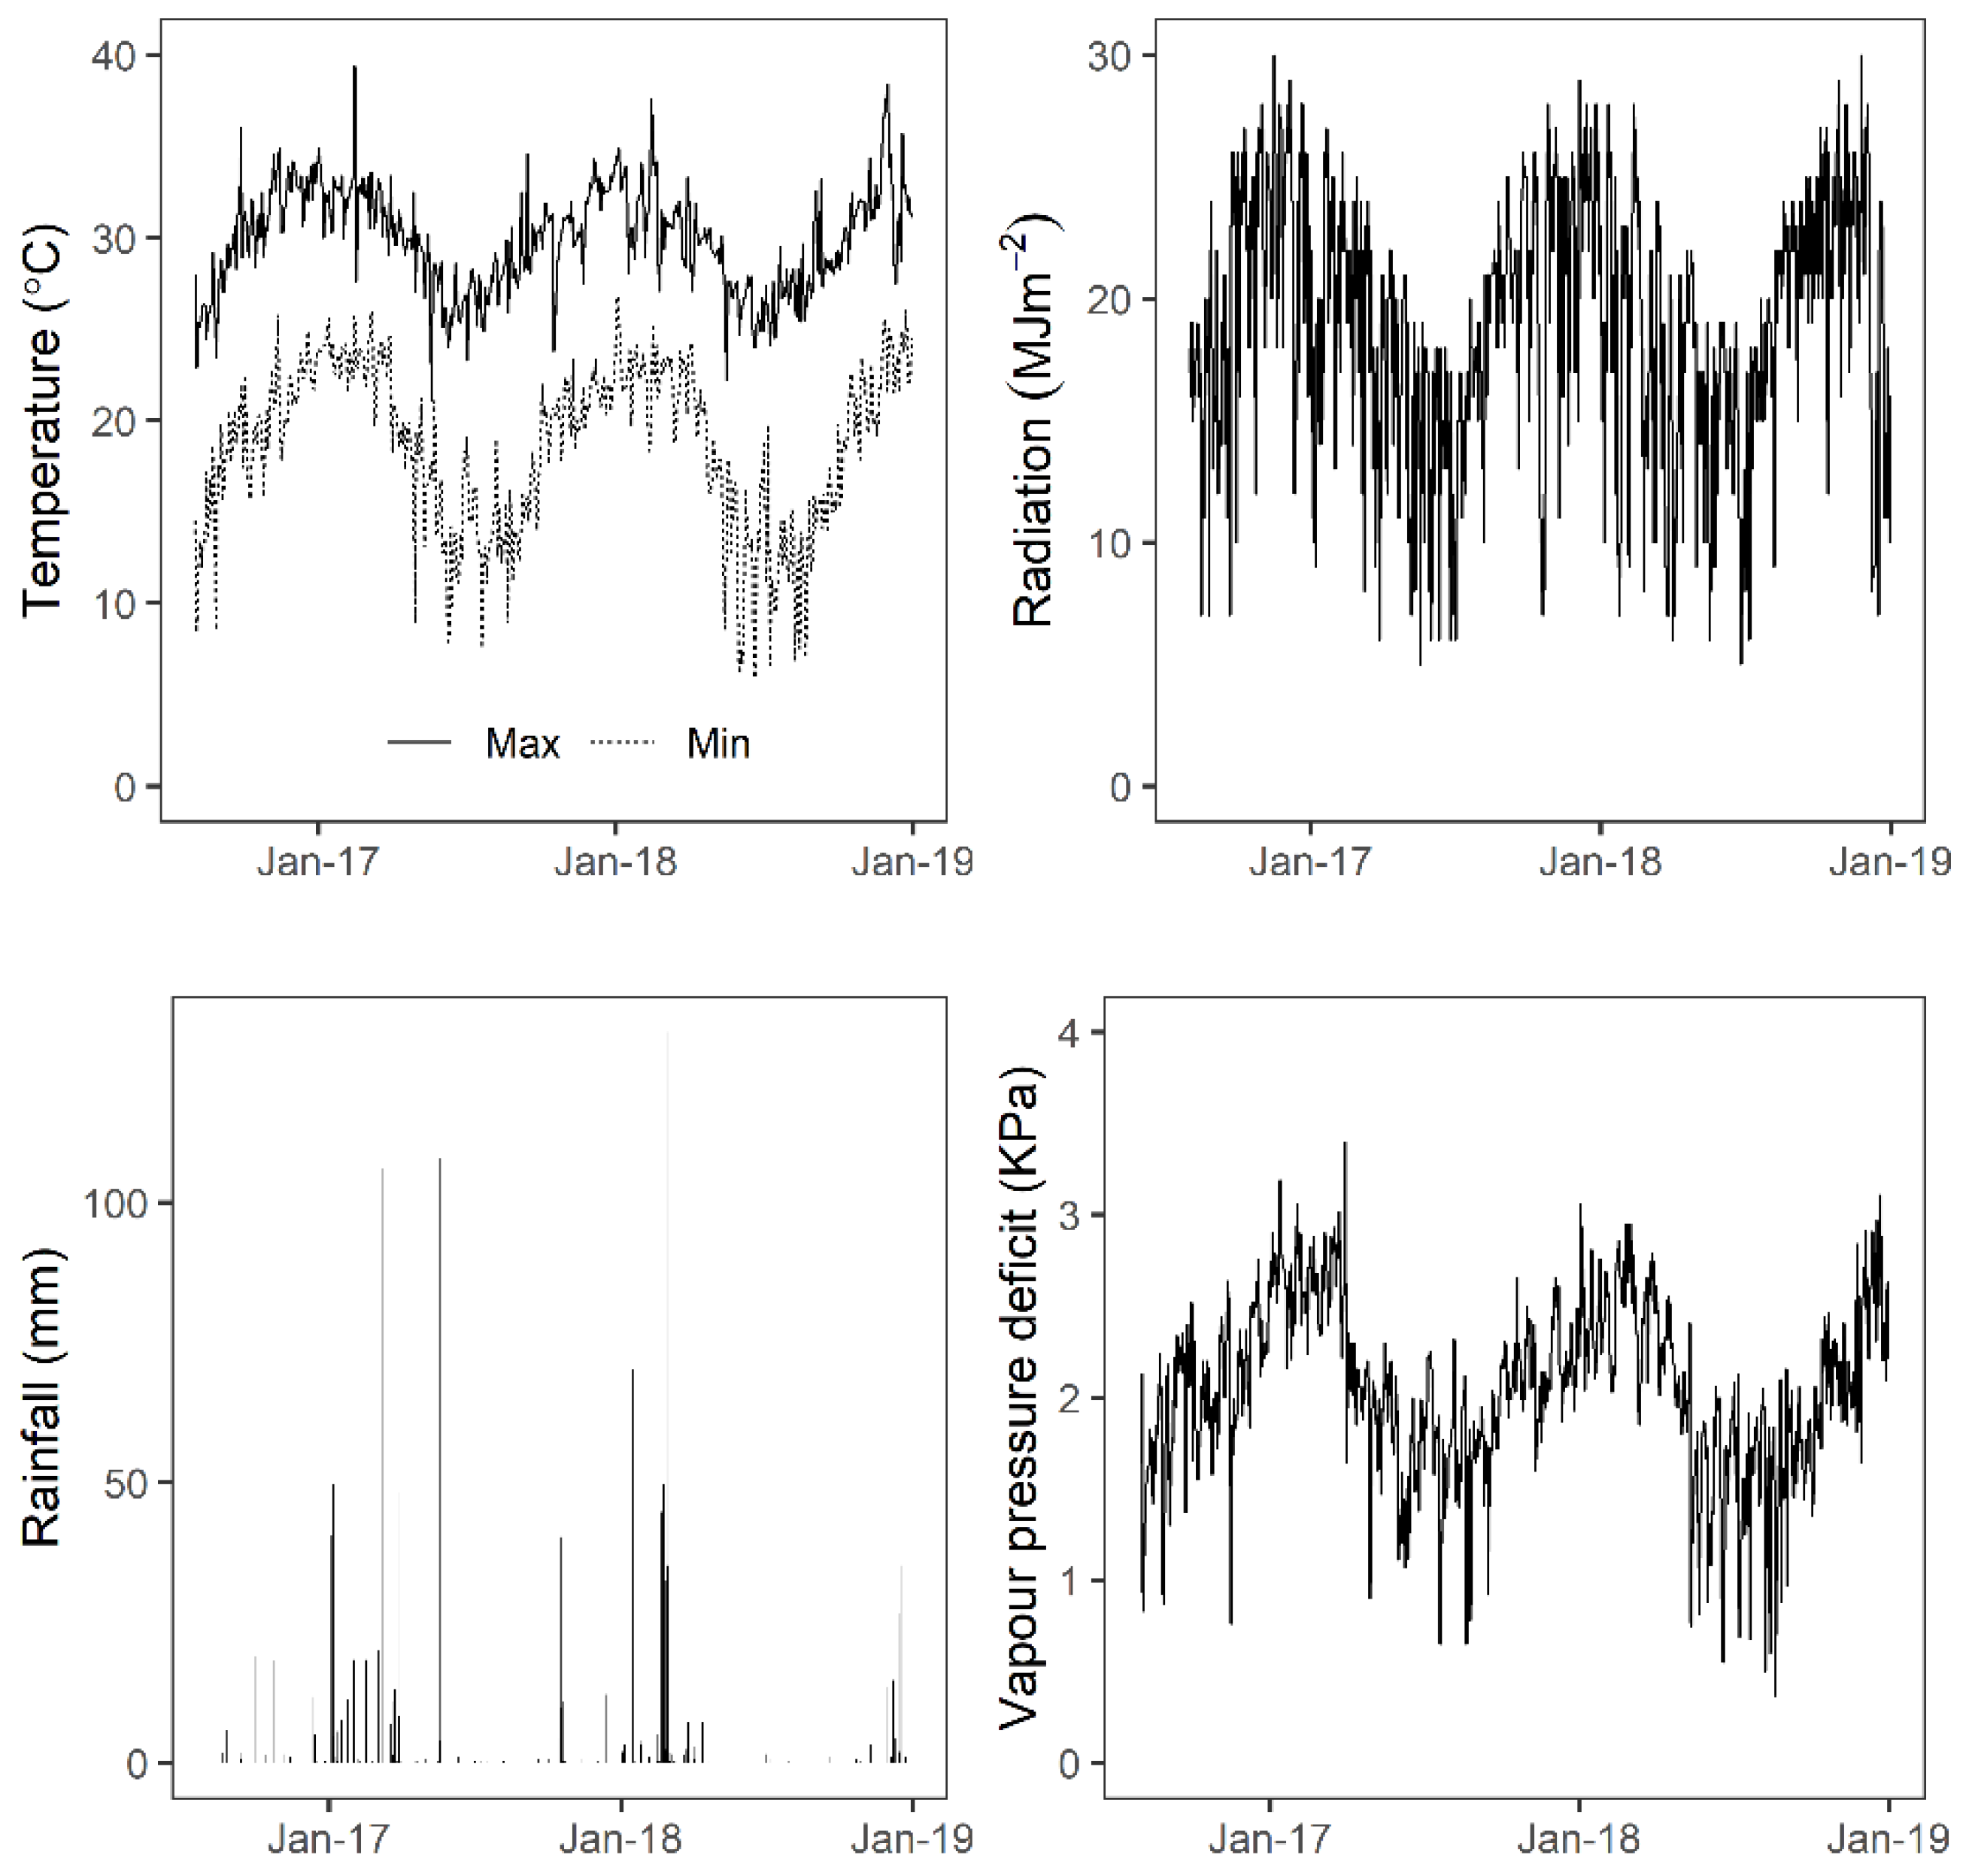
In general, weather patterns in Burdekin, the experimental location, followed typical conditions for tropical sugarcane growing regions. During winter and summer months, maximum temperatures and vapour pressure deficits were approximately 25 °C and 35 °C, and 1 kPa to 3 kPa, respectively. Annual rainfall followed the typical regional pattern of higher precipitation during summer and early autumn (December to April) and much lower rainfall in winter and spring (May to November) (Figure 1). Aerial data was collected on cloud-free clear sky days with wind speed less than 10 km/hr.
3.2. Ground-Truth Validation on Sub-Population of 75 Clones in the Single-Row Experiment
Estimated genetic variances and heritability for the ground-based and UAV-based measurements for the sub-population of 75 clones in the single-row experiment are presented in Table 2. Genetic coefficient of variation (GCV) was high for early biomass, and the broad-sense heritability was moderate (0.52). Plant height recorded lower GCV and the highest heritability (0.84). Broad-sense heritability estimates were high for UAV-based canopy cover (0.61) and canopy height (0.58).
Genetic correlations were high between ground and UAV-based measurements (Table 3). Aerially measured canopy height and canopy cover had a high genetic correlation with ground-equivalent plant height (0.69) and stalk number (0.72), respectively. Early biomass had a high genetic correlation with UAV-derived canopy height (0.81) and canopy cover (0.71).
3.3. Variance, Heritability, and Genetic Correlation in the Single-Row Experiment
Statistical analyses on individual timepoint measurements indicated significant genetic variation among test clones with varying degrees of error variances (Table 4). Hence, heritability of the traits varied among different times and days of measurements. Heritability of NDVI in plant and ratoon crop was moderate on most occasions, ranging from 0.37 to 0.67. Canopy cover and canopy height had slightly lower heritability ranging from 0.16 to 0.56, 0.13 to 0.36, respectively. Canopy temperature was measured multiple times in a day; however, heritability at most times was relatively low, the highest being 0.44. The single-row yield had a heritability of 0.61. When data across all timepoints were averaged, NDVI and canopy cover had the highest heritability (Table 5). Canopy height and canopy temperature had an overall heritability of 0.29 and 0.20, respectively.
High genetic correlation of single-row indirect traits with single-row yield was observed in the plant crop (Table 4), except one observation of canopy cover. Genetic correlation of indirect traits with single-row yield in the first ratoon crop were relatively small, where the highest observed was 0.63 for canopy cover. Moderately high negative genetic correlation was observed between canopy temperature and single-row yield, indicating genotypes with cooler canopies yield higher. This trend was preserved when analysed with averaged data across all measurements, with canopy height, canopy cover, and NDVI showing significantly high genetic correlation with single-row yield, while canopy temperature had a significant negative genetic correlation. (Table 6).
3.4. Variance, Heritability, and Genetic Correlation in Multi-Row Experiment
Indirect traits estimated in the multi-row experiment had high heritability except for the measurement in August, at which stage differences in canopy height were less discriminating (Table 7). The indirect traits also showed significantly high genetic correlation with pure-stand yield based on both individual measurement days (Table 7) and combined across days (Table 8). NDVI had the highest genetic correlation with pure-stand yield, followed by canopy cover and canopy height (Table 8).
3.5. Indirect Selection Index for Pure-Stand Yield from Indirect Traits in Single-Row Experiment
Canopy temperature was not included in the indirect selection index, as it made no difference when included, which was likely due to low heritability observed in this study. The indirect selection index for pure-stand yield derived from indirect traits in the single-row experiment is shown in Equation (11).
Si = 25.8 * NDVI + 10.7 * canopy cover + 5.5 * canopy height
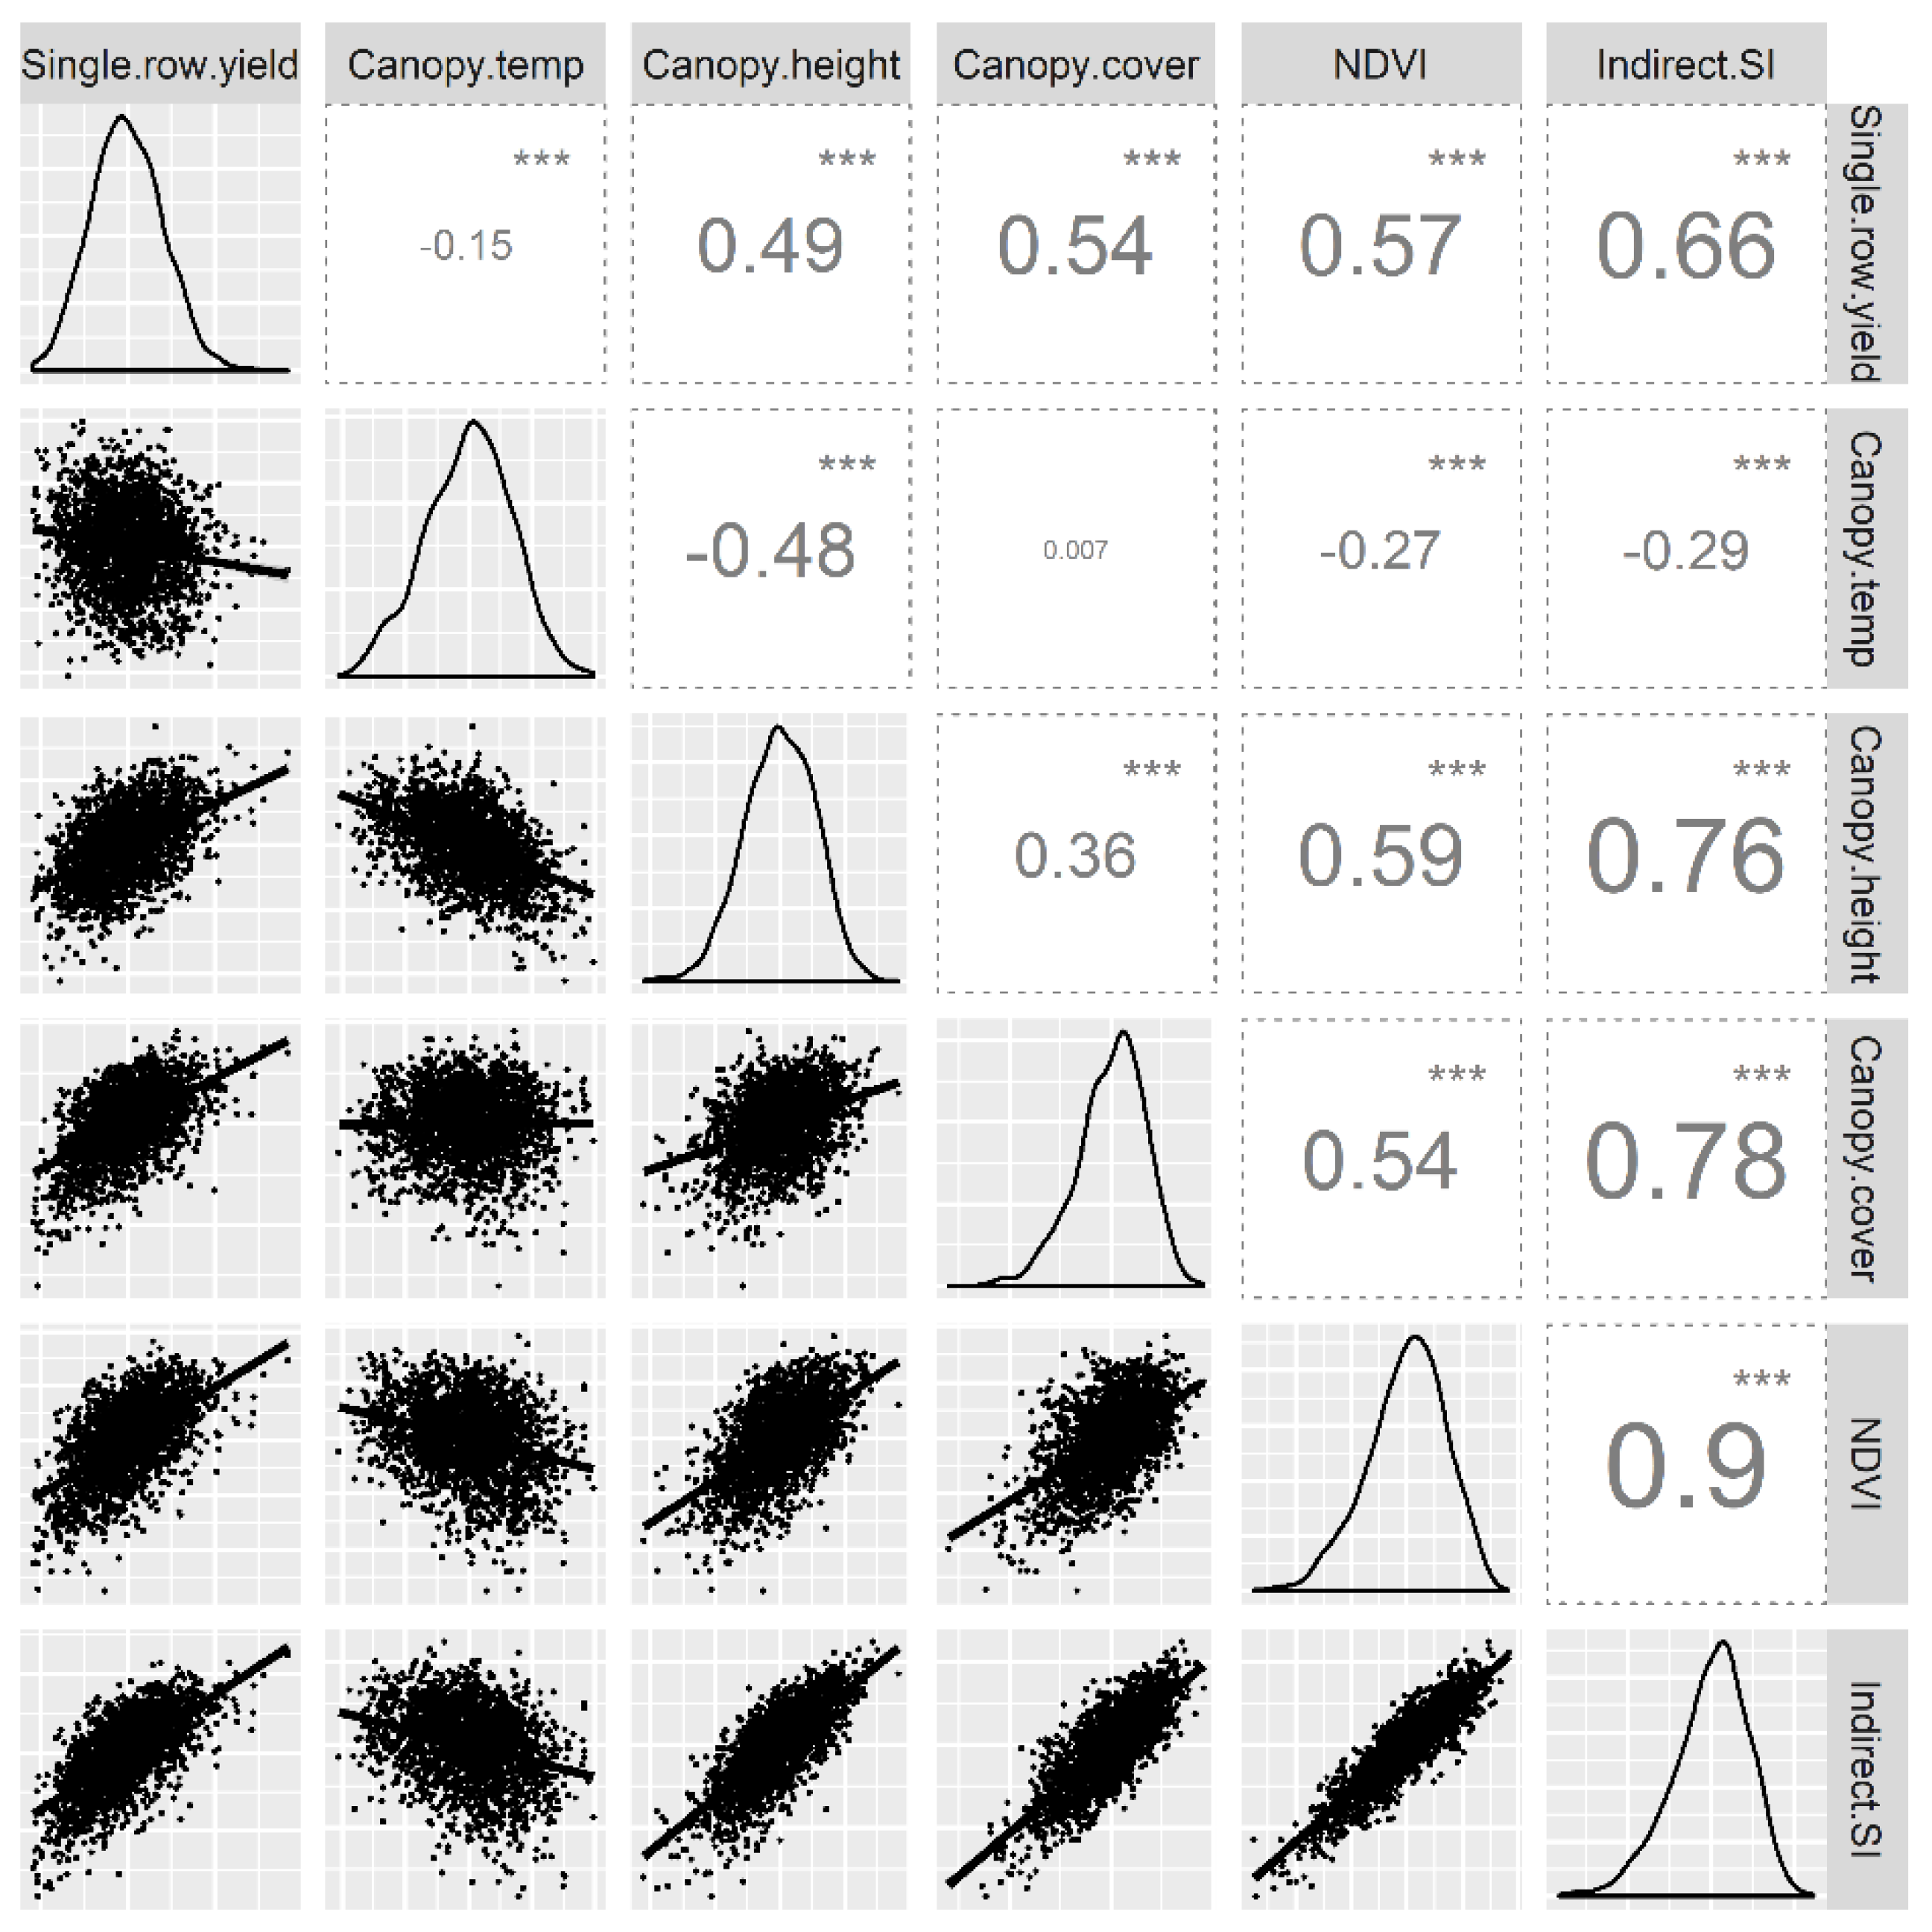
The indirect selection index had a significant correlation with single-row yield (r = 0.66), which was higher than the correlation of individual indirect traits with the single-row yield (Figure 2). The indirect selection index had a negative correlation with canopy temperature, while the correlation was positive with other indirect traits. Among the top 250 high-ranking clones that would normally be selected using the single-row yield, only 112 clones (45%) were in common with indirect selection index. The discrepancy in clone rankings between the two selection methods indicates considerable differences in selections when indirect traits were considered. However, overlapping of clones among the two methods indicate that the indirect traits are at least partly responsible for reinforcing growth and productivity of some progenies enabling them to perform well before and after the onset of inter-plot competition effects.
3.6. Response to Selection
The expected direct response to selection, correlated response to selection for pure-stand yield based on the indirect traits from the single-row experiment, and the relative efficiency of indirect selection for pure-stand yield are shown in Table 9. NDVI had the highest correlated response to selection for pure-stand yield as it had high heritability and genetic correlation. Canopy cover had a relatively lower correlated response, while correlated responses of canopy height and single-row yield were similar. The relative efficiency of indirect selection based on NDVI was 0.73, which indicates that indirect selection for NDVI is 73% as effective as direct selection for pure-stand yield; and similarly, for canopy cover, 64% as effective.
3.7. PCA Biplot of the Top 10% Clones Selected Based on Single-Row Yield
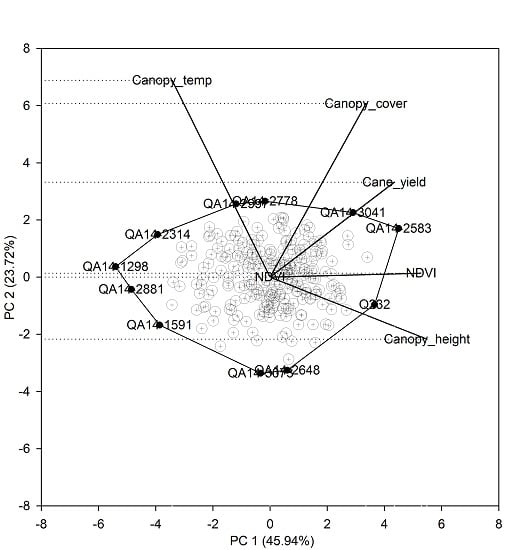
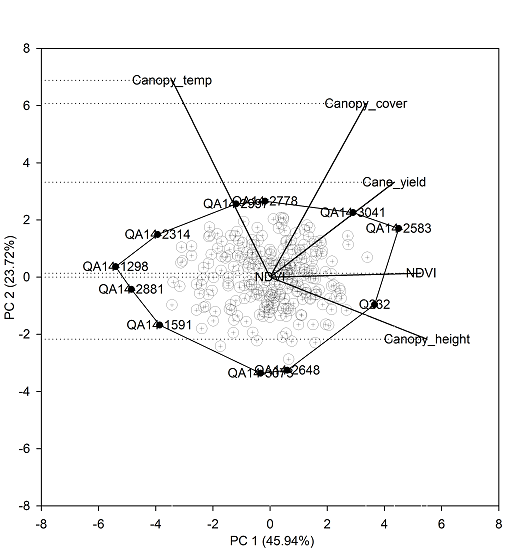
The first two principal components explained 70% of the total variation (Figure 3). The single-row yield had a moderate positive correlation with NDVI, canopy height, and canopy cover indicated by the narrow angle between the trait vectors. Canopy temperature was not associated with either yield or other indirect traits. Trait vectors for canopy temperature and canopy height were approximately opposite each other, which indicates the negative association between these two traits. The first principal component (PC 1) had high and approximately equal loadings for NDVI (0.8) and canopy height (0.83), and slightly less loading for single-row yield (0.66), which suggests PC 1 is mostly associated with growth and yield-related traits. Whereas, the second principal component (PC 2) was associated mostly to canopy temperature (0.75) and to a lesser extent with canopy cover (0.66). The biplot provides a visual assessment of the top performing clones association with related indirect traits. For instance, the commercial clone Q232 in the biplot was associated with high yield and low canopy temperature. Whereas, the test clones QA14-2583 and QA14-3041 had a higher yield and also higher canopy temperature relative to Q232, which indicates that the test clones QA14-2583 and QA14-3041 were as productive as the commercial Q232 but with less transpiration, suggesting that these test clones are more suitable for water-limited environments.
4. Discussion
This paper describes a cost-effective high throughput phenotyping system that can be used to evaluate sugarcane clone performance in early stage selection trials. The high heritability of the indirect traits and their strong genetic correlation with yield in single-row and in pure-stands indicate the potential of UAV-based high-throughput phenotyping in improving the prediction of the true genetic value of clones and selection accuracy in early stage breeding trials.
Canopy height and canopy cover estimated using UAV were significantly correlated with the ground (manual) measurements of plant height and stalk number, respectively. Predictive ability of UAV and photogrammetric assisted DSM for canopy height has been reported previously [37,38]. In this study, we have also demonstrated that UAV-derived canopy cover determined from visual images using the machine learning algorithm SVM is a good predictor of stalk population during the early stage of growth. In addition, canopy height and canopy cover were significantly correlated to biomass at the six-month stage. Manual phenotyping for these traits in large breeding trials is cost and labour intensive and impeded by the destructive sampling requirement for traits, such as biomass. Sugarcane breeders have for long relied on end-of-season yield measurements because, unlike cereal crops, accessing sugarcane plots after the initial stages of growth is very difficult. Therefore, high-throughput phenotyping using UAVs is a cost and time-effective system that enables sugarcane breeders to gather extensive time-series data for comprehensive clone characterisation.
In the early stages of selection, a large number of clones are evaluated in small single-row plots to increase the genetic variation and optimise resources. The inter-plot competition effect in such small single-row plots is substantially high [7]. These confounding effects on cane yield, besides genetic effects, result in low accuracy of clone selection in early stages of breeding [5]. Therefore, sugarcane breeders often combine visual assessment of clones with cane yield for early-stage clone selection. Given the high selection intensity and considerable resources devoted to early-stage selection, an accurate and efficient selection system is important to realise genetic gains. We hypothesised that selection based on a linear combination of indirect traits in single-row plots would have a higher genetic correlation with cane yield in pure-stand than selection based on cane yield alone in single-row plots. The broad-sense heritability estimates of the indirect traits were generally high, and in some days of measurements, the heritability was higher than cane yield itself in single-row plots. This indicates that the UAV-based assessment of indirect traits is repeatable across different environments (measurement days). Genetic correlation between the indirect traits and single-row yield was high on individual days and when averaged across the different days of measurement. This result is in contrast to a previous study by Zhao et al. [39], who reported spectral reflectance indices based on hand-held measurements showed no correlation with yield in sugarcane. Capturing spectral reflectance using UAV at the whole canopy-level rather than at individual leaf-level may have been a contributing factor for the high trait-yield correlation observed in this study, as individual leaf spot measurements do not always represent whole-canopy dynamics, and scaling-up from leaf to whole-canopy can be difficult in a population with different canopy architecture. The high heritability and strong genetic correlation of indirect traits with the single-row yield indicate the possibility of replacing or complementing yield measurement in single-row plots with UAV-assisted phenotyping. Furthermore, to estimate the true yield potential of clones, breeders typically rely on testing the clones across several target production environments over multiple years [6]. However, in early stages of selection, this is not achievable due to resource restriction, such as the land requirement for testing a large number of clones and limited availability of seed material of the clones. Therefore, breeders are compelled to restrict testing early generations in small plots within single environments, which increases the probability of erroneous selections. Although this is a long-accepted risk in breeding programs, current innovations in field-based high throughput phenotyping offer new avenues to address this limitation. Acquiring repeatable non-destructive measurements over a temporal timescale throughout the cropping cycle will help improve phenotype accuracy and help achieve higher genetic gain compared to a single timepoint measurement of yield at the end of season [3].
The indirect traits in single-row plots had higher relative efficiency of selection for pure-stand yield than yield measurements in single-row plots (Table 9). This indicates selection for indirect traits might be a better approach than selection for cane yield in single-row plots. Sugarcane crop undergoes several distinct stages of growth during a cropping season; the grand growth stage is characterised by tiller number stabilisation and stalk elongation before the crop reaches the maturation phase [40]. During the grand growth phase, sugarcane canopy develops rapidly with most clones typically achieving full canopy closure within 7–8 months after planting [19]. The declining ability of spectral indices, such as NDVI to discriminate between different clones, is widely reported in other crops as the canopy closes and its spectral reflectance saturates [41]. We observed a similar phenomenon in this study, where genetic variance and heritability of NDVI was higher in the early stages of growth and declined as the crop reaches canopy closure. Canopy development during the grand growth phase is likely a physiological function of differences in radiation use efficiency and early vigour of clones [42]. Therefore, UAV-assisted assessment during the early stages of growth could capture critical plant growth processes that differentiate clone vigour and growth before the crop attains physiological maturity.
Genetic correlation between traits may be dependent on the genetic material under study [36]. To construct the selection index, we estimated the phenotypic variance-covariance matrix in an early-stage clonal selection trial with 2134 clones; whereas the genotypic variance-covariance matrix was estimated from a multi-row field experiment with 40 unrelated clones. The 40 genotypes were of a random population, with a mixture of selected commercial cultivars and unselected clones. The testing environment may have an additional influence on the observed genetic correlation between indirect traits and pure-stand yield. However, the multi-row field experiment was maintained according to the Australian sugar industry best practise standards in terms of nutrient and water application, and pest and disease control. Therefore, the multi-row experiment provided us with a realistic representation of pure-stand yield, and a similar level of genetic correlation between the indirect traits and pure-stand yield is expected with a different set of population. Nevertheless, the genetic correlation between the indirect traits and pure-stand yield will need further validation using a random, genetically diverse, and larger set of population under a range of growing environments before the indirect selection index can be implemented in breeding programs.
We identified significant differences between the selected populations based on the indirect selection index and single-row yield. The variations suggest that the performance of clones before the onset of inter-plot competition could be different from that of the final yield. However, as noted earlier and in other studies [5], cane yield measurements in single-row plots can be associated with high error variances and, by itself, is not a good indicator of yield potential of clones. This is further supported by the higher genetic correlation of the indirect traits with pure-stand yield than with single-row yield in this study. While we reported the expected response to selection based on the indirect traits, further research will focus on estimating realised genetic gains based on selection for the indirect traits. This involves yield assessment of populations selected in early stage trials using the indirect selection index and single-row yield in pure-stand conditions across several target production environments.
A negative correlation of sugarcane yield with canopy conductance [18] and its surrogate canopy temperature [19] has been reported previously; however, a range of genetic correlations from −0.29 to 0.94 was reported [18]. In this study, cane yield and canopy temperature showed a moderate negative genetic correlation and generally low heritability for canopy temperature. The strong influence of environment and measurement conditions on canopy temperature is evident from this and other studies. While high heritability of canopy temperature has been reported previously in other crops, they have relied largely upon cooled thermal cameras that can only be carried aboard manned aircraft [43]. Issues associated with lightweight uncooled thermal cameras, such as thermal drift and non-uniformities in images have been reported extensively along with statistical models for correction [44]. However, despite the statistical corrections, it seems difficult to achieve the accuracy required to measure small temperature differences in crop canopies. Uncooled cameras with higher sensitivity and accuracy; and a better understanding of genotype x environment interactions is needed before applying canopy temperature as a selection criterion in breeding programs. In addition, in this study, a strong negative correlation was observed between canopy temperature and plant height (Table 6), which is consistent with previous observations in cereal crops [45]. Canopy height and architecture complexity greatly influence the coupling of canopy and the atmosphere, with taller architecturally complex canopies tending to be better coupled to the atmosphere [46]. The influence on canopy architecture on sugarcane canopy temperature is not well understood and needs further attention before applying canopy temperature as an indirect selection trait.
Efficient breeding and selection programs are essential for both irrigated and rainfed production environments where water and/or energy restrictions and erratic rainfall patterns are constraining crop productivity. Previous research has shown that physiological traits, such as canopy conductance, canopy temperature, and transpiration efficiency, are potentially important for improving productivity in both irrigated and rainfed environments [18,43,47]. However, progress in using physiological traits in selection systems has mostly been hindered by a lack of cost-effective phenotyping tools. In this context, the clone-by-trait biplot relationship (Figure 3) in this study provides valuable insight into the relationship between yield and physiological traits such as canopy temperature. For example, unknown test clones can be compared with known standard varieties for yield attributes and canopy temperature. In this instance, the biplot indicated that the clone QA14-2583 and QA14-3041 were as productive and possibly less water-consuming as the standard ones. The Northern region sugarcane breeding program in Australia is strategically focussed on selecting clones for high input conditions, and information regarding water use of clones is generally not generated or considered due to practical difficulties. However, given the low genotype x environment interaction for yield due to water conditions [20], identification of test clones with contrasting transpiration characteristics and with higher water use efficiency in early stages will aid selection of potential varieties specific for either irrigated, rainfed, or both environments.
Breeding programs worldwide are exploring the possibility of implementing high-throughput phenotyping as an integral component of variety selection process. In this study, we demonstrated a UAV-based high-throughput phenotyping approach for capturing valuable phenotypes in early stages of sugarcane breeding trials that could be used for improving clonal selections. Our future efforts will be focussed on (i) estimating realised genetic gains using indirect traits-based selection index, (ii) estimating environmental interactions and trait coefficients for the indirect selection index in different target production environments, and (iii) facilitating the implementation of high-throughput phenotyping-based clonal selection in the Australian sugarcane breeding programme.
5. Conclusions
Rapid developments in phenomics technologies could be utilised to improve early-stage selection in sugarcane breeding programs. This paper demonstrated the effectiveness of a high throughput phenotyping system that can be adapted to capture and use indirect yield-related traits for clone selection from early-stage selection trials. The indirect traits in the single-row experiment had high heritability and higher response to selection for the pure-stand yield than the single-row yield currently used for selection. These results suggest that UAV-assisted high-throughput phenotyping of important indirect traits and integrating it in an indirect selection index is an effective strategy for improving clonal selections and genetic gains in early-stage sugarcane breeding trials.
Author Contributions
Conceptualization, J.B. and P.L.; methodology, S.N.; software, S.N.; validation, S.N., J.B., and X.W.; formal analysis, S.N., J.B., and X.W.; investigation, S.N.; resources, P.L.; data curation, S.N.; writing—original draft preparation, S.N. and J.B.; writing—review and editing, S.N., X.W., and P.L.; visualization, S.N.; supervision, J.B. and P.L.; project administration, J.B.; funding acquisition, J.B., X.W., and P.L.
Funding
This research was funded by Sugar Research Australia, grant number 2016028. The APC was funded by Sugarcane Research Institute, Guangxi.
Acknowledgments
The authors thank Phil Jackson (CSIRO) and Alex Thomasson (Texas A&M) for critical review that greatly helped improve the manuscript. The authors acknowledge the contribution of Scott Chapman (CSIRO) and Bangyou Zheng (CSIRO) to initiate this project. SRA senior technicians, Bill Harris and Johan Deutschenbaur, contributions for field management and data collection are greatly acknowledged.
Conflicts of Interest
The authors declare no conflict of interest. The funders had no role in the design of the study; in the collection, analyses, or interpretation of data; in the writing of the manuscript, or in the decision to publish the results.
References
- Jackson, P. Why are yields of sugarcane not increasing as much as sugar beet (or other crops). In Proceedings of the International Society of Sugar Cane Technologists, Tucumán, Argentina, 2–5 September 2019; pp. 128–137. [Google Scholar]
- Wei, X.; Jackson, P. Addressing slow rates of long-term genetic gain in sugarcane. Int. Sugar J. 2017, 119, 480–484. [Google Scholar]
- Araus, J.L.; Kefauver, S.C.; Zaman-Allah, M.; Olsen, M.S.; Cairns, J.E. Translating High-Throughput Phenotyping into Genetic Gain. Trends Plant Sci. 2018, 23, 451–466. [Google Scholar] [CrossRef] [PubMed] [Green Version]
- Cobb, J.N.; Declerck, G.; Greenberg, A.; Clark, R.; McCouch, S. Next-generation phenotyping: Requirements and strategies for enhancing our understanding of genotype-phenotype relationships and its relevance to crop improvement. Theor. Appl. Genet. 2013, 126, 867–887. [Google Scholar] [CrossRef] [PubMed] [Green Version]
- Jackson, P.; McRae, T.A. Selection of Sugarcane clones in small plots. Crop Sci. 2001, 41, 315–322. [Google Scholar] [CrossRef]
- Berding, N.; Hogarth, M.; Cox, M. Plant improvement of sugarcane. In Sugarcane; Blackwell Publishing Ltd.: Oxford, UK, 2004; pp. 20–53. [Google Scholar]
- Skinner, J.; Hogarth, D. Efficiency of border rows in replicated sugar cane variety trials. Euphytica 1978, 27, 629–643. [Google Scholar] [CrossRef]
- Rebetzke, G.J.; Fischer, R.A.; van Herwaarden, A.F.; Bonnett, D.G.; Chenu, K.; Rattey, A.R.; Fettell, N.A. Plot size matters: Interference from intergenotypic competition in plant phenotyping studies. Funct. Plant Biol. 2014, 41, 107. [Google Scholar] [CrossRef]
- Atkin, F.; Stringer, J.; Dieters, M. Interplot competition between sugarcane families significantly affects estimates of cane yield and family selection. J. Sugar Cane Int. 2010, 28, 27–38. [Google Scholar]
- Matassa, V.; Basford, K.; Jackson, P. Intergenotypic competition in single-row plots of sugarcane variety trials. Proc. Aust. Soc. Sugar Cane Technol. 1999, 21, 234–240. [Google Scholar]
- Stringer, J.K.; Cullis, B.R.; Thompson, R. Joint modeling of spatial variability and within-row interplot competition to increase the efficiency of plant improvement. J. Agric. Biol. Environ. Stat. 2011, 16, 269–281. [Google Scholar] [CrossRef]
- Rebetzke, G.; Botwright, T.; Moore, C.; Richards, R.; Condon, A. Genotypic variation in specific leaf area for genetic improvement of early vigour in wheat. Field Crops Res. 2004, 88, 179–189. [Google Scholar] [CrossRef]
- Kipp, S.; Mistele, B.; Baresel, P.; Schmidhalter, U. High-throughput phenotyping early plant vigour of winter wheat. Eur. J. Agron. 2014, 52, 271–278. [Google Scholar] [CrossRef]
- Duan, T.; Chapman, S.C.; Holland, E.; Rebetzke, G.J.; Guo, Y.; Zheng, B. Dynamic quantification of canopy structure to characterize early plant vigour in wheat genotypes. J. Exp. Bot. 2016, 67, 4523–4534. [Google Scholar] [CrossRef] [PubMed]
- Zhao, D.; Gordon, V.S.; Comstock, J.C.; Glynn, N.C.; Johnson, R.M. Assessment of Sugarcane Yield Potential across Large Numbers of Genotypes using Canopy Reflectance Measurements. Crop Sci. 2016, 56, 1747. [Google Scholar] [CrossRef]
- Aguate, F.M.; Trachsel, S.; Pérez, L.G.; Burgueño, J.; Crossa, J.; Balzarini, M.; Gouache, D.; Bogard, M.; Campos, G.d.l. Use of Hyperspectral Image Data Outperforms Vegetation Indices in Prediction of Maize Yield. Crop Sci. 2017, 57. [Google Scholar] [CrossRef] [Green Version]
- Jackson, P.; Robertson, M.; Cooper, M.; Hammer, G. The role of physiological understanding in plant breeding; from a breeding perspective. Field Crops Res. 1996, 49, 11–38. [Google Scholar] [CrossRef]
- Basnayake, J.; Jackson, P.A.; Inman-Bamber, N.G.; Lakshmanan, P. Sugarcane for water-limited environments. Variation in stomatal conductance and its genetic correlation with crop productivity. J. Exp. Bot. 2015, 66, 3945–3958. [Google Scholar] [CrossRef] [Green Version]
- Basnayake, J.; Lakshmanan, P.; Jackson, P.; Chapman, S.; Natarajan, S. Canopy temperature: A predictor of sugarcane yield for irrigated and rainfed conditions. In Proceedings of the International Society of Sugar Cane Technologists, Chien Mai, Thailand, 5–8 December 2016; pp. 50–57. [Google Scholar]
- Basnayake, J.; Jackson, P.A.; Inman-Bamber, N.G.; Lakshmanan, P. Sugarcane for water-limited environments. Genetic variation in cane yield and sugar content in response to water stress. J. Exp. Bot. 2012, 63, 6023–6033. [Google Scholar] [CrossRef]
- Jackson, P.; Basnayake, J.; Inman-Bamber, G.; Lakshmanan, P.; Natarajan, S.; Stokes, C. Genetic variation in transpiration efficiency and relationships between whole plant and leaf gas exchange measurements in Saccharum spp. and related germplasm. J. Exp. Bot. 2016, 67, 861–871. [Google Scholar] [CrossRef] [Green Version]
- Inman-Bamber, N.G.; Lakshmanan, P.; Park, S. Sugarcane for water-limited environments: Theoretical assessment of suitable traits. Field Crops Res. 2012, 134, 95–104. [Google Scholar] [CrossRef]
- Chapman, S.; Merz, T.; Chan, A.; Jackway, P.; Hrabar, S.; Dreccer, M.; Holland, E.; Zheng, B.; Ling, T.; Jimenez-Berni, J. Pheno-Copter: A Low-Altitude, Autonomous Remote-Sensing Robotic Helicopter for High-Throughput Field-Based Phenotyping. Agronomy 2014, 4, 279–301. [Google Scholar] [CrossRef] [Green Version]
- Fischer, R.A.; Rebetzke, G.J. Indirect selection for potential yield in early-generation, spaced plantings of wheat and other small-grain cereals: A review. Crop Pasture Sci. 2018, 69. [Google Scholar] [CrossRef]
- Yang, K.; Jackson, P.; Wei, X.; Chen, X.; Liu, J.; Zhao, J.; Wu, C.; Fan, Y. Selecting for multiple traits in complex production systems: A case study of sugarcane in China. Agric. Syst. 2017, 152, 110–120. [Google Scholar] [CrossRef]
- Araus, J.L.; Cairns, J.E. Field high-throughput phenotyping: The new crop breeding frontier. Trends Plant Sci. 2014, 19, 52–61. [Google Scholar] [CrossRef] [PubMed]
- Sankaran, S.; Khot, L.R.; Espinoza, C.Z.; Jarolmasjed, S.; Sathuvalli, V.R.; Vandemark, G.J.; Miklas, P.N.; Carter, A.H.; Pumphrey, M.O.; Knowles, N.R.; et al. Low-altitude, high-resolution aerial imaging systems for row and field crop phenotyping: A review. Eur. J. Agron. 2015, 70, 112–123. [Google Scholar] [CrossRef]
- Inman-Bamber, G. Sugarcane Yields and Yield-Limiting Processes. In Sugarcane: Physiology, Biochemistry, and Functional Biology; John Wiley & Sons Ltd.: Hoboken, NJ, USA, 2013; pp. 579–600. [Google Scholar] [CrossRef]
- Jones, H.; Sirault, X. Scaling of Thermal Images at Different Spatial Resolution: The Mixed Pixel Problem. Agronomy 2014, 4, 380–396. [Google Scholar] [CrossRef] [Green Version]
- Haghighattalab, A.; González Pérez, L.; Mondal, S.; Singh, D.; Schinstock, D.; Rutkoski, J.; Ortiz-Monasterio, I.; Singh, R.P.; Goodin, D.; Poland, J. Application of unmanned aerial systems for high throughput phenotyping of large wheat breeding nurseries. Plant Methods 2016, 12. [Google Scholar] [CrossRef] [PubMed] [Green Version]
- R Core Team. R: A Language and Environment for Statistical Computing; R Foundation for Statistical Computing: Vienna, Austria, 2018. [Google Scholar]
- Bates, D.; Mächler, M.; Bolker, B.; Walker, S. Fitting Linear Mixed-Effects Models Using lme4. J. Stat. Softw. 2015, 67, 48. [Google Scholar] [CrossRef]
- Fehr, W.R. Principles of Cultivar Development: Crop Species; Macmillan Publishing Company: New York, NY, USA, 1987. [Google Scholar]
- Kempthorne, O. An Introduction to Genetic Statistics; Wiley: Oxford, UK, 1957; p. 545. [Google Scholar]
- Wei, X.; Jackson, P.; Stringer, J.; Cox, M. Relative economic genetic value (rEGV)—An improved selection index to replace net merit grade (NMG) in the Australian sugarcane variety improvement program. In Proceedings of the Australian Society of Sugar Cane Technologists, Townsville, Australia, 29 April–2 May 2008; pp. 174–181. [Google Scholar]
- Falconer, D.S.; Mackay, T.F.C. Introduction to Quantitative Genetics, Fourth ed.; Longman: Burnt Mill, UK, 1996. [Google Scholar]
- Holman, F.; Riche, A.; Michalski, A.; Castle, M.; Wooster, M.; Hawkesford, M. High Throughput Field Phenotyping of Wheat Plant Height and Growth Rate in Field Plot Trials Using UAV Based Remote Sensing. Remote Sens. 2016, 8, 1031. [Google Scholar] [CrossRef]
- De Souza, C.H.W.; Lamparelli, R.A.C.; Rocha, J.V.; Magalhães, P.S.G. Height estimation of sugarcane using an unmanned aerial system (UAS) based on structure from motion (SfM) point clouds. Int. J. Remote Sens. 2017, 38, 2218–2230. [Google Scholar] [CrossRef]
- Zhao, D.; Glynn, N.C.; Glaz, B.; Comstock, J.C.; Johnson, R.M. Development of Leaf Spectral Models for Evaluating Large Numbers of Sugarcane Genotypes. Crop Sci. 2012, 52, 1837. [Google Scholar] [CrossRef] [Green Version]
- Park, S.; Robertson, M.; Inman-Bamber, N. Decline in the growth of a sugarcane crop with age under high input conditions. Field Crops Res. 2005, 92, 305–320. [Google Scholar] [CrossRef]
- Marti, J.; Bort, J.; Slafer, G.; Araus, J. Can wheat yield be assessed by early measurements of Normalized Difference Vegetation Index? Ann. Appl. Biol. 2007, 150, 253–257. [Google Scholar] [CrossRef]
- Muchow, R.; Spillman, M.; Wood, A.; Thomas, M. Radiation interception and biomass accumulation in a sugarcane crop grown under irrigated tropical conditions. Aust. J. Agric. Res. 1994, 45, 37–49. [Google Scholar] [CrossRef]
- Furbank, R.T.; Jimenez-Berni, J.A.; George-Jaeggli, B.; Potgieter, A.B.; Deery, D.M. Field crop phenomics: Enabling breeding for radiation use efficiency and biomass in cereal crops. New Phytol. 2019. [Google Scholar] [CrossRef] [PubMed] [Green Version]
- Ribeiro-Gomes, K.; Hernandez-Lopez, D.; Ortega, J.F.; Ballesteros, R.; Poblete, T.; Moreno, M.A. Uncooled Thermal Camera Calibration and Optimization of the Photogrammetry Process for UAV Applications in Agriculture. Sensors 2017, 17, 2173. [Google Scholar] [CrossRef] [PubMed]
- Rebetzke, G.J.; Rattey, A.R.; Farquhar, G.D.; Richards, R.A.; Condon, A.G. Genomic regions for canopy temperature and their genetic association with stomatal conductance and grain yield in wheat. Funct. Plant Biol. 2013, 40, 14. [Google Scholar] [CrossRef]
- Jarvis, P.G.; McNaughton, K. Stomatal control of transpiration: Scaling up from leaf to region. In Advances in Ecological Research; Elsevier: Amsterdam, The Netherlands, 1986; Volume 15, pp. 1–49. [Google Scholar]
- Stokes, C.; Jackson, P.; Inman-Bamber, G.; Lakshmanan, P.; Basnayake, J.; Natarajan, S. Genetic variation in transpiration efficiency in sugarcane and its potential impact on yield in rainfed or low irrigation environments. In Proceedings of the 38th Conference of the Australian Society of Sugar Cane Technologists, Mackay, Australia, 27–29 April 2016. [Google Scholar]
Figure 1.
Weather conditions at the Burdekin field research station from 2016 to 2018.

Figure 2.
Pearson correlation of indirect traits from the single-row experiment, single-row yield, and the indirect selection index.
Figure 2.
Pearson correlation of indirect traits from the single-row experiment, single-row yield, and the indirect selection index.

Figure 3.
Principal component analysis of the top 250 clones selected using the single-row yield-based selection.
Figure 3.
Principal component analysis of the top 250 clones selected using the single-row yield-based selection.


Table 1.
Flight mission dates, flight height, sensors, and ground sampling distance (GSD).
| Date | Time | Crop | Flight Height (m) | Sensors | GSD (cm) |
|---|---|---|---|---|---|
| Single-row experiment | |||||
| 24 Nov 2016 | 11:30 | Plant | 60 | Multispectral | 4.07 |
| Visual | 2.62 | ||||
| 13 Feb 2017 | 12:00 | Plant | 100 | Visual | 4.33 |
| 26 Oct 2017 | 12:00 | Ratoon 1 | 60 | Multispectral | 4.01 |
| Visual | 2.54 | ||||
| 24 Nov 2017 | 11:30 | Ratoon 1 | 60 | Multispectral | 4.06 |
| Visual | 2.61 | ||||
| 13 Dec 2017 | 13:30 | Ratoon 1 | 60 | Multispectral | 4.07 |
| Visual | 2.56 | ||||
| 29 Jan 2018 | 09:30 | Ratoon 1 | 60 | Multispectral | 4.03 |
| Visual | 2.55 | ||||
| 09 Feb 2018 | 11:30 | Ratoon 1 | 60 | Multispectral | 4.04 |
| Visual | 2.59 | ||||
| 16 Mar 2018 | 9:00 | Ratoon 1 | 100 | Thermal | 12.78 |
| Visual | 4.5 | ||||
| 16 Mar 2018 | 11:00 | Ratoon 1 | 100 | Thermal | 12.78 |
| Visual | 4.5 | ||||
| 29 Mar 2018 | 9:00 | Ratoon 1 | 80 | Thermal | 9.98 |
| Visual | 3.59 | ||||
| 29 Mar 2018 | 11:00 | Ratoon 1 | 80 | Thermal | 10.25 |
| Visual | 3.59 | ||||
| 29 Mar 2018 | 13:00 | Ratoon 1 | 80 | Thermal | 10.25 |
| Visual | 3.59 | ||||
| 29 Mar 2018 | 15:00 | Ratoon 1 | 80 | Thermal | 10.42 |
| Visual | 3.59 | ||||
| 26 Nov 2018 | 10:00 | Ratoon 2 | 80 | Thermal | 10.25 |
| Visual | 3.59 | ||||
| 26 Nov 2018 | 10:30 | Ratoon 2 | 80 | Thermal | 10.25 |
| Visual | 3.59 | ||||
| 14 Dec 2018 | 11:00 | Ratoon 2 | 80 | Thermal | 10.42 |
| Visual | 3.59 | ||||
| Multi-row experiment | |||||
| 9 Aug 2017 | 10:00 | Plant | 60 | Multispectral | 4.03 |
| Visual | 2.54 | ||||
| 7 Nov 2017 | 10:00 | Plant | 60 | Multispectral | 4.07 |
| Visual | 2.61 | ||||
| 20 Dec 2017 | 10:00 | Plant | 60 | Multispectral | 4.07 |
| Visual | 2.56 | ||||
Table 2.
Mean best linear unbiased predictors (BLUP), genetic (G) and error (E) variance, genetic coefficient of variation (GCV), and heritability (H2b) of ground-based and UAV-based measurements in a sub-population of 75 clones in the single-row experiment.
Table 2.
Mean best linear unbiased predictors (BLUP), genetic (G) and error (E) variance, genetic coefficient of variation (GCV), and heritability (H2b) of ground-based and UAV-based measurements in a sub-population of 75 clones in the single-row experiment.
| Method | Traits | BLUP | G | E | GCV | H2b |
|---|---|---|---|---|---|---|
| Ground-based | Early biomass (kg/plot) | 4.9 | 1.06 | 1.99 | 20.92 | 0.52 |
| Plant height (m) | 2.45 | 0.04 | 0.02 | 8.19 | 0.84 | |
| Stalk number (per 6 m plot) | 105.12 | 216.72 | 422.51 | 14.00 | 0.51 | |
| UAV-based | Canopy height (m) | 2.89 | 0.02 | 0.02 | 4.54 | 0.58 |
| Canopy cover | 0.66 | 0.01 | 0.01 | 13.00 | 0.61 |
Table 3.
Genetic correlation between ground-based and UAV-based measurements in a sub-population of 75 clones in the single-row experiment.
Table 3.
Genetic correlation between ground-based and UAV-based measurements in a sub-population of 75 clones in the single-row experiment.
| Early Biomass | Plant Height | Stalk Number | Canopy Height | |
|---|---|---|---|---|
| Plant height | 0.89 | |||
| Stalk number | 0.58 | 0.57 | ||
| Canopy height | 0.81 | 0.69 | 0.62 | |
| Canopy cover | 0.71 | 0.70 | 0.72 | 0.80 |
All values significant at 0.05 probability.
Table 4.
Mean best linear unbiased prediction (BLUP), genetic (G) and error (E) variance components, genetic coefficient of variation (GCV), broad-sense heritability (H2b) and genetic correlation with single-row yield (rg) of indirect traits measured in the single-row experiment with 2134 clones at individual timepoints.
| Date | Time | Trait | BLUP | G | E | GCV | H2b | rg |
|---|---|---|---|---|---|---|---|---|
| Plant crop | ||||||||
| 24 Nov 2016 | 11:30 | NDVI | 0.33 | 0.0052 | 0.0052 | 21.85 | 0.67 | 0.72 |
| Canopy height (m) | 1.40 | 0.0117 | 0.151 | 0.47 | 0.13 | 0.67 | ||
| Canopy cover | 0.66 | 0.0013 | 0.013 | 5.46 | 0.16 | 0.13 | ||
| 13 Feb 2017 | 12:00 | Canopy height (m) | 2.66 | 0.0217 | 0.0759 | 1.21 | 0.36 | 0.68 |
| Canopy cover | 0.68 | 0.0066 | 0.0118 | 11.94 | 0.53 | 0.70 | ||
| First ratoon crop | ||||||||
| 26 Oct 2017 | 12:00 | NDVI | 0.61 | 0.0016 | 0.0042 | 6.56 | 0.43 | 0.54 |
| Canopy cover | 0.29 | 0.0032 | 0.0082 | 19.37 | 0.43 | 0.55 | ||
| 24 Nov 2017 | 11:30 | NDVI | 0.78 | 0.0005 | 0.0013 | 2.91 | 0.44 | 0.52 |
| 13 Dec 2017 | 13:30 | NDVI | 0.82 | 0.0003 | 0.0007 | 1.97 | 0.42 | 0.18 |
| Canopy cover | 0.53 | 0.0066 | 0.0103 | 15.31 | 0.56 | 0.63 | ||
| 29 Jan 2018 | 09:30 | NDVI | 0.82 | 0.0002 | 0.0007 | 1.78 | 0.37 | 0.19 |
| Canopy height (m) | 1.26 | 0.0267 | 0.224 | 1.51 | 0.19 | 0.47 | ||
| Canopy cover | 0.82 | 0.0029 | 0.0054 | 6.59 | 0.52 | 0.38 | ||
| 09 Feb 2018 | 11:30 | NDVI | 0.78 | 0.0006 | 0.0016 | 3.03 | 0.41 | 0.38 |
| 16 Mar 2018 | 9:00 | Canopy temp (°C) | 17.47 | 0.0899 | 1.879 | 1.72 | 0.09 | −0.36 |
| 16 Mar 2018 | 11:00 | Canopy temp (°C) | 26.3 | 0.3717 | 3.188 | 2.32 | 0.19 | −0.09 |
| 29 Mar 2018 | 9:00 | Canopy temp (°C) | 20.15 | 0.0496 | 1.804 | 1.11 | 0.05 | −0.55 |
| 29 Mar 2018 | 11:00 | Canopy temp (°C) | 30.68 | 0.0258 | 0.468 | 0.52 | 0.1 | - |
| 29 Mar 2018 | 13:00 | Canopy temp (°C) | 28.9 | 0.1929 | 1.309 | 1.52 | 0.23 | −0.43 |
| 29 Mar 2018 | 15:00 | Canopy temp (°C) | 36.65 | 0.1307 | 1.015 | 0.99 | 0.2 | −0.32 |
| Second ratoon crop | ||||||||
| 26 Nov 2018 | 9:00 | Canopy temp (°C) | 33.38 | 0.4588 | 3.4612 | 2.03 | 0.21 | −0.03 |
| 26 Nov 2018 | 11:00 | Canopy temp (°C) | 43.53 | 0.8949 | 2.6859 | 2.17 | 0.4 | −0.30 |
| 14 Dec 2018 | 10:30 | Canopy temp (°C) | 33.53 | 0.4621 | 1.1932 | 2.03 | 0.44 | −0.38 |
Table 5.
Mean best linear unbiased prediction (BLUP), genetic (G) and error (E) variance components, genetic coefficient of variation (GCV) and broad-sense heritability (H2b) of indirect traits measured in the single-row experiment across all timepoints and single-row yield measured in September 2017.
| BLUP | G | E | GCV | H2b | |
|---|---|---|---|---|---|
| Canopy height (m) | 1.77 | 0.0106 | 0.0533 | 5.82 | 0.29 |
| Canopy cover | 0.52 | 0.0021 | 0.0032 | 7.26 | 0.56 |
| NDVI | 0.62 | 0.0006 | 0.0009 | 3.49 | 0.56 |
| Canopy temp (°C) | 26.69 | 0.0948 | 0.7778 | 1.15 | 0.20 |
| Single-row yield (t/ha) | 108.61 | 732.03 | 946.43 | 24.9 | 0.61 |
Table 6.
Genetic correlation between indirect traits in the single-row experiment and single-row yield based on average data across all timepoints.
Table 6.
Genetic correlation between indirect traits in the single-row experiment and single-row yield based on average data across all timepoints.
| Canopy Height | Canopy Cover | NDVI | Canopy Temp | |
|---|---|---|---|---|
| Canopy cover | 0.91 | |||
| NDVI | 0.67 | 0.68 | ||
| Canopy temp | −0.61 | −0.22 | −0.38 | |
| Single-row yield | 0.81 | 0.71 | 0.69 | −0.30 |
All values significant at 0.05 probability.
Table 7.
Mean best linear unbiased prediction (BLUP), genetic (G) and error (E) variance components, genetic coefficient of variation (GCV), broad-sense heritability (H2b) and genetic correlation with pure-stand yield (rg) of traits estimated in multi-row experiment consisting of 40 genotypes in three replicates at 4–6 months crop age.
| Date | Trait | BLUP | G | E | GCV | H2b | rg |
|---|---|---|---|---|---|---|---|
| 9 Aug 2017 | Canopy height (m) | 0.31 | 0.0001 | 0.0072 | 3.06 | 0.04 | - |
| Canopy cover | 0.06 | 0.0003 | 0.0003 | 29.06 | 0.74 | 0.40 | |
| NDVI | 0.26 | 0.0002 | 0.0004 | 6.01 | 0.66 | 0.43 | |
| 7 Nov 2017 | Canopy height (m) | 0.77 | 0.0529 | 0.0353 | 30.07 | 0.82 | 0.55 |
| Canopy cover | 0.64 | 0.0066 | 0.0048 | 12.74 | 0.80 | 0.66 | |
| NDVI | 0.62 | 0.0038 | 0.0017 | 9.90 | 0.87 | 0.65 | |
| 20 Dec 2017 | Canopy height (m) | 1.84 | 0.0486 | 0.0399 | 11.98 | 0.78 | 0.63 |
| Canopy cover | 0.79 | 0.0081 | 0.0099 | 11.30 | 0.71 | 0.32 | |
| NDVI | 0.84 | 0.0002 | 0.0003 | 1.63 | 0.63 | 0.80 | |
| 9 Jul 2018 | Pure-stand yield (t/ha) | 117.31 | 188.24 | 198.07 | 11.70 | 0.74 | - |
Table 8.
Genetic correlation of indirect traits in the multi-row experiment with pure-stand yield.
| Canopy Height | Canopy Cover | NDVI | |
|---|---|---|---|
| Canopy cover | 0.78 | ||
| NDVI | 0.98 | 0.85 | |
| Pure-stand yield | 0.70 | 0.72 | 0.83 |
Table 9.
Direct selection response for pure-stand yield (Rx), correlated selection response for pure-stand yield (CRx), and efficiency of indirect selection for pure-stand yield (CRx/Rx).
Table 9.
Direct selection response for pure-stand yield (Rx), correlated selection response for pure-stand yield (CRx), and efficiency of indirect selection for pure-stand yield (CRx/Rx).
| Rx | CRx | CRx/Rx | |
|---|---|---|---|
| Canopy height | - | 4.45 | 0.44 |
| Canopy cover | - | 6.38 | 0.64 |
| NDVI | - | 7.32 | 0.73 |
| Single-row yield | - | 4.51 | 0.45 |
| Pure-stand yield | 10.01 | - | - |
© 2019 by the authors. Licensee MDPI, Basel, Switzerland. This article is an open access article distributed under the terms and conditions of the Creative Commons Attribution (CC BY) license (http://creativecommons.org/licenses/by/4.0/).
Share and Cite
MDPI and ACS Style
Natarajan, S.; Basnayake, J.; Wei, X.; Lakshmanan, P. High-Throughput Phenotyping of Indirect Traits for Early-Stage Selection in Sugarcane Breeding. Remote Sens. 2019, 11, 2952. https://doi.org/10.3390/rs11242952
AMA Style
Natarajan S, Basnayake J, Wei X, Lakshmanan P. High-Throughput Phenotyping of Indirect Traits for Early-Stage Selection in Sugarcane Breeding. Remote Sensing. 2019; 11(24):2952. https://doi.org/10.3390/rs11242952
Chicago/Turabian StyleNatarajan, Sijesh, Jayampathi Basnayake, Xianming Wei, and Prakash Lakshmanan. 2019. "High-Throughput Phenotyping of Indirect Traits for Early-Stage Selection in Sugarcane Breeding" Remote Sensing 11, no. 24: 2952. https://doi.org/10.3390/rs11242952
Note that from the first issue of 2016, this journal uses article numbers instead of page numbers. See further details here.