Evolution of Surge-Type Glaciers in the Yangtze River Headwater Using Multi-Source Remote Sensing Data

1
Key Laboratory of Digital Earth Science, Aerospace Information Research Institute, Chinese Academy of Sciences, Beijing 100094, China
2
National Earthquake Response Support Service, Beijing 100049, China
3
School of Earth Sciences and Engineering, Nanjing University, Nanjing 210023, China
4
NASG Key Laboratory of Land Environment and Disaster Monitoring, China University of Mining and Technology, No. 1 Daxue Road, Xuzhou 221116, China
5
University of Chinese Academy of Sciences, Beijing 100049, China
*
Author to whom correspondence should be addressed.
Remote Sens. 2019, 11(24), 2991; https://doi.org/10.3390/rs11242991
Submission received: 7 November 2019
/
Revised: 9 December 2019
/
Accepted: 10 December 2019
/
Published: 12 December 2019
(This article belongs to the Special Issue Remote Sensing of Climatic and Environmental Changes over the Antarctic, Arctic, and the Qinghai-Tibet Plateau)
Abstract
:A surge-type glacier is a special and dangerous type of glacier, which can advance quickly in a short-time with cycles. Glaciers in the Yangtze River headwater are generally acknowledged to be in a stable state. However, not all of those glaciers are stable. In this paper, five glaciers from the Yangtze River headwater glacier were selected as the experimental subjects, and multi-source remote sensing images were used to study and analyze the surge behavior over the past 30 years. Based on the Landsat series data, ERS-2, and ENVISAT radar data, this paper extracts the glacier centerline information, glacial area information, and glacial flow velocity during different time periods from 1988 to 2018, which are used to monitor the active periods of glacier surges. We found three surge-type glaciers in the study area. The glacial characteristics of the three glaciers showed some drastic changes, they can advance quickly nearly 800 m in active periods, their area change can reach 2.0 × 10⁶ m2, and their flow velocity can suddenly increase by dozens of times. Surging periods and the initiated time of the three glaciers are different, which are locked in 1997, 2003, and 1997–1998. All those surges ended within one to two years. We suggest that the surges in this paper are dominated by hydrological conditions.

1. Introduction
Glacier movement can provide an important reference for glacier dynamics, material balance, atmospheric research, and other research [1,2,3]. As a special type of glacial movement, glacier surges will result in rapid advance in a very short period [4,5]. Glacier surges can cause many secondary disasters, which can block downstream rivers and cause floods, which will destroy downstream roads, destroy forests, engulf pastures, and even inundate villages. These disasters threaten the lives and property of nearby residents [6]. For example, a glacier in the Ali area of Tibet, surging in July 2017 with a large-scale ice collapse, formed a glacial collapse of about 10 square kilometers. The collapse of the glacier is about 0.7 billion cubic meters, equivalent to thousands of school grasslands. This disaster caused nine deaths, hundreds of livestock were missing, and large areas of grassland were inundated [7]. According to preliminary statistics, the phenomenon of glacier surges is becoming more and more frequent in High Mountain Asia [8,9]. Therefore, the study of glaciers, especially active glaciers, is of great significance.
According to the glacial speed and regulation of movement, glaciers are generally divided into two types, stable-type glaciers and surge-type glaciers [10]. A stable-type glacier has a health meltwater drainage system, and its glacier base can maintain stability. However, a surge-type glacier has an abnormal meltwater drainage system and advances quickly in its active periods (maybe a few meters, tens of meters, or even kilometers in hours, days, or weeks.) [11]. More seriously, most of the surges occur in regular cycles consisting of active phases and quiescent phases [12]. The main expression of surge-type glaciers is its intensity of movement in a short-period, such as advance distance and flow velocity. Glacier surges remain relatively poorly understood, depositing an increase in related research in recent years [13]. Glacial flow velocity can increase by one or two orders of magnitude within short-periods during its active phase, which is accompanied by large volumes of ice that are discharged from high to low elevations. Glaciers recharge their ice reservoirs at high elevation and recede across their ablation area during the quiescent phase [14].
Due to glacial remoteness and harsh environments, previous studies on surge-type glaciers have been limited to long-term observations, relying on historical data and meteorological data analysis [15,16]. The rapid development of remote sensing technology in the twentieth century has helped the in-depth study of glacier surges. The surging process has many obvious features, such as changes in the ice surface, glacial volume changes, glacial centerline changes, etc. We can use remote sensing images to study and understand this phenomenon [17]. Most studies of glacier surges using optical remote sensing images and techniques mainly includes visual interpretation based on a GIS platform [18], elevation monitoring technology based on remote sensing images [19], extracting glaciers information technology based on computer classification technology, and so on [20]. Budd et al. [21] studied glaciers with a two-dimensional model of a glacier and gave rise to three classes of glaciers with modes of flow. Lovell, AM et al. [22] successfully mapped the glacier location map, ice surface velocity map, and surface elevation map of the glacier near Nepal and studied the pattern of glacier movement. Bhambri et al. [23] used satellite data and historical data to explore the surging glaciers in the Karakorum region and explore the sensitivity of this type of glaciers to climate. Rashid et al. [24] used remote sensing images to study a surging glacier in Pakistan and calculate the velocity of nearly-glaciers and, finally, analyze the movement regulation of the surging glaciers. Steiner et al. [25] used the digital elevation system and the Landsat series of images to study the elevation changes and flow velocity change of glaciers and explored the glacier surges of the Karakoram region. Later, SAR data has become a crucial tool for surge-type glacier research owing to its characteristics to acquire images in both day and night in any weather conditions [26]. Based on SAR images, difference SAR interferometry (DInSAR), multiple aperture interferometric (MAI), and offset-tracking techniques are put forward and developed based on SAR data [27]. Strozzi et al. [28] discussed two image-to-image patch offset techniques for estimating feature motion between satellite synthetic aperture radar (SAR) images and examined the case of the surge of Monacobreen in Northern Svalbard between 1992 and 1996. Forster et al. [29] presented ice surface velocity maps from L-band interferometric synthetic aperture radar (InSAR) using PALSAR/ALOS data, and the results indicated that the speed of the Seward and Hubbard glaciers were up to 1.8 and 2.2 km/year respectively between January and March 2007.
There are many methods for studying glacier surges based on remote sensing data and technology. Each method has its own advantages and disadvantages. Optical remote sensing data has a wide time span and a large amount of data, which is very suitable for monitoring decade-scale changes. However, the disadvantage of optical remote sensing data is that the cloud can usually block the visibility of observed glaciers. SAR data can overcome the influence of cloud cover, but due to the short development history, the time span of SAR data is not long enough for detecting long-term glacier changes. By combining the advantages and disadvantages of various types of remote sensing data, this paper used multi-source remote sensing data to monitor and analyze five glaciers of the Yangtze River headwater glaciers in the Sanjiangyuan area and infer the surging period. At present, the research level of the glaciers in the Qinghai-Tibet Plateau is low, and this study in the Yangtze River headwater will provide very valuable monitoring research.
2. Study Area
The Qinghai-Tibet Plateau, known as the third pole of the world, has the largest mountain glaciers in the middle and low latitudes of the world [30]. Five large glacial gathering areas have been formed in the northwest and southwest of China, which are distributed in the Tianshan Mountains, the Pamirs, and the Kunlun Mountains; Karakorum Mountain and Tanggula Mountain [31].
The Tanggula Mountain is located in the Sanjiangyuan area of Qinghai Province. The Sanjiangyuan area is the “fresh water resource centre” in China, which supplies the main part of downstream rivers, such as the Yangtse River, the Yellow River, and the Lancang River [32]. In 2003, it was approved by the State department as a national nature reserve [33]. The Yangtze River has a length of 6380 km, which is the longest river in China and the third-longest in the world. The river originates from the Sanjiangyuan area, which has an average elevation of more than 5000 m and more than 100 glaciers [34]. The five glaciers in this paper are in the headwater glaciers of the Yangtze River (Figure 1). The red rectangle represents the study area, and the blue point represents the meteorological station (Figure 1a), In Figure 1b, the red line represents the five study glaciers in this paper, the red rectangle represents the study area, the blue point represents the meteorological station, and the blue line represents the SAR data region. In Figure 1c, the black lines represent the five study glaciers, which scattered from high altitude to low altitude. To facilitate statistics and research, we named the five glaciers as glacier A, glacier B, glacier C, glacier D, and glacier E, and the particular attributes of these five glaciers as shown in Table 1 (Glacier D and Glacier are attributes of G091104E33504N). The Global Land Ice Measurements from Space Monitoring the World’s Changing Glaciers (GLIMS) is a famous global project designed to monitor the world’s glaciers, and most glacier research uses its information to define study glaciers.
3. Data and Methods
3.1. Data
Based on multi-source data for long-term observation, we aimed to find suitable ways for synergistic observation in future work. We needed to find stable and reliable data types in mature papers. This paper selected the optical images (Landsat series satellites), the Synthetic Aperture Radar (SAR) data (ERS-2 satellite and ENVISAT satellite), and the Shuttle Radar Topography Mission (SRTM) elevation data to study decadal glacial movement.
3.1.1. Landsat 5/7/8
The Landsat series satellites with the Multispectral Scanner (MS), Thematic Mapper (TM), Enhanced Thematic Mapper Plus (ETM+) and Operational Land Imager (OLI) sensors was used in which a long-term continuous series of images provide continuous and effective data support to monitoring the surging glaciers over a long time [35]. The 15 optical remote sensing data used in this paper are from the United States Geological Survey (USGS), with a resolution of 30 m (Table S1) [36]. Although the Landsat series data has a short revisit time (16 days), the optical data of the study area spanning from 1988 to 2018 had a high cloud cover, so there is less high-quality data.
3.1.2. ERS-2/ENVISAT
The satellites with a synthetic aperture radar (SAR) sensor provide useful and high-quality data that is not influenced by the weather. The European Space Agency (ESA) launched the ERS2 satellite and ENVISAT satellite in April 1995 and March 2002, respectively, making them become the largest environmental satellites [37]. ERS2 satellite carries an SAR sensor, and ENVISAT satellite carries an ASAR sensor. SAR data can be observed not only all-day and all-weather but also has strong penetration [38]. The ASAR sensor of the ENVISAT satellite and the SAR sensor of the ERS-2 satellite have many similar parameters, such as incidence angle and resolution. The ASAR sensor of the ENVISAT satellite has made some improvements based on the ERS-2 SAR sensor [39]. The SAR data used in this paper are all descending orbits data, VV polarization mode, which spanned from 1996 to 2010 (Tables S2 and S3).
3.1.3. SRTM
This paper used digital elevation data to assist SAR data in calculating glacier surface velocity and to observe elevations in the study area [40]. We used the SRTM C-band digital elevation data. SRTM V3.1 with a spatial resolution of 30 m was used in the study, which can cover the studied glaciers in the Sanjiangyuan area, namely N33E090 and N33E091 (Table S4.).
3.2. Methods
The techniques of visual interpretation and offset-tracking were chosen in this study due to its benefits in the long-term observation of glaciers [41] On a temporal scale, the visual interpretation of Landsat series data provides obvious glacial information over years, we can easily lock the sensitive periods, and offset-tracking supports the glacial inner information over days or months. The techniques we chose are reliable in a glacial movement study.
3.2.1. The Method to Extract Glacial Flow Velocity
Landsat series images were chosen to provide glacier centerline and area information. There are many ways to access the glacial centerline and area, and the visual interpretation is an appropriate method with the highest accuracy rate. The acquired Landsat satellite images must undergo geometric correction and radiation correction, aiming to achieve quantitative remote sensing analysis. We combined the bands 543 of Landsat 5 and 7 images and the bands of 654 of Landsat 8 images to help with visual interpretation [42]. This paper calculated the glacier centerlines of 1988, 1991, 1993, 1994, 1997, 2000, 2001, 2002, 2003, 2004, 2005, 2009, 2013, 2016, and 2018. At the same time, we chose the same technique to extract glacier outlines in different years and calculate the area of the study glaciers [43].
3.2.2. Extraction of Glacial Flow Velocity
SAR images were elected to access glacial flow velocity information in this paper. An offset-tracking technique was chosen to calculate the glacial flow velocity because of its known low requirement of coherence to SAR data [44]. Comparing with other interferometry techniques of SAR images, the offset-tracking technique can access glacial flow velocities over a longer interval (dozens of days), which is suited for decadal observation. The core of the offset-tracking technique is a normalized cross-correlation algorithm, which accesses the offset value based on the intensity images of SAR [45]. Those two images are, respectively, named master image (earlier image) and slave image (later image), and needed to undergo a registration process before calculation. The key step is choosing a suitable reference window in the master image and matching it with a corresponding research window of the slave image. Then we could achieve the offset according to the calculated maximum coefficient of cross-correlation [46,47]. In this process of achieving glacial flow velocity, the offset between the master image and the slave image is calculated in slant-rang direction and azimuth direction. Finally, we can achieve the total offset with both slant-range and azimuth direction [48].
In this paper, we set the reference window size as 64 × 320 pixels, which forms a square patch and gives enough pixels to calculate the cross-correlation coefficient. The offset we calculated includes the glacial displacement, the orbital offset, the ionosphere offset, and topography-related offset. The orbital offset could be calculated by the SAR orbital parameters. The ionosphere offset could be ignored because the studied glaciers are located in mid or low latitude regions. The topography-related offset could be moved owing to the external DEM [49]. After removing the other offsets, we finally achieved the displacement of two SAR images. The geocoding process helped to transform the SAR coordinate system into a geographic coordinate system. Finally, we calculated the glacial velocity based on the interval of the master and slave images. The detailed process diagram is shown in Figure 2.
4. Results
4.1. Glacier Centerline and Area
The Landsat series data were easily affected by the cloud cover, and only 15 high-quality images were selected. The internal between two adjacent images was kept within one to three years. Due to the trouble of the Landsat 7 sensor since May 2003, two images (the day of 2003 and 2004) during the study period had strip-like data gaps. However, there is little influence in our study. The five glacial centerline information and area values were calculated based on visual interpretation. Figure 3 shows information of five glacier tongue outlines from 1988 to 2018. The base images are five glacier tongues from optical remote sensing of 1988, and the 15 different colored outlines represent information of the glacier tongue in different years over the past three decades. We can easily see the change during the past three decades. We can clearly see that the area and shape of the five glacier tongues change over the years. After accessing the glacier centerline and area the information, we repeated the work four times at different times and calculated the standard deviation. The results show that the standard deviation of the length of the glacier centerline does not exceed 26.2 m, and the standard deviation of the glacier area does not exceed 1000 m2. It proves that the results in this paper are reliable.
4.2. Glacier Flow Velocity
Due to the limitation of the SAR data, 10 ers-2 SAR images and 18 ENVISAT ASAR images, having the same orbit number and sensor, were selected in this experiment, and the offset-tracking technique was used to access the glacial flow velocities from 1996 to 2010. Figure 4 shows the glacial flow velocity maps. In Figure 4, the base image is studying the area’s SAR images, which has undergone a multi-looking process, and the colored raster data represents velocities in different periods. Due to larger intervals in some master images and slave images, a few areas have poor coherence and have no result of velocity. Fortunately, the vast majority of the results are good. We can directly observe the velocity change. The internal of master and slave images in this paper are kept within months as far as possible because the shorter periods can access a more accurate flow velocity. According to the regulation of the glacial flow velocity in Figure 4, we can summarize that the upper-glacier accelerated at first, and then, the state of accelerated motion slowly turns the glacial tongue in active periods. As to the accuracy assessment of the glacial flow velocity, several areas of non-ice region (The blue area in Figure 4a) were selected to calculate the displacement velocity. The average flow velocity of the non-ice area is 9.8 mm/d, which is far less than ice flow velocity. This can prove that the flow velocities in this manuscript are reliable.
4.3. The Evolution of Glacial Centerline and Area
The statistics of glacial centerline length and area achieved above can be used further summarization and analysis. The evolution of the glacial centerline length and areas are shown in Figure 5 and Figure 6. In order to intuitively display the change rate of the glacial centerline and area information, all statistics are subtracted by their respective values of 1988. We can easily get the change rate over the years and lock the glacial active phase.
4.3.1. The Glacial Centerline Evolution
According to the length of the evolution of the glacial centerline (Figure 5), the five glaciers’ centerline evolution all show a retreating trend from 1988 to 2018. However, each glacier has its own change characters. Glacier A, B, and E have fierce fluctuation periods, and Glacier C and D have a stable evolution over the past 30 years.
The centerline evolution of Glacier A indicates that the length firstly has continuously retracted from 1988 to 1997, then fiercely advanced from 1997 to 2000, and finally, showed a stable retracted trend from 2000 to 2018. It is estimated that the surging of Glacier A occurred between 1997 and 2000 based on the glacier centerline evolution information and the concept of surge-type glaciers. The centerline information of Glacier B shows that, firstly, the length has been continuously retracted from 1988 to 2000, then remained relatively stable from 2000 to 2002, fiercely advanced from 2002 to 2004, and finally became stable from 2004 to 2018. It is estimated that the surging event of Glacier B occurred between 2002 and 2004. Due to Glacier C and Glacier D showing a slow retreating trend from 1988 to 2018 and that there are no fierce movements in the studying period, we can infer that Glacier C and D have no surging phenomenon from 1988 to 2018. Glacier E’s glacier centerline evolution indicates a slight decrease from 1988 to 1997, a sharp decrease from 1997 to 2000, a sharp increase from 2002 to 2003, and a stable change from 2003 to 2018. It can be inferred that the surging event of Glacial E may have occurred in 2000–2003.
4.3.2. The Glacial Area Evolution
According to the evolution of the glacial area over the years (Figure 6), it is clear that nearly all of the statistics of the area show a retreating trend over the past 30 years. The only difference is Glacier A, B, and E, which have extraordinary experiences.
The area evolution of Glacier A indicates that the area has been continuously reduced from 1988 to 1994, slightly increased from 1994 to 1997, sharply increased from 1997 to 2000, and stably reduced from 2000 to 2018. From this, we can infer that the surging active phase of Glacier A occurred from 1997 to 2000. The area change of Glacier B indicates that the area has continuously reduced from 1988 to 2001, slightly rebounded from 2001 to 2002, increased sharply from 2002 to 2005, and stably reduced from 2005 to 2018. It can be speculated that the surging event of Glacier B occurred between 2002 and 2005. The area changes of Glacier C and D kept a stable retreat over the past three decades, and it is clear that Glacier C and D had no surging phenomenon from 1988 to 2018. The change in glacier area of Glacier E indicates a continuous and slight retreat from 1988 to 1997, a sudden increase from 1997 to 2002, and a steady decline from 2002 to 2018. It can be inferred that Glacier E had a surging event between 1997 and 2002.
According to the centerline and area evolution of the five study glaciers, we can analyze the glacial movement and further infer the glacial active surge periods. Generally, the regulation of the glacial centerline and area shows a retreat tendency, and the results of two ways maintain a high degree of consistency, such as Glacier A and B, which are typical glaciers with regular shape. Combining the results of the two ways of optical remote sensing data, we inferred that Glacier A had a surging event between 1997 and 2000. Glacier B had a surging event between 2002 and 2005 (possibly happened in 2002–2004). However, some specific glaciers, such as Glacier E, are slightly different from the typical glaciers. As to Glacier E, which has an irregular shape, the two conclusions accessed above are inconsistent. We need to use another useful method to reconfirm (such as experience interpretation in this paper). After an experienced interpretation based on optical remote sensing images (Figure 3), we can find that Glacier E had the most significant change of the glaciers between 1997 and 2000.
4.4. The Evolution of Glacial Flow Velocity
The interval between two adjacent optical remote sensing images in this study is still long. We can only infer the surging active phases over a long period. With the flow velocities, we can shorten the active phases to obtain more accurate results. Using the glacial flow velocities of the five studied glaciers, we extracted the velocity values along the centerline (the black curve in Figure 4a) for further studying and discussion. To display relevant information, we extracted the eight points on the centerline at equal intervals, which have undergone mean calculation with several surrounding points. Figure 7, Figure 8, Figure 9, Figure 10 and Figure 11 show the speed on the vertical axis and time on the horizontal axis. Each line represents the point we chose on the glacier’s centerline.
With the flow velocity information accessed above, we obtained the eight centerline point velocities of Glacier C and Glacier D from 1996 to 2010 (Figure 7 and Figure 8). From Figure 7, eight points’ velocities show similar rules. Namely, the velocities on Glacier C’s centerline keep stable from 1966 to 2010, the maximum speed does not exceed 200 mm/d, and the common speed is around 100 mm/d. It can be inferred that Glacier C has no surging phenomenon from 1996 to 2010. From Figure 8, Glacier D’s movement slightly fluctuates in some years. The maximum speed from 1996 to 1997 nearly reached 400 mm/d, and the normal speed is around 200 mm/d. The speed has no exponential increasing phenomenon during those years, so we inferred that Glacier D has no surging phenomenon from 1996 to 2010.
Based on the roughly monitored periods of surging with the optical images, we further monitored the surging period of Glacier A, Glacier B, and Glacier E. Based on the flow velocity values of the three glaciers, we can get the fitting trend maps of the three glaciers. According to the trend map (Figure 10, Figure 11 and Figure 12), we can further monitor the movement of the three glaciers. In general, the flow velocity of Glacier A changed sharply from 1996 to 2000 (Figure 10). The upper-middle area of Glacier A exceeded 1000 mm/d in April 1996 and reached its maximum in August 1996, in which some areas exceeded 4000 mm/d. In 1997, the movement was still intense, and the flow velocity surged to the end of the glacier. In July 1998, the flow velocity remained basically within 300 mm/d, and the normal state of motion was restored. During this time, the maximum speed of Glacier A (more than 4000 mm/d) is more than 10 times that of the general state (less than 300 mm/d), so a glacial surging event had happened, and the surging event may have occurred in 1997.
Although Glacier B has similar location information and elevation information to Glacier A, the movement of Glacier B is far less severe than Glacier A. The flow velocity of Glacier B suddenly increased in April 2003, and the velocity exceeded 800 mm/d. The flow velocity in the first half of 2004 was also around 400 mm/d. It is known that the movement gradually returned to normal at the end of 2004, and it remained within 150 mm/d. The maximum speed of Glacier B from 2003 to 2010 (more than 800 mm/d) is five times the normal speed (less than 150 mm/d). It can be speculated that Glacier B had a glacier surge event during this period, and the surging event possibly occurred in 2003.
In contrast, the movement of Glacier E is slower. Under normal conditions, Glacier E moves slowly, generally staying below 100 mm/d. In many cases, the flow velocity is about 50 mm/d, which is relatively stable. In April 1996, the glacier flow rate exceeded 150 mm/d. By July 1998, the glacier movement reached 250 mm/d, and some areas even approached 300 mm/d. After that, the glacier flow velocity gradually recovered. Based on the trend graph, we can infer that the Glacier E had a glacier jump in 1997–1998.
5. Discussion
With multi-source remote sensing data and methods, the five glacial active periods are respectively locked in one to two years. According to the concept and characteristics of surge-type glaciers, the surge events may occur in cycles, and we can infer the corresponding conclusion with the evolution of glacial centerline and area information, in which the withdraw and advance has obvious regularity. According to the principle of mass balance of glaciers [50], we found that the glacial centerline length and area will decrease before the surging and increase after the surging, which aims to maintain material balance. It is the accumulation state of glacial material and energy, and the state of income in the material balance [5]. Once accumulation or income is saturated, glacial surging occurs, that is, the release phase of glacial surging [4]. The complete glacial surging phenomenon realizes the income and expend of material energy and completes the stage of accumulation and release of ice and snow.
Many researches about surge-type glaciers have hypothesized that climate may be incentives for glacier surging, considering that dramatic changes in climate may lead to catastrophic events [51]. The nearest weather station to this study area is the Tuotuohe Station (Figure 1a). According to the accumulated summer precipitation and average summer temperature of Tuotuohe Station from 1970 to 2015 [52] (Figure 12 and Figure 13), it is easy to see that there were no extreme weather events in the study area between 1970 and 2015, and both precipitation and temperature show a slow upward trend. The five glaciers in this paper have highly similar external and internal conditions, such as similar elevation changes, climatic conditions, and so on. The experiment results show that some glaciers were surging and some glaciers remained stable, and the surging active periods are different. So, the warming of climate is not the dominant factor leading to the surging phenomenon in the five glaciers and might be a small factor with a positive effect.
Previous studies interpreted that hydrological and thermal controls are the reasons for the glacier surging phenomenon within the Tibet Plateau [53]. The hydrologically controlled surge front represents the boundary between an efficient tunnel drainage system in the up-glacier direction and an inefficient system in the down-glacier direction. Thermally controlled surges rely on a change in conditions at the bed, and the surge fronts, in this case, represent the transition between up-glacier and down-glacier [54,55]. The active phase of the hydrologically controlled surge is shorter, and the active phase thermally controlled surges is longer [56]. Lv et al. studied the Kelayayilake Glacier, which surged dramatically during the Spring of 2015 (From April to July), and came to the conclusion that hydrological factors controlled this surging event [51]. Lv et al. studied the 28 glaciers in Karakoram and found 13 surge-type glaciers. They suggest that both hydrological and thermal controls are important for surge initiation and recession, and the quickly-advanced and short-term surging glaciers were mainly dominated by hydrological control [57]. The periods of the active phase in this study area are all within one to two years, and those glaciers belong to quickly advanced and short-term surging glaciers. The results of glacial velocities show that the speed of up-glaciers pioneered increases firstly and then turns to glacial tongue. The climate change of Tuotuohe station shows that precipitation and temperature are not the fatal reasons for the surging phenomenon. Although we have no access to local hydrological data, we suggested that three glaciers in this paper were mainly controlled by hydrological conditions based on the glacial velocities change regulation and concept of surge-type glaciers.
6. Conclusions
This paper proposes a method based on multi-source remote sensing data to study and analyze the surge-type glaciers. Based on Landsat images and the result of offset-tracking on ERS-2 and ENVISAT radar data, we have extracted several kinds of glacial feature information in the Yangtze River headwater glaciers to studying the surge-type glaciers.
- (1)
- By analysis and quantifying the centerline and area change evolution of Landsat series data from 1988 to 2018, we affirm that Glacier A, B, E are surge-type glaciers, and the active phase of surging glaciers are being, respectively, roughly locked. Combining with glacial flow velocities of SAR data from 1996 to 2010, the active periods are locked in 1997, 2003, and 1997–1998.
- (2)
- According to the results in this paper, combined with the concept of surging phenomenon and previous study experience, we suggest the three surges are dominated by hydrological conditions, which aims to keep a balance of inner glaciers.
Supplementary Materials
The following Landsat-5, Landsat-7, Landsat-8 images SRTM data are available online at https://www.mdpi.com/2072-4292/11/24/2991/s1, Table S1: Landsat Series Image Information List. The following ERS-2 and ENVISAT data are available from the European Space Agency, Table S2: List of ERS-2 satellite radar data image information, Table S3: ENVISAT satellite radar data image information list, Table S4: SRTM data image information list.
Author Contributions
Conceptualization, G.L. and J.Y.; experimental design, G.L. and J.Y.; analysis, M.L.; execution, S.Y. and Z.R.; writing this paper, J.Y.
Funding
This research was funded by the National Natural Science Foundation of China, grant number 41590852, 41001264; Key Research Program of Frontier Sciences CAS, grant number QYZDY-SSW-DQC026; the program B for outstanding PhD candidates of Nanjing University.
Acknowledgments
We greatly appreciate the European Space Agency for the Envisat and ERS-2 data. The glacial detailed information from GLIMS are available online at https://www.glims.org. Landsat-5, Landsat-7, and Landsat-8 images are available online at http://glovis.usgs.gov. The SRTM data are available online at http://srtm.csi.cgiar.org/.
Conflicts of Interest
The authors declare no conflict of interest.
References
- Crowley, T.J. Atmospheric circulation patterns during glacial inception: A possible candidate. Quat. Res. 1984, 21, 105–110. [Google Scholar] [CrossRef]
- Yao, T.D.; Li, Z.; Yang, W.; Guo, X.; Zhu, L.; Kang, S.; Wu, Y.; Yu, W. Glacial distribution and mass balance in the Yarlung Zangbo River and its influence on lakes. Chin. Sci. Bull. 2010, 55, 2072–2078. [Google Scholar] [CrossRef]
- Hoffman, M.; Price, S. Feedbacks between coupled subglacial hydrology and glacier dynamics. J. Geophys. Res. Earth Surf. 2014, 119, 414–436. [Google Scholar] [CrossRef]
- Raymond, C.F. How do glaciers surge? A review. J. Geophys. Res. Solid Earth 1987, 92, 9121–9134. [Google Scholar] [CrossRef]
- Meier, M.F.; Post, A. What are glacier surges? Can. J. Earth Sci. 2011, 6, 807–817. [Google Scholar] [CrossRef]
- Bolch, T.; Buchroithner, M.F.; Peters, J.; Baessler, M.; Bajracharya, S. Identification of glacier motion and potentially dangerous glacial lakes in the Mt. Everest region/Nepal using spaceborne imagery. Nat. Hazards Earth Syst. Sci. 2008, 8, 1329–1340. [Google Scholar] [CrossRef] [Green Version]
- Kääb, A.; Leinss, S.; Gilbert, A.; Bühler, Y.; Yao, T. Massive collapse of two glaciers in western Tibet in 2016 after surge-like instability. Nat. Geosci. 2018, 11, 114–120. [Google Scholar] [CrossRef] [Green Version]
- Wang, N.L.; Zhang, X.S. Mountain glacier fluctuations and climatic change during the last 100 years. J. Glaciol. Geocryol. 1992, 14, 242–250. [Google Scholar]
- Liu, C.; Tong, L.; Shengwen, Q.I.; Zhang, S.; Zheng, B. Remote sensing investigation and influence factor analysis of glacier lake outburst potential in the Himalayas. Remote Sens. Land Resour. 2016, 28, 110–115. [Google Scholar]
- Clarke, G.K.C.; Blake, E.W. Geometric and thermal evolution of a surge-type glacier in its quiescent state: Trapridge Glacier, Yukon Territory, Canada, 1969–1989. J. Glaciol. 1991, 37, 158–169. [Google Scholar] [CrossRef] [Green Version]
- Sevestre, H.; Benn, D. Climatic and topographic controls on the distribution of surge-type glaciers: Implication for a unifying model of surging. In AGU Fall Meeting Abstracts; American Geophysical Union: Washington, DC, USA, 2014. [Google Scholar] [CrossRef]
- Robin, G.D.Q.; Weertman, J. Cyclic Surging of Glaciers. J. Glaciol. 1973, 12, 3–18. [Google Scholar] [CrossRef] [Green Version]
- Dowdeswell, J.A.; Hamilton, G.S.; Ove, H.J. The duration of the active phase on surge-type glaciers: Contrasts between Svalbard and other regions. J. Glaciol. 1991, 37, 388–400. [Google Scholar] [CrossRef] [Green Version]
- Hambrey, M.J.; Dowdeswell, J.A.; Murray, T. Thrusting and debris entrainment in a surging glacier: Bakaninbreen, Svalbard. Ann. Glaciol. 1996, 22, 241–248. [Google Scholar] [CrossRef]
- Kamb, B.; Raymond, C.F.; Harrison, W.D.; Engelhardt, H.; Echelmeyer, K.A.; Humphrey, N.; Brugman, M.M.; Pfeffer, T. Glacier Surge Mechanism: 1982-1983 Surge of Variegated Glacier, Alaska. Science 1985, 227, 469–479. [Google Scholar] [CrossRef] [PubMed] [Green Version]
- Kotlyakov, V.M.; Osipova, G.B.; Tsvetkov, D.G. Fluctuations of unstable mountain glaciers: Scale and character. Ann. Glaciol. 1996, 24, 338–343. [Google Scholar] [CrossRef] [Green Version]
- Clarke, G.K.C. Fast glacier flow: Ice streams, surging, and tidewater glaciers. J. Geophys. Res. Solid Earth 2012, 92, 8835–8841. [Google Scholar] [CrossRef]
- Kotlyakov, V.M.; Osipova, G.B.; Tsvetkov, D.G. Monitoring surging glaciers of the Pamirs, central Asia, from space. Ann. Glaciol. 2008, 48, 125–134. [Google Scholar] [CrossRef] [Green Version]
- Quincey, D.J.; Luckman, A.; Benn, D. Quantification of Everest region glacier velocities between 1992 and 2002, using satellite radar interferometry and feature tracking. J. Glaciol. 2009, 55, 596–606. [Google Scholar] [CrossRef] [Green Version]
- Goldstein, R.M.; Engelhardt, H.; Kamb, B.; Frolich, R.M. Satellite Radar Interferometry for Monitoring Ice Sheet Motion: Application to an Antarctic Ice Stream. Science 1993, 262, 1525–1530. [Google Scholar] [CrossRef]
- Budd, W.F. A First Simple Model for Periodically Self-Surging Glaciers. J. Glaciol. 2017, 14, 3–21. [Google Scholar] [CrossRef]
- Lovell, A.M.; Carr, J.R.; Stokes, C.R. Topographic controls on the surging behaviour of Sabche Glacier, Nepal (1967 to 2017). Remote Sens. Environ. 2018, 210, 434–443. [Google Scholar] [CrossRef] [Green Version]
- Bhambri, R.; Hewitt, K.; Kawishwar, P.; Pratap, B. Surge-type and surge-modified glaciers in the Karakoram. Sci. Rep. 2017, 7. [Google Scholar] [CrossRef] [PubMed]
- Rashid, I.; Abdullah, T.; Glasser, N.F.; Naz, H.; Romshoo, S.A. Surge of Hispar Glacier, Pakistan, between 2013 and 2017 detected from remote sensing observations. Geomorphology 2018, 303, 410–416. [Google Scholar] [CrossRef] [Green Version]
- Steiner, J.F.; Kraaijenbrink, P.D.A.; Jiduc, S.G. Brief communication: The Khurdopin glacier surge revisited – extreme flow velocities and formation of a dammed lake in 2017. Cryosphere 2018, 12, 95–101. [Google Scholar] [CrossRef] [Green Version]
- Schneevoigt, N.J.; Sund, M.; Bogren, W. Glacier displacement on Comfortlessbreen, Svalbard, using 2-pass differential SAR interferometry (DInSAR) with a digital elevation model. Polar Rec. 2012, 48, 17–25. [Google Scholar] [CrossRef]
- Fatland, D.R.; Lingle, C.S. Analysis of the 1993–1995 Bering Glacier (Alaska) surge using differential SAR interferometry. J. Glaciol. 1998, 44, 532–546. [Google Scholar] [CrossRef] [Green Version]
- Strozzi, T. Glacier motion estimation using SAR offset-tracking procedures. Geosci. Remote Sens. IEEE 2002, 40, 2384–2391. [Google Scholar] [CrossRef] [Green Version]
- Forster, R.R.; Jezek, K.C.; Koenig, L. Measurement of glacier geophysical properties from InSAR wrapped phase. IEEE Trans. Geosci. Remote Sens. 2003, 41, 2595–2604. [Google Scholar] [CrossRef]
- Ke, L.; Xiaoli, D.; Wenkai, L.; Bo, Q. Remote Sensing of Glacier Change in the Central Qinghai-Tibet Plateau and the Relationship with Changing Climate. Remote Sens. 2017, 9, 114. [Google Scholar] [CrossRef] [Green Version]
- Wang, Z.; Huian, Y. Characteristics of the distribution of glaciers in China. Ann. Glaciol. 2001, 16, 17–20. [Google Scholar]
- Liu, C.H.; Shi, Y.F.; Wang, Z.T.; Xie, Z.C. Glacier Resources and Their Distributive Characteristics in China—A Review on Chinese Glacier Inventory. J. Glaciol. Geocryol. 2000, 22, 106–112. [Google Scholar]
- Jiang, J. Primary analyse of water resource, disasters and environment in the Changjiang river catchment. Quat. Sci. 2004, 24, 512–517. [Google Scholar]
- Dai, S.; Yang, S. Variations in Water Resources of the Yangtze River over the Last Five Decades. J. Nat. Resour. 2006, 21, 501–506. [Google Scholar]
- Jiang, G.; Han, B.; Gao, Y.; Yang, C. Review of 40-year earth observation with Landsat series and prospects of LDCM. J. Remote Sens. 2013, 17, 1033–1048. [Google Scholar]
- Andreassen, L.M.; Paul, F. The new Landsat-derived glacier inventory for Jotunheimen, Norway, and deduced glacier changes since the 1930s. Cryosphere 2008, 2, 131–145. [Google Scholar] [CrossRef] [Green Version]
- Edwards, S.; Moore, P.; King, M. A Comparison of ERS-2/ENVISAT and TOPEX/JASON-1 Tropospheric Zenith Wet Delay Measurements with Estimates from Offshore GPS Data. In AGU Fall Meeting Abstracts; American Geophysical Union: Washington, DC, USA, 2003. [Google Scholar]
- Rignot, E.J.M.; van Zyl, J.J. Change detection techniques for ERS-1 SAR data. IEEE Trans. Geosci. Remote Sens. 1993, 31, 896–906. [Google Scholar] [CrossRef] [Green Version]
- Tian, X. Large-scale forest mapping based on ERS-1/2 and Envisat ASAR data. J. Beijing For. Univ. 2013, 35, 7–15. [Google Scholar]
- Surazakov, A.B.; Aizen, V.B. Estimating volume change of mountain glaciers using SRTM and map-based topographic data. IEEE Trans. Geosci. Remote Sens. 2006, 44, 2991–2995. [Google Scholar] [CrossRef]
- Benjamin, A.B. Automated classification of debris-covered glaciers combining optical, SAR and topographic data in an object-based environment. Remote Sens. Environ. 2015, 170, 372–387. [Google Scholar]
- Chander, G.; Markham, B.L.; Helder, D.L. Summary of current radiometric calibration coefficients for Landsat MSS, TM, ETM+, and EO-1 ALI sensors. Remote Sens. Environ. 2009, 113, 893–903. [Google Scholar] [CrossRef]
- Wang, G.; Zhang, T.; Zhang, J.; Hua, W.U.; Yang, Q.; Xiyou, G.E. Comparative Study of Glaciers Information Extraction Method Based on Remote Sensing Image. Geospat. Inf. 2010, 8, 43–46. [Google Scholar]
- Luckman, A.; Quincey, D.; Bevan, S. The potential of satellite radar interferometry and feature tracking for monitoring flow rates of Himalayan glaciers. Remote Sens. Environ. 2007, 111, 172–181. [Google Scholar] [CrossRef]
- Huang, L.; Li, Z. Comparison of SAR and optical data in deriving glacier velocity with feature tracking. Int. J. Remote Sens. 2011, 32, 2681–2698. [Google Scholar] [CrossRef]
- Guo, H. Glacier surface velocity estimation in the West Kunlun Mountain range from L-band ALOS/PALSAR images using modified synthetic aperture radar offset-tracking procedure. J. Appl. Remote Sens. 2013, 8. [Google Scholar] [CrossRef] [Green Version]
- Yan, S.; Guo, H.; Liu, G.; Ruan, Z. Mountain glacier displacement estimation using a DEM-assisted offset tracking method with ALOS/PALSAR data. Remote Sens. Lett. 2013, 4, 494–503. [Google Scholar] [CrossRef]
- Yan, S.; Liu, G.; Wang, Y.; Perski, Z.; Ruan, Z. Glacier surface motion pattern in the Eastern part of West Kunlun Shan estimation using pixel-tracking with PALSAR imagery. Environ. Earth Sci. 2015, 74, 1871–1881. [Google Scholar] [CrossRef]
- Jia, L.; Li, Z.W.; Wang, C.C.; Zhu, J.J.; Ding, X.L. Using SAR offset-tracking approach to estimate surface motion of the South Inylchek Glacier in Tianshan. Chin. J. Geophys. 2013, 56, 1226–1236. [Google Scholar]
- Nuth, C.; Schuler, T.V.; Kohler, J.; Altena, B.; Hagen, J.O. Estimating the long-term calving flux of Kronebreen, Svalbard from geodetic elevation changes and mass-balance modelling. J. Glaciol. 2012, 58, 119–133. [Google Scholar] [CrossRef] [Green Version]
- Lv, M.; Lu, X.; Guo, H.; Liu, G.; Ding, Y.; Ruan, Z.; Ren, Y.; Yan, S. A rapid glacier surge on Mount Tobe Feng, western China, 2015. J. Glaciol. 2016, 62, 1–3. [Google Scholar] [CrossRef] [Green Version]
- Liu, G.; Guo, H.; Yan, S.; Song, R.; Ruan, Z.; Lv, M. Revealing the surge behaviour of the Yangtze River headwater glacier during 1989–2015 with TanDEM-X and Landsat images. J. Glaciol. 2017, 63, 382–386. [Google Scholar] [CrossRef] [Green Version]
- Fowler, A.C.; Murray, T.; Ng, F.S.L. Thermally controlled glacier surging. J. Glaciol. 2017, 47, 527–538. [Google Scholar] [CrossRef] [Green Version]
- Dunse, T.; Schellenberger, T.; Kaab, A.; Schuler, T.V. Glacier-surge mechanisms promoted by a hydro-thermodynamic feedback to summer melt. Cryosphere 2015, 9, 197–215. [Google Scholar] [CrossRef] [Green Version]
- Quincey, D.J.; Glasser, N.F.; Cook, S.J.; Luckman, A. Heterogeneity in Karakoram glacier surges. J. Geophys. Res. Earth Surf. 2015, 120, 1288–1300. [Google Scholar] [CrossRef] [Green Version]
- Hewitt, K. Tributary glacier surges: An exceptional concentration at Panmah Glacier, Karakoram Himalaya. J. Glaciol. 2017, 53, 181–188. [Google Scholar] [CrossRef] [Green Version]
- Lv, M.; Guo, H.; Lu, X. Characterizing the behaviour of surge- and non-surge-type glaciers in the Kingata Mountains, eastern Pamir, from 1999 to 2016. Cryosphere 2019, 13, 219–236. [Google Scholar] [CrossRef] [Green Version]
Figure 1.
(a) Location of study area in the west of China; (b) location of the Yangtze River headwater glaciers; (c) elevation of the study area, and the blue lines represent the five studying glaciers.
Figure 1.
(a) Location of study area in the west of China; (b) location of the Yangtze River headwater glaciers; (c) elevation of the study area, and the blue lines represent the five studying glaciers.
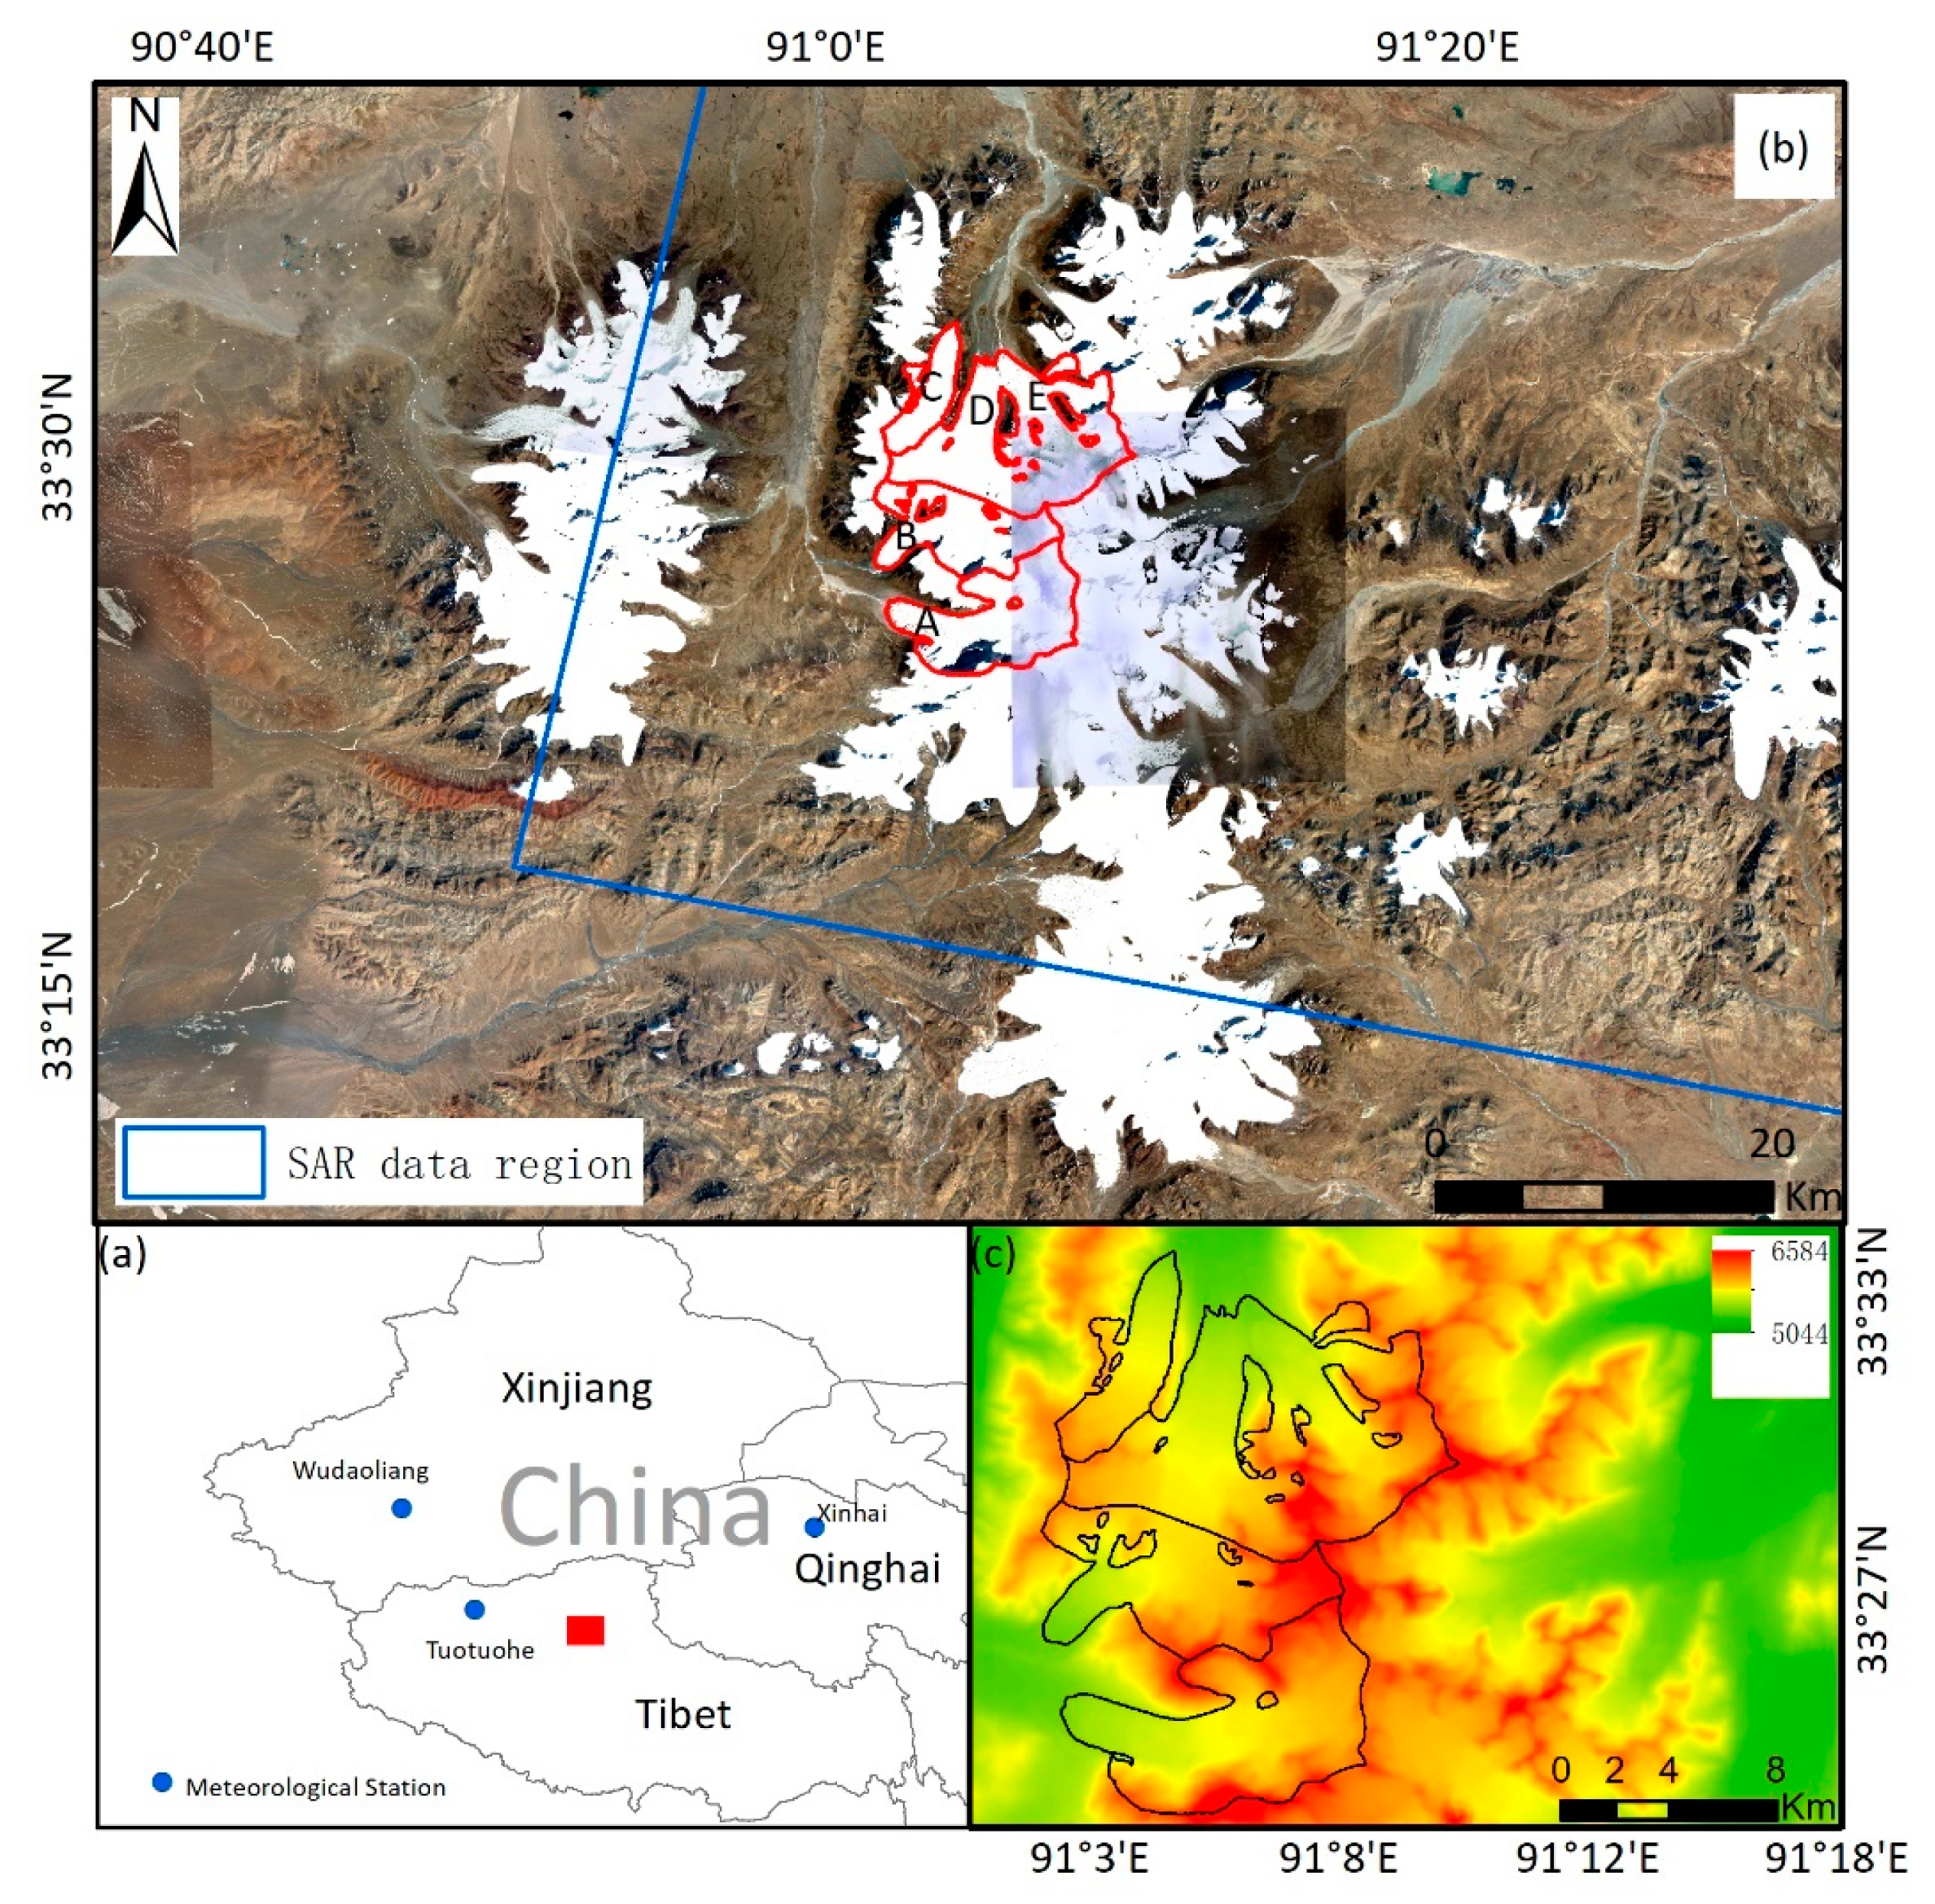
Figure 2.
The flowchart of the offset-tracking technique using SAR data.
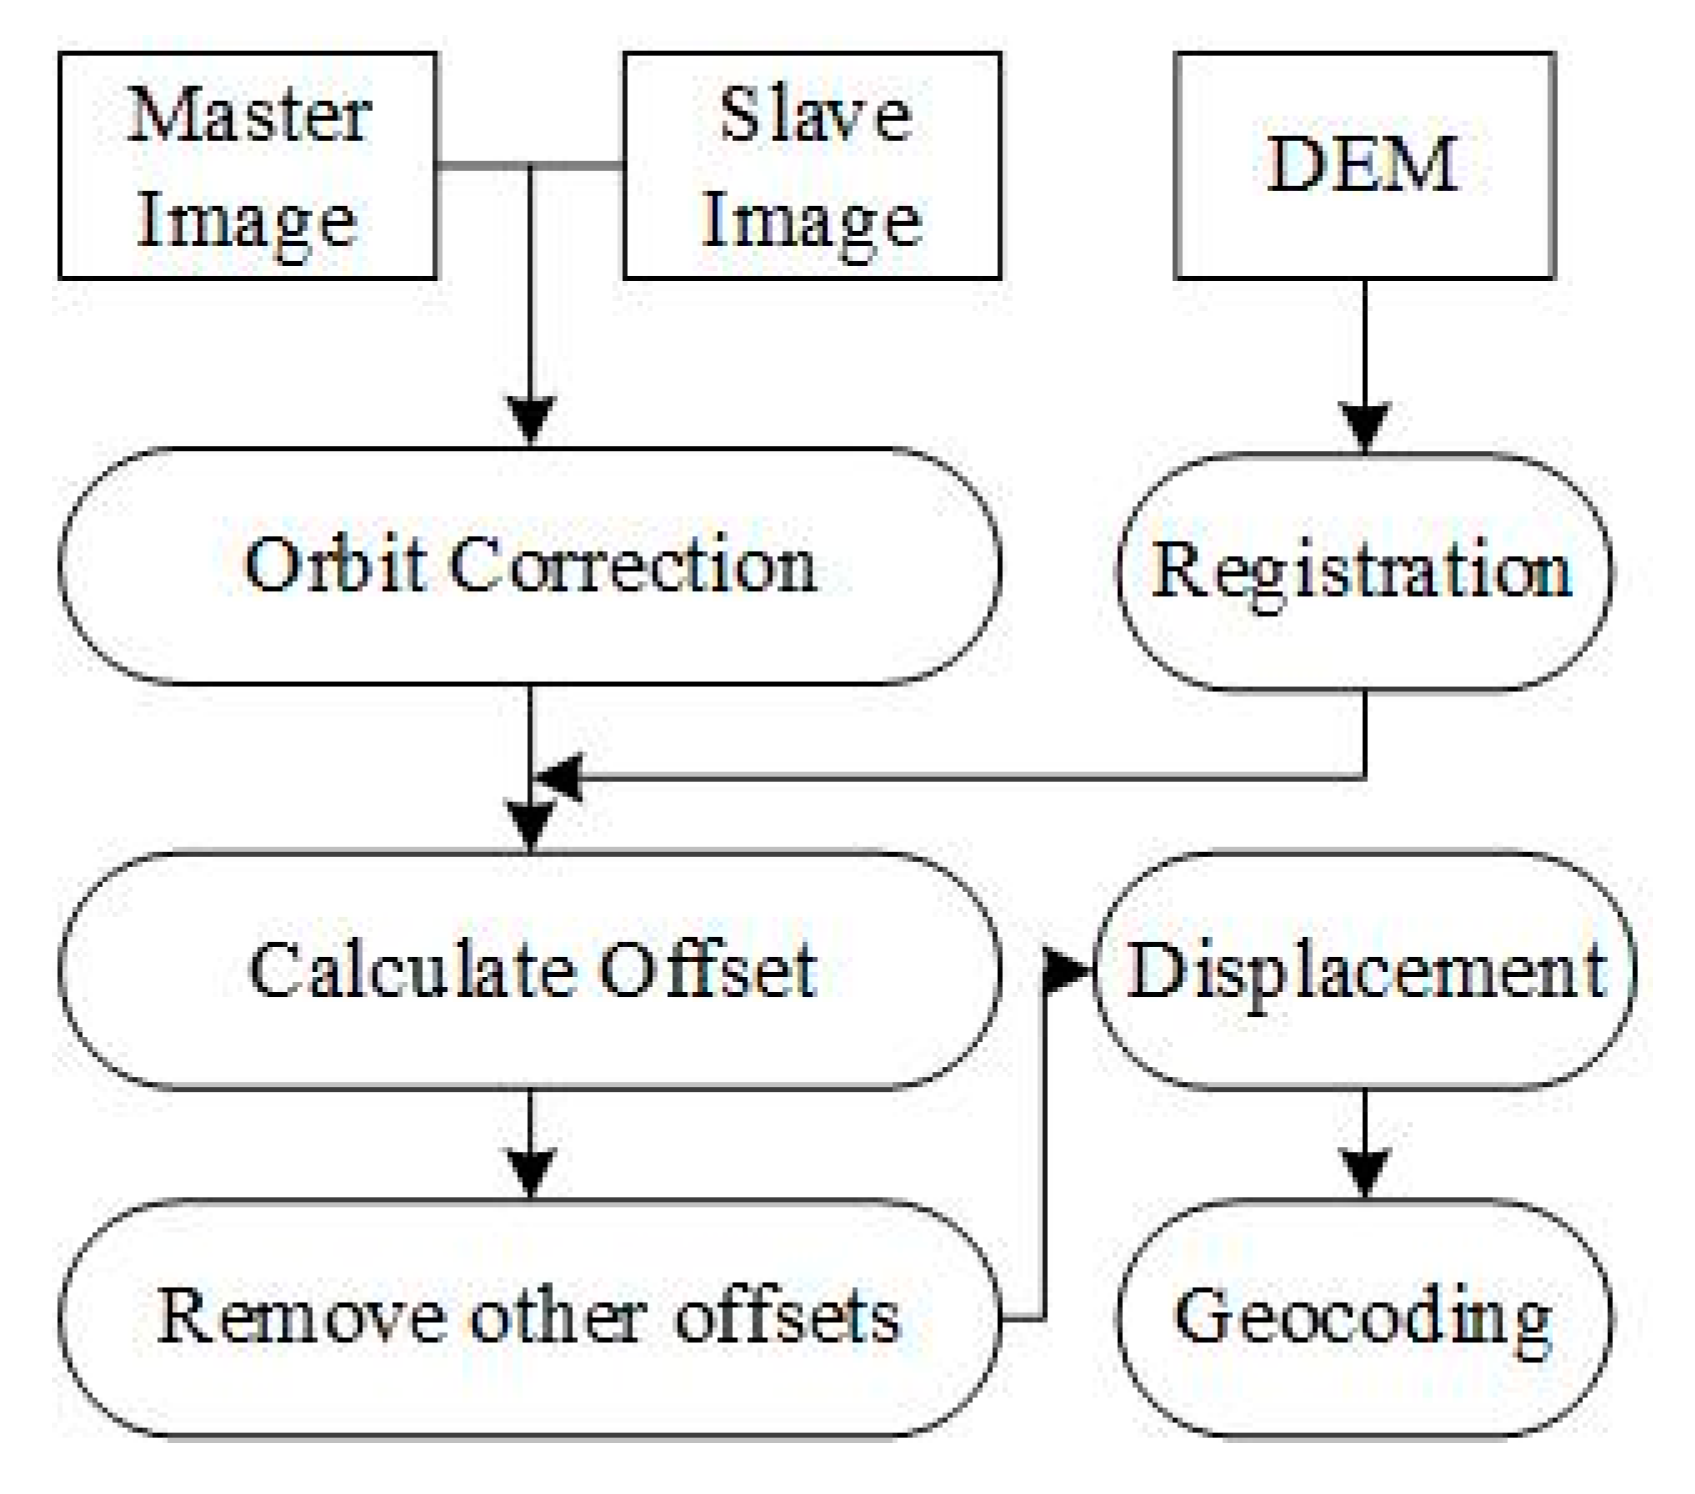
Figure 3.
Outline of glacier tongue of five study glaciers from 1988 to 2018.
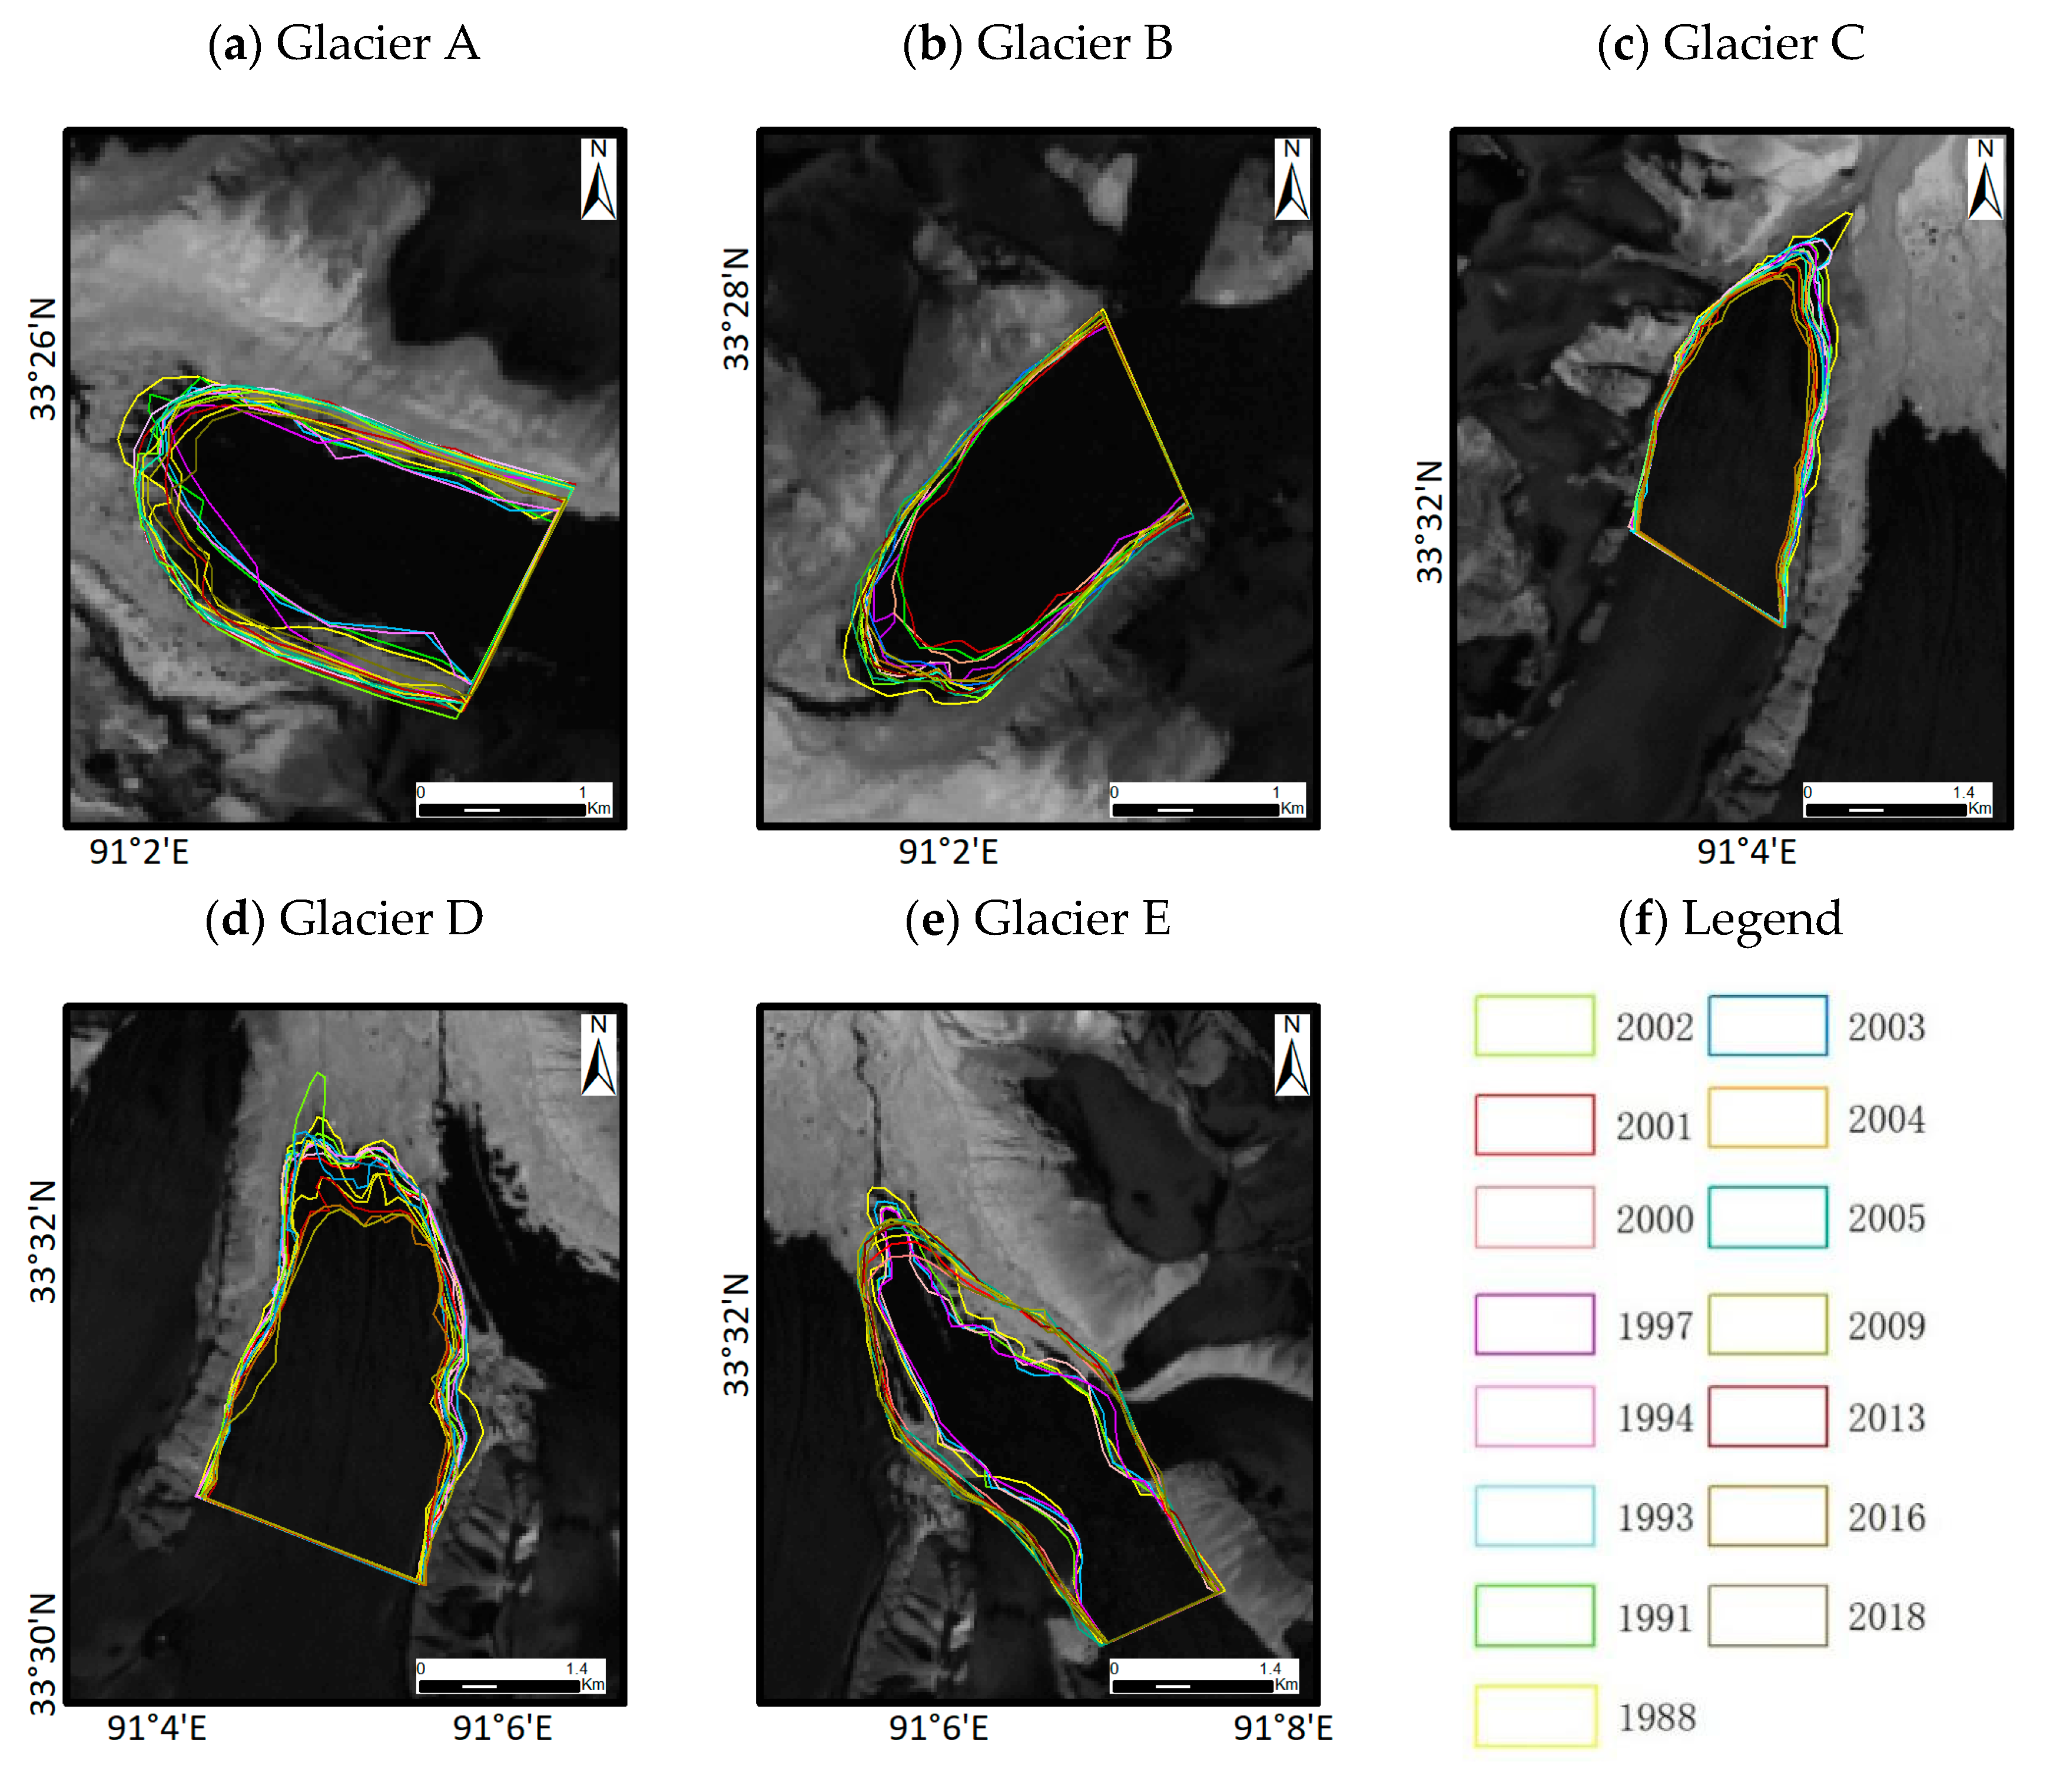
Figure 4.
Glacial flow velocity of the study area from 1996 to 2010.
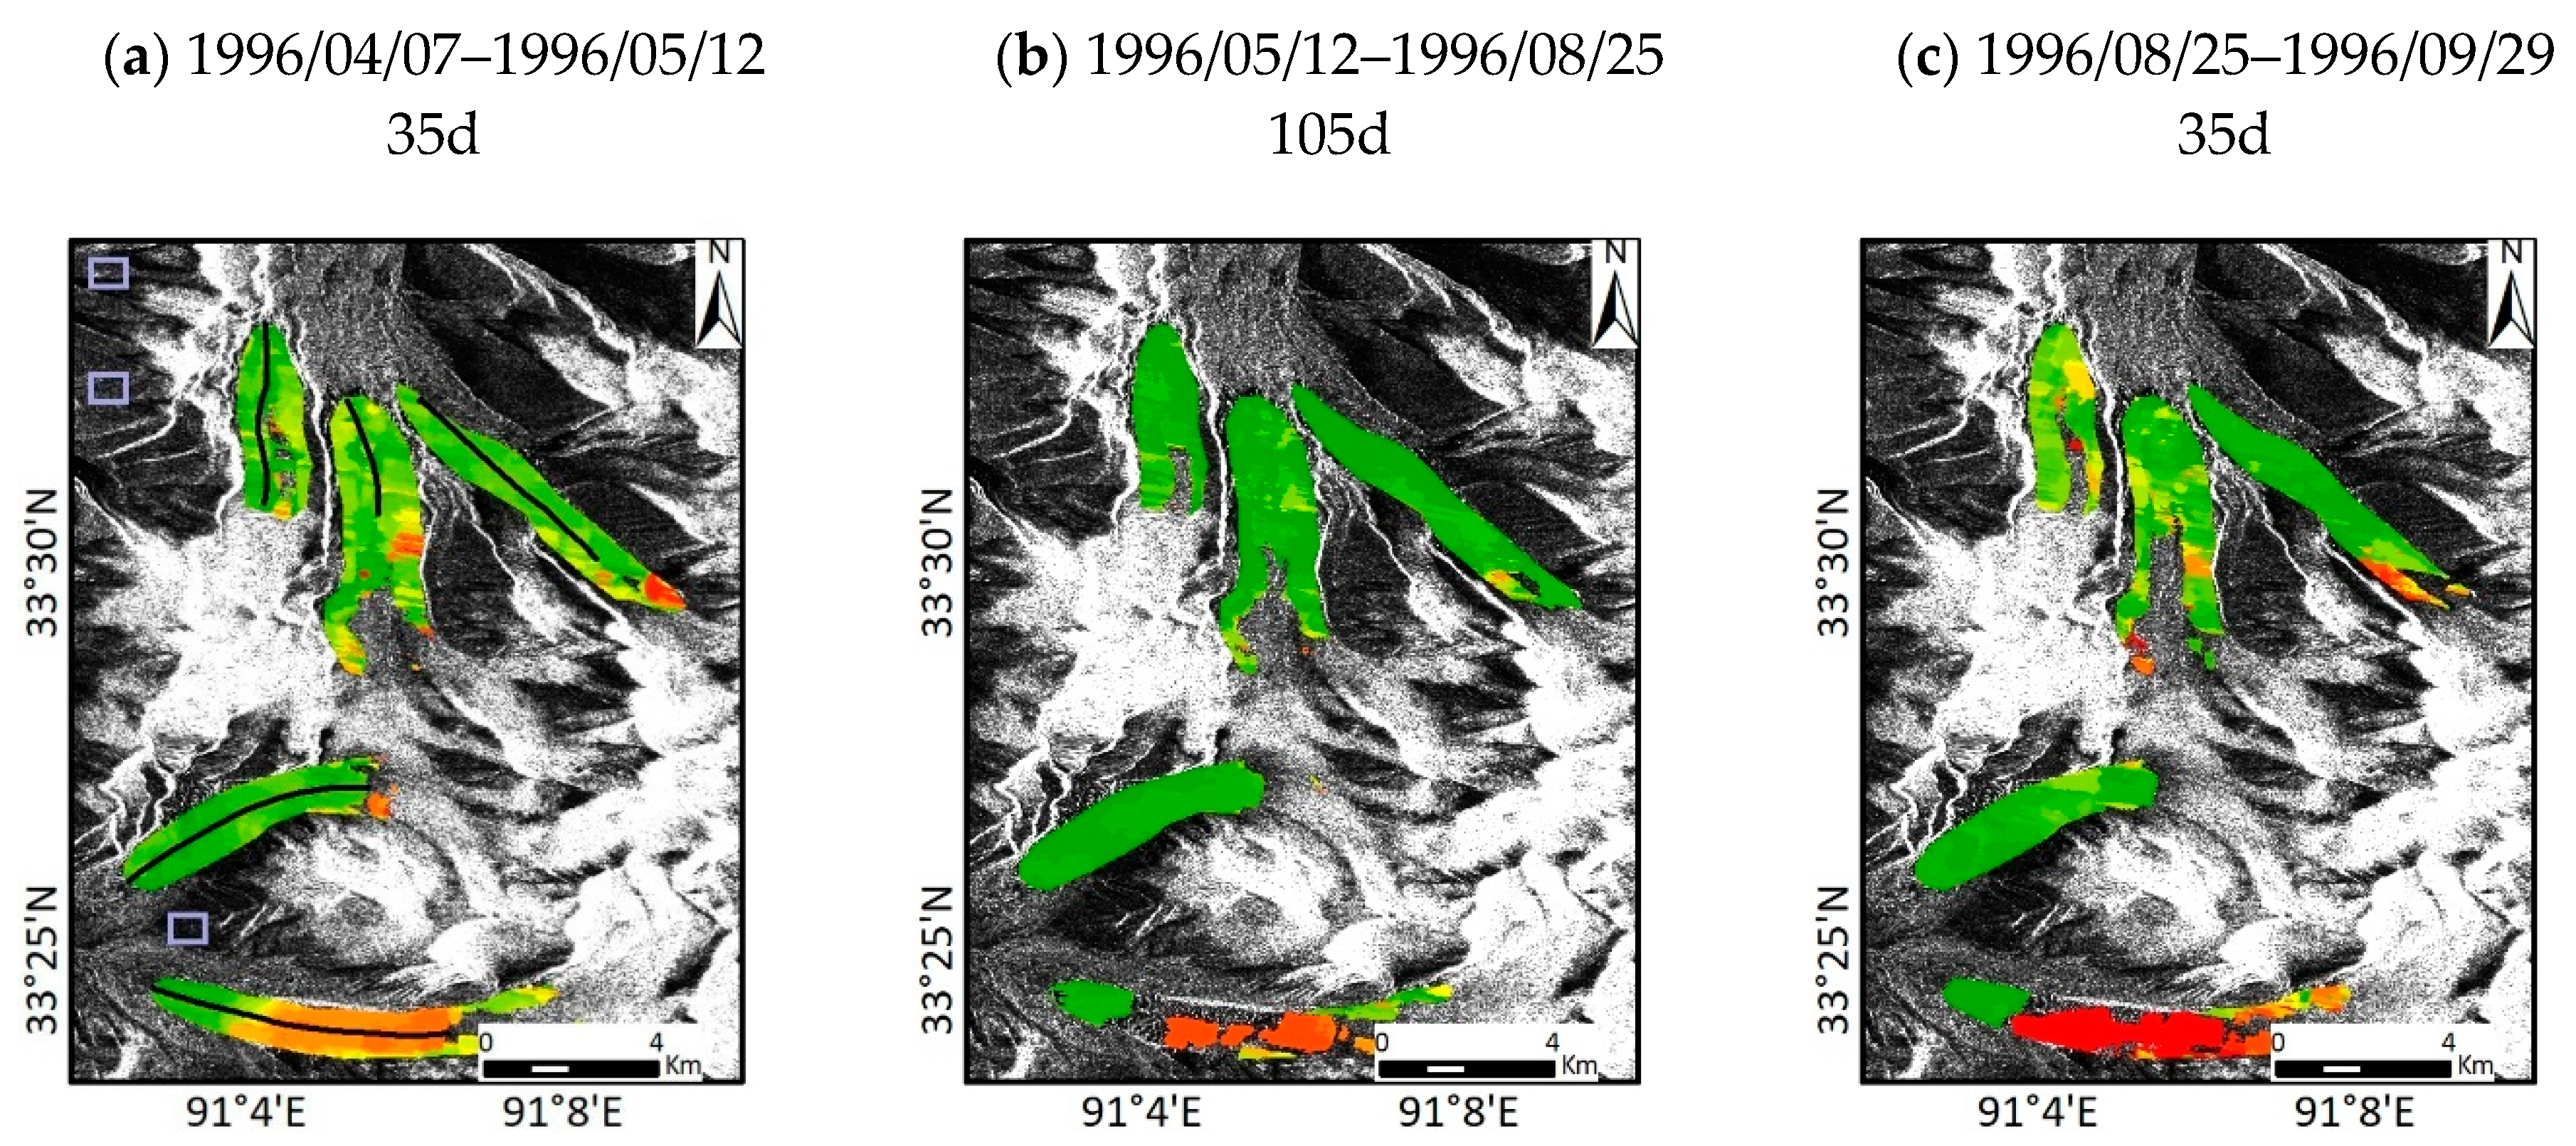
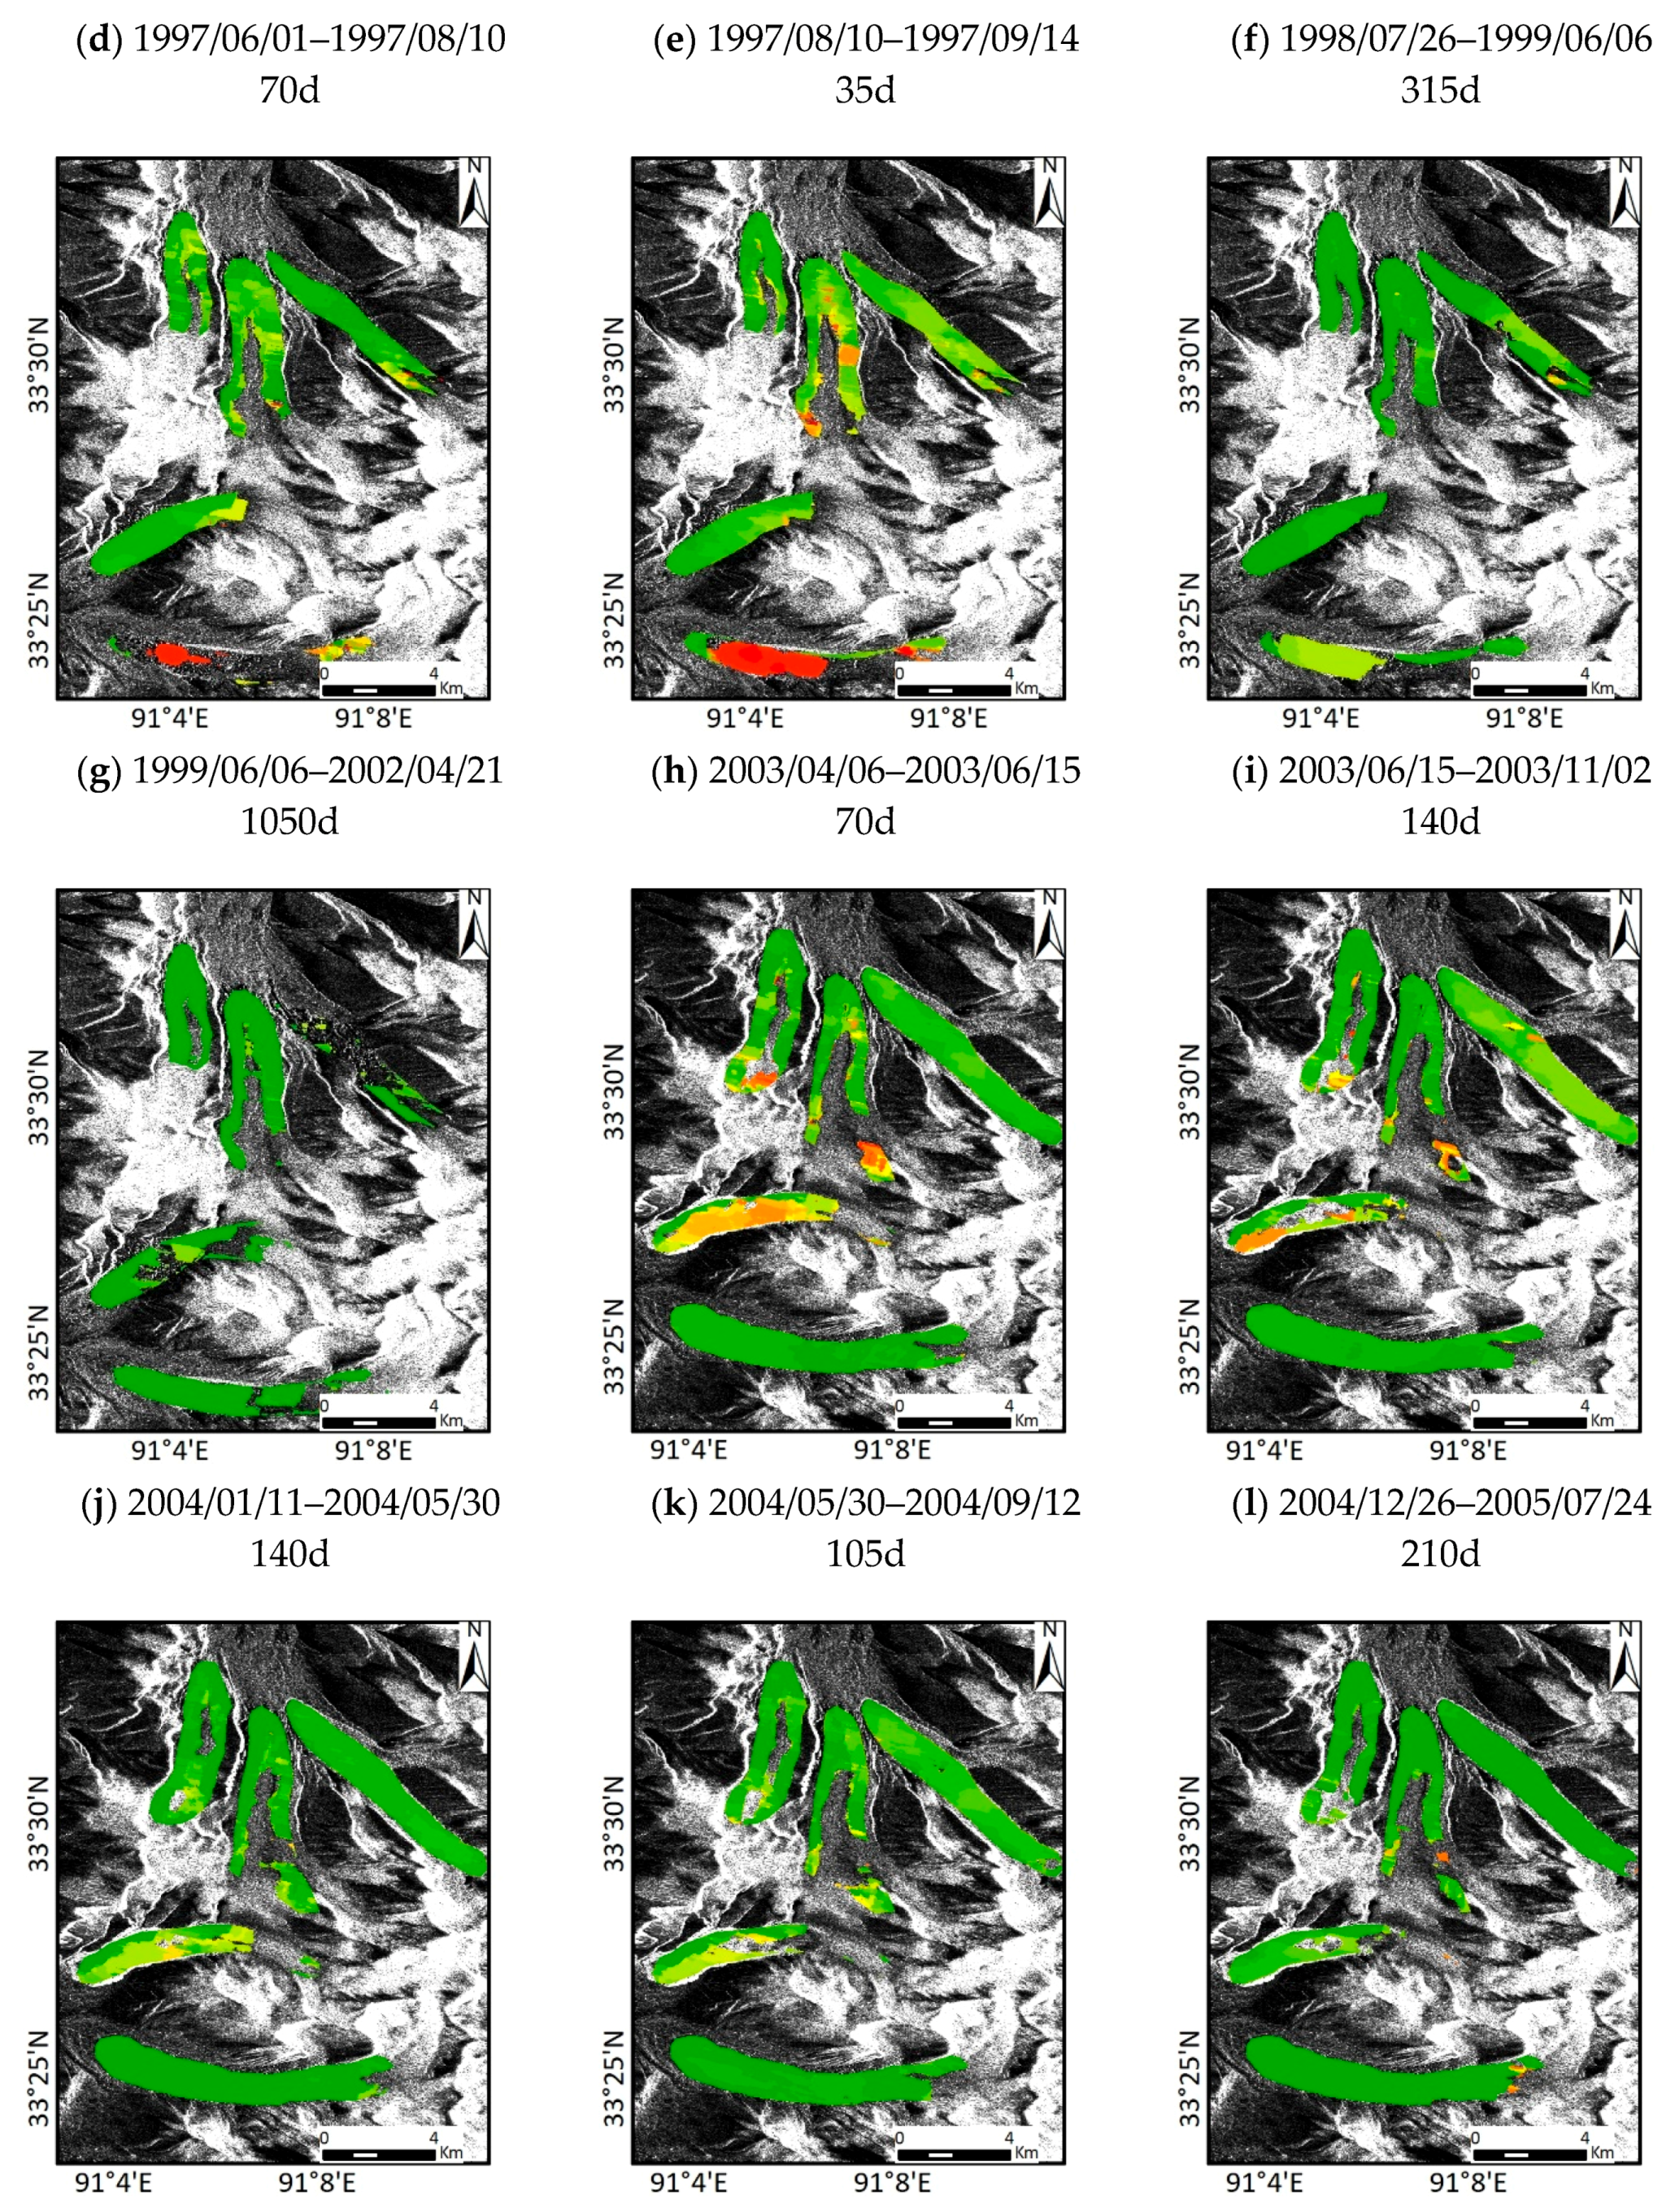
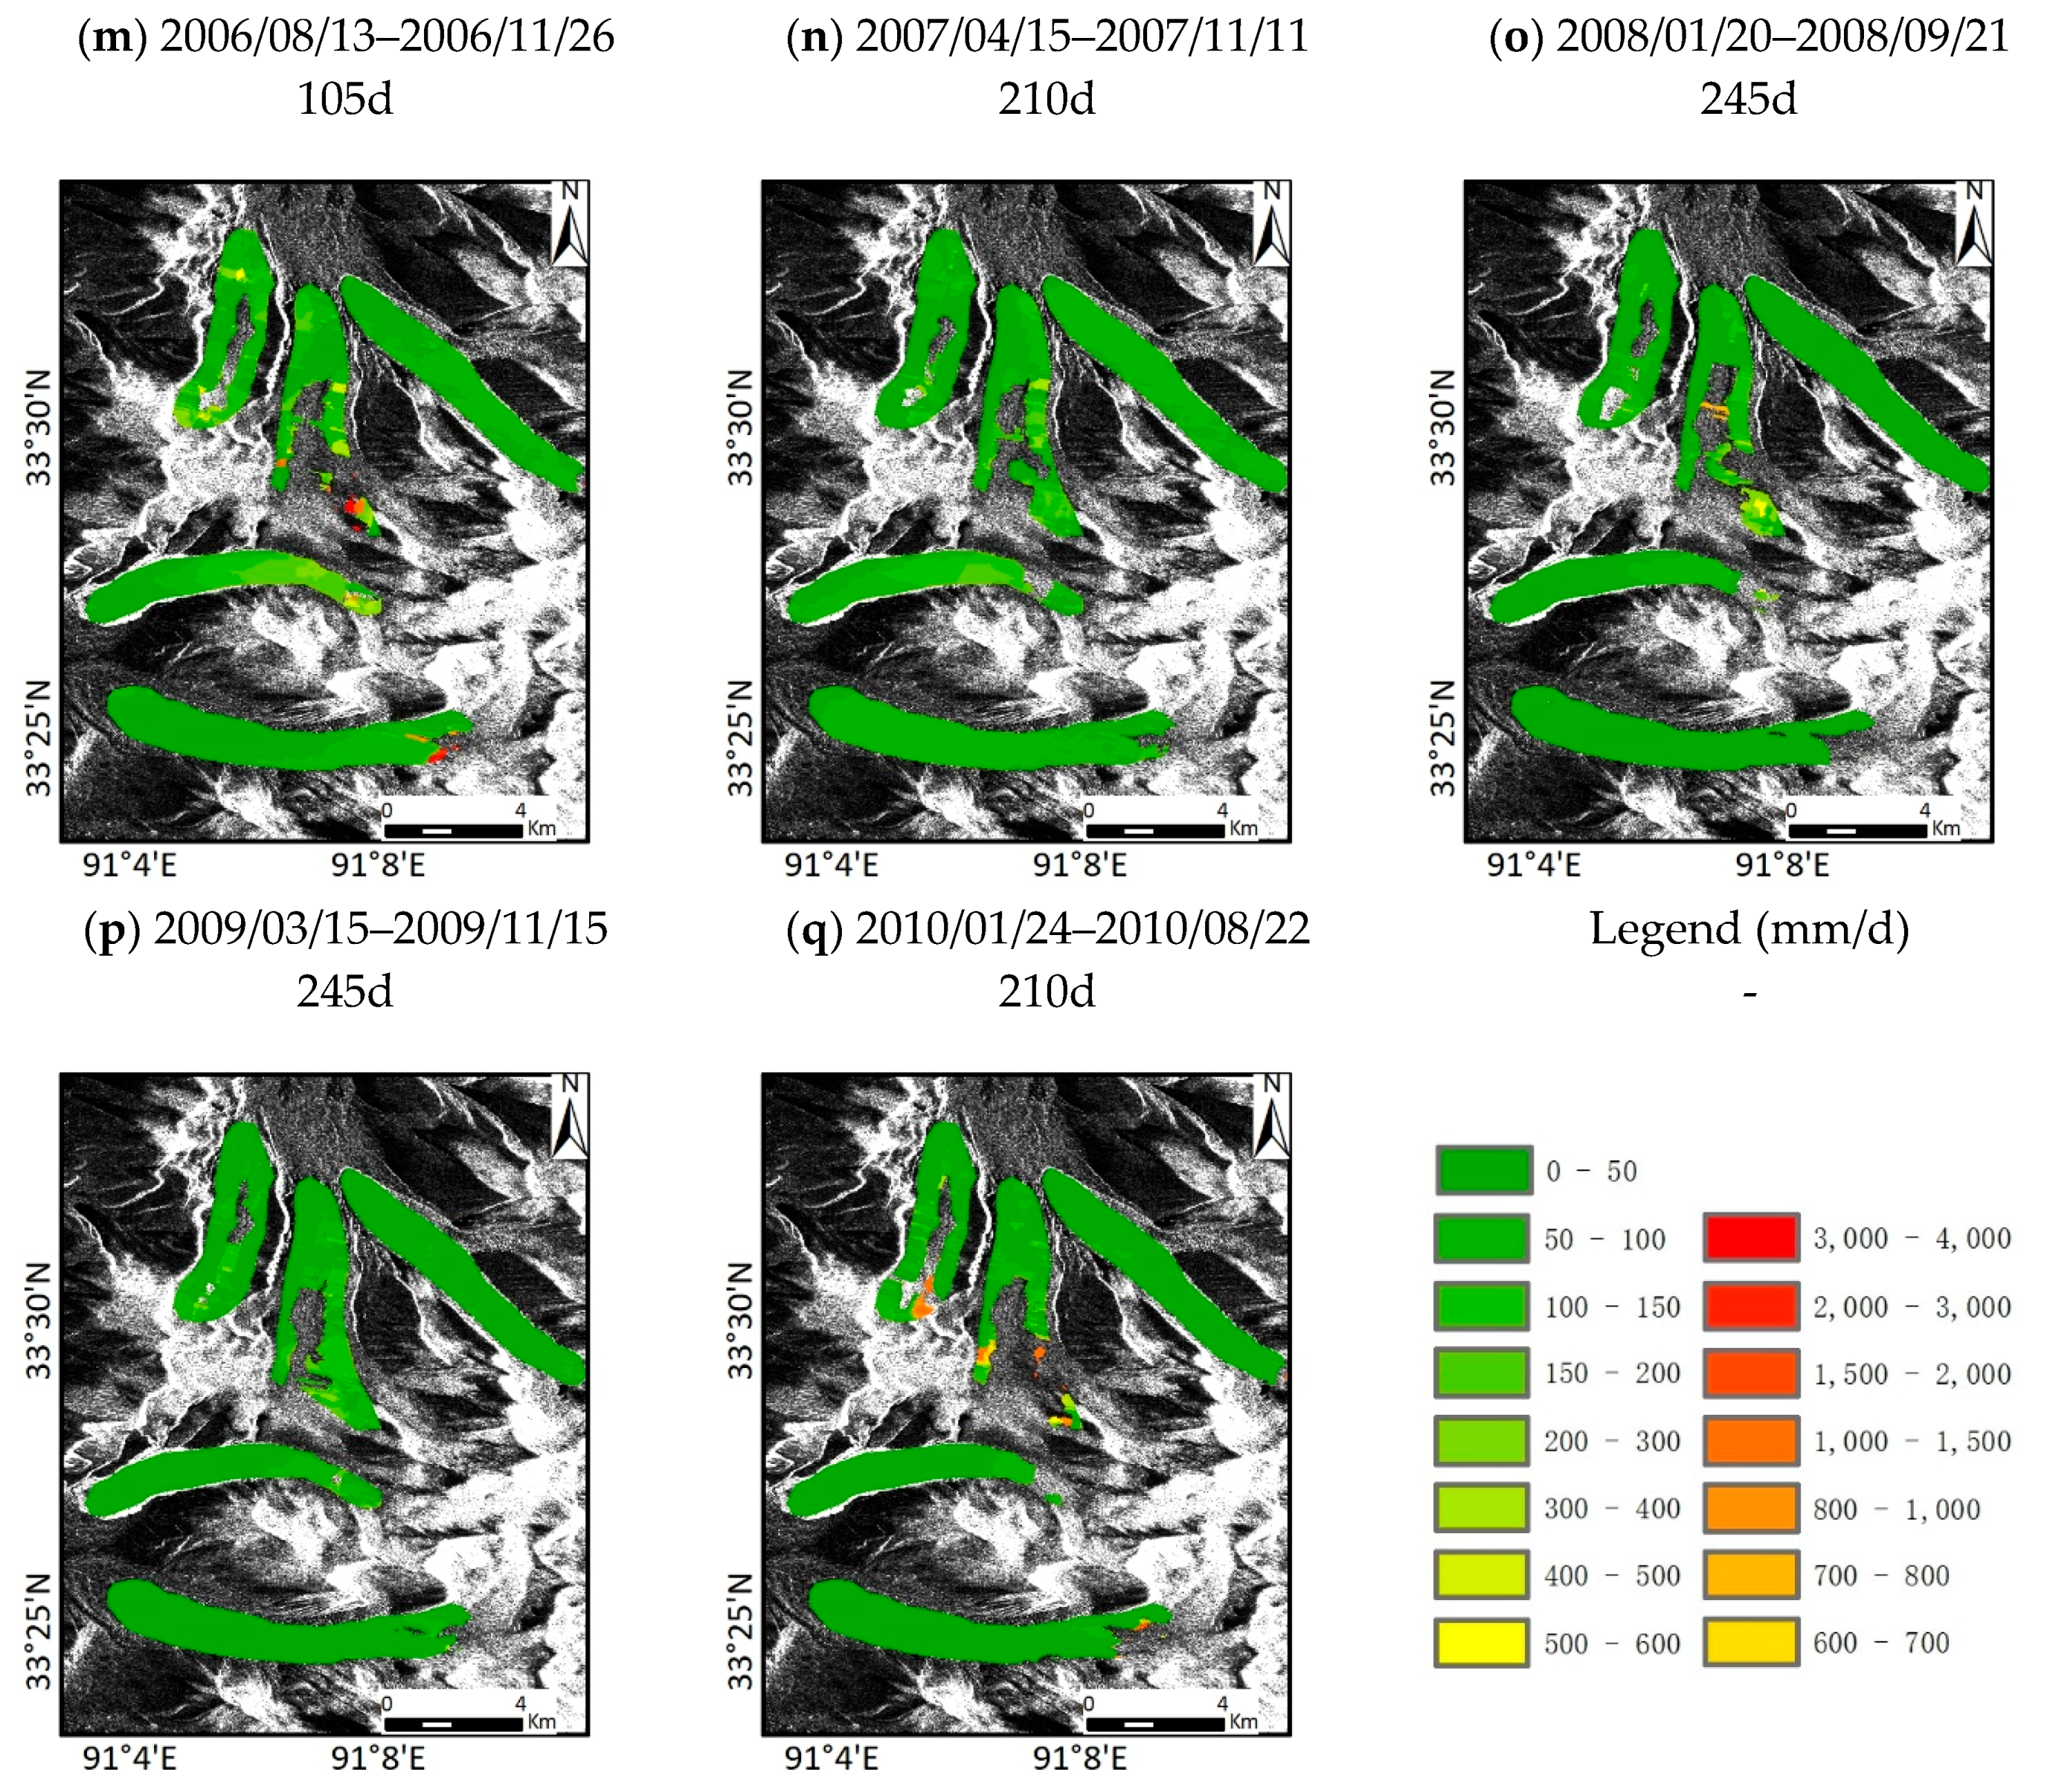
Figure 5.
The length evolution of glacial centerline from 1988 to 2018.
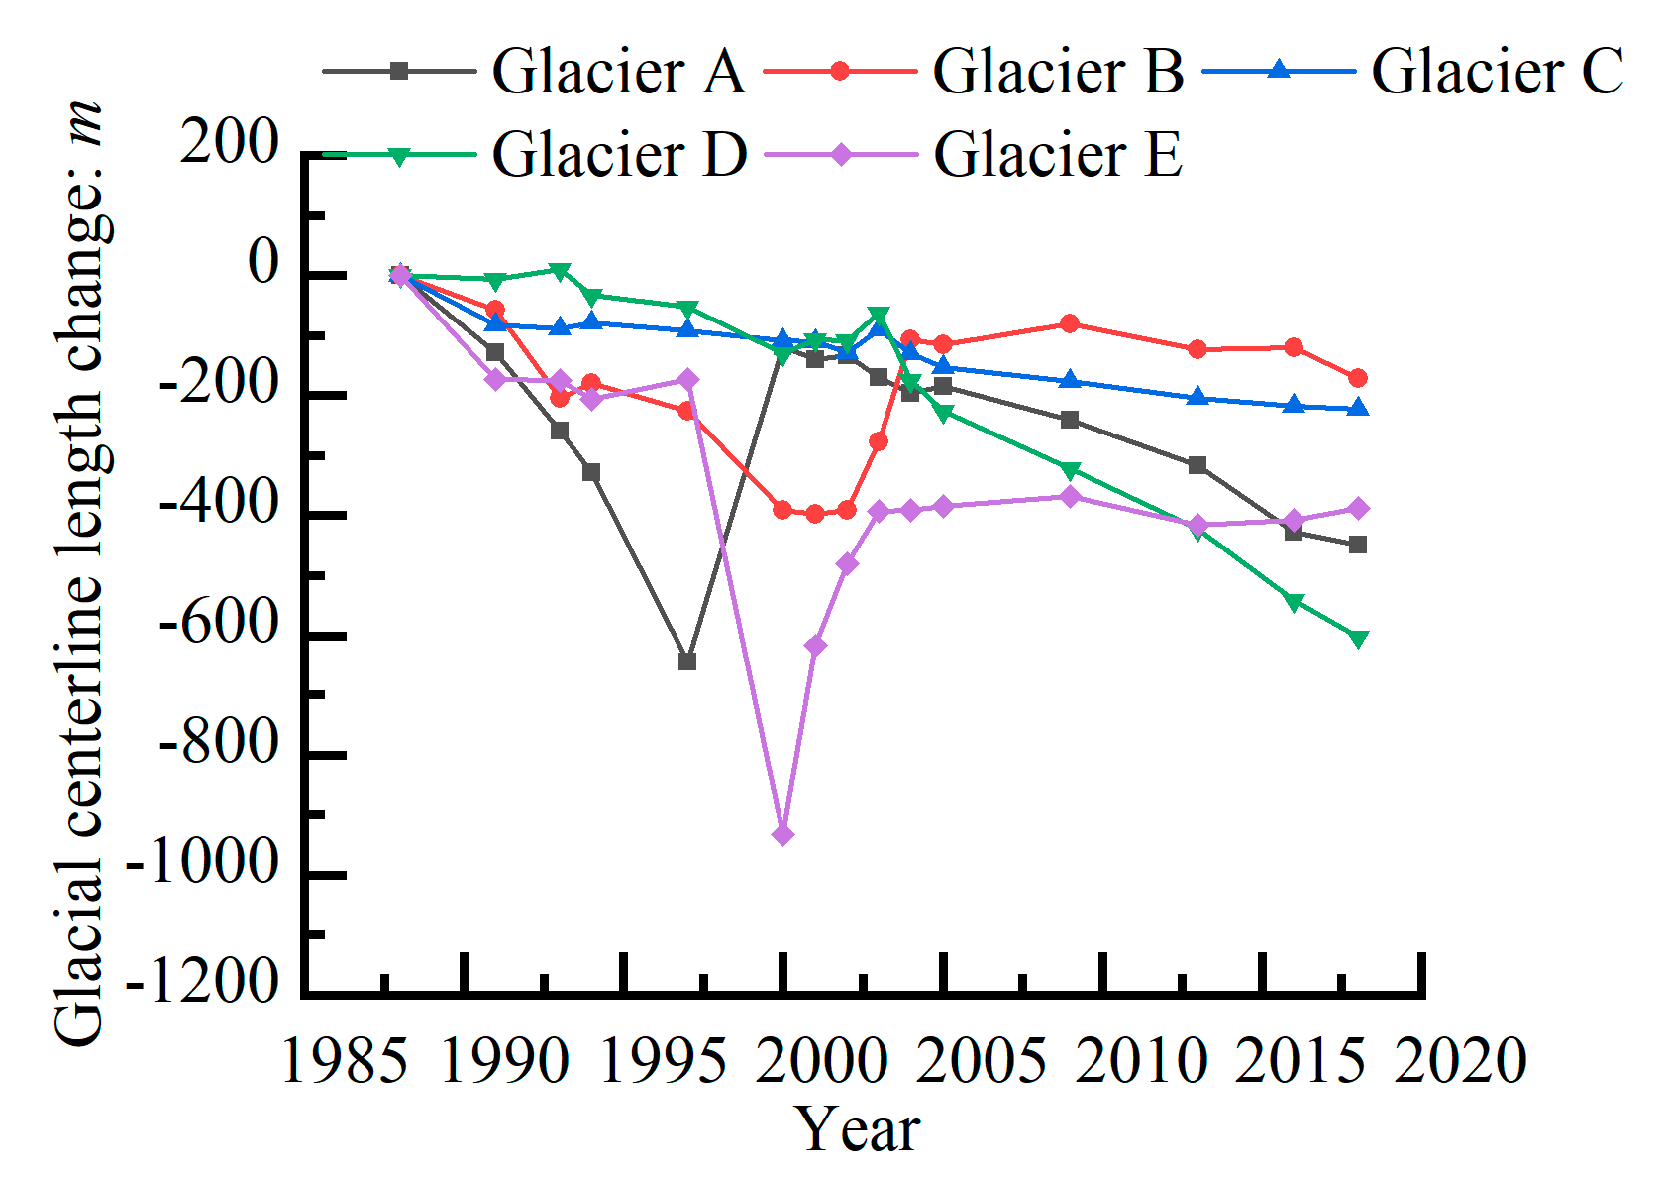
Figure 6.
The area evolution of glacial area from 1988 to 2018.

Figure 7.
The velocity of Glacier C centerline points.
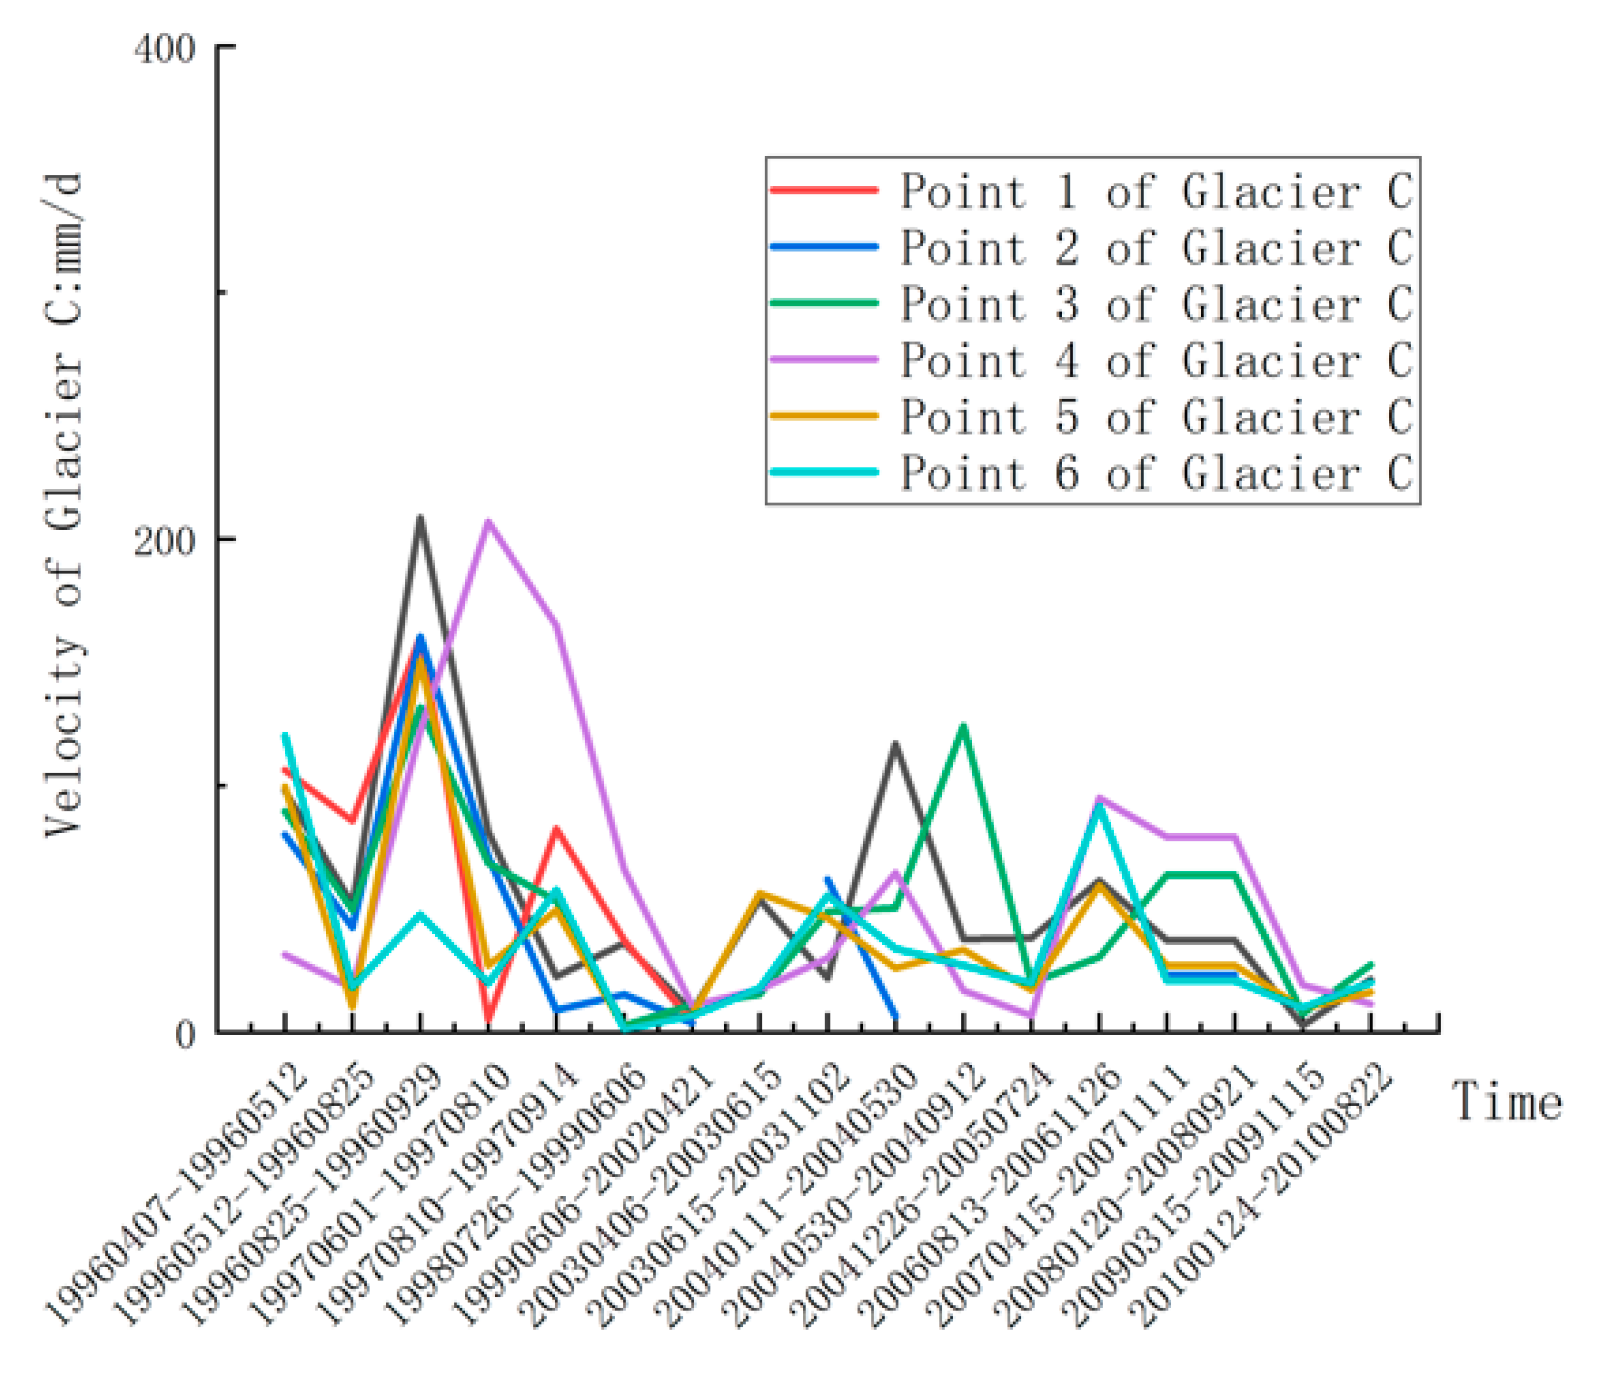
Figure 8.
The velocity of Glacier D centerline points.
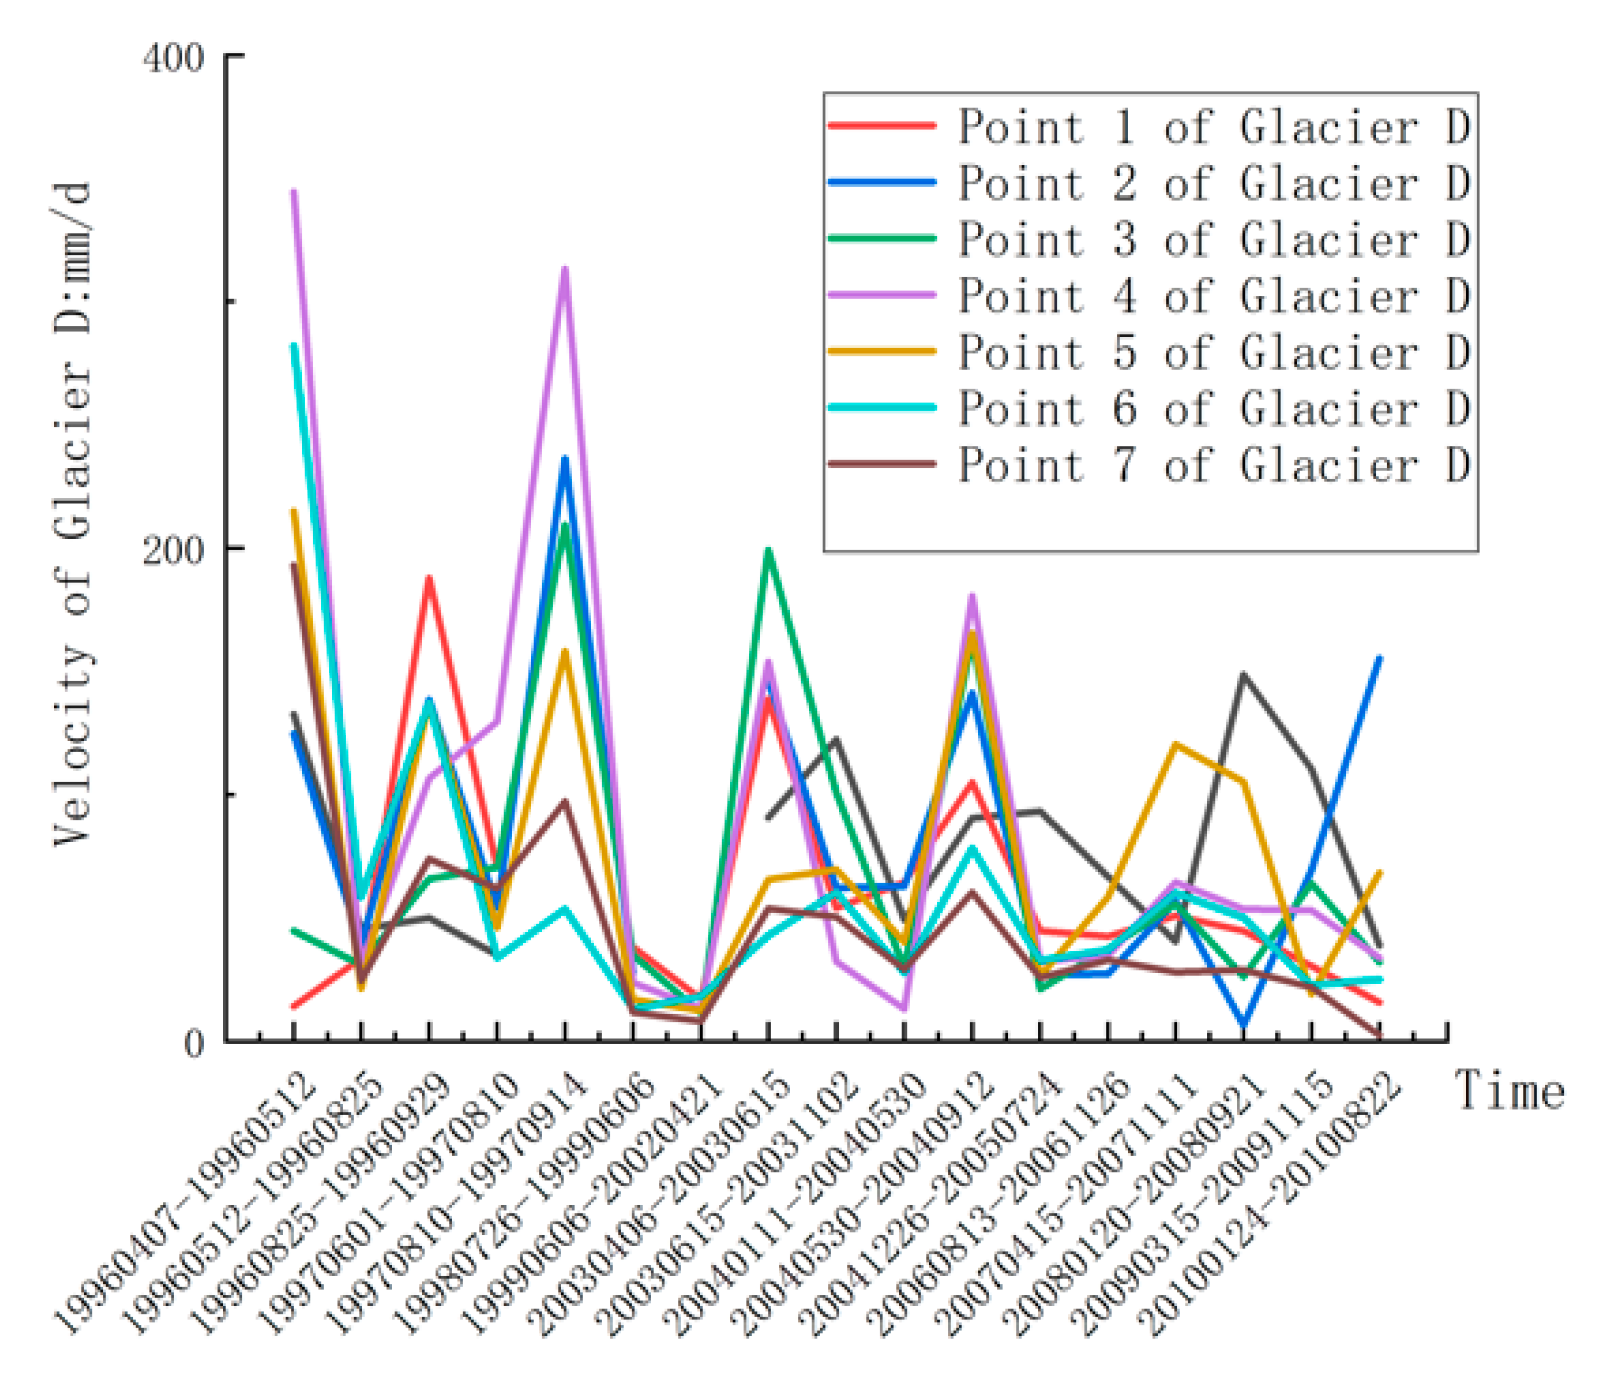
Figure 9.
The velocity of Glacier A centerline points.
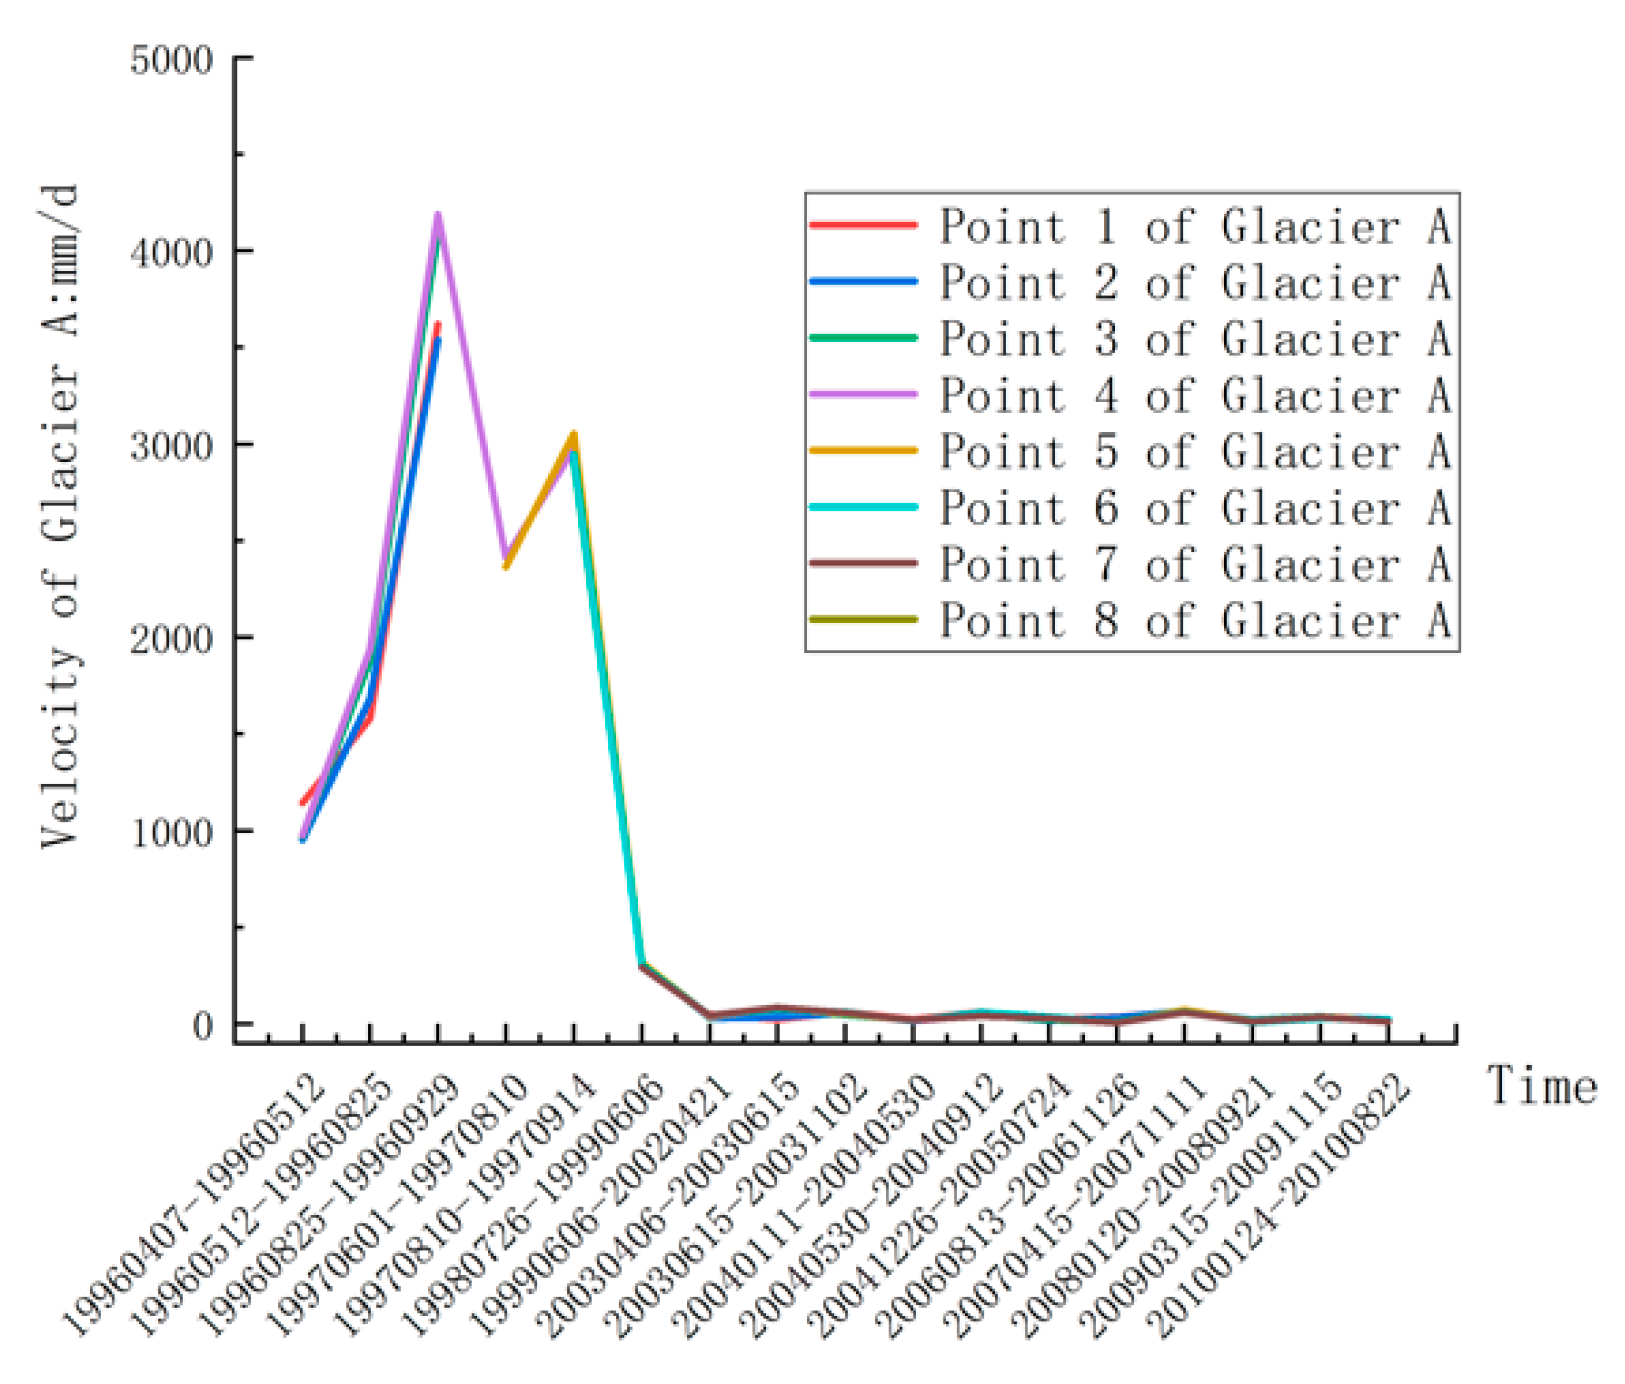
Figure 10.
The velocity of Glacier B centerline points.
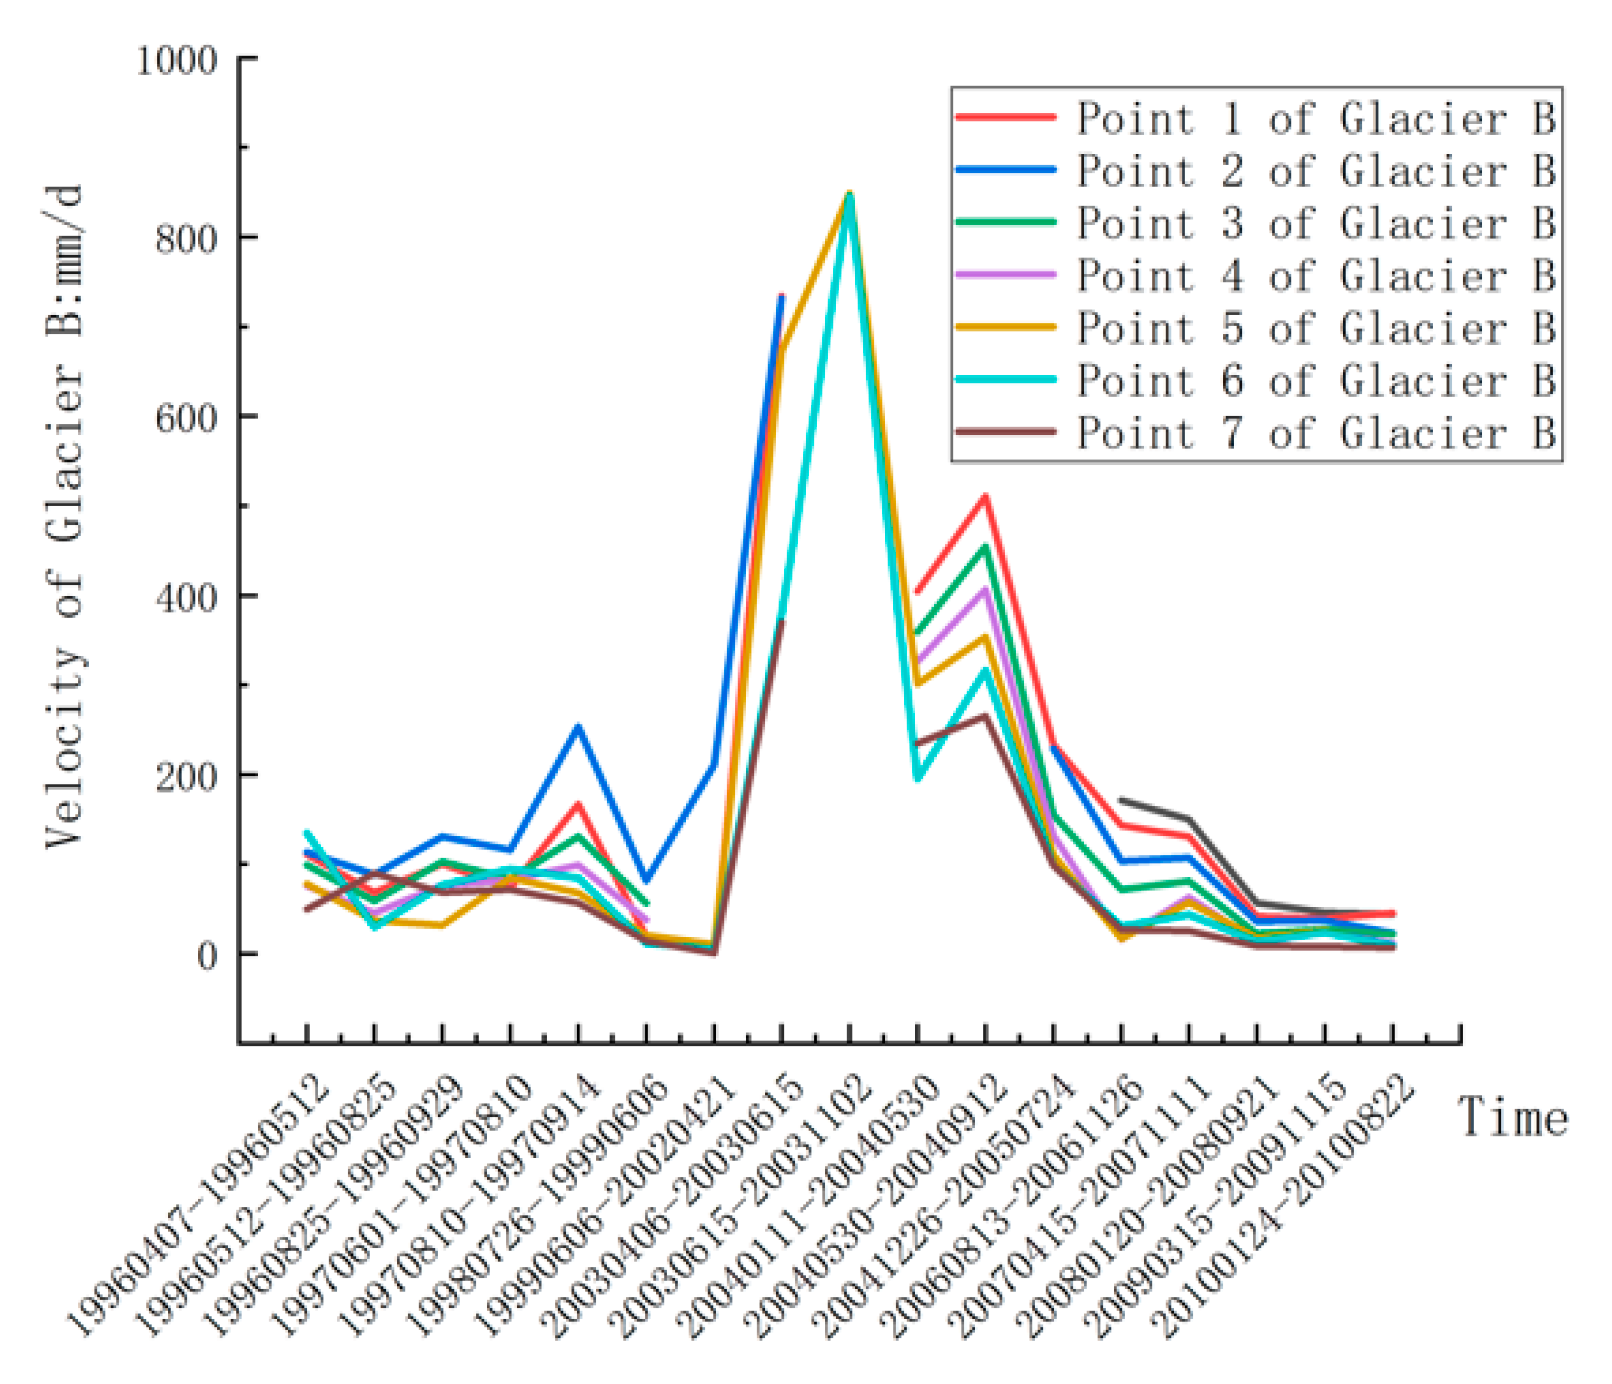
Figure 11.
The velocity of Glacier E centerline points.
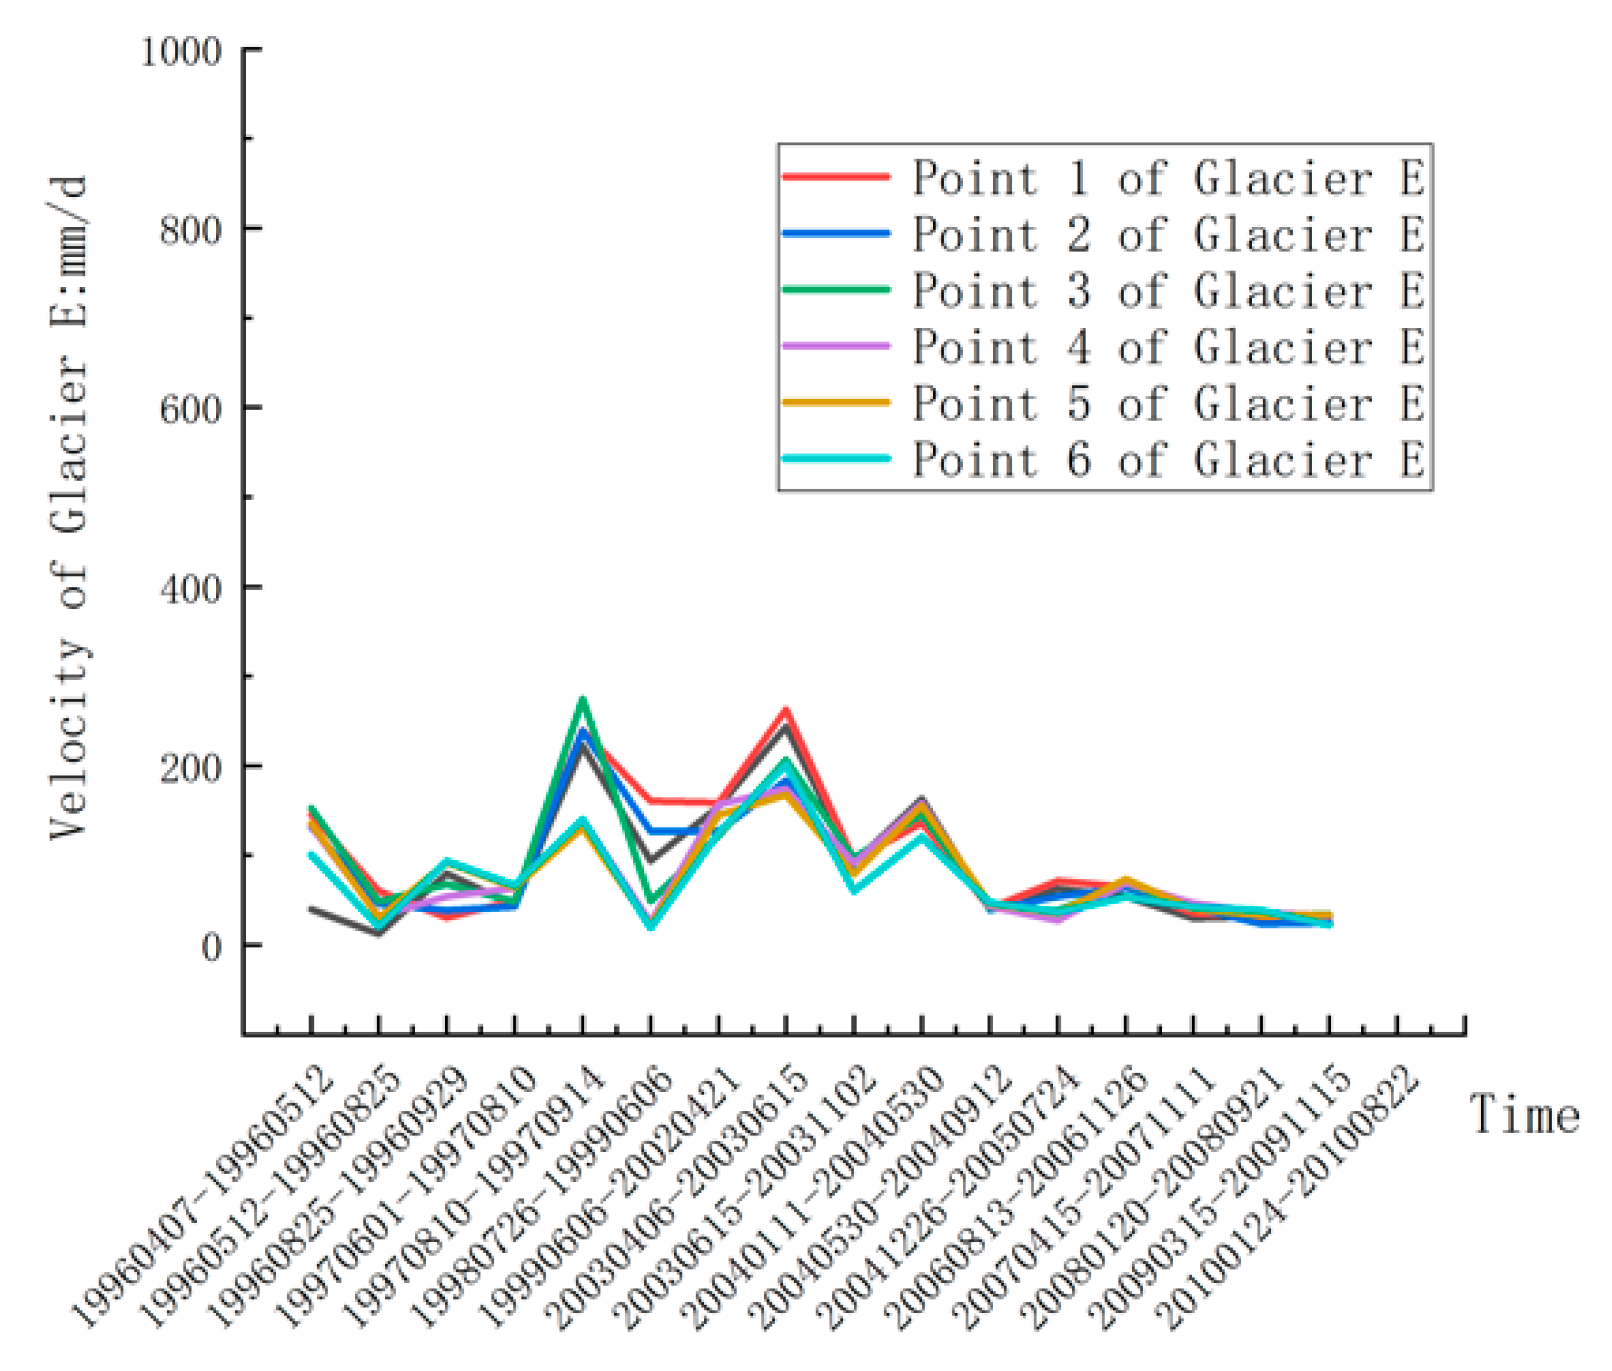
Figure 12.
Accumulated summer precipitation of Tuotuohe Station (mm).

Figure 13.
Average summer temperature of Tuotuohe Station (°C).


Table 1.
Attributes of the glaciers in this study with detailed information from the Global Land Ice Measurements from Space Monitoring the World’s Changing Glaciers (GLIMS) (including name, location, and elevation).
Table 1.
Attributes of the glaciers in this study with detailed information from the Global Land Ice Measurements from Space Monitoring the World’s Changing Glaciers (GLIMS) (including name, location, and elevation).
| ID | GLIMS_ID | Gla_Long (°) | Gla_lati (°) | Max_lev (m) | Min_lev (m) | Mean_ lev (m) |
|---|---|---|---|---|---|---|
| A | G091091E33424N | 91.091163 | 33.423696 | 6521.7 | 5386.2 | 5846.9 |
| B | G091071E33463N | 91.071464 | 33.462577 | 6500.0 | 5358.6 | 5841.9 |
| C | G091058E33525N | 91.057776 | 33.525472 | 6006.5 | 5328.7 | 5710.9 |
| D | G091104E33504N | 91.103793 | 33.503539 | 6540.8 | 5352.5 | 5795.6 |
| E |
© 2019 by the authors. Licensee MDPI, Basel, Switzerland. This article is an open access article distributed under the terms and conditions of the Creative Commons Attribution (CC BY) license (http://creativecommons.org/licenses/by/4.0/).
Share and Cite
MDPI and ACS Style
Yan, J.; Lv, M.; Ruan, Z.; Yan, S.; Liu, G. Evolution of Surge-Type Glaciers in the Yangtze River Headwater Using Multi-Source Remote Sensing Data. Remote Sens. 2019, 11, 2991. https://doi.org/10.3390/rs11242991
AMA Style
Yan J, Lv M, Ruan Z, Yan S, Liu G. Evolution of Surge-Type Glaciers in the Yangtze River Headwater Using Multi-Source Remote Sensing Data. Remote Sensing. 2019; 11(24):2991. https://doi.org/10.3390/rs11242991
Chicago/Turabian StyleYan, Jin, Mingyang Lv, Zhixing Ruan, Shiyong Yan, and Guang Liu. 2019. "Evolution of Surge-Type Glaciers in the Yangtze River Headwater Using Multi-Source Remote Sensing Data" Remote Sensing 11, no. 24: 2991. https://doi.org/10.3390/rs11242991
Note that from the first issue of 2016, this journal uses article numbers instead of page numbers. See further details here.