Influence of Tropical Cyclone Intensity and Size on Storm Surge in the Northern East China Sea

1
Institute of Oceanology, Chinese Academy of Sciences, Nanhai Road, 7, Qingdao 266071, China
2
Key Laboratory of Ocean Circulation and Waves, Institute of Oceanology, Chinese Academy of Sciences, Nanhai Road, 7, Qingdao 266071, China
3
University of Chinese Academy of Sciences, Yuquan Road, 19A, Beijing 100049, China
4
North China Sea Marine Forecasting center of State Oceanic Administration, Yunling Road, 27, Qingdao 266061, China
5
Laboratory for Ocean and Climate Dynamics, Qingdao National Laboratory for Marine Science, Qingdao 266061, China
6
Nanjing University of Information Science and Technology, Pukou District, Nanjing 210044, China
*
Author to whom correspondence should be addressed.
Remote Sens. 2019, 11(24), 3033; https://doi.org/10.3390/rs11243033
Submission received: 5 November 2019
/
Revised: 9 December 2019
/
Accepted: 10 December 2019
/
Published: 16 December 2019
(This article belongs to the Special Issue Remote Sensing of the Oceans: Blue Economy and Marine Pollution)
Abstract
:Typhoon storm surge research has always been very important and worthy of attention. Less is studied about the impact of tropical cyclone size (TC size) on storm surge, especially in semi-enclosed areas such as the northern East China Sea (NECS). Observational data for Typhoon Winnie (TY9711) and Typhoon Damrey (TY1210) from satellite and tide stations, as well as simulation results from a finite-volume coastal ocean model (FVCOM), were developed to study the effect of TC size on storm surge. Using the maximum wind speed (MXW) to represent the intensity of the tropical cyclone and seven-level wind circle range (R7) to represent the size of the tropical cyclone, an ideal simulation test was conducted. The results indicate that the highest storm surge occurs when the MXW is 40–45 m/s, that storm surge does not undergo significant change with the RWM except for the area near the center of typhoon and that the peak surge values are approximately a linear function of R7. Therefore, the TC size should be considered when estimating storm surge, particularly when predicting marine-economic effects and assessing the risk.

1. Introduction
1.1. Background
Storm surge is an abnormal increase in seawater level, which can be induced by typhoons and atmospheric pressure disturbances [1,2,3], and also may be affected by factors such as interaction with the seiches of (semi) enclosed basins, coastal configuration, coastal bathymetry, and the extend of the continental shelf [4]. Storm surges caused by hurricanes or typhoons (two types of tropical cyclones) are among the most disastrous marine/coastal hazards in the world, resulting in significant property damage and loss of life [5,6,7,8,9]. Weisberg [10], Orton [11], Rey [4], and others have studied the effects of factors such as typhoon landing points, direction, and maximum wind speed (MXW) on storm surges. Condon [12] uses the radius of maximum wind (RMW) to indirectly discuss the impact of TC size on storm surge. However, RMW only represents a single distance parameter and can only reflect the wind speed in the area near the typhoon center, which is not enough to completely describe TC size and consequently, it is necessary to introduce other distance parameters to describe TC size. At present, TC size is often described by the distance from the center of the typhoon to the wind speed of level 7 or 10 in the measurement. However, analysis of the historical hurricane record showed no clear correlation between surge and TC size and consequently, little attention has been given to the role of storm size in surge generation [13]. Researchers have ignored the effect of changes in TC size in the context of global warming [14], which has resulted in a significant underestimation of the TC-driven storm surge destructive potential [13].
Due to the lack of accurate data, there has been relatively less research on the impacts of TC size on storm surge. At present, there are many ways to define typhoon dimensions, due to differences in the means of observation. Brand [15] and Merrill [16], using the mean radius of the outermost closed isobar (ROCI) to measure TC size, and analyzing surface weather charts, reported that there were seasonal and regional variations in TC size, and Northwest Pacific (NWP) TCs had a mean size twice as large as that of the TCs in the Atlantic Ocean. For this reason, more attention should be paid to the impact of different typhoon scales on storm surge in the Pacific. Based on aircraft and other normal surface observations, TC size was investigated using the radii of a specific fixed isobar (1004 hPa) [17]. However, in situ observations are not routinely available and there is still a lack of wind structure observations for TCs in the open ocean [18,19]. The dearth of observations makes TC size estimation heavily dependent upon satellite observations and techniques [19]. Satellite observations include cloud/feature-tracked winds [20,21] and scatterometry [22]. The US Joint Typhoon Warning Center (JTWC) has published TC critical wind radii (mean azimuth radii of 34-, 50-, and 64-kt surface winds—R34, R50, and R64, respectively) in the TC best-track dataset since 2001 [23]. The quick scatterometer (QuikSCAT) surface wind speed data have been used to study the relationship between TC size and weather variables, for which TC size was defined as either R15 [24] or R34 [25]. Knaff [18,19] measured TC size in terms of R5 (the radius of the mean tangential surface wind speed of 5 kt) and presented a relatively simple method for estimating the TC wind radii from two different sources: Infrared satellite imagery and global model analyses. Data from European remote sensing (ERS) satellites [26] and Japan meteorological satellites [23] have also been extensively analyzed in TC size investigations. This study compares the size of tropical cyclones using data from two Japanese satellites, GMS-5 and MTSAT-2. Synthesizing the above, the typhoon size is described in terms of two main aspects: Wind profile and air pressure profile. Different TC sizes exert different effects on the weather and ocean. The timely determination of TC size, intensity, and track is important in weather forecasts, as well as predictions of the potential impacts of TCs [18,19,26,27,28,29,30].
TC size has a significant impact on weather and climate, and the corresponding effects on the ocean can also lead to large storm surges and wave disasters, particularly for very intense storms making landfall in mildly sloping regions [13,31]. For example, Hurricane Katrina’s large size contributed to its massive storm surge, enabling it to generate a higher storm surge than hurricane Camille, even though Camille produced stronger winds when it struck the same area in 1969 [13]. Statistical analysis reveals an inverse correlation between storm surge magnitudes and maximum wind speed radius (RMW), while positive correlations exist between storm surge heights and TC sizes [32]. According to Irish [13], storm surge varies by as much as 30% over a reasonable range of TC sizes for a given storm intensity, which means that TC size has a significant impact on storm surge and is worth studying.
1.2. Study Area
The northern East China Sea (NECS), particularly the Bohai Sea and the northern Yellow Sea, is one of the areas in the world most vulnerable to storm surge [33]. The Bohai Sea is a semi-enclosed sea with three bays: Liaodong Bay, Bohai Bay, and Laizhou Bay (Figure 1). The terrain is mostly flat and leaning from bays to the Bohai Strait. The surface area of the Bohai Sea is approximately 77,000 km2, with a mean depth of 18 m below mean sea level (MSL) [34]. The main industries in the flat (susceptible to inundation) coastal areas include mariculture, salt-drying, oil and gas exploitation, and tourism.
The Yellow Sea is a marginal sea of the western North Pacific located between the Chinese mainland and the Korean peninsula [35]. The average depth of the northern Yellow Sea is about 38 m below MSL [36]. Many previous studies have divided the Yellow Sea into northern and southern parts, with a dividing line that runs between Chengshan Cape of the Shandong Peninsula and Changyon of the Korean Peninsula [33].
Typhoons in the north Pacific are often serious marine disasters. For example, Typhoon Winnie (TY9711) resulted in 133 people dead or missing and caused more than 28 billion yuan in direct economic losses. Typhoon Winnie (TY9711) and Typhoon Damrey (TY1210) were selected to compare the effects of different TC sizes on storm surge, because the difference in size between typhoons Winnie and Damrey is similar to the difference in size between Hurricane Katrina and Hurricane Camille. As part of this study, ideal tests were conducted by modeling different sizes of typhoons to examine the role of TC size in storm surge. In addition, TC size should be considered when estimating storm surge, particularly when predicting marine-economic effects and assessing the risk.
2. Data and Methods
2.1. Typhoon Information and Data Processing
2.1.1. Typhoon Information
Pacific typhoons Winnie (TY9711) and Damrey (TY1210) made landfall north of NECS. TY9711 and TY1210 were selected because they had similar paths and MXWs but different TC size. The paths of TY9711 and TY1210 are shown in Figure 2. TY9711 made landfall on the coast of Wenling, Zhejiang Province at 20:00 on 18 August 1997. Its MXW was 20 m/s and its seven-level wind circle range (R7) was about 400,000 m in the Shandong area (about 35° north latitude). TY1210 made landfall on the coast of Yancheng City, Jiangsu Province at 21:30 on 2 August 2012. Its MXW was 29 m/s and its R7 was 170,000 m in the Shandong area.
The typhoon data (including TC size) used for comparison and simulation is from the Wenzhou Typhoon Net (http://www.wztf121.com/history.html), where TC size corresponds to the seven-level wind circle range (R7); R7 specifically refers to the radius corresponding to v = 13.9 m/s.
2.1.2. Satellite Data
Since measured data on the typhoon scale is limited, in order to study impacts of typhoon-scale weather variables on storm surge, it is necessary to determine typhoon size based on satellite inversion data. The TY9711 typhoon-scale inversion data were provided by the GMS-5 meteorological satellite, while the TY1210 data were derived from the MTSAT-2 satellite. The TC size inversion method and dataset were provided by Lu [23], using infrared images to determine the typhoon scale based on R34 (defined as the mean azimuth radius of 34-kt surface winds). The TC size data were from the China Meteorological Administration Tropical Cyclone Data Center (http://tcdata.typhoon.org.cn/tcsize.html).
The Japanese geostationary meteorological satellite (GMS) is located at 140° E and has been the most important source of meteorological satellite information for Asian weather forecasting since its launch in July 1977. The GMS-5 satellite was launched in March 1995 and officially positioned at 140° E in June, at which time it commenced operation. The main detection instrument on this satellite is the visible and infrared spin-scanning radiometer (VISSR). The visible light resolution is 1250 m, and the spatial resolution of the infrared and water vapor channels is 5000 m. The GMS has obtained valuable data since its inception, prompting extensive inversion algorithms and application studies. For example, Hyangsun [37] used machine learning to correct GMS data and Broomhall [38] expanded the Australian database with GMS data pairs.
The MTSAT-2 satellite is a geostationary-orbit satellite launched by Japan on 18 February 2006; meteorological observation began in 2010. The imager mounted on the MTSAT-2 satellite has one visible light band and four infrared bands. The imager relies on an internal scanning mirror to capture the image of the Earth’s surface. The light collected by the scanning mirror is divided into visible light by a lens and a filter. There is a total of five bands of light. The MTSAT-2 captures images of the Northern Hemisphere every 30 min; this temporal frequency helps to better grasp the movement of typhoons and clouds. At the same time, the horizontal resolution of the satellite reaches 1000 m in the visible light band and 4000 m in the infrared band, and image quality is expected to improve significantly. Since it began accepting meteorological observation missions, the MTSAT-2 has been widely used in meteorological research [23,39].
2.1.3. Tide Station Data Processing
Data from 11 tide stations in NECS were used for model verification and typhoon storm surge comparison studies. The time resolution of the data was 1 h. The station locations are shown in Figure 1. The astronomical tide was calculated and analyzed by harmonic analysis of more than one year of measured data from the tide gauge stations. The remaining tide level was obtained by observing the tide level minus the astronomical tide. The base of the remaining tide level is sea level, which is identical to the base of the numerical model.
2.2. Wind Formula
For the relationship between TC size and storm surge, the radial distribution of wind relative to the MXW is specified following DUAL (dual-exponential) formula [40]. The DUAL formula is the same as the Jelesnianski2 [41] and Holland [42] formulas, but differs in that it is a summary formula based on multiple measurements of the cross-section of a tropical cyclone. The advantage of the DUAL formula is that the parameters can be calculated from measured or predicted wind speed in order to study the effects of different TC sizes on storm surges, which is why this study uses this formula.
The DUAL formula and the numeric coefficients (Formula 1-11) are both derived from the paper of Willoughby [40], as follows:
Related parameters:
where is the radial distance from the typhoon center; is the wind velocity as functions of ; is the forward speed of the typhoon; and are the tangential wind component in the eye and beyond the transition zone, which lies between and ; and are the MXW and the RMW; and are the exponential decay length in the outer vortex; A is the coefficient representing the scale of the E exponential function related to and (Formula (3)); is the latitude of the typhoon center and n is the exponent for the power law inside the eye.
Note: In order to ensure that both and are equal to at , a simple correction to the DUAL formula is as follows.
The weighting function, , is expressed in terms of a nondimensional argument When ; when . In the subdomain , the weighting is defined as the polynomial.
which ramps up smoothly from zero to one between and [40].
TC size is represented by the seven-level wind circle range (R7). The variable is equal to at , where is the radial distance between the typhoon center and the seven-level wind circle. The exponential decay length will be calculated by using data from the Typhoon Network (http://www.wztf121.com/history.html). Specifically, the measured seven-stage wind speed and R7 are brought into Equation (3) to determine X2, which is the control model wind field cross-section curve.
3. Model and Validation
3.1. Model Description and Configuration
The time-dependent, three-dimensional, primitive equation, finite-volume coastal ocean model (FVCOM) [46] is used to model storm surge. A non-overlapping unstructured triangular grid is used at the horizontal to accurately fit complex coastlines.
Storm surge is a cumulative water level effect, so the model must be large enough to contain the spatial extent of the storm and the accumulation of surge response due to nonlocal excitation [10]. The model domain extends from north of Bohai Sea to near Taiwan Strait, with an open boundary arching south. The grid resolution increases from the open boundary toward the NECS, with the highest resolution (about 100 m) on the coast of the Bohai Sea (Figure 3). A total of 168,373 triangular cells with 89,541 nodes comprise the horizontal, and 10 uniformly distributed s-coordinate layers comprised the vertical. The shoreline and bathymetry used in the model were obtained from the ETOPO-1 (http://www.ngdc.noaa.gov/mgg/global/global.html) dataset and were corrected near the NECS using an electronic chart with a scale of 1:50,000 (Figure 4). Based on the Courant—Friedrichs—Levy numerical stability condition, the computational time steps of 1.5 and 15 s are used for the external and internal modes, respectively. Temperature and salinity are estimated and specified to be constant at 18 °C and 35 psu, respectively. Storm surge in this model is only controlled by wind stress. The effects of atmospheric pressure, tides, rivers, and wave run up are not modeled. The conditions applied to the open boundaries were a combination of free surface and close the wet and dry grid.
The wind stress is provided by the above DUAL formula and corresponding typhoon data (Figure 5), but does not consider fusion with the background wind field, given the ideal nature of the design. The wind field established by the DUAL model shows that the typhoon is slightly larger on the right side, an asymmetrical characteristic that is consistent with the actual typhoon.
3.2. Model Validation
Since Typhoon Winnie (TY9711) and Typhoon Damrey (TY1210) were selected to investigate the relationship between TC size and storm surge, it is necessary to validate the reliability and accuracy of the simulation. The surge observation data were collected from six tide stations: Zfd, lko, wfg, tgu, byq, and lht. The locations are shown in Figure 1. Due to the lack of data, only the TY1210 simulation results are verified here (Figure 6). The timeframe is from 1–3 August 2012 (UTC, the same hereinafter). The results of the model agree well with observations not only in magnitudes but also in phases. However, there are slight differences between the two curves. The probable reasons are as follows: 1) The wind variations calculated by the DUAL formula differs from the actual wind change; 2) there is still some gap between model bathymetry data and actual bathymetry (which brings local effects to storm surges and leads to undulation at the curves); and 3) other factors causing storm surge have not been fully considered in the model, such as the effect of waves and tides. In addition, the FVCOM mesh and model parameters have been validated using additional storms besides TY9711 and TY1210. Therefore, it is given that only two storms are shown in the paper in order to then represent a verified model for a larger experimental design of perturbations to an idealized TY1210. Nevertheless, FVCOM simulates the storm surge elevations well enough to study storm surges induced by typhoons.
4. Results
4.1. Comparison of Similar Typhoon Storm Surges
TY9711 and the TY1210 were selected to compare the effects of different TC sizes on storm surge. The maximum envelope of storm surge (MESS) of TY9711 is far greater than MESS of TY1210 (Figure 7). At the zfd, lko, tgu, and lht tide stations, the storm surge curve over time (Figure 8) shows that the storm surge caused by TY9711 is greater than or equal to the storm surge caused by TY1210, but the MXW of TY9711 is less than the MXW of TY1210. One of the possible causes of this phenomenon is TC size, which is illustrated by the size of the cloud circle inversion shown on satellite imagery (see the cloud map at http://www.wztf121.com/history.html).
At the same time, the size of the typhoon measured by R34 was inverted by the GTM-5 and MTSAT-2 satellites. The size of TY9711 is obviously larger than that of TY1210 (Figure 9). However, the amount of cloud map and inversion contour data is very small, making it difficult to accurately describe the chronological change of typhoon size and the relationship with the storm surge. Since further research is needed, we designed ideal tests to study the effects of different TC sizes on storm surge (see Section 3.2).
4.2. Ideal Tests
There are many factors affecting storm surges, such as topography and external environmental impacts, but wind causes the largest proportion of storm surges [11]. In order to further explore the influence of tropical cyclone intensity and size on storm surge, we designed an ideal test based on the path of TY1210.
4.2.1. Maximum Wind Speed
Based on the path of TY1210, six contrast tests (ideal tests) were designed by varying the MXW and RMW, but fixing R7. The constant R7 is equal to 200,000 m. The MXW is constant for each ideal test, at values of 20, 30, 35, 40, 45, and 50 m/s (Table 1). The RMW is calculated from the MXW and the latitude of the center of TY1210 using Equation (8).
Using the DUAL formula wind fields, the ideal tests are computed using the FVCOM model. Figure 10 shows time series of simulated surges induced by different MXWs. The time span is one day before and after the time of maximum surge. The wind cross-section (Figure 11) is the curve of wind as a function of the distance from the center of the typhoon. It is intercepted from the center of the typhoon to periphery along longitude. The maximum envelope of storm surge (MESS) is given by calculating the extreme value of storm surge in the tests (Figure 12).
The maximum value of storm surge occurs at an MXW of 40–45 m/s rather than at an MXW of 50 m/s (Figure 10). The reason for the phenomenon is related to the fact that the model only changes MXW and RMW, which can be seen from the wind cross-section (Figure 9). In addition, the storm surge does not undergo significant change with the MXW, probably due to the small TC size (Figure 11).
The MESS spatial distribution map of the ideal MXW test (Figure 12) reveals that the spatial distributions of storm surge caused by different wind intensities are slightly different, and the water increases in each bay mouth area are larger. For example, the storm surge in Bohai Bay is larger than the storm surge in other areas. Most of the storm surge extremes occur in the MXW = 45 m/s test.
4.2.2. TC Size and RMW
Based on the path of TY1210, a series of idealized storm surge tests with varying TC sizes and RMW were designed. The TC size is represented by the seven-level wind circle range (R7). There are three ideal tests (test 1, test 3, test 6) for which the MXW is constant and RMW varies with the latitude of the center of TY1210. The constant MXW is equal to 35 m/s. R7 in each test is a constant value of 200,000, 400,000, and 600,000 m (Table 2).
In the other three tests (test 2, test 4, test 5), MXW and R7 values are fixed, but RMW fixed values are different in different tests (Table 2). The constant MXW is equal to 35 m/s and the constant R7 is equal to 400,000 m. The RMW is constant for each ideal test, at value of 25,000, 75,000, and 100,000 m (Table 2). The cross-section of all the tests wind is shown in Figure 13.
Using the DUAL formula wind fields, the ideal tests are computed by the FVCOM model. The wind cross-section of the different tests (Figure 13) are represented as function curves of distance from the center of a typhoon. The maximum envelope of storm surge (MESS) is given by calculating the extreme value of storm surge in the tests (Figure 14). Time series of surges induced by different tests are shown Figure 15.
The maximum value of the storm surge increases as R7 increases, and the maximum value is greatest when R7 is equal to 600,000 m (Figure 14 and Figure 15). These results are the same as reported by Irish [13]. In addition, we found that the peak surge values are approximately a linear function of R7. This is consistent with conclusions from Condon [12].
5. Discussion
As shown above, the numerical ideal tests with different TC sizes indicate that in addition to storm intensity, TC size can dramatically change maximum storm surge. TC size data are lacking, however. Field observations, such as ground reports and buoy observations, can provide high-quality surface conditions, but these observations are not routinely available. Aircraft reconnaissance can also provide detailed spatial distributions of low-level or surface winds, but these missions rarely occur in the Northwest Pacific Ocean [18,19]. A weather center’s estimate of the wind radius is based on subjective analysis of existing information, such as the 2007 publication of the global Hurricane Satellite (HURSAT) dataset by the National Oceanic and Atmospheric Administration (NOAA) (available online at: www.ncdc.noaa.Gov/hursat/index.php) [23].
Due to the lack of in situ observations, conventional TC size estimates are heavily dependent upon satellite observations and techniques. Satellites observations typically employ infrared light, cloud visible light, etc. [20,21]. In addition, satellite inversion relies on good inversion methods. Predecessors used a variety of techniques to transform measured data, such as data fusion [19] and machine learning [37,47]. The size and cloud top brightness temperature profiles of TCs are used for parameter inversion [23]. In the future, we should continue to study satellite inversion methods, and develop new observation methods to ensure timely access to typhoon-scale intensity and movement trajectory data to support weather system assessment and storm surge forecasting.
In the study of the impact of TC size on storm surge, Weisberg [10] investigated the storm surge in the Tampa Bay area of Florida, in the United States, and found that as the intensity of the wind increases, the maximum value of the storm surge increases, and it is suggested that as the RMW increases, the maximum value of the storm surge will increase. Irish [13] used a coupled hurricane vortex–planetary boundary layer (PBL) model to establish a wind field to simulate the entire Gulf of Mexico and found that storm surge increases with storm size. However, these studies have certain regional characteristics and rely on the establishment of wind fields.
Rey [4] and the NHC [48] built a database from the perspective of hypothetical hurricanes, using similarly anticipated typhoon storm surges that could not fully respond to the upcoming typhoon storm surge due to the complexity and variability of the typhoon storm surge. In this paper, using the predicted typhoon path, MXW and TC size, the entire wind field is inverted by the DUAL formula to simulate the storm surge. The approach can supplement the historical database and increase the accuracy of forecasting storm surges in order to reduce disaster losses. Therefore, it is necessary to establish the wind field by TC size and study the tropical cyclone intensity and size in the NECS.
In order to more clearly study the impact of TC size on storm surges, we have parameterized RMW according to the Weisberg [10] research. It is well known that typhoon wind field can be is described by at least two curves, that is, the wind speed rising curve with distance from the typhoon center to RWM and the wind speed decreasing curve with distance from RWM to the periphery. R7 or the peripheral location of fixed wind speed can be used to compensate for the inaccuracy of the wind field profile by RMW and typhoon center location alone. Our research found the small TC size limits the impact of wind field intensity changes on storm surges to some extent. This phenomenon occurs because with a fixed R7, the cross-section of the typhoon changes as the storm’s strength varies, with the maximum value of storm surge occurring at an MXW of 40–45 m/s rather than 50 m/s. It is usually assumed that TC size increases as RWM increases, while other TC size changes are ignored, in many studies of storm surge changes through different RWM [4,12]. Our research found the storm surge does not undergo significant change with the RWM except for the area near the center of typhoon, probably due to the fixing of R7 (TC size). The maximum value of the storm surge increases as TC size increases. Therefore, we suggest that at least three positional parameters (typhoon center, RMW, TC size) are needed to accurately describe the wind field profile of a typhoon, especially TC size, which is more important in storm surge simulation. However, an ideal test with varying MXWs, RMWs, and TC sizes demonstrated that the MXW, RMW, and pressure of a typhoon will change with different TC sizes. There is no clear relationship between MXW, RMW, and typhoon pressure with TC size [49]. What is certain, however, is that the relationship is not simply linear. In the future, we will continue to investigate these relationships and their impacts on storm surge.
Typhoon scale varies, and the disasters caused by typhoon-scale weather factors vary significantly. According to the Saffir–Simpson hurricane scale, Hurricane Camille was a Category 5 storm, while Katrina was only a Category 3. Hurricane Katrina, however, was a greater natural disaster and resulted in a higher death toll due to its larger size [13].
The same conclusion was gleaned from the disaster losses caused by TY9711 and TY1210 (Table 3). TY9711 affected eight provinces, while TY1210 affected only four. In the same provinces (Jiangsu, Shandong, Hebei, and Tianjin) in which losses occurred, TY9711 destroyed 557 dykes, damaged 1000 ships, and damaged a large amount of farming equipment and homes, causing direct economic losses of 8300 million yuan, while TY1210 destroyed 40 dykes, damaged 690 ships, and destroyed a number of pieces of farming equipment and homes, resulting in a direct economic loss of 4175 million yuan. With the exception of Hebei Province, the disaster losses caused by TY9711 far exceeded those from TY1210, which was also due to the larger scale of TY9711. It can be seen that TC size variation has a significant impact on storm surge disasters. Moreover, the analysis of TC size variation is of great importance in disaster prevention and reduction of marine-economic effects.
6. Conclusions
Three-dimensional FVCOM is used to simulate storm surge in the NECS region. First, we used observational data from tide stations to test the reliability and accuracy of the model. Through a hindcasting test of TY1210 storm surge, we found that the overall trend of the storm surge is consistent with actual measurements, and the maximum value of the storm surge was also similar to the measured value.
Analysis of the satellite cloud images and inverse typhoon profiles of TY9711 and TY1210 revealed that TY9711 had a larger TC size than TY1210. Based on observations and model simulations, the storm surge generated by TY9711 was far greater than the surge produced by TY1210, even though the paths and MXWs of the typhoons were similar.
Based on the path of TY1210, six contrast tests (ideal tests) were designed by varying the MXW and RMW, but fixing R7. The result of the ideal tests showed that the maximum value of storm surge occurs at a velocity of 40–45 m/s, rather than 50 m/s. Differences in the wind cross-section and the storm surge do not induce significant changes in the MXW, probably due to the small TC size.
In order to study the effect of TC size on storm surge, a series of ideal tests were designed by fixing the MXW, RMW, and R7. The maximum value of the storm surge becomes larger as R7 becomes larger, and the peak surge values are approximately a linear function of R7. The storm surge does not undergo significant change with the RWM except for the area near the center of typhoon.
Using the predicted typhoon path, MXW, RMW, and TC size, the entire wind field was inverted by the DUAL formula to simulate the storm surge. This approach can supplement the historical database and increase the accuracy of forecasting storm surges in order to reduce disaster losses of marine-economic effects. Therefore, it is necessary to establish the wind field by TC size and further study tropical cyclone intensity and size in the NECS.
Author Contributions
Conceptualization, J.L. and Y.H.; methodology, D.M.; software, Q.L.; validation, J.L.; formal analysis, Q.L.; investigation, J.L.; resources, Y.H.; data curation, D.M.; writing—original draft preparation, J.L.; writing—review and editing, Y.Z.; visualization, Q.L.; supervision, Y.Z.; project administration, Q.L.; funding acquisition, Y.H.
Funding
This research was jointly funded by the Natural Science Foundation of China, grant numbers U1706216 and U1901215.
Acknowledgments
The Japanese geostationary meteorological satellite (GMS) data, MTSAT-2 satellite data, and typhoon data from the Wenzhou Typhoon Net are highly appreciated.
Conflicts of Interest
The authors declare no conflict of interest.
References
- You, S.H.; Seo, J.W. Storm surge prediction using an artificial neural network model and cluster analysis. Nat. Hazards 2009, 51, 97–114. [Google Scholar] [CrossRef]
- Yang, Z.Q.; Wang, T.P.; Leung, R.; Hibbard, K.; Janetos, T.; Kraucunas, I.; Rice, J.; Preston, B.; Wilbanks, T. A modeling study of coastal inundation induced by storm surge, sea-level rise, and subsidence in the Gulf of Mexico. Nat. Hazards 2014, 71, 1771–1794. [Google Scholar] [CrossRef]
- Xu, J.; Zhang, Y.; Cao, A.; Liu, Q.; Lv, X. Effects of tide-surge interactions on storm surges along the coast of the Bohai Sea, Yellow Sea, and East China Sea. Sci. China Earth Sci. 2016, 59, 1308–1316. [Google Scholar] [CrossRef]
- Rey, W.; Mendoza, E.T.; Salles, P.; Zhang, K.; Teng, Y.C.; Trejo-Rangel, M.A.; Franklin, G.L. Hurricane flood risk assessment for the Yucatan and Campeche State Coastal Area. Nat. Hazards 2019, 96, 1041–1065. [Google Scholar] [CrossRef]
- Lin, N.; Emanuel, K.; Oppenheimer, M.; Vanmarcke, E. Physically based assessment of hurricane surge threat under climate change. Nat. Clim. Chang. 2012, 2, 462–467. [Google Scholar] [CrossRef] [Green Version]
- Andrade, C.A.; Thomas, Y.F.; Lerma, A.N.; Durand, P.; Anselme, B. Coastal flooding hazard related to swell events in Cartagena de Indias, Colombia. J. Coast. Res. 2013, 29, 1126–1136. [Google Scholar] [CrossRef]
- Olbert, A.; Nash, S.; Cunnane, C.; Hartnett, M. Tide-surge interactions and their effects on total sea levels in Irish coastal waters. Ocean Dyn. 2013, 63, 599–614. [Google Scholar] [CrossRef] [Green Version]
- Haigh, I.D.; Macpherson, L.R.; Mason, M.S.; Wijeratne, E.M.; Pattiaratchi, C.B.; Crompton, R.P. Estimating present day extreme water level exceedance probabilities around the coastline of Australia: Tropical cyclone-induced storm surges. Clim. Dyn. 2014, 42, 139–157. [Google Scholar] [CrossRef] [Green Version]
- Bonaldo, D.; Antonioli, F.; Archetti, R.; Bezzi, A.; Correggiari, A.; Davolio, S.; Falco, D.G.; Fantini, M.; Fontolan, G.; Furlani, S.; et al. Integrating multidisciplinary instruments for assessing coastal vulnerability to erosion and sea level rise: Lessons and challenges from the Adriatic Sea, Italy. J. Coast. Conserv. 2019, 23, 19–37. [Google Scholar] [CrossRef]
- Weisberg, R.H.; Zheng, L. Hurricane storm surge simulation for Tampa Bay. Estuar. Coasts 2006, 29, 899–913. [Google Scholar] [CrossRef]
- Orton, P.; Georgas, N.; Blumberg, A.; Pullen, J. Detailed modeling of recent severe storm tides in estuaries of the New York City region. J. Geophys. Res. Oceans 2012, 117. [Google Scholar] [CrossRef] [Green Version]
- Condon, A.J.; Sheng, Y.P. Optimal storm generation for evaluation of the storm surge inundation threat. Ocean Eng. 2012, 43, 13–22. [Google Scholar] [CrossRef]
- Iish, J.L.; Resio, D.T.; Ratcliff, J.J. The influence of storm size on hurricane surge. J. Phys. Oceanogr. 2008, 38, 2003–2013. [Google Scholar] [CrossRef]
- Sun, Y.; Zhong, Z.; Li, T.; Yi, L.; Hu, Y.; Wan, H.; Chen, H.; Liao, Q.; Ma, C.; Li, Q. Impact of ocean warming on tropical cyclone size and its destructiveness. Sci. Rep. 2017, 7, 8154. [Google Scholar] [CrossRef] [PubMed]
- Brand, S. Very large and very small typhoon of the Western North Pacific Ocean. J. Meteorol. Soc. Jpn. Ser. II 1972, 50, 332–341. [Google Scholar] [CrossRef] [Green Version]
- Merrill, R.T. A comparison of large and small tropical cyclones. Mon. Weather Rev. 1984, 112, 1408–1418. [Google Scholar] [CrossRef] [Green Version]
- Cocks, S.B.; Gray, W.M. Variability of the outer wind profiles of western North Pacific typhoons: Classifications and techniques for analysis and forecasting. Mon. Weather Rev. 2002, 130, 1989–2005. [Google Scholar] [CrossRef] [Green Version]
- Knaff, J.A.; Longmore, S.P.; Molenar, D.A. An objective satellite-based tropical cyclone size climatology. J. Clim. 2014, 27, 455–476. [Google Scholar] [CrossRef]
- Knaff, J.A.; Slocum, C.J.; Musgrave, K.D.; Sampson, C.R.; Strahl, B.R. Using Routinely Available Information to Estimate Tropical Cyclone Wind Structure. Mon. Weather Rev. 2016, 144, 1233–1247. [Google Scholar] [CrossRef]
- Holmlund, K.; Velden, C.S.; Rohn, M. Enhanced automated quality control applied to high-density satellite-derived winds. Mon. Weather Rev. 2016, 129, 517–529. [Google Scholar] [CrossRef]
- Velden, C.; Daniels, J.; Stettner, D.; Santek, D.; Key, J.; Dunion, J.; Holmlund, K.; Dengel, G.; Bresky, W.; Menzel, P. Recent innovations in deriving tropospheric winds from meteorological satellites. Bull. Am. Meteorol. Soc. 2005, 86, 205–223. [Google Scholar] [CrossRef] [Green Version]
- Jones, W.L.; Grantham, W.L.; Schroeder, L.C.; Johnson, J.W. Microwave scattering from the ocean surface (short papers). Microw. Theory Tech. IEEE Trans. 1975, 23, 1053–1058. [Google Scholar] [CrossRef]
- Lu, X.; Yu, H.; Yang, X.; Li, X. Estimating tropical cyclone size in the northwestern pacific from geostationary satellite infrared images. Remote Sens. 2017, 9, 728. [Google Scholar] [CrossRef] [Green Version]
- Lee, C.S.; Cheung, K.K.W.; Fang, W.T.; Elsberry, R.L. Initial maintenance of tropical cyclone size in the western North Pacific. Mon. Weather Rev. 2010, 138, 3207–3223. [Google Scholar] [CrossRef]
- Chan, K.T.F.; Chan, J.C.L. Size and strength of tropical cyclones as inferred from QuikSCAT data. Mon. Weather Rev. 2012, 140, 811–824. [Google Scholar] [CrossRef]
- Liu, K.S.; Chan, J.C.L. Size of Tropical cyclone as inferred from ERS-1 and ERS-2 Data. Mon. Weather Rev. 1999, 127, 2992–3001. [Google Scholar] [CrossRef]
- Holland, G. An analytic model of the wind and pressure profiles in Hurricanes. Mon. Weather Rev. 1980, 108, 1212–1218. [Google Scholar] [CrossRef]
- Zou, X.L.; Xiao, Q.N. Studies on the initialization and simulation of a mature hurricane using a variational bogus data assimilation scheme. J. Atmos. Sci. 1999, 57, 836–860. [Google Scholar] [CrossRef] [Green Version]
- Knaff, J.A.; DeMaria, M.; Molenar, D.A.; Sampson, C.R.; Seybold, M.G. An automated, objective, multi-satellite platform tropical cyclone surface wind analysis. J. Appl. Meteorol. Climatol. 2011, 50, 2149–2166. [Google Scholar] [CrossRef] [Green Version]
- Ricchi, A.; Miglietta, M.M.; Bonaldo, D.; Cioni, G.; Rizza, U.; Carniel, S. Multi-physics ensemble versus Atmosphere–Ocean coupled model simulations for a tropical-like cyclone in the Mediterranean Sea. Atmosphere 2019, 10, 202. [Google Scholar] [CrossRef] [Green Version]
- Benetazzo, A.; Barbariol, F.; Bergamasco, F.; Torsello, A.; Carniel, S.; Sclavo, M. Observation of extreme sea waves in a space-time ensemble. J. Phys. Oceanogr. 2015, 45, 2261–2275. [Google Scholar] [CrossRef] [Green Version]
- Needham, H.F.; Keim, B.D. An empirical analysis on the relationship between tropical cyclone size and storm surge heights along the US. Gulf Coast. Earth Interact. 2014, 18, 1–15. [Google Scholar] [CrossRef]
- Mo, D.; Hou, Y.; Li, J.; Liu, Y. Study on the storm surges induced by cold waves in the northern east China Sea. J. Mar. Syst. 2016, 160, 26–39. [Google Scholar] [CrossRef]
- Liu, F.; Su, J.; Moll, A.; Krasemann, H.; Chen, X.; Pohlmann, T.; Wirtz, K. Assessment of the summer–autumn bloom in the bohai sea using satellite images to identify the roles of wind mixing and light conditions. J. Mar. Syst. 2014, 129, 303–317. [Google Scholar] [CrossRef] [Green Version]
- Hu, L.; Shi, X.; Bai, Y.; Qiao, S.; Li, L.; Yu, Y.; Yang, G.; Ma, D.; Guo, Z. Recent organic carbon sequestration in the shelf sediments of the Bohai Sea and Yellow Sea, China. J. Mar. Syst. 2015, 155, 50–58. [Google Scholar] [CrossRef]
- Bao, X.; Na, L.; Yao, Z.; Wu, D. Seasonal variation characteristics of temperature and salinity of the North Yellow Sea. Period. Ocean. Univ. China 2009, 39, 553–562. [Google Scholar]
- Hyangsun, H.; Sanggyun, L.; Jungho, I.; Miae, K.; Myong-In, L.; Myoung, A.; Sung, C. Detection of convective initiation using meteorological imager onboard communication, ocean, and meteorological satellite based on machine learning approaches. Remote Sens. 2015, 7, 9184–9204. [Google Scholar] [CrossRef] [Green Version]
- Broomhall, M.; Grant, I.; Majewski, L.; Willmott, M.; Jones, D.; Kuleshov, Y. Improving the Australian tropical cyclone database: Extension of the GMS satellite digital image archive. In Indian Ocean Tropical Cyclones and Climate Change; Springer: Haarlem, The Netherlands, 2010; pp. 199–206. [Google Scholar] [CrossRef]
- Yi, L.; Zhang, S.P.; Thies, B.; Shi, X.M.; Trachte, K.; Bendix, J. Spatio-temporal detection of fog and low stratus top heights over the yellow sea with geostationary satellite data as a precondition for ground fog detection—A feasibility study. Atmos. Res. 2015, 151, 212–223. [Google Scholar] [CrossRef]
- Willoughby, H.E.; Darling, R.W.; Rahn, M.E. Parametric representation of the primary hurricane vortex. Part II: A new family of sectionally continuous profiles. Mon. Weather Rev. 2006, 134, 1102–1120. [Google Scholar] [CrossRef] [Green Version]
- Jelesnianski, C.; Chen, J.; Shaffer, W. SLOSH: Sea, Lake, and Overland Surges from Hurricanes; NOAA Tech. Rep. NWS 48; United States Department of Commerce, NOAA/AOML Library: Miami, FL, USA, 1992; p. 71.
- Holland, G.J.; Belanger, J.I.; Fritz, A. A revised model for radial profiles of hurricane winds. Mon. Weather Rev. 2010, 138, 4393–4401. [Google Scholar] [CrossRef]
- Moon, I.J.; Ginis, I.; Hara, T. Impact of the reduced drag coefficient on ocean wave modeling under hurricane conditions. Mon. Weather Rev. 2018, 136, 1217–1223. [Google Scholar] [CrossRef]
- Powell, M.D.; Vickery, P.J.; Reinhold, T.A. Reduced drag coefficient for high wind speeds in tropical cyclones. Nature 2003, 422, 279–283. [Google Scholar] [CrossRef] [PubMed]
- Oey, L.Y.; Ezer, T.; Wang, D.P.; Fan, S.J.; Yin, X.Q. Loop current warming by Hurricane Wilma. Geophys. Res. Lett. 2006, 33, 153–172. [Google Scholar] [CrossRef] [Green Version]
- Chen, C.; Liu, H.; Beardsley, R.C. An unstructured grid, finite-volume, three-dimensional, primitive equations ocean model: Application to coastal ocean and estuaries. J. Atmos. Ocean. Technol. 2003, 20, 159–186. [Google Scholar] [CrossRef]
- Benassai, G.; Migliaccio, M.; Montuori, A. Sea wave numerical simulations with COSMO-SkyMed? SAR data. J. Coast. Res. 2013, 65, 660–665. [Google Scholar] [CrossRef]
- Zachry, B.C.; Booth, W.J.; Rhome, J.R.; Sharon, T.M. A national view of storm surge risk and inundation. Weather Clim. Soc. 2015, 7, 109–117. [Google Scholar] [CrossRef]
- Lin, Y.; Zhao, M.; Zhang, M. Tropical cyclone rainfall area controlled by relative sea surface temperature. Nat. Commun. 2015, 6, 6591. [Google Scholar] [CrossRef]
Figure 1.
The northern East China Sea, showing names, locations, and bottom topography (in meters with mean sea level (MSL)) as the vertical datum. The black line is the dividing line between northern and southern Yellow Sea.
Figure 1.
The northern East China Sea, showing names, locations, and bottom topography (in meters with mean sea level (MSL)) as the vertical datum. The black line is the dividing line between northern and southern Yellow Sea.
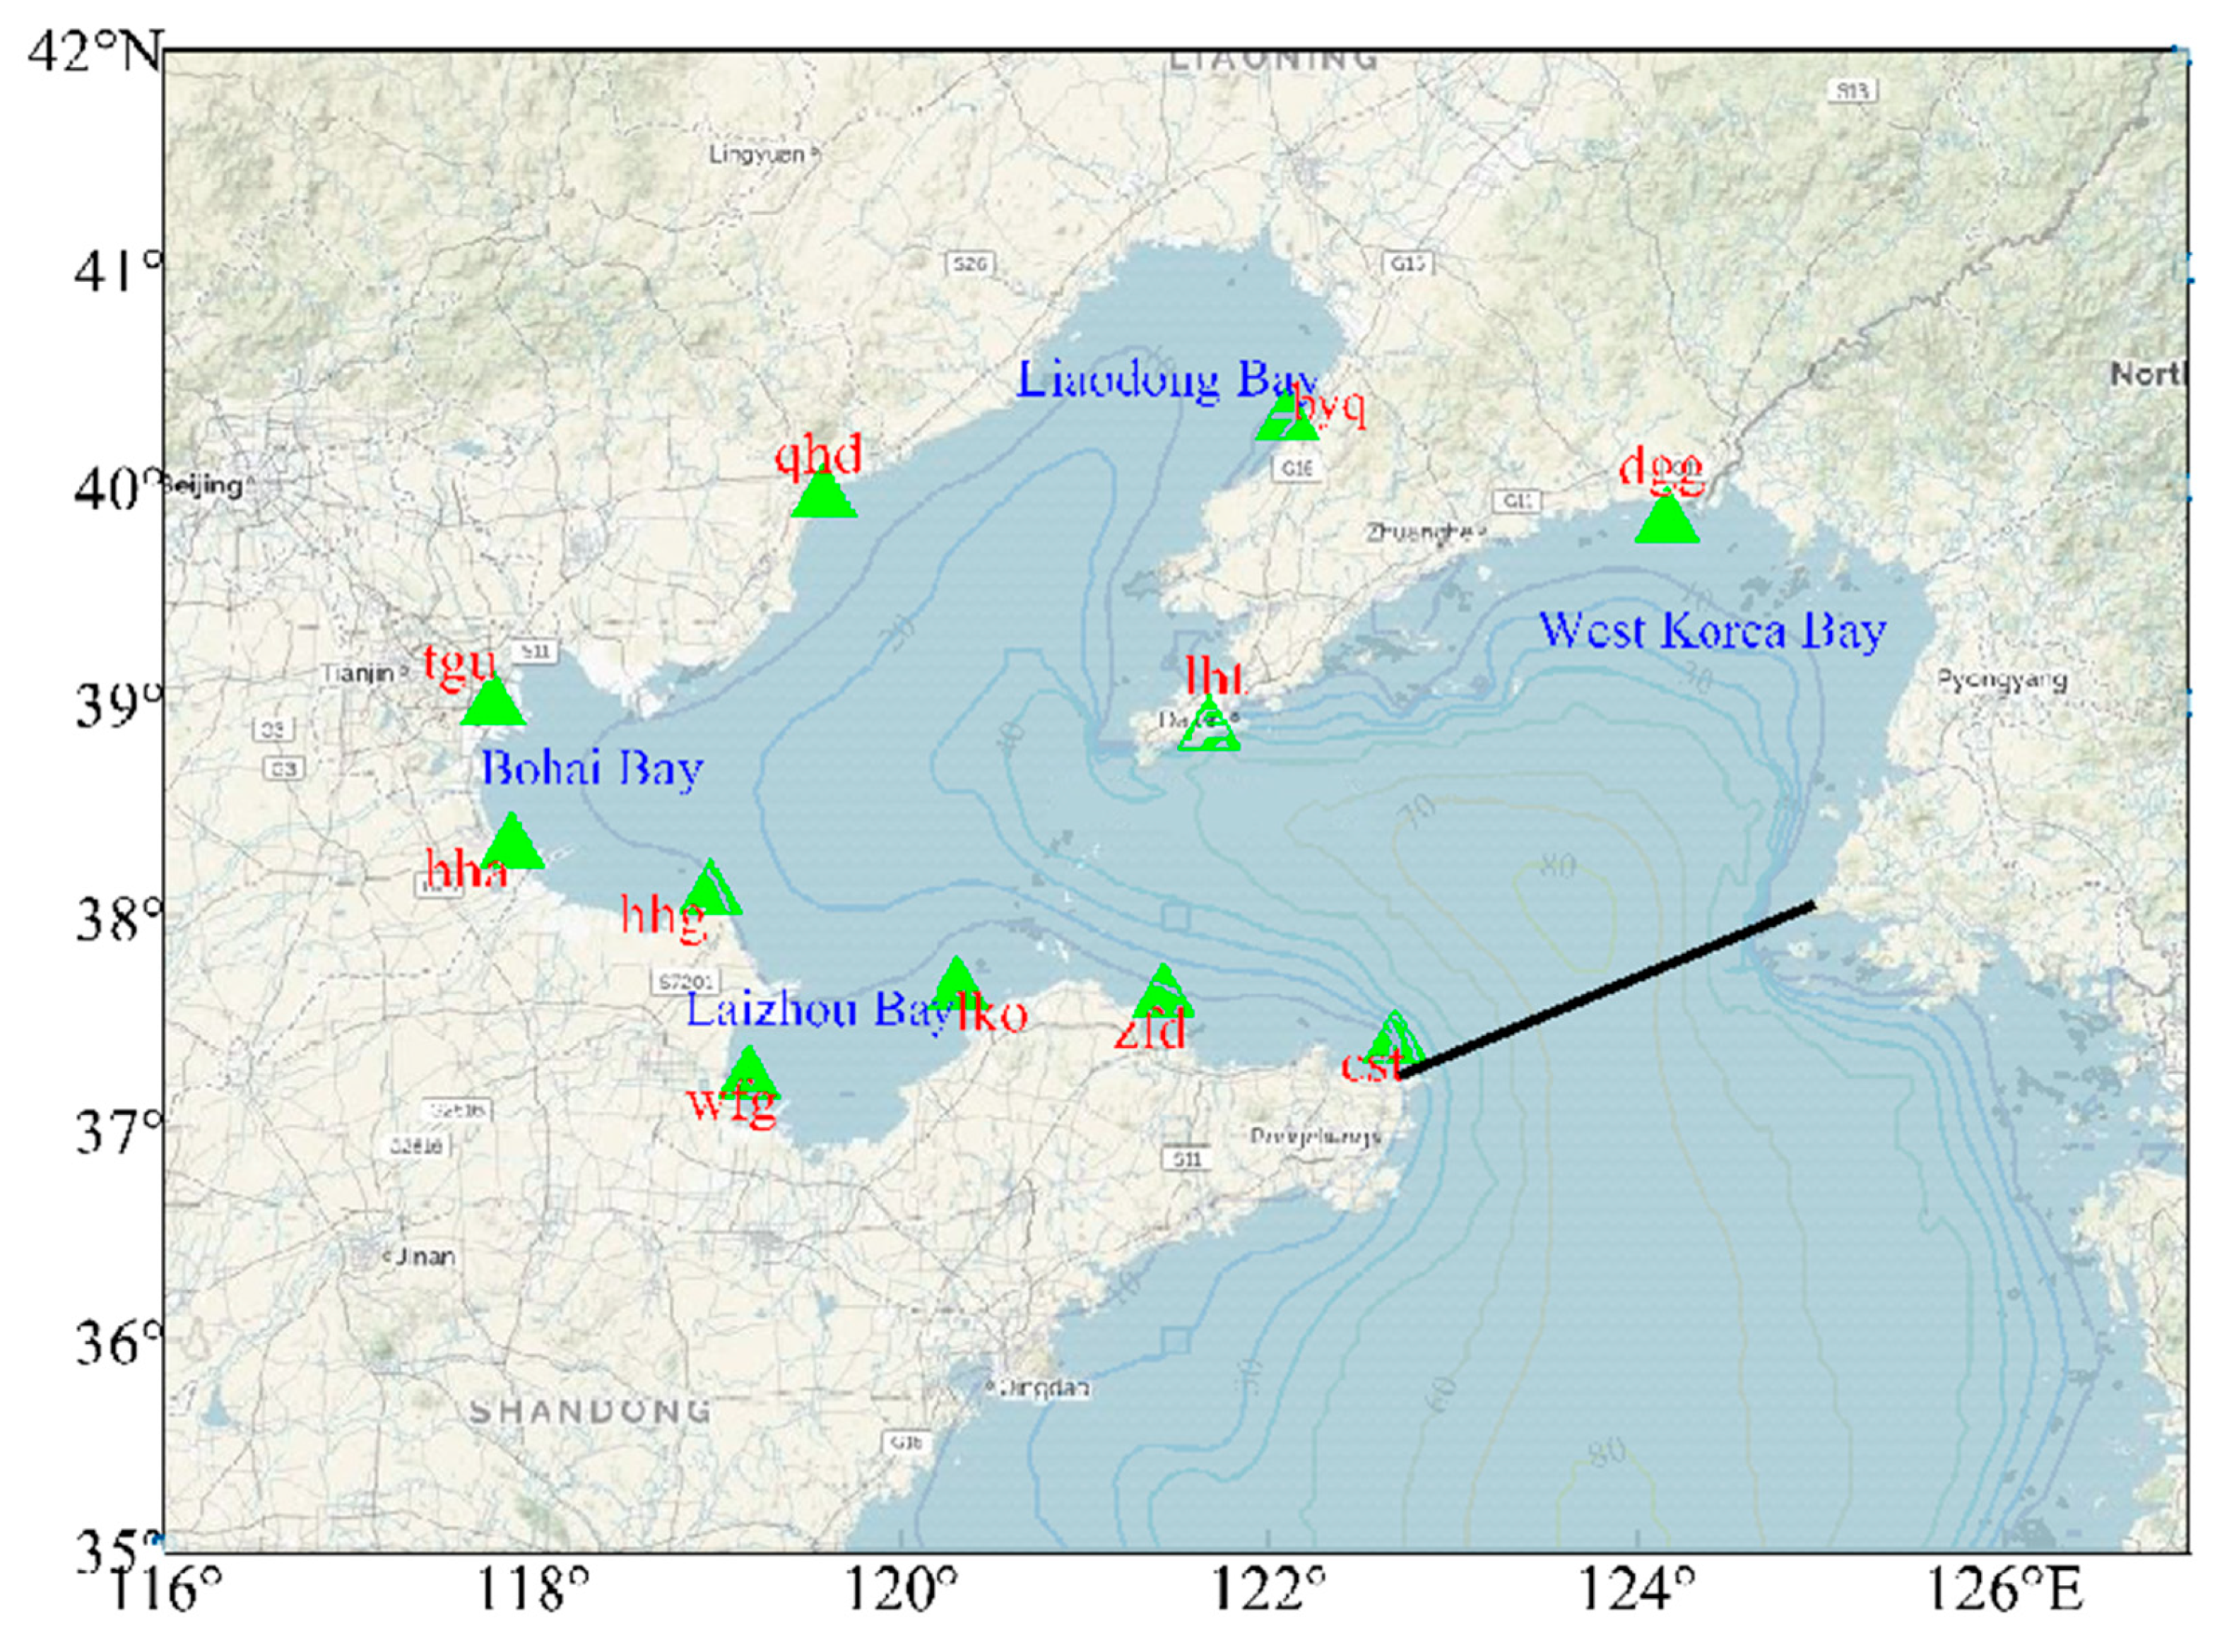
Figure 2.
Drag coefficient as a function of maximum wind speed (MXW).

Figure 3.
Computed model domains of finite-volume coastal ocean model (FVCOM). The paths of Typhoon Winnie (TY9711) and Typhoon Damrey (TY1210) are indicated by different color lines. The star is the cross point of the two typhoons and is also the time and location of the space map below.
Figure 3.
Computed model domains of finite-volume coastal ocean model (FVCOM). The paths of Typhoon Winnie (TY9711) and Typhoon Damrey (TY1210) are indicated by different color lines. The star is the cross point of the two typhoons and is also the time and location of the space map below.

Figure 4.
Shoreline and bathymetry of the northern East China Sea (NECS) after correction of the 1:50,000 electronic chart.
Figure 4.
Shoreline and bathymetry of the northern East China Sea (NECS) after correction of the 1:50,000 electronic chart.

Figure 5.
The dual-exponential (DUAL) model wind field and corresponding wind pressure diagram.

Figure 6.
Simulated (blue lines) and observed (red lines) time series of storm surges at tide stations zfd, lko, wfg, tgu, byq, and lht induced by Typhoon Damrey (TY1210) in August 2012.
Figure 6.
Simulated (blue lines) and observed (red lines) time series of storm surges at tide stations zfd, lko, wfg, tgu, byq, and lht induced by Typhoon Damrey (TY1210) in August 2012.

Figure 7.
The maximum envelope of storm surge (MESS) of Typhoon Winnie (TY9711) and Typhoon Damrey (TY1210) simulated spatial distribution. The unit of the storm surge is meters (m).
Figure 7.
The maximum envelope of storm surge (MESS) of Typhoon Winnie (TY9711) and Typhoon Damrey (TY1210) simulated spatial distribution. The unit of the storm surge is meters (m).

Figure 8.
The minimum pressure and MXWs of Typhoon Winnie (TY9711) and Typhoon Damrey (TY1210) curves over time are displayed at the top. Remaining tide levels calculated from observations of storm surges at the tide stations are displayed at the bottom. The star symbol represents the location at which the paths of the two typhoons crossed.

Figure 9.
Map of the satellite inversion of TY9711 and TY1210 size.
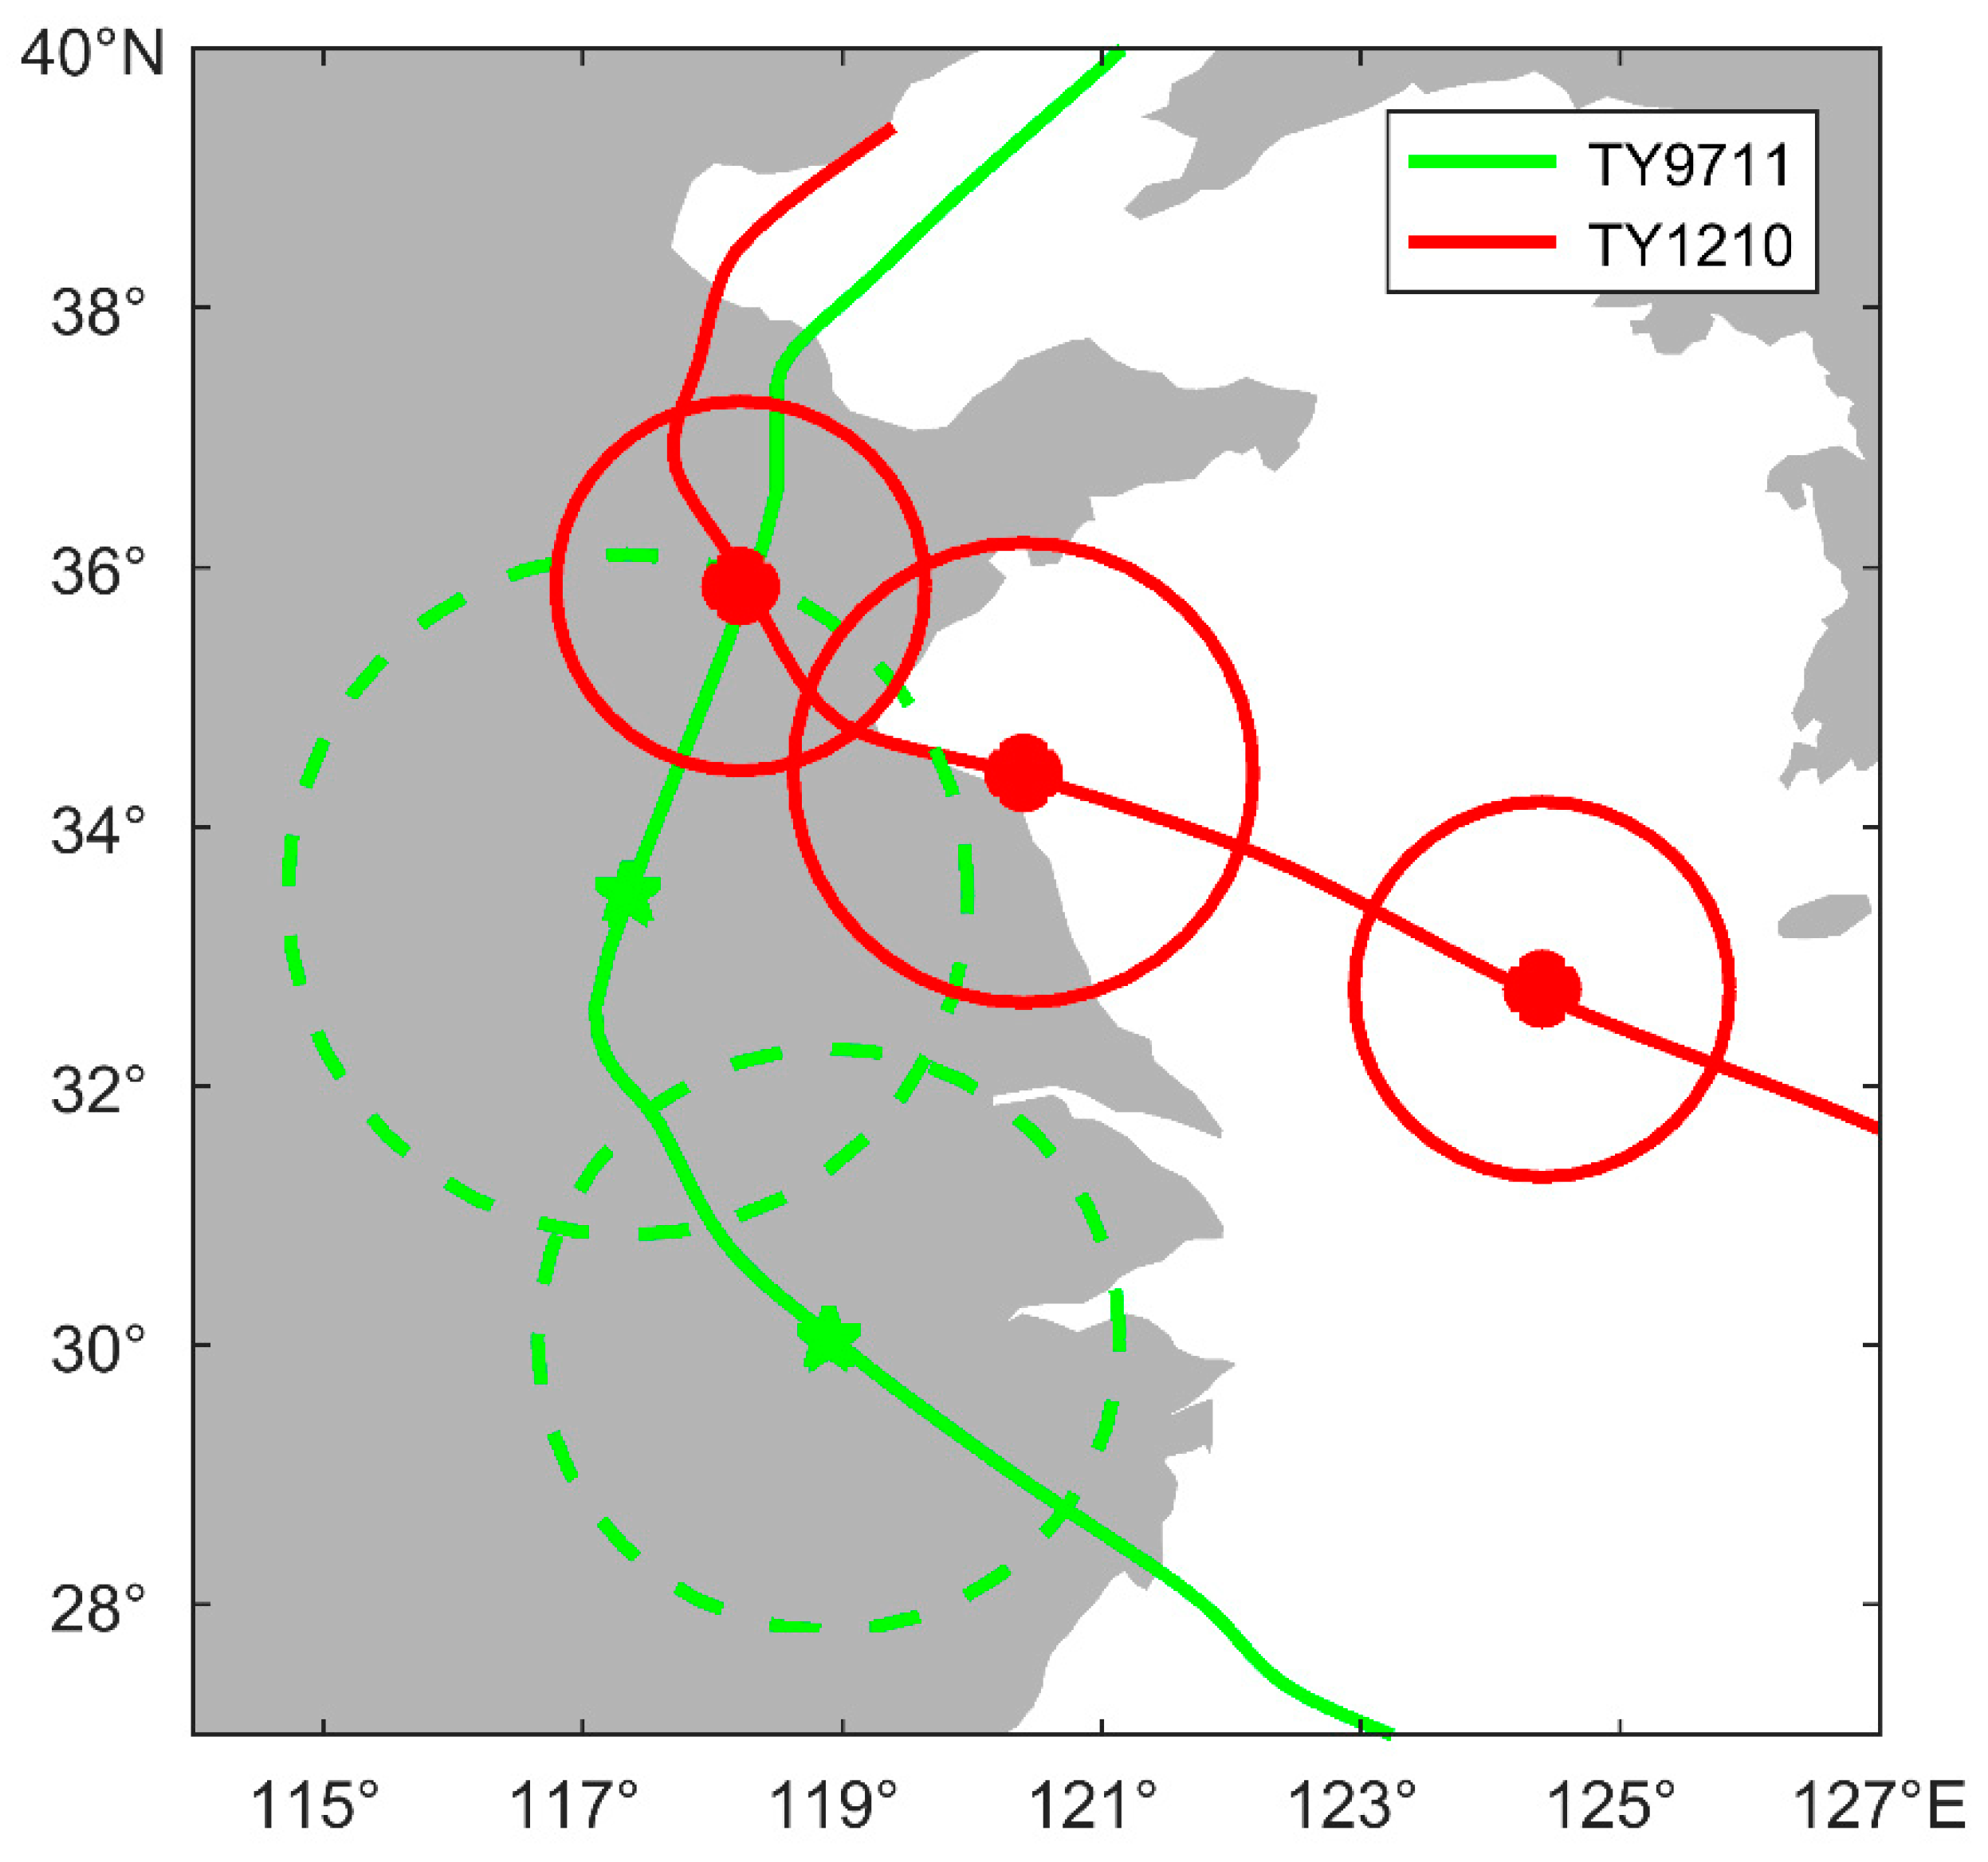
Figure 10.
Time series (at representative spots for the tide stations) of simulated surges (cm) induced by different MXWs.
Figure 10.
Time series (at representative spots for the tide stations) of simulated surges (cm) induced by different MXWs.

Figure 11.
Wind cross-sections from the center of the typhoon at different MXWs. The black star represents the position of the seven-level wind circle range (R7).
Figure 11.
Wind cross-sections from the center of the typhoon at different MXWs. The black star represents the position of the seven-level wind circle range (R7).

Figure 12.
The maximum envelope of storm surge (MESS) of the typhoon at di_erent MXWs. The unit of the storm surge is meter (m).
Figure 12.
The maximum envelope of storm surge (MESS) of the typhoon at di_erent MXWs. The unit of the storm surge is meter (m).

Figure 13.
Wind cross-sections from the center of the typhoon at different TC sizes and radius of maximum wind (RMW). The black star represents the position of the seven-level wind circle range (R7).
Figure 13.
Wind cross-sections from the center of the typhoon at different TC sizes and radius of maximum wind (RMW). The black star represents the position of the seven-level wind circle range (R7).
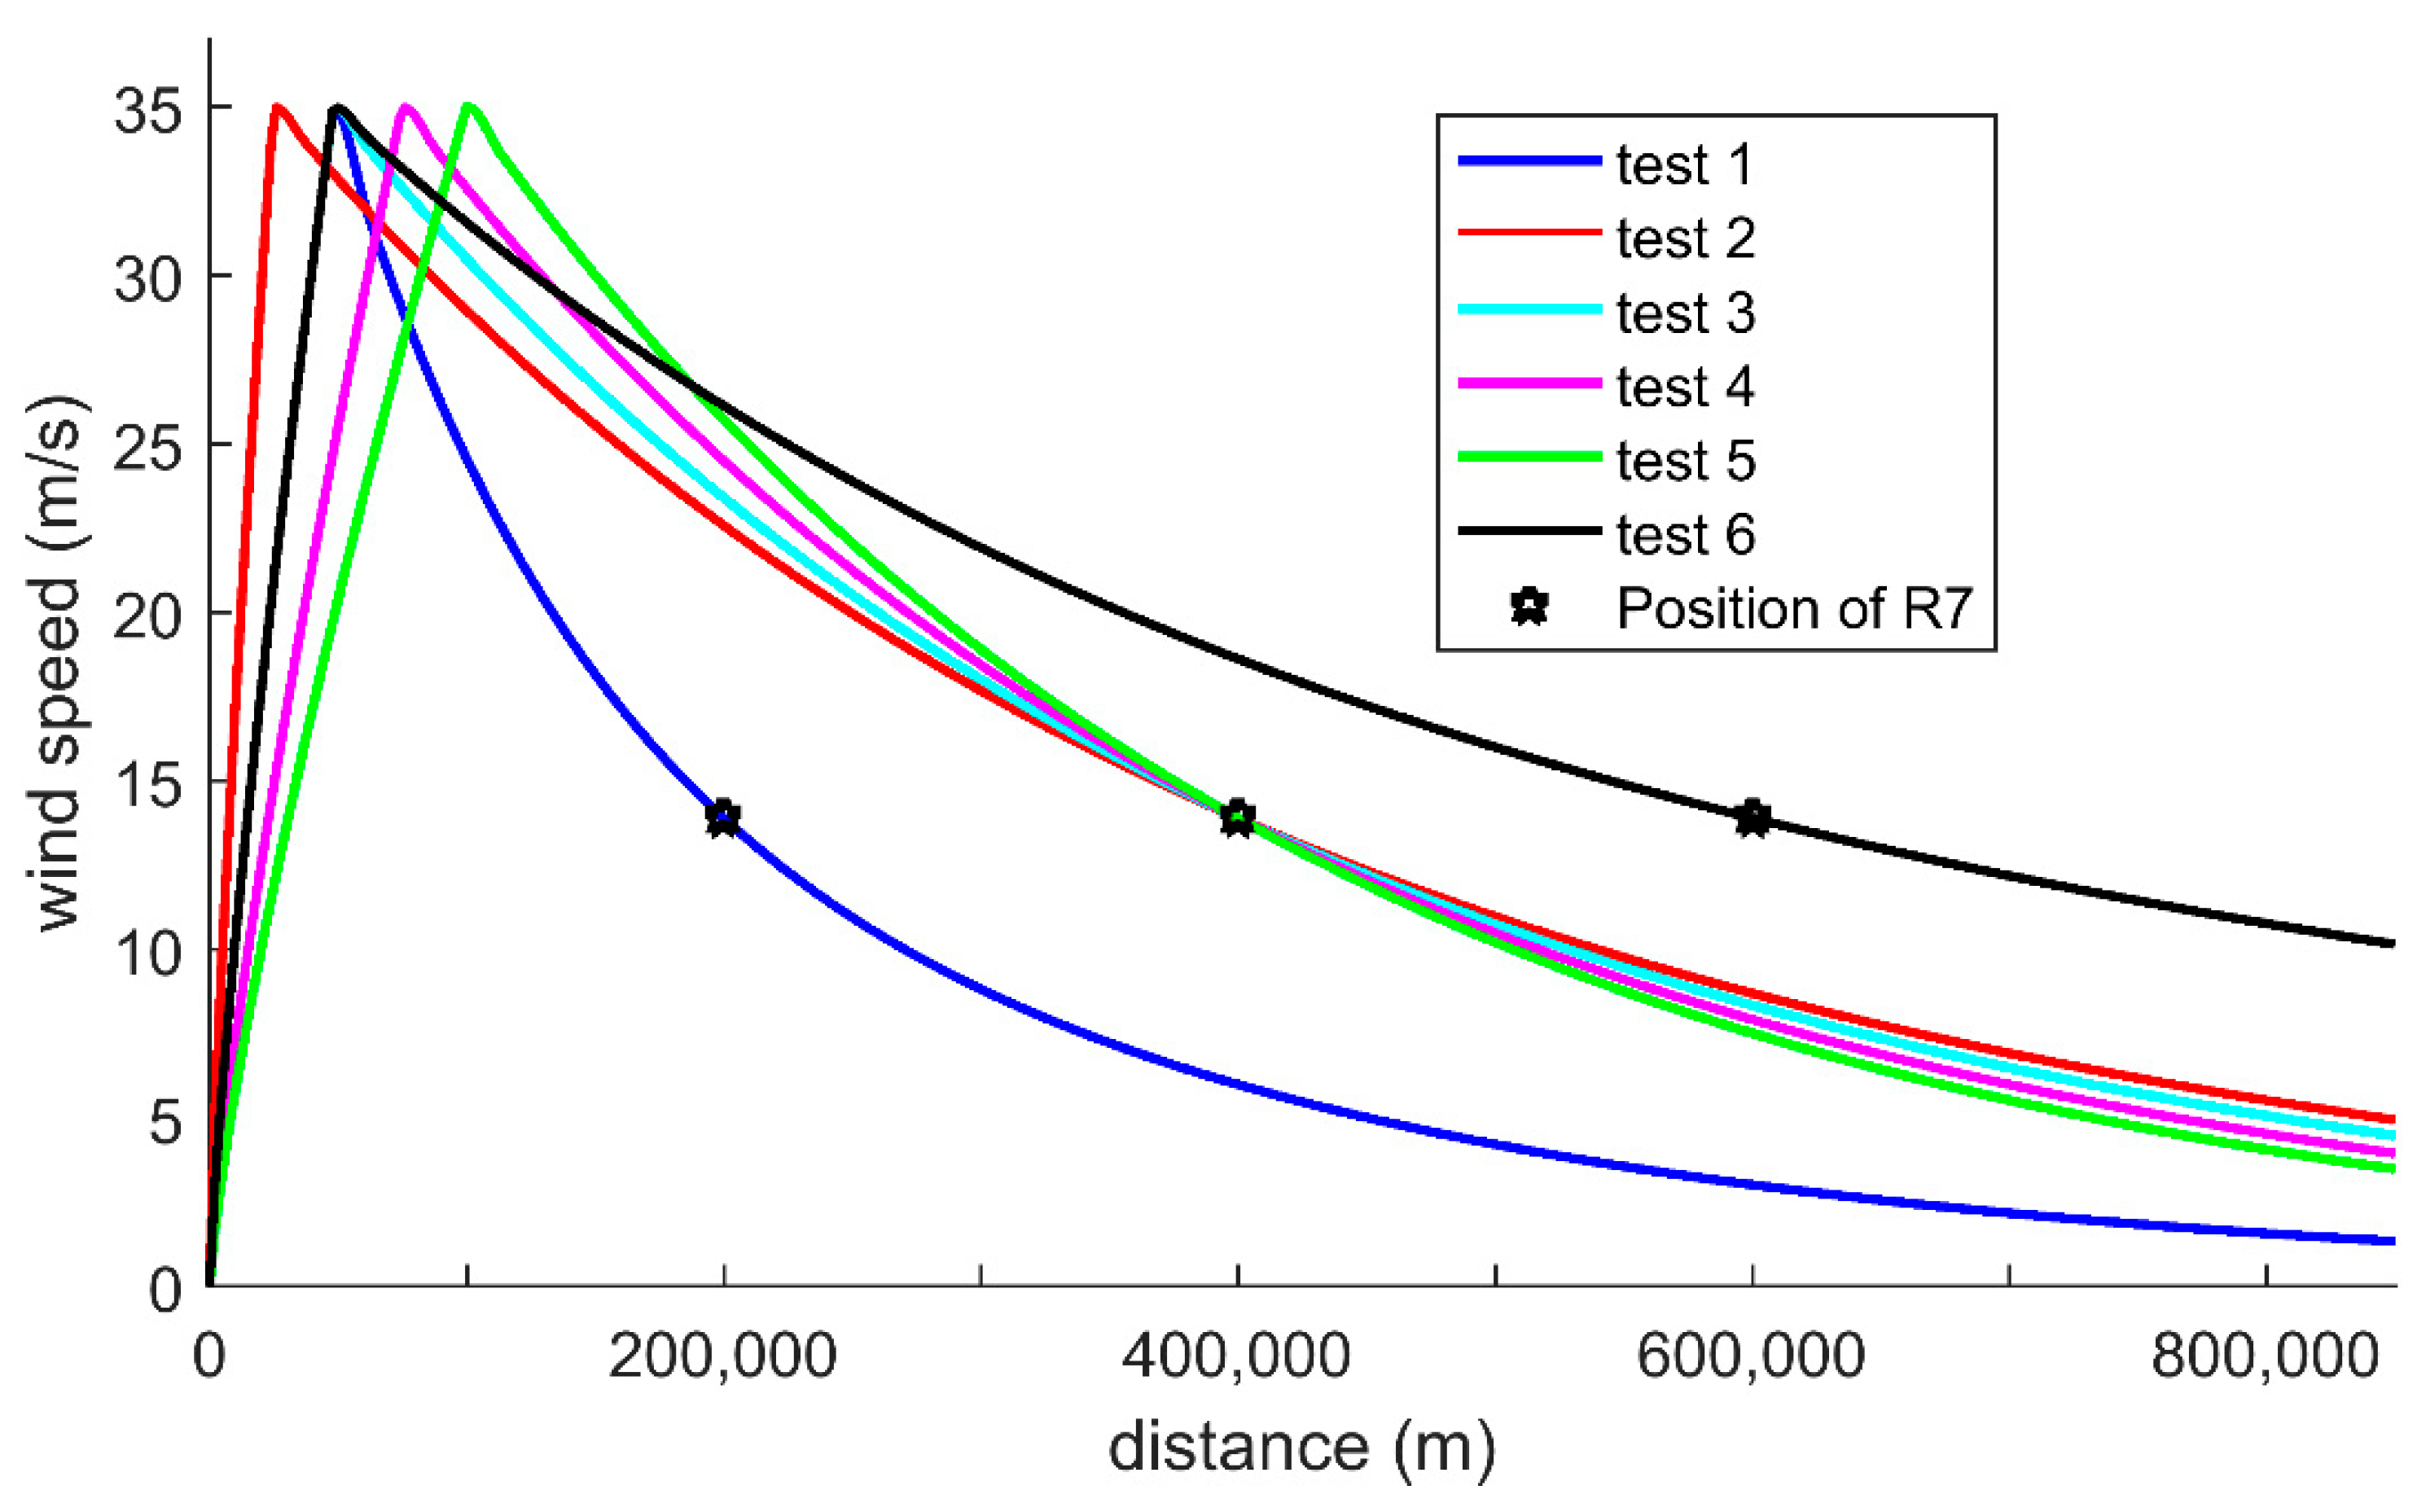
Figure 14.
Maximum envelope of storm surge (MESS) induced by the ideal test at different TC sizes and RMWs. The unit of the storm surge is meter (m).
Figure 14.
Maximum envelope of storm surge (MESS) induced by the ideal test at different TC sizes and RMWs. The unit of the storm surge is meter (m).

Figure 15.
Time series (at representative spots from the tide stations) of simulated surges (cm) induced by different TC sizes and RMWs.
Figure 15.
Time series (at representative spots from the tide stations) of simulated surges (cm) induced by different TC sizes and RMWs.


Table 1.
Maximum wind speed ideal test parameters.
| MXW (m/s) | RMW (m, Latitude = 36°N) | R7 (m) | |
|---|---|---|---|
| test 1 | 20 | 62,533 | 200,000 |
| test 2 | 30 | 53,555 | 200,000 |
| test 3 | 35 | 49,561 | 200,000 |
| test 4 | 40 | 45,865 | 200,000 |
| test 5 | 45 | 42,445 | 200,000 |
| test 6 | 50 | 39,279 | 200,000 |
Table 2.
Tropical cyclone (TC) size ideal test parameters.
| MXW (m/s) | RMW (m, Latitude = 36°N) | R7 (m) | |
|---|---|---|---|
| test 1 | 35 m/s | 49,561 | 200,000 |
| test 2 | 35 m/s | 25,000 | 400,000 |
| test 3 | 35 m/s | 49,561 | 400,000 |
| test 4 | 35 m/s | 75,000 | 400,000 |
| test 5 | 35 m/s | 100,000 | 400,000 |
| test 6 | 35 m/s | 49,561 | 600,000 |
Table 3.
Direct economic losses.
| Jiangsu | Shandong | Hebei | Tianjin | Total | |
|---|---|---|---|---|---|
| TY9711 (million yuan) | 3000 | 4500 | 200 | 600 | 8300 |
| TY1210 (million yuan) | 537 | 1599 | 2044 | 4 | 4184 |
© 2019 by the authors. Licensee MDPI, Basel, Switzerland. This article is an open access article distributed under the terms and conditions of the Creative Commons Attribution (CC BY) license (http://creativecommons.org/licenses/by/4.0/).
Share and Cite
MDPI and ACS Style
Li, J.; Hou, Y.; Mo, D.; Liu, Q.; Zhang, Y. Influence of Tropical Cyclone Intensity and Size on Storm Surge in the Northern East China Sea. Remote Sens. 2019, 11, 3033. https://doi.org/10.3390/rs11243033
AMA Style
Li J, Hou Y, Mo D, Liu Q, Zhang Y. Influence of Tropical Cyclone Intensity and Size on Storm Surge in the Northern East China Sea. Remote Sensing. 2019; 11(24):3033. https://doi.org/10.3390/rs11243033
Chicago/Turabian StyleLi, Jian, Yijun Hou, Dongxue Mo, Qingrong Liu, and Yuanzhi Zhang. 2019. "Influence of Tropical Cyclone Intensity and Size on Storm Surge in the Northern East China Sea" Remote Sensing 11, no. 24: 3033. https://doi.org/10.3390/rs11243033
Note that from the first issue of 2016, this journal uses article numbers instead of page numbers. See further details here.