Uncertainties in Evapotranspiration Estimates over West Africa
by
 , and
, and
Hahn Chul Jung
1,2,* ,
,
Augusto Getirana
1,3,
Kristi R. Arsenault
1,4,
Thomas R.H. Holmes
1 and
and
Amy McNally
1,3 1
Hydrological Sciences Laboratory, NASA Goddard Space Flight Center, Greenbelt, MD 20771, USA
2
Science Systems and Applications, Inc., Lanham, MD 20706, USA
3
Earth System Science Interdisciplinary Center, University of Maryland, College Park, MD 20740, USA
4
Science Applications International Corporation, McLean, VA 22102, USA
*
Author to whom correspondence should be addressed.
Remote Sens. 2019, 11(8), 892; https://doi.org/10.3390/rs11080892
Submission received: 18 March 2019
/
Revised: 8 April 2019
/
Accepted: 10 April 2019
/
Published: 12 April 2019
(This article belongs to the Special Issue Remote Sensing of Evapotranspiration (ET))
Abstract
:An evapotranspiration (ET) ensemble composed of 36 land surface model (LSM) experiments and four diagnostic datasets (GLEAM, ALEXI, MOD16, and FLUXNET) is used to investigate uncertainties in ET estimate over five climate regions in West Africa. Diagnostic ET datasets show lower uncertainty estimates and smaller seasonal variations than the LSM-based ET values, particularly in the humid climate regions. Overall, the impact of the choice of LSMs and meteorological forcing datasets on the modeled ET rates increases from north to south. The LSM formulations and parameters have the largest impact on ET in humid regions, contributing to 90% of the ET uncertainty estimates. Precipitation contributes to the ET uncertainty primarily in arid regions. The LSM-based ET estimates are sensitive to the uncertainty of net radiation in arid region and precipitation in humid region. This study serves as support for better determining water availability for agriculture and livelihoods in Africa with earth observations and land surface models.

1. Introduction
Accurately estimating evapotranspiration (ET) over West Africa is particularly important for water resources management, weather monitoring and climate change impact assessment on agriculture and food security due to a strong land-atmosphere coupling [1,2]. Also, ET, governed by the surface water and energy budgets, plays an important role in West African monsoon development [3,4]. High uncertainty in ET estimates over West Africa from global models is an obstacle to investigate temporal and spatial variability in the regional hydrology, especially in the context of climate change [5,6]. Understanding ET uncertainties can improve estimates of water availability for agriculture and livelihoods in Africa. However, such a task is still a challenge in data-sparse regions [7,8,9]. Previously, Kato et al. [10] performed a sensitivity study of land surface model (LSM) simulations, including ET, under the Coordinated Enhanced Observing Period (CEOP) initiative, but none of the four reference sites were located in West Africa.
Several intercomparisions of different model- and/or satellite-based ET estimates have been carried out at different scales. At the global scale, the LandFlux-EVAL initiative [11,12] presented the benchmark synthesis products based on the analyses of multiple global scale ET estimates from LSMs, diagnostic (i.e., observation-based) datasets, and reanalyses. Other studies focused on Asia [13], South America [14], Africa [8], West Africa [9,15,16], and smaller regions, such as the Volta basin [7,17] and the Ouémé River basin [18]. In particular, the African Monsoon Multidisciplinary Analysis Land Surface Intercomparison Project (ALMIP) computed water budget components over the whole West Africa in its first phase (ALMIP-1) [4] and smaller areas within the region in its second phase (ALMIP-2) [19,20]. However, little is known about seasonal and regional ET uncertainty variations and the impacts of the choice of LSM, radiation forcing datasets, and precipitation on the ET uncertainty over West Africa. Few studies have only attempted to estimate annual ET uncertainties of regional watershed basins (e.g., the Lake Chad basin and the Niger River basin) [5] and investigate uncertainties and trends of global ET estimates using different combinations of ET models and meteorological forcing datasets [6].
The ensemble of ALMIP-1 models revealed that total annual ET corresponds to 77% of the total annual precipitation in West Africa and 85% in the Sahel [21]. The annual precipitation cycle is highly subject to the West African monsoon [22]. Overall, the average precipitation rates increase southwards. In the north, the hyper-arid, arid, and semi-arid regions are located within the Sahel region with a single peak rainy season from July to September [8,23]. In the south, due to a north-south migration of the Inter Tropical Convergence Zone (ITCZ), the sub-humid and humid regions are characterized by two rainy seasons: the first rainy season from May to July and the second rainy season from August to October. Although advances in climate modeling indicate oceans as the main contributor to the recent drought persistence in the Sahel [24], Tian and Peters-Lidard [25] found that West African land shows higher precipitation uncertainties associated with the ITCZ migration than its oceanic counterpart. Also, Vinukollu et al. [6] revealed high ET uncertainties in the Sahel due to the high variability of precipitation, radiation and other meteorological variables, leading to large differences among the models.
Satellite-based ET datasets share some features with physical energy and water balance descriptions of the LSM’s but are explicitly constrained by ‘diagnostic’ observations of surface states (e.g., surface temperature, soil moisture, vegetation water contents or relative humidity) [26]. For better understanding of the characteristics of the ET uncertainties, we investigate 36 LSM-based ET estimates and four diagnostic ET datasets from 2007 to 2011 during which all datasets overlap. Using the diagnostic ET uncertainties to shed some additional light on the model ensemble uncertainty can help give more insight to the variances and spread found among the ensemble of LSM-based ET results, which can be useful in a multi-model ensemble approach. Also, in terms of individual model spread across the different forcing data types, this study can offer some insights for assimilating ET or soil moisture fields. In this study, evaluation of model performance and identification of the primary sources of error in the ET estimates related to inaccurate forcing datasets and limited model parameterizations are beyond the scope of this work. Ground-based ET observations are not representative of LSM-based estimates due to spatial scale differences. The use of the satellite-based reference datasets are more appropriate scale for the LSM ensemble and uncertainty evaluation
The objectives of this study are to: (1) quantify the uncertainty range of net radiation and precipitation datasets as input parameters to estimate ET over West Africa; (2) compare spatial and temporal characteristics between LSM-based and diagnostic ET estimates; (3) analyze the sensitivity of LSMs in simulating ET to the uncertainty of net radiation and precipitation; and (4) investigate the impact of the choice of the model parameterization, meteorological forcing dataset, and precipitation on the LSM-based ET uncertainty. Because the annual precipitation has a latitudinal gradient in West Africa, we divided the domain between 18°W–25°E and 5°N–27°N into five climate regions (highlighted in Figure 1a). The classification of climate regions was based on similar aridity conditions for the 1950–2000 period, as suggested in [27,28]. This study serves to offer further insight on improved land surface modeling designs and better monitoring of water and energy budgets in West Africa.
2. Data and Methods
2.1. LSM-based ET Datasets
All LSM-based ET outputs were produced daily on a 0.25° spatial resolution domain. The NASA Land Information System (LIS) [29] was used as the modeling platform. Table 1 lists the details of the 36 model experiments.
2.1.1. Land Surface Models
Four LSMs are used in this study to simulate the water and energy fluxes in West Africa, including the Noah land surface model (Noah), version 3.3 [30,31], Noah land surface model with Multi-Parameterization (NoahMP), version 3.6 [32,33], the Variable Infiltration Capacity (VIC), version 4.1.2 [34], and Catchment Land Surface Model (CLSM), version Fortuna 2.5 [35,36]. CLSM and NoahMP were selected in this study because of their ability to explicitly represent groundwater and high performance of data assimilation framework within the NASA LIS system [41,42]. Noah and VIC were included to investigate the impact of different LSM parameterizations on modeling ET estimates and to increase the number of ensemble members included in the uncertainty analysis
All four LSMs calculate ET as the sum of water loss from bare soil and canopy intercepted water (i.e., evaporation) and transpiration via the canopy leaves. In each model, the actual ET is computed as a modification of a potential value, using the Penman equation [43] for potential ET in Noah or the Penman–Monteith [44] in the other three LSMs. The Noah model applies additional resistance factors as a variation on Penman–Monteith [30]. The Penman–Monteith equation calculates actual ET typically through scaling coefficients related to different vegetation or crop types. The Penman–Monteith is more sensitive to vegetation specific parameters and allows for a composited plant stomatal resistance to vapor transport, whereas the Penman equation assumes a continuously available water source and no canopy resistance.
In addition to the ET formulation, model inputs and physics directly impacting ET estimates include meteorological forcing data, precipitation, land cover, soil type, infiltration rates, and drainage in the soil column. In this study, ET uncertainties attributable to these LSM formulations and parameters in the modeled ET rates, except for meteorological forcing and precipitation, are considered as ET uncertainty due to LSMs. For land cover classes, Noah and NoahMP use the International Geosphere-Biosphere Programme (IGBP) classification from the NASA’s Terra Moderate Resolution Imaging Spectroradiometer (MODIS) observations [45]. VIC and CLSM used the University of Maryland classification from the Advanced Very High-Resolution Radiometer (AVHRR) observations [46].
2.1.2. Meteorological Forcings
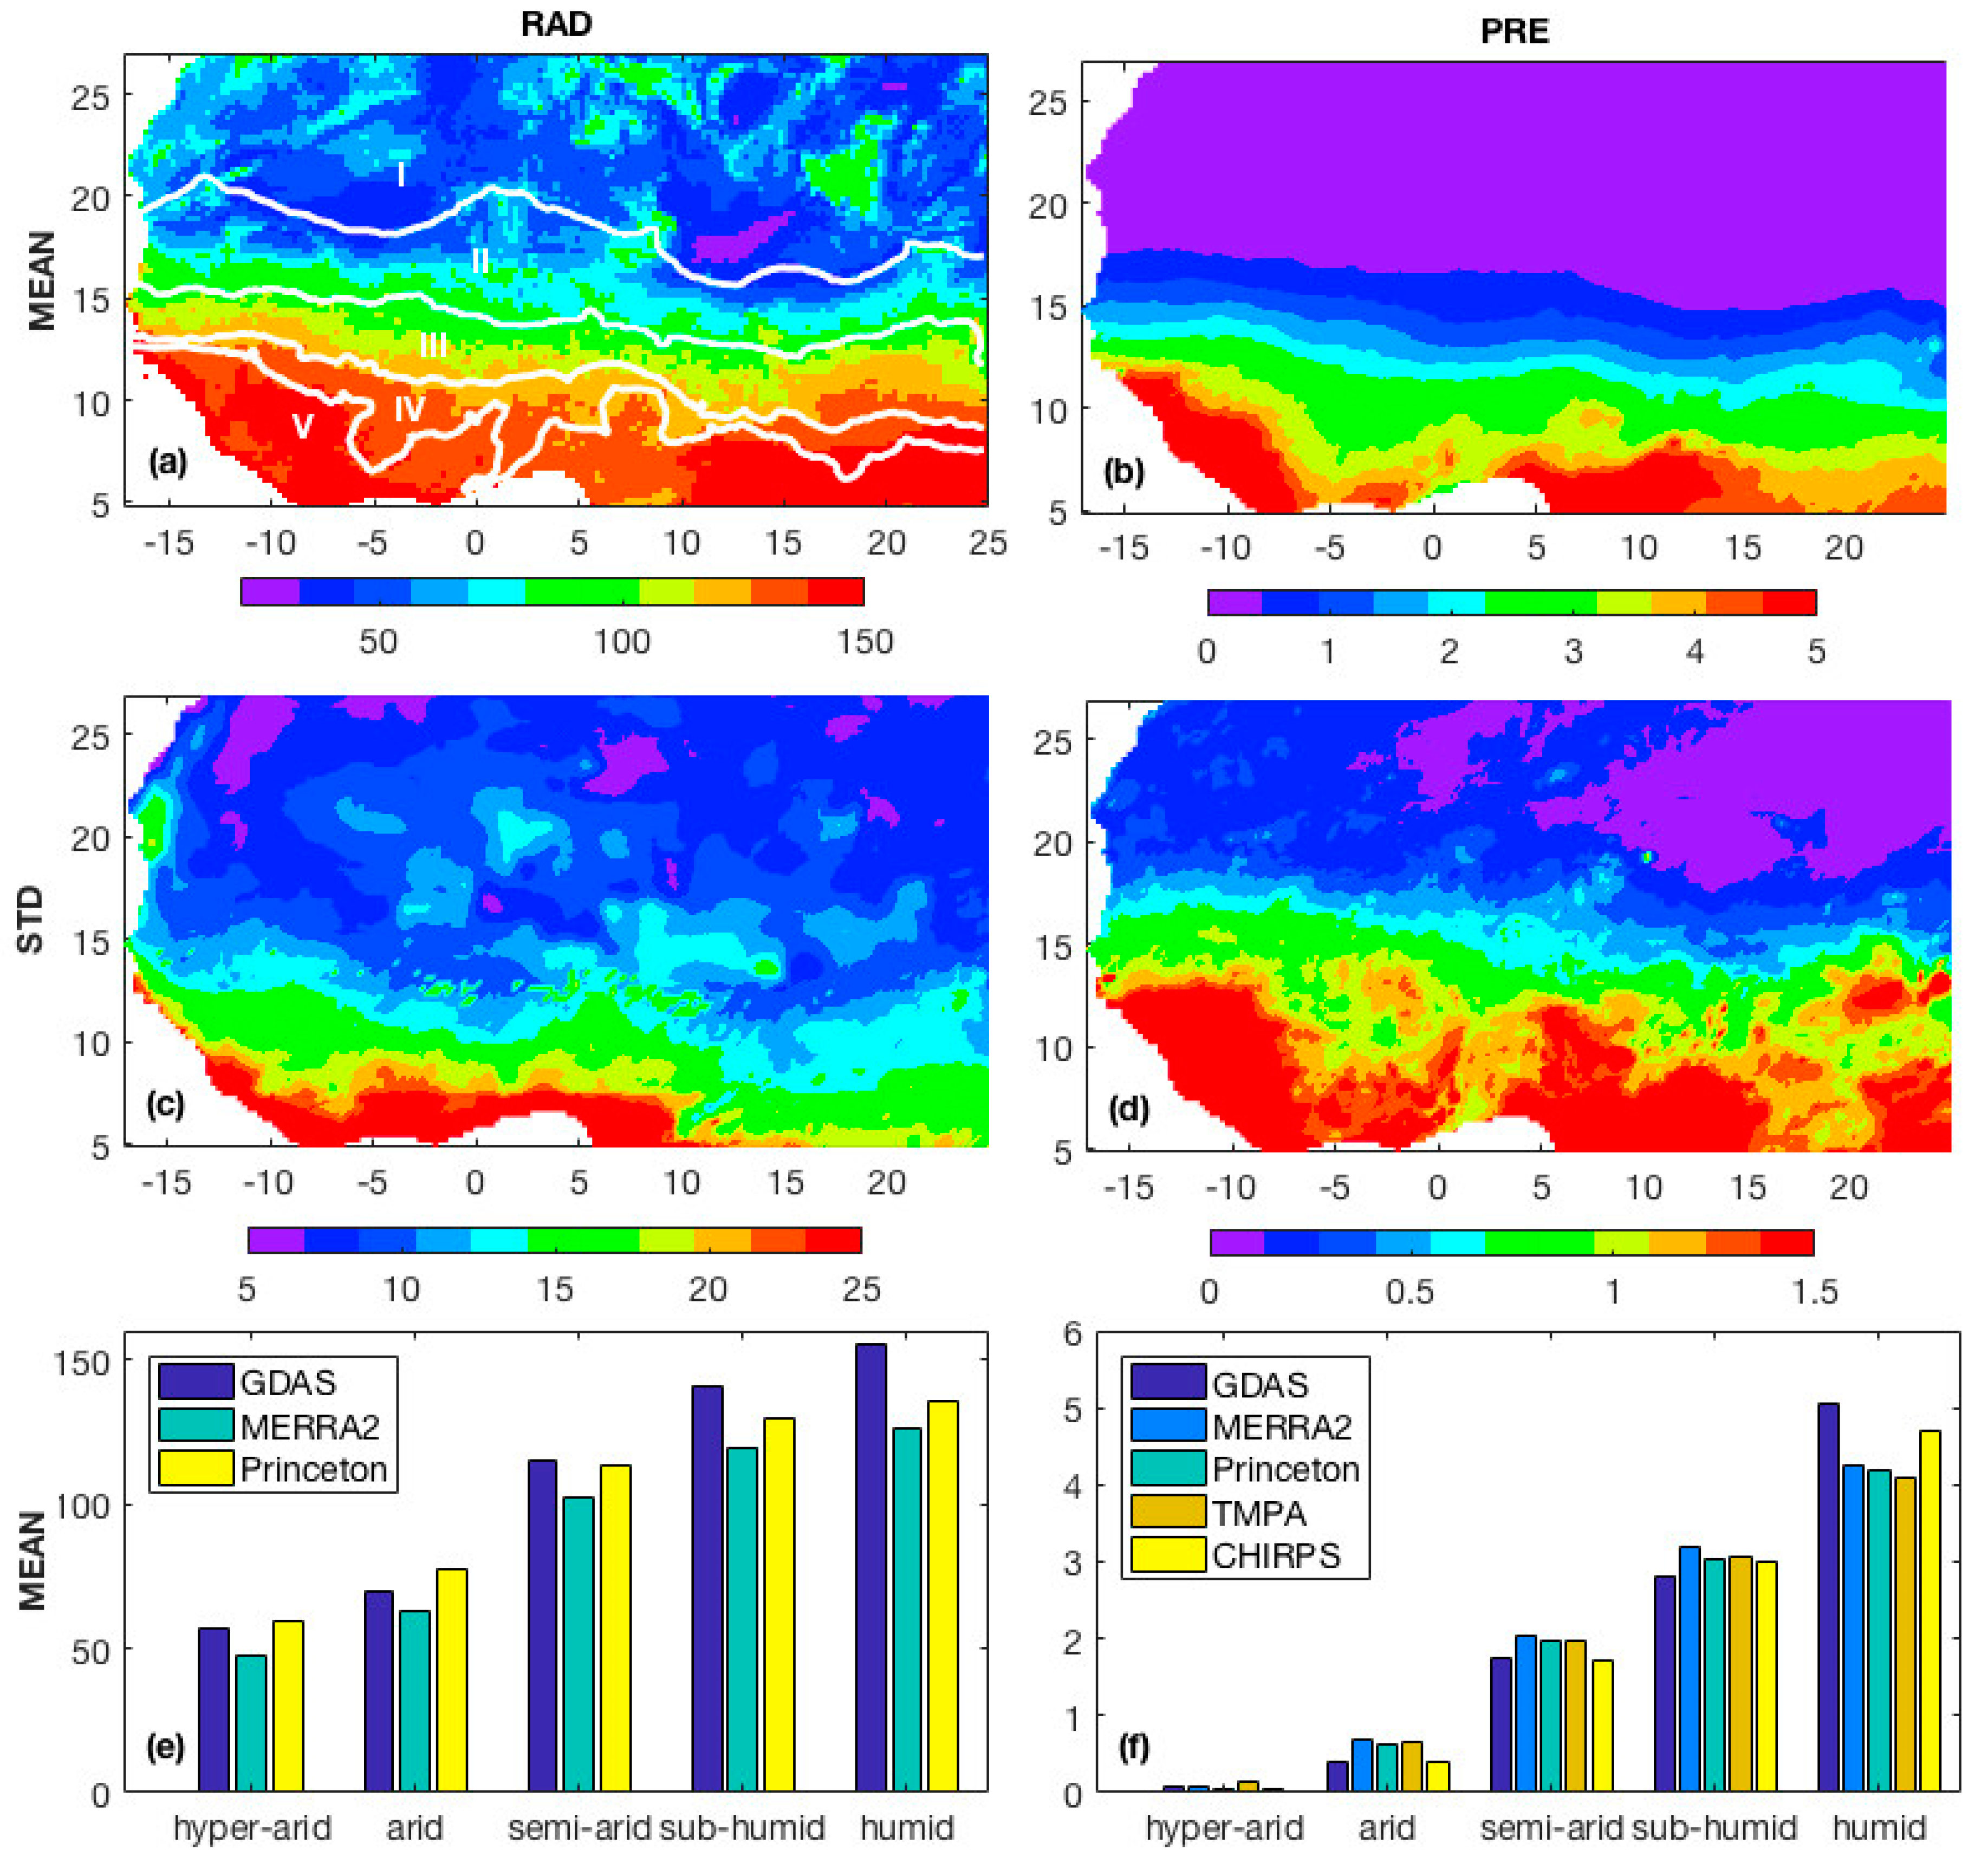
LSMs were driven with three meteorological forcing datasets: NCEP’s Global Data Assimilation System (GDAS) [47], NASA’s Modern-Era Retrospective analysis for Research and Applications, version 2 (MERRA2) [48], and the Princeton global meteorological forcing datasets (Princeton) [49]. As the sum of net short wave and long wave radiation, net radiation has the largest effect on LSM-based ET estimates in relation to energy balance terms. In Figure 1, the mean of net radiation from the three meteorological forcing datasets ranges from 50 W/m2 for the hyper-arid to 150 W/m2 for the humid region. Standard deviations in net radiation are generally 10–20 W/m2, but coastal areas at longitudes between −13 and 10 show higher variations. When considering the three meteorological datasets, MERRA2 has the lowest net radiation of these datasets, whereas Princeton has the highest in both hyper-arid and arid regions. GDAS has the highest values in semi-arid, sub-humid, and humid regions.
2.1.3. Precipitation
Additional experiments were conducted replacing the precipitation fields from the aforementioned meteorological reanalysis forcings with two other precipitation datasets: the Tropical Rainfall Measuring Mission Multi-Satellite Precipitation Analysis product 3B42, version 7 (TMPA) [50] and the Climate Hazards group InfraRed Precipitation with Stations (CHIRPS) [51]. In Figure 1, the mean and standard deviation of the five precipitation datasets increase linearly from north to south, associated with the ITCZ precipitation band. The mean and standard deviation maps show a local effect at longitude 10 and latitude 5, showing higher values (than 10 mm/day in mean and 5 mm/day in standard deviation; not shown in Figure 1). A comparison of the five precipitation datasets illustrates that GDAS and CHIRPS provides lower precipitation rates in both arid and semi-arid regions, but higher rates in the humid region.
2.2. Diagnostic ET Datasets
The four diagnostic ET datasets are used in this study, including the Global Land Evaporation Amsterdam Model, v3.0a (GLEAM) [37], the Atmosphere-Land Exchange Inverse (ALEXI) [38], the Moderate Resolution Imaging Spectroradiometer (MODIS) land ET product 16 (MOD16) [39], and FLUXNET [40]. Our study time period is limited to the 5-year overlap between these datasets from January 2007 to December 2011. Most of arid and hyper-arid regions in the ALEXI and MOD16 datasets correspond to missing data as they are deemed unreliable. Diagnostic ET datasets were averaged to monthly values and re-scaled to a 0.25-degree spatial resolution, whenever necessary.
For PET estimation, ALEXI and GLEAM use the Priestley-Taylor equation, whereas MOD16 uses the Penman–Monteith equation. The Priestley-Taylor equation estimates evaporation from an extensive wet surface under conditions of minimum advection by removing the aerodynamic terms from the Penman–Monteith equation and adding an empirically derived constant factor [52]. Forcing inputs for the Penman–Monteith equation (used in MOD16) include vapor pressure deficit, air temperature, net solar radiation, wind speed and air pressure whereas the Priestly-Taylor equation (used in ALEXI and GLEAM) uses only net radiation or solar irradiance. GLEAM includes a running water balance, using precipitation input (i.e., the Multi-Source Weighted-Ensemble Precipitation) [53], assimilating soil moisture observations, and combining them with microwave vegetation optical depth to parameterize evaporative stress. ALEXI uses observed morning changes in temperature to diagnose the partitioning of the surface energy balance between sensible and latent heats. MOD16 estimates the surface resistance based on Leaf Area Index (LAI). FLUXNET is based on upscaling eddy-covariance flux measurements of ET with satellite-based vegetation indices. The FLUXNET database is composed of regional and global analysis of observations from over 750 micrometeorological tower sites, including two flux towers over West Africa, starting in 2010, with a limited time period as provided with the latest version of the FLUXNET 2015 Tier 1 dataset.
2.3. Uncertainty Analysis
The evapotranspiration uncertainty analysis is performed separately on LSM-based and diagnostic datasets to compare their spatial and temporal characteristics and quantify their uncertainty ranges. The analysis is also performed separately for the five West African climate regions.
To compare the mean and standard deviation between LSM-based and diagnostic ET datasets, the relative difference (RD) of the two ET products are computed as:
where and represent and , respectively, and is the mean of the products and . Also, to incorporate the bias-insensitive and multiple component nature of evaluation metrics for a comprehensive comparison, the spatial efficiency metrics (SPAEF) [54,55] are computed as:
where is the Pearson correlation coefficient, is the fraction of the coefficient of variation and is the histogram intersection for the given histograms K and L of the E1 and E2 patterns, respectively.
The impact of the choice of LSM, meteorological forcing datasets (MET), and precipitation-only (PRE) on the uncertainty in the LSM-based ET estimates () is estimated through the standard deviation attributable to each of the three components at each grid cell location as follows:
where is variance, x is the grid cell, T (=60) is the total number of monthly time step t, for years 2007–2011. A number of the combined experiments (L = 9 from 3 METs times 3 PREs, M = 8 from 4 LSMs times 2 additional PREs, N = 12 from 4 LSMs times 3 METs) with the four LSMs, the three METs, and the five PREs are used for each of the ET uncertainties , , and , respectively. To separate the temporal ET variability from the uncertainty analysis, uncertainties are estimated by averaging standard deviations over the ET datasets at the same time, t, and then calculating the temporal average of the standard deviations.
3. Results and Discussion
3.1. Comparison of LSM-Based and Diagnostic ET Estimates
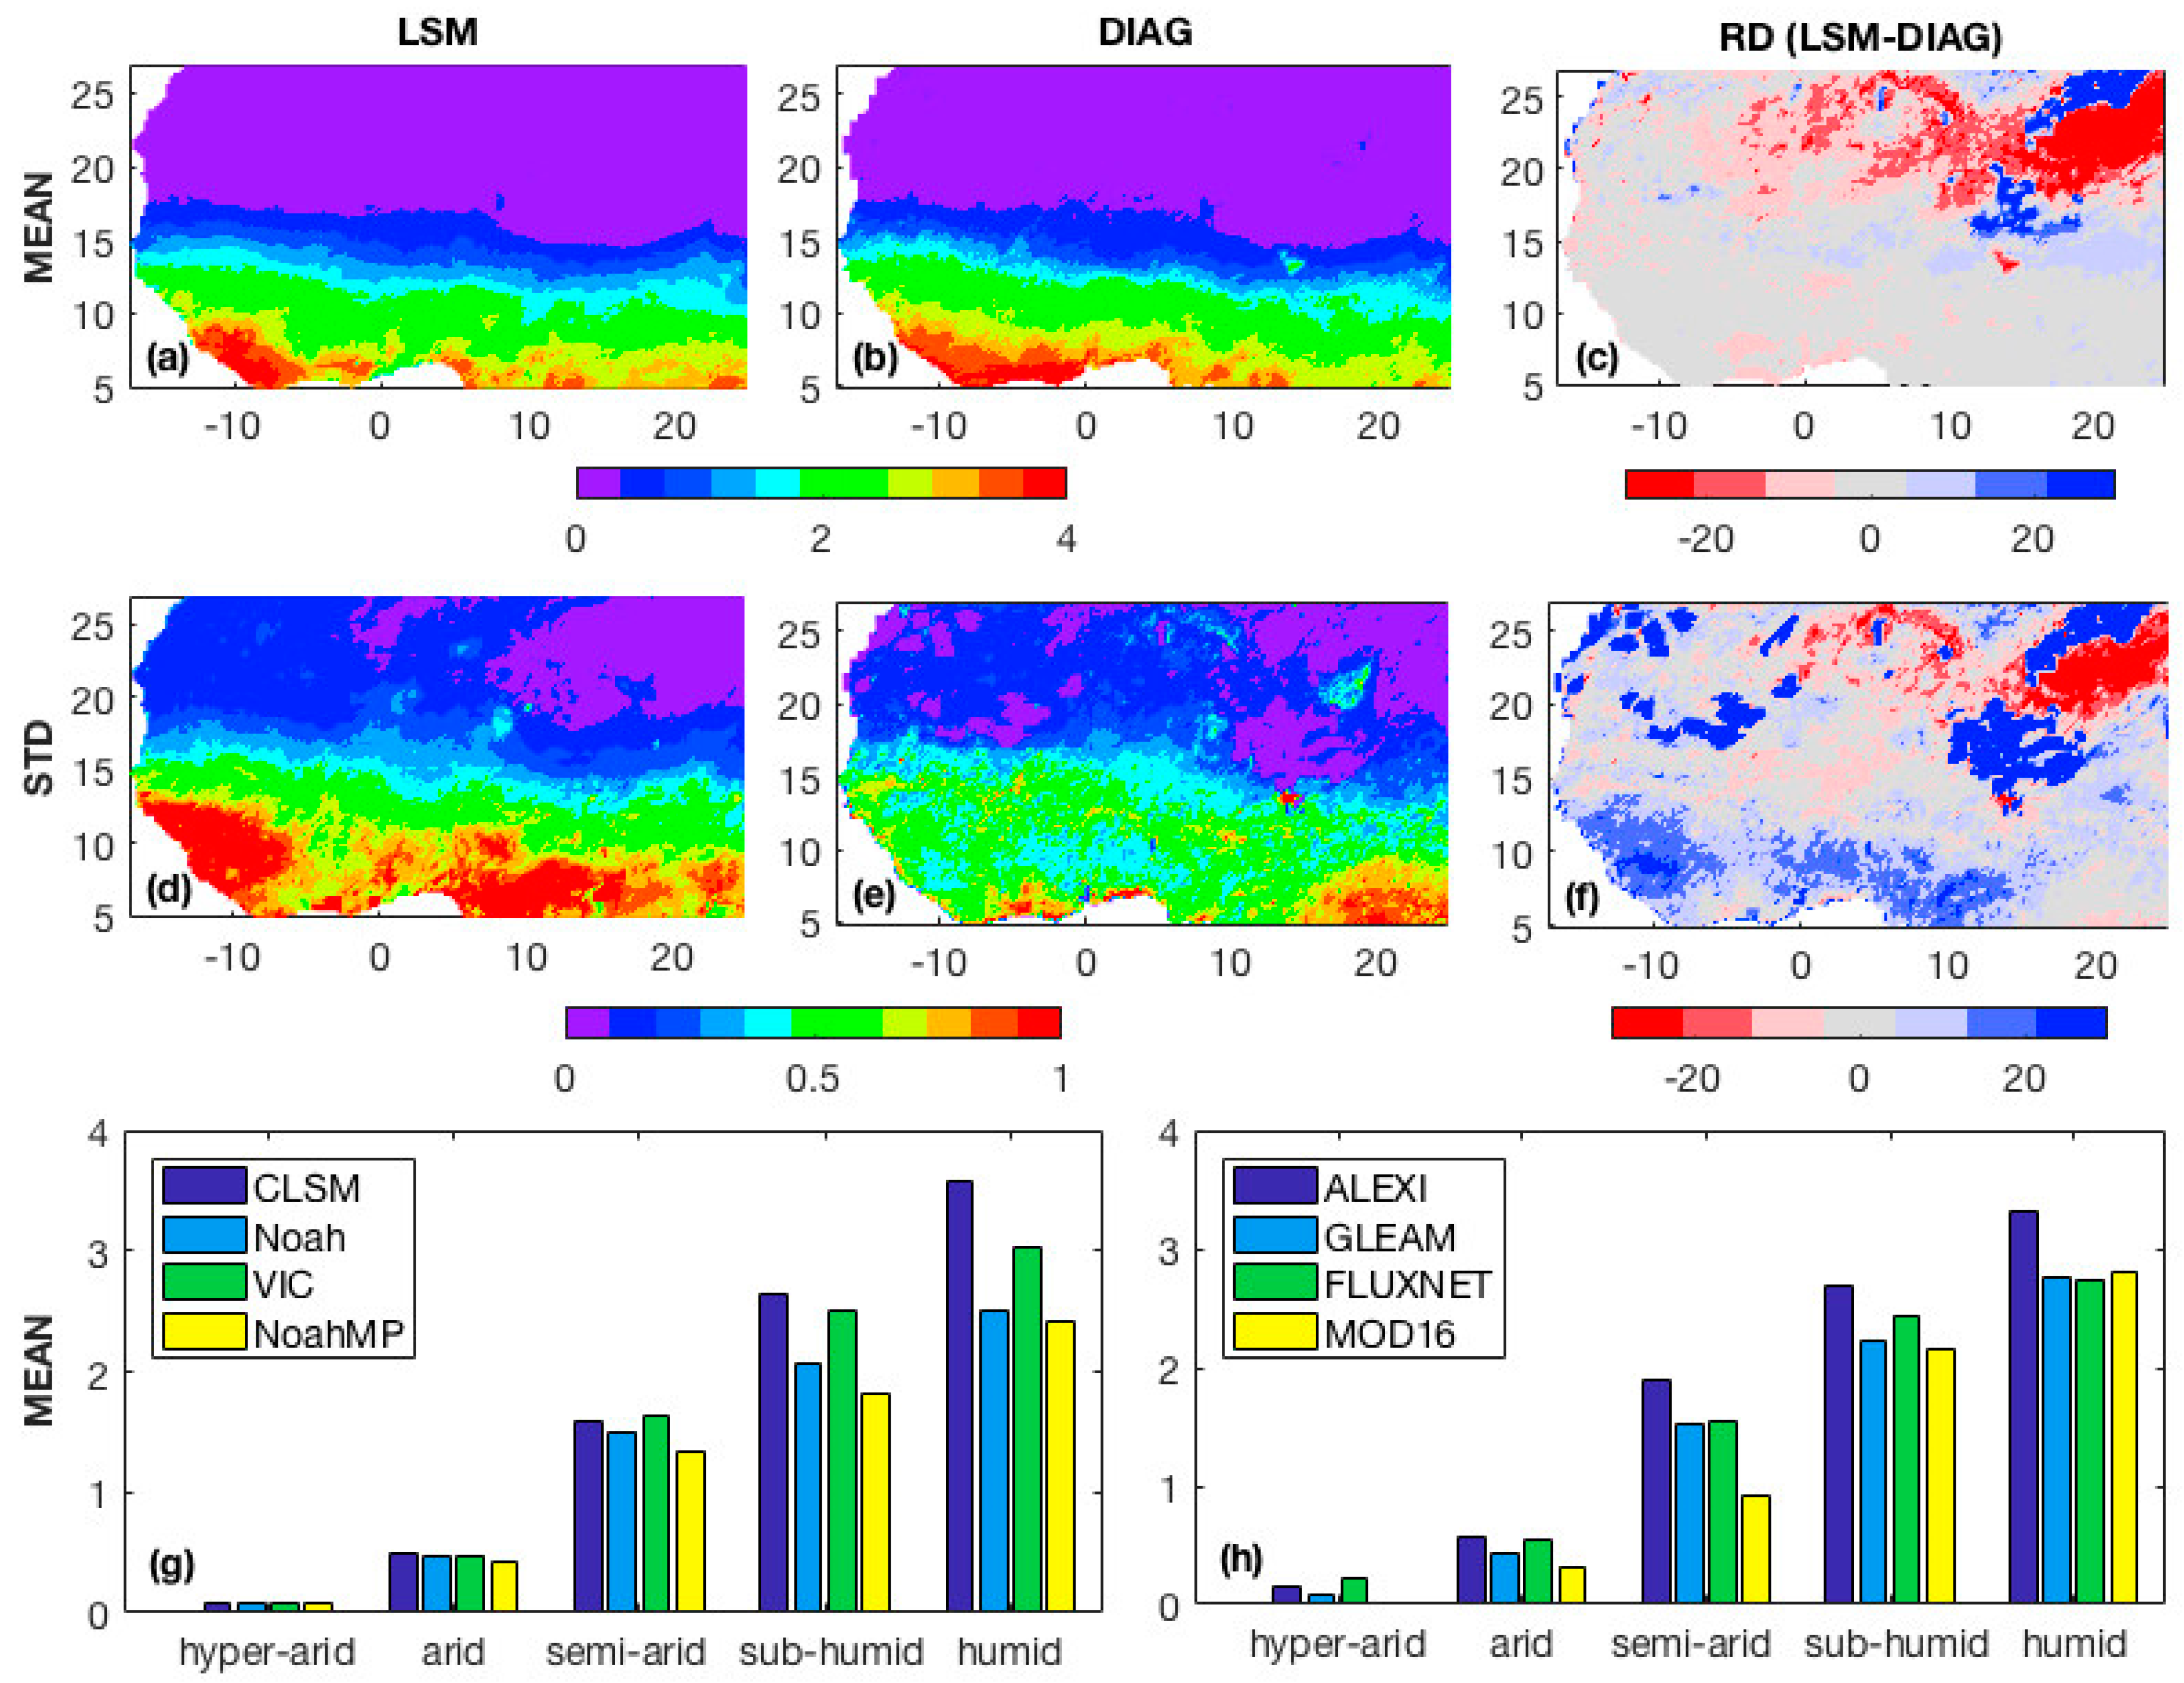
Figure 2 shows the spatial distribution maps of the mean, standard deviation, and relative difference from the LSM-based and diagnostic ET datasets over West Africa for years, 2007–2011. Overall, arid regions at the higher latitudes show lower values in mean ET rates and standard deviations than for the humid regions at lower latitudes. Specifically, lower standard deviations are found in the hyper-arid and arid regions when mean ET values are less than 1 mm/day. This threshold is reached in the arid region, resulting in standard deviations of 0.2 mm/day and greater below 15°N. Compared to diagnostic ET datasets, LSM-based ET datasets show the similar mean ET rates in West Africa except at longitudes between −5 and 25 in the hyper arid region, ranging from −30 to −30 % in relative difference. Overall, the LSM-based ET dataset has higher standard deviation values with positive relative differences over West Africa, except for a part of the hyper-arid region. Comparing the four LSMs demonstrates that Noah and NoahMP provides lower mean ET rates than CLSM and VIC for all climate regions (Figure 2g). The order of the spatially averaged mean ET rates, from the highest to the lowest, is CLSM, VIC, Noah, NoahMP. These results are likely due to the differences of the model physics and parameters, including land cover datasets of IGBP classification (used in CLSM and VIC) and UMD classification (used in Noah and NoahMP). For the diagnostic model datasets (Figure 2h), ALEXI has the highest ET rate (except in the hyper-arid region), whereas MOD16 has the lowest ET rates (except in humid region) for all climate regions. Also, it is noteworthy that GLEAM, in model structure such as a running water balance driven with precipitation dataset, is more consistent with FLUXNET-based observations. On the other hand, ALEXI and MOD16 are more pure diagnostic estimates that do not use antecedent information (e.g., water balance estimates).
Figure 3 shows monthly climatologies of mean, standard deviation and relative difference values for the five West African climate regions. The LSM-based and diagnostic ET datasets show the similar temporal variations of their mean ET rates. Compared to diagnostic datasets, LSM-based mean ET rates show lower values during winter and spring, slightly higher during summer, and similar in fall. This finding is consistent with that the LSMs tend to underestimate ET during winter and spring seasons when local rainfall is not the primary source of water available for ET [26]. The hyper-arid region shows low mean ET rates over the year, whereas the arid region presents a range from 0.3 to 1.5 mm/day, mainly from June to October. The humid region shows a bimodal ET cycle with two peaks with high ET rates (>3 mm/day) from April to November, whereas semi-arid and sub-humid regions show one peak in September.
For the standard deviation of monthly climatologies, the diagnostic ET datasets (Figure 3e) show values lower than LSM-based ET estimates (Figure 3d), particularly in the semi-arid, sub-humid and humid regions. The hyper-arid and arid regions show the standard deviation increasing with mean ET and peaking in late summer or early fall. The semi-arid region shows more similar patterns of ET uncertainty in the monthly climatology as humid regions than the other arid regions. This suggests that the behavior of ET is dependent on water and energy budget variables, which can lead to different characteristics than climate regions determined by similar annual precipitation cycle or aridity condition. Compared to the LSM-based ET datasets, the diagnostic ET datasets show lower seasonal variation in their standard deviations for the semi-arid, sub-humid, and humid regions. LSM-based ET datasets show higher standard deviations for all four seasons than the diagnostic ET datasets in humid region. Also, it is noteworthy that uncertainties of the LSM-based ET estimates increase during winter for the humid region. This can be explained by the fact that CLSM generates the low peaks in ET rates for April, lagging by two months behind the low peaks of the other LSMs, which occur in February for the humid region.
Figure 4 shows SPAEF-based comparison of mean and standard deviation of the LSM-based and diagnostic ET datasets combined. Compared to metrics of standard deviation (Figure 4b,d), all three metrics (i.e., correlation coefficient, coefficient of variation, histogram match) and SPAFE values of the spatially averaged mean ET rates (Figure 4a,c) are closer to the optimal condition, one. This supports that larger difference between LSM-based and diagnostic ET datasets exists in their standard deviation than the mean ET rates. Monthly climatologies of the mean ET rates (Figure 4e) show lower histogram match between LSM-based and diagnostic ET datasets than those of the standard deviation (Figure 4f), which leads to reduced SPAEF values despite high correlation coefficient and coefficient of variation for all four seasons. This implies that seasonal variation of the mean ET rates between two different ET datasets are not consistent as much as one spatially averaged for the whole time period 2007–2011.
3.2. Uncertainty Analysis of LSM-Based ET Estimates
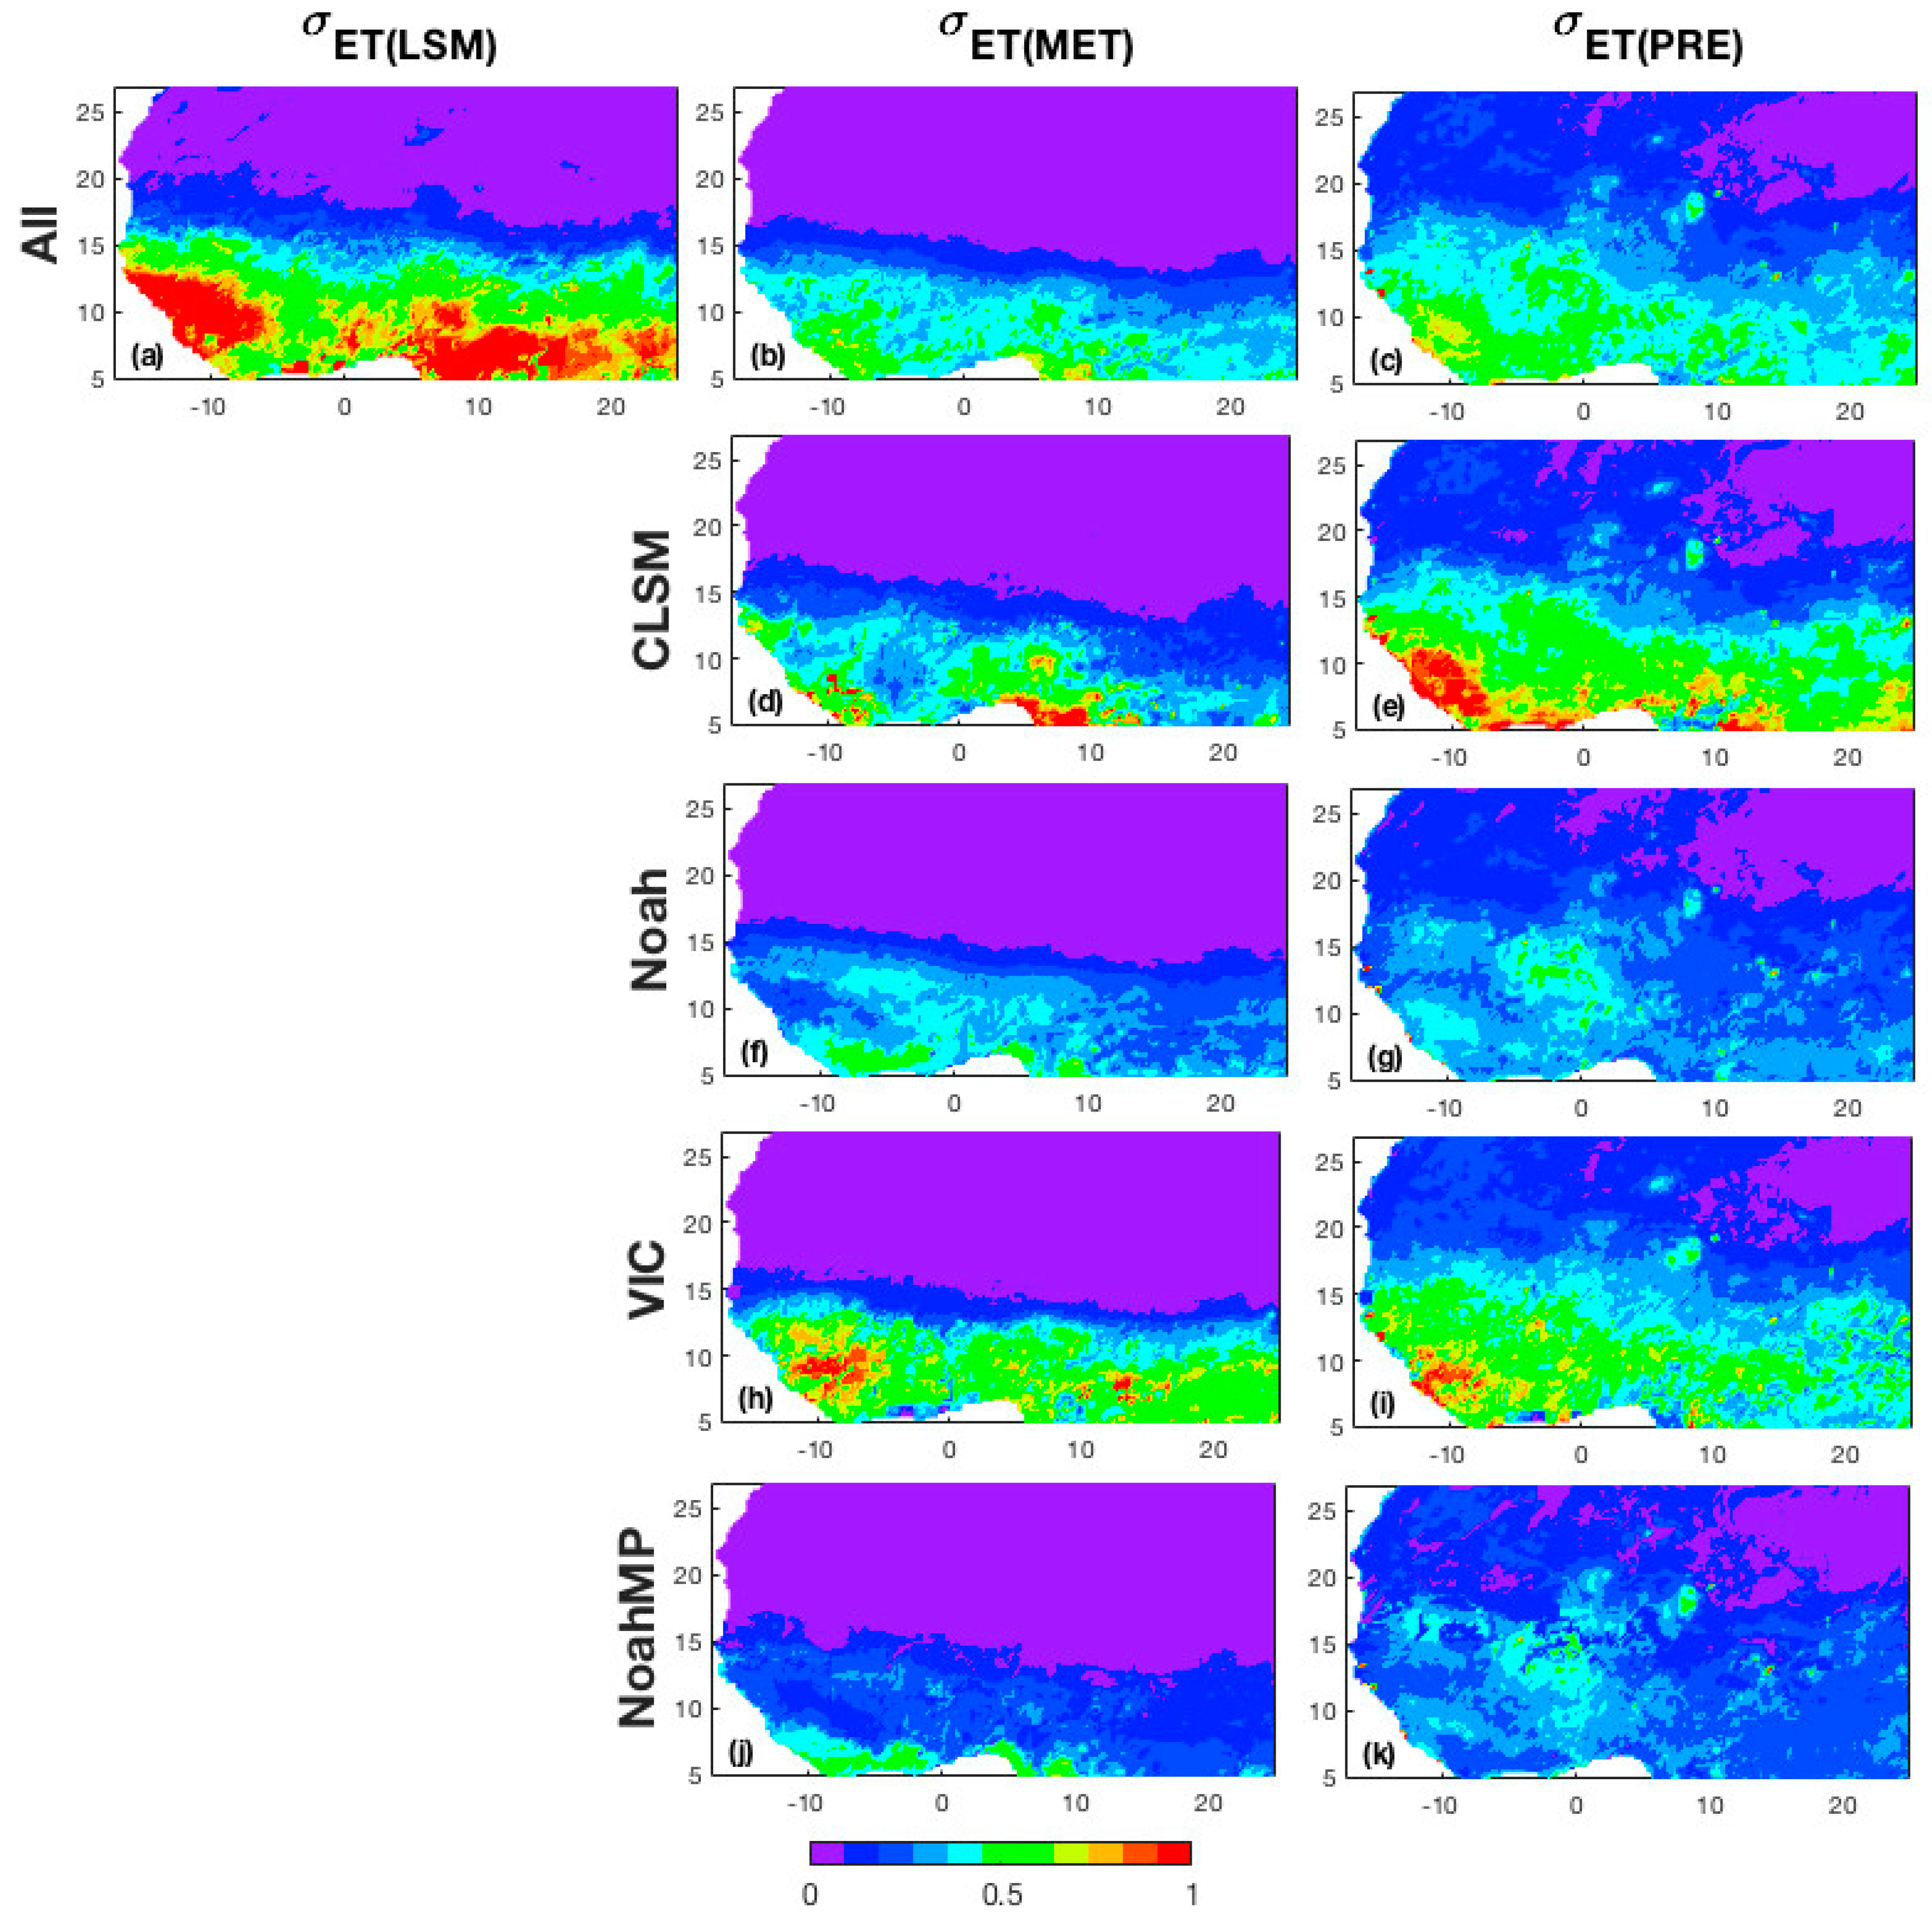
Figure 5 shows the spatially distributed impacts of model parameterization, meteorological forcing datasets, and precipitation uncertainties on the LSM-based ET uncertainty, as defined in Equations (3)–(5). Overall, LSM-based ET uncertainties attributable to LSM, MET, and PRE increase from north to south in West Africa. The ET uncertainties are mostly attributed to LSM, or the differences in model physics and parameterizations, particularly in the two humid climate regions plus the semi-arid region. This is consistent with a previous sensitivity study of land surface simulations against 1-year field measurements [10]. Arid regions with little precipitation have ET values much lower than PET, whereas humid regions have ET values closer to PET values. This implies that the choice of PET equations in LSMs provide more diversity in our ET estimations over West Africa as compared to the forcing data. This is also supported by the evidence that the ET uncertainties between the potential evaporation products are higher than ones between the different actual evaporation products over the African continent [8].
The impacts of MET and PRE uncertainties on LSM-specific ET estimates are also investigated. In arid regions, the four LSMs show the similar impact of MET and PRE uncertainties on the modeled ET estimates. However, CLSM and VIC in humid regions show higher effects from MET and PRE than Noah and NoahMP with higher mean ET rates (see Figure 2g). MET and PRE uncertainties generate a local effect in the modeled ET uncertainties, having higher values along the coast for CLSM and at longitudes between −12 and −8 in humid region for VIC. This is related to the fact that CLSM and VIC are more sensitive to high uncertainties of radiation and precipitation in these areas (shown in Figure 1c,d) than Noah and NoahMP.
Figure 6 shows the sensitivity of ET uncertainties to the uncertainties of both radiation and precipitation. The sensitivity is calculated by dividing the ET uncertainties (Figure 5b,c) by the uncertainty of the radiation (Figure 1c) and precipitation (Figure 1d). From north to south, the sensitivity of ET uncertainties to the uncertainties of radiation decreases, whereas the sensitivity of ET uncertainties to precipitation increases. This indicates that ET uncertainties in arid regions with little water are more sensitive to the uncertainty of net radiation, whereas humid regions have a higher sensitivity of ET uncertainties to the uncertainty of precipitation.
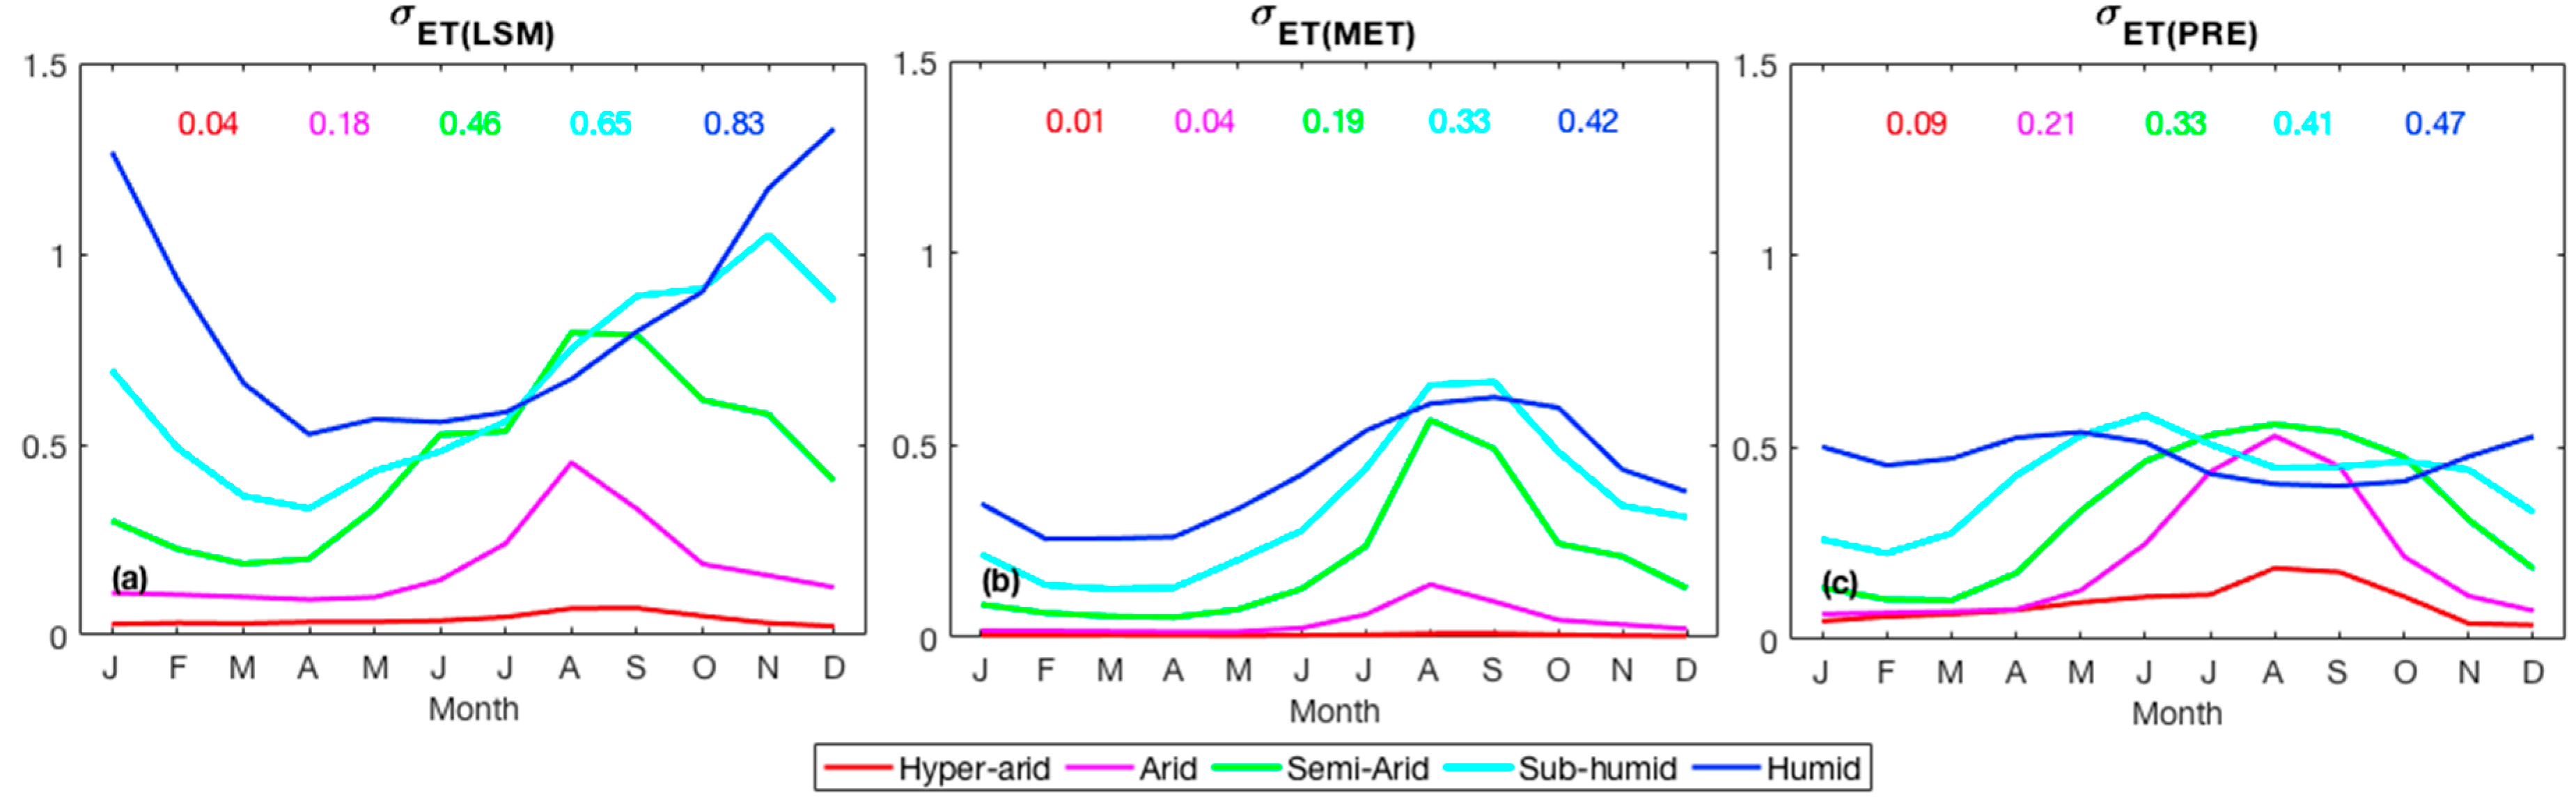
When examining the monthly climatology of the impacts of the LSM, MET, and PRE uncertainties on the LSM-based ET uncertainty, LSM shows the largest effect in Figure 7. This leads to the fact that seasonal variation of standard deviations due to LSM shows the most similar seasonal variation of the modeled ET uncertainty (shown in Figure 3d) with lower uncertainty values for all climate regions. The standard deviations attributable to meteorological forcing datasets show clear seasonal variations except in hyper-arid region. Interestingly, the standard deviations attributable to precipitation show lesser seasonal variation in humid region with different peak seasons in June for sub-humid region and in August for the other three arid regions.
Figure 8 shows that LSM physics and parameters contribute to more than 90% of the uncertainty of the LSM-based ET estimates for semi-arid (91%), sub-humid, (95%) and humid (97%) regions. The impact of the choice of LSM includes the calibration process on inaccurate input data including meteorological forcing datasets and precipitation. Thus, it implies that standard deviations attributable to meteorological forcing dataset and precipitation can be reduced by the LMS physics. In arid regions, precipitation forcing contributes to the ET uncertainties (>90%) primarily, and the meteorological forcing datasets have the smallest impact on the ET uncertainty. This can be explained by the fact that ET estimates in arid regions are more governed by water availability (e.g., precipitation) than energy availability (e.g., net radiation).
4. Summary and Conclusions
We quantified evapotranspiration uncertainties for five West African climate regions for the 2007–2011 period. Uncertainty is defined as the standard deviations, and the analysis is performed using four LSM-based and four diagnostic ET estimates. Results show clear regional ET uncertainty variations, increasing southward from the hyper-arid to humid regions. Diagnostic ET datasets show lower uncertainties and smaller seasonal variations than the LSM-based ET datasets, particularly in the humid climate regions and semi-arid region. This suggests that assimilating diagnostic ET datasets into LSMs or hydrological models could improve ET simulations. This finding is supported by a recent study that assimilated MODIS-based actual ET data and showed improved simulated discharge [56]. The NASA LIS system incorporates a data assimilation (DA) framework and supports a variety of model and DA type approaches, which could support future ET assimilation studies, accounting for uncertainty in the model and observational ET reference-type datasets (e.g., MODIS products).
In addition to the ET uncertainty quantification, we demonstrated that LSMs have the biggest impact in humid regions, contributing to more than 90% of simulated ET uncertainties. Also, the seasonal variation of the ET uncertainties is mostly affected by the uncertainties attributable to LSMs. Humid regions have ET values close to PET. This can be explained by the fact that the model physics differentiate most in their parametrization of evaporative stress when conditions are closer to potential ET. The precipitation uncertainty has higher influence on ET uncertainty in all West African climate regions than the net radiation uncertainty. Specifically, in both hyper-arid and arid regions, precipitation has the biggest effect on the modeled ET estimates. The sensitivity analysis reveals that the modeled ET estimates are more sensitive to the uncertainty of net radiation in arid regions and precipitation in humid regions, respectively.
Major rivers, wetlands, lakes, and floodplains flowing through arid regions, such as the Niger River and, in particular, its inner delta, located in Mali, are main sources of evaporation. However, this process is neglected in all LSM-based ET estimates used in this study. As a result, the actual ET rates over West Africa could be higher than what has been reported in the literature and also in this study. These limit our approach to quantify ET uncertainty and analyze error sources of our ET datasets. Also, further studies based on more diversified LSM attributed from a choice of different land cover datasets, vegetation parameters, and soil physics are recommended to better quantify the uncertainties of the model ET estimates.
Multiple land surface models are used in Land Data Assimilation Systems (LDAS) such as Global LDAS (GLDAS), North American LDAS (NLDAS), and FEWS NET LDAS (FLDAS) to increase simulation skill along with the use of hybrid forcing ensembles [57,58]. Also, a multi-model ensemble framework is used to develop estimates of model uncertainty and understand the level of similarity and dissimilarity between the constituent models. The utility of the multi-model ensemble can be increased when sufficient dissimilarity among the constituent models is guaranteed. The results from this study could suggest that by including certain LSMs to these LDAS, additional information would be provided for enhancing the water availability monitoring for agriculture and livelihoods in Africa.
Author Contributions
H.C.J.: Conceptualization; Investigation; Methodology; Visualization; Writing-original draft. A.G.: Project Administration; Conceptualization; Methodology; Writing-review and editing. K.R.A.: Investigation; Writing-review and editing. T.R.H.H.: Methodology; Writing-review and editing. A.M.: Investigation; Writing-review and editing.
Funding
This study was funded by NASA SERVIR Applied Sciences Program in Earth Science Division (NNH15ZDA001N-SERVIR).
Acknowledgments
Computing was supported by the resources at the NASA Center for Climate Simulation (NCCS). We acknowledge C. Hain and M. Anderson for use of the ALEXIS ET data. The MOD16 data are publicly available from http://files.ntsg.umt.edu/data/NTSG_Products/MOD16/, which was supported by the NASA Earth Observing System MODIS project. The GLEAM data are freely accessed from http://www.GLEAM.eu. The FLUXNET data are available from https://www.bgc-jena.mpg.de/geodb/.
Conflicts of Interest
The authors declare no conflict of interest.
References
- Koster, R.D.; Suarez, M.J.; Ducharne, A.; Stieglitz, M.; Kumar, P. A catchment based approach to modeling land surface processes in a general circulation model: 1. Model structure. J. Geophys. Res.-Atmos. 2000, 105, 24809–24822. [Google Scholar] [CrossRef]
- Lei, F.; Crow, W.T.; Holmes, T.R.H.; Hain, C.; Anderson, M.C. Global investigation of soil moisture and latent heat flux coupling strength. Water Resour. Res. 2018, 54, 8196–8215. [Google Scholar] [CrossRef]
- Xue, Y.; Juang, H.-M.H.; Li, W.-P.; Prince, S.; DeFries, R.; Jiao, Y.; Vasic, R. Role of land surface processes in monsoon development: East Asia and West Africa. J. Geophys. Res. 2004, 109, D03105. [Google Scholar] [CrossRef]
- Boone, A.; De Rosnay, P.; Balsamo, G.; Beljaars, A.; Chopin, F.; Decharme, B.; Delire, C.; Ducharne, A.; Gascoin, S.; Grippa, M.; et al. The AMMA Land Surface Model Intercomparison Project. Bull. Am. Meteorol. Soc. 2009, 90, 1865–1880. [Google Scholar] [CrossRef]
- Li, K.Y.; Coe, M.T.; Ramankutty, N. Investigation of hydrological variability in West Africa using land surface models. J. Clim. 2005, 18, 3173–3188. [Google Scholar] [CrossRef]
- Vinukollu, R.K.; Meynadier, R.; Sheffield, J.; Wood, E.F. Multi-model, multi-sensor estimates of global evapotranspiration: Climatology, uncertainties and trends. Hydrol. Process. 2011, 25, 3993–4010. [Google Scholar] [CrossRef]
- Andam-Akorful, S.A.; Ferreira, V.G.; Awange, J.L.; Forootan, E.; He, X.F. Multi-model and multi-sesnor estimates of evapotranspiration over the Volta Basin, West Africa. Int. J. Climatol. 2015, 35, 3132–3145. [Google Scholar] [CrossRef]
- Trambauer, P.; Dutra, E.; Maskey, S.; Werner, M.; Pappenberger, F.; van Beek, L.P.H.; Uhlenbrook, S. Comparison of different evaporation estimates over the African continent. Hydrol. Earth Syst. Sci. 2014, 18, 193–212. [Google Scholar] [CrossRef] [Green Version]
- McNally, A.; Husak, G.J.; Brown, M.; Carroll, M.; Funk, C.; Yatheendradas, S.; Arsenault, K.; Peters-Lidard, C.; Verdin, J.P. Calculating Crop Water Requirement Satisfaction in the West Africa Sahel with Remotely Sensed Soil Moisture. J. Hydrometeorol. 2015. [Google Scholar] [CrossRef]
- Kato, H.; Rodell, M.; Beyrich, F.; Cleugh, H.; van Gorsel, E.; Liu, H.; Meyers, T.P. Sensitivity of land surface simulations to model physics, land characteristics, and forcings at four CEOP sites. J. Meteorol. Soc. Jpn. 2007, 85, 187–204. [Google Scholar] [CrossRef]
- Mueller, B.; Seneviratne, S.I.; Jimenez, C.; Corti, T.; Hirschi, M.; Balsamo, G.; Ciais, P.; Dirmeyer, P.; Fisher, J.B.; Guo, Z.; et al. Evaluation of global observations-based evapotranspiration datasets and IPCC AR4 simulations. Geophys. Res. Lett. 2011, 38, L06402. [Google Scholar] [CrossRef]
- Mueller, B.; Hirschi, M.; Jimenez, C.; Ciais, P.; Dirmeyer, P.A.; Dolman, A.J.; Fisher, J.B.; Jung, M.; Ludwig, F.; Maignan, F.; et al. Benchmark products for land evapotranspiration: LandFlux-EVAL multi-data set synthesis. Hydrol. Earth Syst. Sci. 2013, 17, 3707–3720. [Google Scholar] [CrossRef] [Green Version]
- Khan, M.S.; Liaqat, U.W.; Baik, J.; Choi, M. Stand-alone uncertainty characterization of GLEAM, GLDAS and MOD16 evapotranspiration products using an extended triple collocation approach. Agric. For. Meteorol. 2018, 252, 256–268. [Google Scholar] [CrossRef]
- Sorensson, A.A.; Ruscica, R.C. Intercomparison and uncertainty assessment of nine evapotranspiration estimates over South America. Water Resour. Res. 2018, 54, 2891–2908. [Google Scholar] [CrossRef]
- Guichard, F.; Asencio, N.; Peugeot, C.; Bock, O.; Redelsperger, J.L.; Cui, X.; Garvert, M.; Lamptey, B.; Orlandi, E.; Sander, J.; et al. An Intercomparison of Simulated Rainfall and Evapotranspiration Associated with a Mesoscale Convective System over West Africa. Weather Forecast. 2010, 25, 37–60. [Google Scholar] [CrossRef]
- Peugeot, C.; Guichard, F.; Bock, O.; Bouniol, D.; Chong, M.; Boone, A.; Cappelaere, B.; Gosset, M.; Besson, L.; Lemaıtre, Y.; et al. Mesoscale water cycle within the West African Monsoon. Atmos. Sci. Lett. 2011, 12, 45–50. [Google Scholar] [CrossRef] [Green Version]
- Opoku-Duah, S.; Donoghue, D.N.M.; Burt, T.P. Intercomparison of Evapotranspiration Over the Savannah Volta Basin in West Africa Using Remote Sensing Data. Sensors 2008, 8, 2736–2761. [Google Scholar] [CrossRef] [Green Version]
- Getirana, A.; Boone, A.; Peugeot, C. Evaluating LSM-based water budgets over a West African basin assisted with a river routing scheme. J. Hydrometeorol. 2014. [Google Scholar] [CrossRef]
- Boone, A.; Getirana, A.C.V.; Demarty, J.; Cappelaere, B.; Galle, S.; Grippa, M.; Lebel, T.; Mougin, E.; Peugeot, C.; Vischel, T. AMMA Land Surface Model Intercomparison Project Phase 2, (ALMIP-2). Gewex News 2009, 9, 9–10. [Google Scholar]
- Getirana, A.; Boone, A.; Peugeot, C. Streamflows over a West African basin from the ALMIP-2 model ensemble. J. Hydrometeorol. 2017. [Google Scholar] [CrossRef]
- Grippa, M.; Kergoat, L.; Frappart, F.; Araud, Q.; Boone, A.; de Rosnay, P.; Lemoine, J.M.; Gascoin, S.; Balsamo, G.; Ottle, C.; et al. Land water storage variability over West Africa estimated by Gravity Recovery and Climate Experiment (GRACE) and land surface models. Water Resour. Res. 2011, 47, W05549. [Google Scholar] [CrossRef]
- Wolters, E.L.L.A.; Van den Hurk, B.J.J.M.; Roebeling, R.A. Evaluation of rainfall retrievals from SEVIRI reflectances over West Africa using TRMM-PR and CMORPH. Hydrol. Earth Syst. Sci. 2011, 15, 437–451. [Google Scholar] [CrossRef] [Green Version]
- Sylla, M.B.; Coppola, E.; Mariotti, L.; Giorgi, F.; Ruti, P.; Dell’Aquila, A.; Bi, X. Multiyear simulation of the African climate using a regional climate model (RegCM3) with the high resolution ERA-interim reanalysis. Clim. Dynam. 2010, 35, 231–247. [Google Scholar] [CrossRef]
- Giannini, A.; Biasutti, M.; Verstraete, M.M. A climate model-based review of drought in the Sahel: Desertification, the re-greening and climate change. Glob. Planet. Chang. 2008, 64, 119–128. [Google Scholar] [CrossRef]
- Tian, Y.; Peters-Lidard, C.D. A global map of uncertainties in satellite-based precipitation measurements. Geophys. Res. Lett. 2010, 37, L24407. [Google Scholar] [CrossRef]
- Yilmaz, M.T.; Anderson, M.C.; Zaitchik, B.; Hain, C.R.; Crow, W.T.; Ozdogan, M.; Chun, J.A.; Evans, J. Comparison of prognostic and diagnostic surface flux modeling approaches over the Nile River basin. Water Resour. Res. 2014, 50, 386–408. [Google Scholar] [CrossRef] [Green Version]
- UNEP (United Nations Environment Programme). World Atlas of Desertification; UNEP: Nairobi, Kenya, 1997. [Google Scholar]
- Zomer, R.J.; Trabucco, A.; Bossio, D.A.; van Straaten, O.; Verchot, L.V. Climate Change Mitigation: A Spatial Analysis of Global Land Suitability for Clean Development Mechanism Afforestation and Reforestation. Agric. Ecosyst. Environ. 2008, 126, 67–80. [Google Scholar] [CrossRef]
- Kumar, S.V.; Peters-Lidard, C.D.; Tian, Y.; Geiger, J.; Houser, P.R.; Olden, S.; Lighty, L.; Eastman, J.L.; Dirmeyer, P.; Doty, B.; et al. LIS—An interoperable framework for high resolution land surface modeling. Environ. Model. Softw. 2006, 21, 1402–1415. [Google Scholar] [CrossRef]
- Chen, F.; Mitchell, K.; Schaake, J.; Xue, Y.; Pan, H.; Koren, V.; Duan, Y.; Ek, M.; Betts, A. Modeling of land-surface evaporation by four schemes and comparison with FIFE observations. J. Geophys. Res. 1996, 101, 7251–7268. [Google Scholar] [CrossRef]
- Ek, M.B.; Mitchell, K.E.; Lin, Y.; Rogers, E.; Grummann, P.; Koren, V.; Gayno, G.; Tarpley, J.D. Implementation of Noah land surface model advances in the National Centers for Environmental Prediction operational Mesoscale Eta Model. J. Geophys. Res. 2003, 108, 8851. [Google Scholar] [CrossRef]
- Niu, G.-Y.; Yang, Z.-L.; Mitchell, K.E.; Chen, F.; Ek, M.B.; Barlage, M.; Longuevergne, L.; Kumar, A.; Manning, K.; Niyogi, D.; et al. The community Noah land surface model with multiparam-eterization options (Noah-MP): 1. Model description and evaluation with local-scale measurements. J. Geophys. Res. 2011. [Google Scholar] [CrossRef]
- Cai, X.; Yang, Z.-L.; David, C.H.; Niu, G.-Y.; Rodell, M. Hydrological evaluation of the Noah-MP land surface model for the Mississippi River Basin. J. Geophys. Res. Atmos. 2014, 119, 23–38. [Google Scholar] [CrossRef] [Green Version]
- Liang, X.; Lettenmaier, D.P.; Wood, E.F.; Burges, S.J. A simple hydrologically based model of land surface water and energy fluxes for general circulation models. J. Geophys. Res. 1994, 99, 14415–14428. [Google Scholar] [CrossRef]
- Koster, R.D.; Dirmeyer, P.A.; Guo, Z.; Bonan, G.; Chan, E.; Cox, P.; Gordon, C.T.; Kanae, S.; Kowalczyk, E.; Lawrence, D.; et al. Regions of strong coupling between soil moisture and precipitation. Science 2004, 305, 1138–1140. [Google Scholar] [CrossRef]
- Reichle, R.H.; Koster, R.D.; De Lannoy, G.J.M.; Forman, B.A.; Liu, Q.; Mahanama, S.P.P.; Toure, A. Assessment and enhancement of MERRA land surface hydrology estimates. J. Clim. 2011, 24, 6322–6338. [Google Scholar] [CrossRef]
- Martens, B.; Miralles, D.G.; Lievens, H.; van der Schalie, R.; de Jeu, R.A.M.; Fernández-Prieto, D.; Beck, H.E.; Dorigo, W.A.; Verhoest, N.E.C. GLEAM v3.0: Satellite-based land evaporation and root-zone soil moisture. Geosci. Model Dev. Discuss. 2016. [Google Scholar] [CrossRef]
- Hain, C.R.; Anderson, M.C. Estimating Morning Change in Land Surface Temperature from MODIS Day/Night Land Surface Temperature: Applications for Surface Energy Balance Modeling. Geophys. Res. Lett. 2017. [Google Scholar] [CrossRef]
- Mu, Q.; Zhao, M.; Running, S.W. Improvements to a MODIS global terrestrial evapotranspiration algorithm. Remote Sens. Environ. 2011, 115, 1781–1800. [Google Scholar] [CrossRef]
- Jung, M.; Reichstein, M.; Margolis, H.A.; Cescatti, A.; Richardson, A.D.; Arain, M.A.; Arneth, A.; Bernhofer, C.; Bonal, D.; Chen, J.; et al. Global patterns of land-atmosphere fluxes of carbon dioxide, latent heat, and sensible heat derived from eddy covariance, satellite, and meteorological observations. J. Geophys. Res. 2011, 116, G00J07. [Google Scholar] [CrossRef]
- Houborg, R.; Rodell, M.; Li, B.; Reichle, R.; Zaitchik, B.F. Drought indicators based on model-assimilated gravity recovery and climate experiment (GRACE) terrestrial water storage observations. Water Resour. Res. 2012, 48, W07525. [Google Scholar] [CrossRef]
- Getirana, A.; Kumar, S.; Girotto, M.; Rodell, M. Rivers and floodplains as key components of global terrestrial water storage variability. Geophys. Res. Lett. 2017, 44. [Google Scholar] [CrossRef]
- Penman, H.L. Natural evaporation from open water, bare soil, and grass. Proc. R. Soc. Lond. 1948, 193, 120–146. [Google Scholar]
- Monteith, J.L. Evaporation and environment. In Proceedings of the 19th Symposium of the Society for Experimental Biology; Cambridge University Press: New York, NY, USA, 1965; pp. 205–233. [Google Scholar]
- Friedl, M.A.; Sulla-Menashe, D.; Tan, B.; Schneider, A.; Ramankutty, N.; Sibley, A.; Huang, X. MODIS Collection 5 global land cover: Algorithm refinements and characterization of new datasets. Remote Sens. Environ. 2010, 114, 168–182. [Google Scholar] [CrossRef]
- Hansen, M.; DeFries, R.; Townshend, J.R.; Sohlberg, R. Global land cover classification at 1 km spatial resolution using a classification tree approach. Int. J. Remote Sens. 2000, 21, 1331–1364. [Google Scholar] [CrossRef] [Green Version]
- Rodell, M.; Houser, P.R.; Jambor, U.; Gottschalck, J.; Mitchell, K.; Meng, C.-J.; Arsenault, K.; Cosgrove, B.; Radakovich, J.; Bosilovich, M.; et al. The Global Land Data Assimilation System. Bull. Am. Meteorol. Soc. 2004, 85, 381–394. [Google Scholar] [CrossRef] [Green Version]
- Reichle, R.H.; Liu, Q.; Koster, R.D.; Draper, C.S.; Mahanama, S.P.P.; Partyka, G.S. Land Surface Precipitation in MERRA2. J. Clim. 2017, 30, 1643–1664. [Google Scholar] [CrossRef]
- Sheffield, J.; Goteti, G.; Wood, E.F. Development of a 50-year high-resolution global dataset of meteorological forcings for land surface modeling. J. Clim. 2006, 19, 3088–3111. [Google Scholar] [CrossRef]
- Huffman, G.; Adler, R.; Bolvin, D.; Gu, G.; Nelkin, E.; Bowman, K.; Hong, Y.; Stocker, E.; Wolff, D. The TRMM multisatellite precipitation analysis (TCMA): Quasi-global, multiyear, combined-sensor precipitation estimates at fine scales. J. Hydrometeorol. 2007, 8, 38–55. [Google Scholar] [CrossRef]
- Funk, C.; Peterson, P.; Landsfeld, M.; Pedreros, D.; Verdin, J.; Shukla, S.; Husak, G.; Rowland, J.; Harrison, L.; Hoell, A.; et al. The climate hazards infrared precipitation with stations—A new environmental record for monitoring extremes. Sci. Data 2015, 2, 150066. [Google Scholar] [CrossRef]
- Priestly, C.H.B.; Taylor, R.J. On the assessment of surface heat flux and evaporation using large-scale parameters. Mon. Weather Rev. 1972, 100, 81–91. [Google Scholar] [CrossRef]
- Beck, H.E.; van Dijk, A.I.J.M.; Levizzani, V.; Schellekens, J.; Miralles, D.G.; Martens, B.; de Roo, A. MSWEP: 3-hourly 0.25° global gridded precipitation (1979–2015) by merging gauge, satellite, and reanalysis data. Hydrol. Earth Syst. Sci. 2017, 21, 589–615. [Google Scholar] [CrossRef] [Green Version]
- Koch, J.; Demirel, M.C.; Stisen, S. On the importance of multiple-component evaluation of spatial patterns for optimization of earth system models. Geosci. Model Dev. 2018, 11, 1873–1886. [Google Scholar] [CrossRef]
- Demirel, M.C.; Mai, J.; Mendiguren, G.; Koch, J.; Samaniego, L.; Stisen, S. Combining satellite data and appropriate objective functions for improved spatial pattern performance of a distributed hydrologic model. Hydrol. Earth Syst. Sci. 2018, 22, 1299–1315. [Google Scholar] [CrossRef] [Green Version]
- Hartato, I.M.; van der Kwast, J.; Alexandridis, T.K.; Almeida, W.; Song, Y.; van Andel, S.J.; Solomatine, D.P. Data assimilation of satellite-based actual evapotranspiration in a distributed hydrological model of a controlled water system. Int. J. Appl. Earth Obs. Geoinf. 2017, 57, 123–135. [Google Scholar] [CrossRef]
- Kumar, S.V.; Wang, S.; Mocko, D.M.; Peters-Lidard, C.D.; Xia, Y. Similarity assessment of land surface model outputs in the North American Land Data Assimilation System. Water Resour. Res. 2017, 53. [Google Scholar] [CrossRef]
- Kumar, S.V.; Dong, J.; Peters-Lidard, C.D.; Mocko, D.; Gómez, B. Role of forcing uncertainty and background model error characterization in snow data assimilation. Hydrol. Earth Syst. Sci. 2017, 21, 2637–2647. [Google Scholar] [CrossRef]
Figure 1.
(a,b) Mean, (c,d) standard deviation (STD) maps, and (e,f) regional averages of the mean values from three net radiation (RAD, unit: Wm−2) and five precipitation datasets (PRE, unit: mm day−1) for years, 2007–2011. The white lines in panel (a) delineate the five climate regions (i.e., I-hyper-arid, II-arid, III-semi-arid, IV-sub-humid, V-humid, going from north to south).

Figure 2.
(a,b) Mean (mmday−1), (d,e) standard deviation (mmday−1), (c,f) relative difference (%) maps, and (g,h) regional averages of the mean values of LSM-based and diagnostic (i.e., DIAG) ET datasets combined.
Figure 2.
(a,b) Mean (mmday−1), (d,e) standard deviation (mmday−1), (c,f) relative difference (%) maps, and (g,h) regional averages of the mean values of LSM-based and diagnostic (i.e., DIAG) ET datasets combined.

Figure 3.
Monthly climatologies of the (a,b) mean (mmday−1), (d,e) standard deviation (mmday−1), and (c,f) relative difference (%) from the LSM-based and diagnostic ET datasets for the five West African climate regions. Values represent the average for each climate region.
Figure 3.
Monthly climatologies of the (a,b) mean (mmday−1), (d,e) standard deviation (mmday−1), and (c,f) relative difference (%) from the LSM-based and diagnostic ET datasets for the five West African climate regions. Values represent the average for each climate region.

Figure 4.
Comprehensive comparison of (a,c,e) mean and (b,d,f) standard deviation of the LSM-based and diagnostic (i.e., DIAG) ET datasets. Correlation coefficient (CORR), coefficient of variation (CV), histogram match (HistoMatch), SPAEF values are spatially averaged for (a–d) the 2007–2011 period and (e–f) monthly climatologies.

Figure 5.
LSM-based ET uncertainties are calculated from standard deviations (mmday−1) attributable to (a) LSM, (b) MET, and (c) PRE for each grid cell location. The impacts of MET and PRE uncertainties on LSM-specific ET estimates are shown for (d,e) CLSM, (f,g) Noah, (h,i) VIC, and (j,k) NoahMP, respectively.

Figure 6.
Sensitivity of modeled ET uncertainties to the uncertainties of the meteorological based (a) net radiation (mmday−1/Wm−2) and (b) precipitation (mmday−1/mmday−1).
Figure 6.
Sensitivity of modeled ET uncertainties to the uncertainties of the meteorological based (a) net radiation (mmday−1/Wm−2) and (b) precipitation (mmday−1/mmday−1).

Figure 7.
Monthly climatology (mmday−1) of the impacts of the LSM, MET, and PRE uncertainties on the LSM-based ET uncertainty for the five West African climate regions. Values represent the average for each climate region.
Figure 7.
Monthly climatology (mmday−1) of the impacts of the LSM, MET, and PRE uncertainties on the LSM-based ET uncertainty for the five West African climate regions. Values represent the average for each climate region.

Figure 8.
Regional average (unit: mmday−1) of mean ET rates, standard deviations, and impacts of LSM uncertainties (), MET (), and PRE () on the LSM-based ET uncertainty.
Figure 8.
Regional average (unit: mmday−1) of mean ET rates, standard deviations, and impacts of LSM uncertainties (), MET (), and PRE () on the LSM-based ET uncertainty.


Table 1.
Overview of ET datasets used in this study. An “x” indicates the input not used by the model.
Table 1.
Overview of ET datasets used in this study. An “x” indicates the input not used by the model.
| Category | Name (Reference) | PET Scheme | Met. Forcing | Precip. | Spatial Resolution | Temporal Resolution | Time Period |
|---|---|---|---|---|---|---|---|
| Land Surface Models | Noah [30,31] | Penman | GDAS | GDAS | 0.25 deg | Daily | 01/2007–12/2011 |
| TMPA | |||||||
| CHIRPS | |||||||
| MERRA2 | MERRA2 | ||||||
| TMPA | |||||||
| CHIRPS | |||||||
| Princeton | Princeton | ||||||
| TMPA | |||||||
| CHIRPS | |||||||
| NoahMP [32,33] | Penman–Monteith | * | ** | ||||
| VIC [34] | * | ** | |||||
| CLSMF [35,36] | * | ** | |||||
| Diagnostics | GLEAM [37] | Priestley-Taylor | CFS-R | MSWEP | 0.25 deg | Daily | 01/1980–12/2015 |
| ALEXI [38] | ERA-Interim | X | 0.05 deg | Weekly | 01/2007–12/2015 | ||
| MOD16 [39] | Penman–Monteith | GMAO | X | 0.01 deg | Monthly | 01/2000–12/2012 | |
| FLUXNET [40] | X | X | X | 0.50 deg | Monthly | 01/1982–12/2011 |
*, ** Each of the four LSMs was forced with three meteorological forcing datasets and two additional observation-based precipitation datasets, generating a total of 9 experiments.
© 2019 by the authors. Licensee MDPI, Basel, Switzerland. This article is an open access article distributed under the terms and conditions of the Creative Commons Attribution (CC BY) license (http://creativecommons.org/licenses/by/4.0/).
Share and Cite
MDPI and ACS Style
Jung, H.C.; Getirana, A.; Arsenault, K.R.; Holmes, T.R.H.; McNally, A. Uncertainties in Evapotranspiration Estimates over West Africa. Remote Sens. 2019, 11, 892. https://doi.org/10.3390/rs11080892
AMA Style
Jung HC, Getirana A, Arsenault KR, Holmes TRH, McNally A. Uncertainties in Evapotranspiration Estimates over West Africa. Remote Sensing. 2019; 11(8):892. https://doi.org/10.3390/rs11080892
Chicago/Turabian StyleJung, Hahn Chul, Augusto Getirana, Kristi R. Arsenault, Thomas R.H. Holmes, and Amy McNally. 2019. "Uncertainties in Evapotranspiration Estimates over West Africa" Remote Sensing 11, no. 8: 892. https://doi.org/10.3390/rs11080892
Note that from the first issue of 2016, this journal uses article numbers instead of page numbers. See further details here.