Trace Evidence from Mars’ Past: Fingerprinting Transverse Aeolian Ridges


Department of Earth and Planetary Sciences, University of New Mexico, Albuquerque, NM 87131, USA
*
Author to whom correspondence should be addressed.
Remote Sens. 2019, 11(9), 1060; https://doi.org/10.3390/rs11091060
Submission received: 11 March 2019
/
Revised: 21 April 2019
/
Accepted: 2 May 2019
/
Published: 5 May 2019
(This article belongs to the Special Issue Remote Sensing in Support of Aeolian Research)
Abstract
:Linear dunes and human fingerprints share many characteristics. Both have ridges, valleys, and defects (minutiae) in the form of bifurcations and termination of ridgeline features. For dunes, determining how defects vary across linear and transverse dunefields is critical to understanding the physics of their formative processes and the physical forcing mechanisms that produce dunefields. Unfortunately, manual extraction of defect locations and higher order characteristics (type, orientation, and quality) from remotely sensed imagery is both time-consuming and inconsistent. This problem is further exacerbated when, in the case of imagery from sensors in orbit around Mars, we are unable to field check interpretations. In this research, we apply a novel technique for extracting defects from multiple imagery sources utilizing a robust and well-documented fingerprint minutiae detection and extraction software (MINDTCT: MINutiae DecTeCTion) developed by the National Institute of Standards and Technology (NIST). We apply our ‘fingerprinting’ approach to Transverse Aeolian Ridges (TARs), relict aeolian features commonly seen on the surface of Mars, whose depositional and formative processes are poorly understood. Our algorithmic approach demonstrates that automating the rapid extraction of defects from orbitally-derived high-resolution imagery of Mars is feasible and produces maps that allow the quantification and analysis of these features.
1. Introduction
Even a cursory comparison of images of ripples, linear, and transverse dunes to human fingerprints reveals many similarities in the form and organization of features (Figure 1). In general, dunes and fingerprints are composed primarily of fields of ridges with intervening valleys. In most cases, these features are parallel and somewhat regularly spaced with a width and characteristic wavelength that is potentially related to prevailing formative forces acting over a 3-dimensional surface [1,2,3,4,5,6,7,8,9].
Dunefields are found on planetary surfaces (Mars and Venus) [10,11,12,13,14,15] and their satellites [16,17,18] in environments that differ significantly from Earth. On Mars dunefields exhibit similar defect patterns over a range from centimeter-scale ripples to multi-kilometer-scale longitudinal dunes [9,19]. Many of these longitudinal Martian features are termed Transverse Aeolian Ridges (TARs) and are prevalent across much of the surface of Mars.
Ridges, the primary features in both dunefield and fingerprint feature spaces, are typically the only uniquely identifiable and bonified features in a field of poorly defined objects (Figure 2) [20]. Other objects within these feature spaces are defined with reference to ridges. Ridges can be defined by their length, orientation, and derived metrics (sinuosity, etc.), as well as the number, type, and spatial arrangement of secondary features. Since these features can be georeferenced, they can be used to define slip faces and other features with well-defined upper edges, and indirectly used to define valleys or interdune areas which are less distinct on all sides. Within the aeolian analysis environment these secondary bonified subfeatures, are termed defects with splits and crest ends identified as Y-junctions and terminations respectively [3,5,6,21,22,23,24,25,26,27,28,29].
From the perspective of fingerprint analysis, defects are termed minutiae, with subfeatures termed bifurcations and ridge endings [30,31,32,33,34,35]. Minutiae are characterized by their type, position, and orientation, and are unique from fingerprint to fingerprint. Minutiae are classified as local features [36] occurring at unique points that are invariant with respect to global transformations [37,38,39] and are thus useful for the unique identification of individuals. They differ from global features which are characterized by attributes that capture the global spatial relationships of a fingerprint as expressed by ridge form (arch, loop, and whorl), orientation, and spacing [40].
2. Materials and Methods
2.1. Background to the Problem
2.1.1. Dune Processes
Dune forms are the result of interactions between the local wind regime and topography, sand transport, sand supply, and other local variables including vegetation [2,5,6,7,42,43,44]. Linear dunes are the most common form of desert dune on Earth [45], occurring under climatic conditions in hyperarid deserts to subhumid Sandy Lands [28]. These dunes exhibit ridges with distinct variability in spacing and organization, potentially reflective of both formative processes and the evolution in the dunefield over time.
Linear dunes form parallel to the net sand transporting wind vector, while transverse dunes form perpendicular to the dominant wind direction [2,46] in regions with restricted sediment supply under a bidirectional wind with relatively high wind direction variability [1,47,48]. Winds coming from different directions and striking the dune obliquely have been found to be responsible for net transport, erosion or deposition [2]. In contrast, transverse dunes form perpendicular to the dominant wind direction in areas of high sand abundance with distinctly different lee and windward faces. For both dune types, the interaction between a wind field and a mobile substrate results in erosional and depositional processes which in turn produce dunefield patterning [1,46,47].
In recent years, there have been important advances in the knowledge of dune processes and dunefield patterning through careful field and modeling studies of winds and sand movement [1,49,50,51]. Telfer et al. [29] have suggested that dunefield patterning is an emergent property influenced by regional and/or site-specific boundary conditions [4,5,6]. However, Kocurek et al. [52] noted that the observed variance in dunefield defects exceeds that generated from numerical modeling, implying that dune formation and evolutionary conditions are still poorly understood [52,53,54]. Werner and Kocurek [5,6] inferred that dune patterns should evolve such that dune spacing increases asymptotically and defect density increases.
Longitudinal bedforms typically have long crests and large spacing that is inversely related to defect density [45]. If along-crest transport is sufficiently large, defects facing upstream, which are eroding, remain free standing, and defects facing downstream, where sediment is being deposited, typically attach to adjacent bedform crests in Y-junctions forming an upstream-branching network (Figure 3) [6]. Upstream-facing defects move downstream due to erosion, and downstream-facing defects move upstream because of deposition at the junction of the Y.
When a mobile defect approaches a bedform crest and attaches, it forms a Y-junction (Figure 3) [55]. Modeling and field-based studies [56,57] show that the downstream fork of the Y-junction then detaches, resulting in a free-standing defect and a new near continuous crest line. This result implies that dune interactions drive pattern evolution at all scales [9,28,58,59], and defect organization is reflective of that evolution. Therefore, data on defect locations and their organization, especially with respect to different dune types and under different environmental conditions, may profoundly aid understanding of dune formation processes.
2.1.2. Transverse Aeolian Ridges on Mars
Modern Mars is characterized by an aeolian dominated, hyperarid environment with a tenuous atmosphere (~6.36 bar on average). The landscape has been extensively modified by aeolian processes, including short term seasonal winds that entrain and transport dust along with rare high velocity winds, possibly linked with atmospheric density changes capable of transporting sand grains [60,61,62,63]. Much of the surface contains depressions and craters where aeolian process have deposited linear aeolian features (Figure 4).
Mars contains a wide diversity of aeolian bedforms and Transverse Aeolian Ridges (TARs) are one of the most common [64,65]. TARs were first defined [66] to describe linear to curvilinear bedforms on Mars that formed as either large ripples or small transverse dunes. They were specifically named “ridges” by Bourke et al. [66] to preserve the possibility of both ripple or dune origins [67]. Alternatively they have been described as reversing dunes [68,69,70,71,72] or linked to similar periodic bedrock ridges [73]. Despite the name, TARs do not have to be composed of transverse dune forms alone. Symmetry in cross-section suggests that some TARs are in fact are linear rather than true transverse forms.
TARs were first observed in images from the Viking orbiter [74,75] and Mars Orbiter Camera (MOC) [76,77]. They are concentrated in the mid to low latitudes [64], and can be found in most settings including the floors of the deepest impact basins to the highest volcanoes [77]. Similar features have been observed on Earth [69,78,79]. As Wilson [67] notes, TARs are widespread on Mars, but their formation mechanisms, age, composition, and controlling environmental factors, as well as their role in the global sediment cycle are poorly constrained. Spatial patterning of TAR fields, as expressed in the organization and relative occurrence of defects, is potentially a measure of underlying physical processes that formed TAR fields. Determining how defects may vary across features is critical to understanding TAR formation and evolution.
2.1.3. The Extraction and Characterization Problem
Quantification of dunefield organization, both in terms of extraction of raw metrics from remotely sensed imagery and characterization of the spatial arrangement of these metrics, presents significant problems in terms of producing data that can be used to link form and underlying physical processes. Since different observers may define crests and defects differently, they may manually place them in slightly different locations and/or miss or misinterpret both type and position. The lack of an objective and systematic approach to quantify dunes limits our ability to analyze these environments and broadly characterize them [29]. Extraction and quantification of dune crests and the defects and Y-junctions of these crests is both time intensive, subjective, and often applied only for small areas of dunefields [9,20,24]. Geocoding their location is difficult, with both existing computer and human-based approaches outputting results that are not completely reproducible [20].
Day and Kocurek [9] estimated that visually measured defects estimated by multiple observers for a given dunefield varied by up to 20%. They also noted that measurement of defects and their interaction density is subjective, with image interpretation limiting an observer’s ability to discern small offsets (e.g., whether a Y-junction exists or “almost” exists), and with respect to images representing snapshots in time, capturing features that can migrate and change over short time intervals. As well, estimating direction of these defects is nearly impossible directly by humans, tending to be approximate at best and nonreproducible between different observers [9].
Extraction limitations severely impact analysis of dune defect location and type. If a consistent and repeatable automated defect extraction processes could be formulated, it would significantly augment our ability to map these features and to understand linear dunefield organization, evolution and dynamics. In this study the fingerprint minutiae extraction software (MINDTCT: MINutiae DeTeCTion) [31,32] was evaluated to determine whether dune defects could (1) be extracted from remotely sensed satellite imagery of aeolian features, (2) used to quantitatively characterize these features, (3) produce repeatable results, and (4) to determine whether this extraction can occur in an automated manner and be applicable over a wide range of scales, spatial extents and environments. We have chosen to examine this extraction using Transverse Aeolian Ridges (TARs) on Mars with the goal of extracting defects and using defect type and spatial organization to classify TAR type.
2.2. Extracting Dune Defects from Remotely Sensed Imagery
2.2.1. Basic Approach
The basic premise of this work is to produce a defect extraction approach that can be used to quantify and analyze dunefield organization, and to eventually answer the question: “Is there some fundamental organization of dunefields that reflects the physical forcing that produced the field?” As we noted above, no automated or semiautomated method to extract and analyze these defect features from remotely sensed imagery exists. We strive here to develop a methodology that is fast, simple to apply, easily repeatable, and that produces consistent results.
The absence of quantitative metrics at the dunefield scale has been noted as a limitation in past studies [20,29]. An ideal approach would thus be an automated or semiautomated methodology to enable quantitative, systematic, objective, and large-scale morphometric analysis. Within aeolian science, this extraction has traditionally been done by manual interpretation of aerial and satellite imagery. However, as Telfer et al. [29] note, because of the time-consuming nature of this approach it has been limited to small dunefields [80] or derived from small subsamples of larger dunefields [81,82].
Most recently Telfer et al. [29] delineated linear dune crest trend lines over larger areas automatically from remotely sensed data using a combination of multispectral analysis using Landsat 8 imagery in concert with a LInear Dune Optimized edge detection algorithm (LIDO) based on Sobel operators, directional filtering, and topologically-constrained recursion. They also found that the high-resolution DEM data (~10 m) was useful in areas with simple patterning but was of marginal use generally since dune height was of the same order as the vertical precision of the dataset, precluding realistic extraction.
Looking outside of aeolian science, we find a large range of approaches that may be applied to the extraction of dune defects. These include edge detection, segmentation, and thresholding [29], all of which are also used in extraction of minutiae (defects) from fingerprints and the identification of individuals. Computer based approaches relying on pattern recognition [83,84,85,86], edge detection [87,88,89], segmentation [90], and classification from remotely sensed data [91,92] have been used in part to address different portions of the problem of defect extraction. However, the extraction of these features in the aeolian environment is a very complex process and currently there is no simple solution in place. Each of the above approaches provides at least one part of an analysis package that would allow defect extraction, but not all parts are currently in place and no integrated system exists to utilize these myriad approaches in the aeolian sciences.
The forensic science community has developed a robust and mature fingerprint software package that allows users to extract fingerprint minutiae and to further analyze these minutiae for fingerprint matching and identification [93,94,95]. The discipline standard is currently the well-documented MINDTCT (MINutiae DeTeCTion) fingerprint minutia detection and extraction software developed by the National Institute of Standards and Technology (NIST) [31,32]. It has the advantage over other approaches in that it is an open application written using the C sharp (C#) programming language and as such can run on many platforms and be called from other applications. The software is not subject to copyright protection, is in the public domain, and is available without license or cost. Therefore, the development and application of a modified version of MINDTCT may provide the aeolian science community with a robust tool for the extraction of dune defects. We discuss the MINDTCT approach and present its application over a range of imagery below. We specifically deal with the extraction of defects from Transverse Aeolian Ridges (TARs) on Mars, but note that the MINDTCT approach has also been successfully applied on terrestrial dunes and is potentially applicable to the automated extraction from imagery of any feature type that exhibits linear structures and defects.
2.2.2. The Underlying Algorithmic Approach of MINDTCT
MINDTCT [31,32] is a set of algorithms used to detect minutiae and to assess the characteristics of each minutiae including location (x,y), type (termination of bifurcation), orientation, and quality. The starting point for MINDTCT is an input image with 256 gray levels (8 bit). Output files include image maps of ridge orientation, edge quality, local and regional metrics (surrounding field characteristics and statistics), and minutiae (Figure 5). In the following we outline the basic process of generating these fields using MINDTCT and then turn to a discussion of how this processing flow can be altered to be applicable to the problem of dune crest and dune defect extraction.
Input Fingerprint File
MINDTCT is designed to use the standard 10-print fingerprint image (Figure 1f) used by the FBI with a resolution of 500 pixels/inch or 19.69 pixels/mm. In humans this average fingerprint wavelength is ~0.46 mm. We note that with this input resolution, the average distance between fingerprint ridges of ~0.46 mm equates to ~8 or 9 pixels in the input image. This is critical both for understanding many of the functions of MINDTCT described below which utilize 8 × 8 pixel windows (queen’s-case nearest-neighbor pixel operators) for processing and extraction, and potentially for how MINDTCT, and the images input into MINDTCT, may need to be modified for use in the extraction of dune defects.
Applying MINDTCT to dune images requires preprocessing of the raw image. As noted above, the scales of crests spacing and dunefield sizes vary by orders of magnitude, while fingerprint sizes and ridge scales do not vary by even an order of magnitude. Dune imagery must be resampled to the MINDTCT tuned resolution of ~8 pixels between ridges. Further image manipulations may also be required, including low-pass filtering for smoothing, despeckling for noise removal, and thresholding for production of an image that ‘looks’ like a fingerprint.
Image quality is important since high contrast is necessary to evaluate the quality of localized regions to detect directional flow of ridges, regions of low contrast, areas where ridge flow direction is indeterminate (low ridge flow), and regions where directional change is rapid (high curvature). Issues with these parameters, primarily in terms of localized contrast, produce unstable results and make minutiae detection difficult. To address these issues, contrast within an image is evaluated and if there is low contrast it is normally enhanced using a trimmed 10% sample [31,32]. There is also a low-contrast setting that can be altered in the source code for further enhancement. The result is a process where both local information in the form of blocks of pixels and individual pixel values are used to derive minutiae information.
Image Map Production
Direction Map: A derived directional ridge flow map is required for detection of terminations and bifurcations. Production of a direction map requires well-formed and clearly visible ridges so that the algorithm can find areas of image with enough ridge structure for further analysis. This approach requires local detection which depends on answering the question “How much local information is required to characterize the image?” To evaluate this question the image is divided into 8 × 8 pixel blocks. The algorithm [96,97] uses a moving 24 × 24 window where the cells are convolved to produce an 8 × 8 output block centered in the 24 × 24 window. Each pixel in the center block is given the same value. Edges are padded with a mean expected intensity of 128. This block structure removes fine structure noise resulting in a smoothed image that minimizes discontinuities, while padding allows evaluation and defect extraction over the entire image field.
Ridge Flow Direction: For each local 8 × 8 block the surrounding 24 × 24 window is rotated through 16 orientations. Each is separated by 11.25 degrees (16 × 11.25 = 180 degrees), with 0 representing due north (up) and 15 representing a flow direction of 168.75 degrees (Figure 6). This is the default for the number of subdivisions in a semicircle but can be changed and made finer or coarser in the control structure of MINDTCT using NUM_DIRECTIONS parameter [32]. For each orientation pixels along each rotated row are summed producing a vector for the 24 row sums. The maximum sum is designated as the local ridge flow direction and is placed in the local 8 × 8 block [31,32].
This process produces 16 vectors, each of which is convolved with four waveforms with frequencies including a single period (12 pixels wide), two periods (six pixels wide), four periods (three pixels wide), and eight periods (1.5 pixels wide) (Figure 7). Discrete values for the sine and cosine function for each of the four functions are computed for each vector. The results are added together to produce a resonance coefficient that represents how well each vector fits the specific waveform. The dominant ridge flow direction recorded is the block orientation with the maximum waveform resonance. Further details are found in the source code documentation [31].
Contrast Enhancement
Low contrast areas complicate ridge detection making extraction of minutiae difficult [93,94]. The contrast enhancement subroutine flags low contrast areas by comparing the block pixel intensity to the surrounding window intensity. The algorithm uses a 10% upper/lower trim of the pixel intensity distribution between 0 and 255 and then measures remaining values which represent the most significant portion of the distribution [32]. This has the effect of removing extreme outliers and enhancing contrast within the remaining values. If the dynamic range of the center 80% of the distribution of the block values is less than 10 the block is considered to be low contrast and is flagged as such and becomes part of the assessment of minutiae strength.
Low Flow Areas
If 8 × 8 pixel blocks in the direction map have no dominant ridge flow they are labeled low flow. No direction is assigned initially but may be carefully interpolated from surrounding blocks. Minutiae within these areas (blocks) have a lower quality assignment and as such tend to be suspect relative to minutiae found in areas with higher contrast and flow [31,32].
High Curvature
While this is more of a problem with fingerprints, high curvature errors can occur when a dune makes a sharp turn in response to an obstacle. High curvature refers to a portion of a feature where the ridge exhibits a large change in direction over a short distance [31,32,93,94,95,96,97]. Two measures are calculated: vorticitythe cumulative change in ridge flow around all neighbors in a block—and curvature—the largest change between a blocks ridge flow and the ridge flow of its neighbors. Minutiae in blocks where there is high vorticity or curvature are given a reduced quality assessment.
Quality Map
Binarize Image
Each pixel is evaluated for the presence or absence of ridge flow. If there is no ridge flow for the current pixel block then the pixel is set to black (0). If there is ridge flow then the pixel intensities surrounding the pixel are analyzed with a 7 × 9 grid aligned with the ridge flow direction (with rows parallel to the local ridge flow direction) (Figure 8). Grayscale pixel intensities are accumulated along each row (C1 to C9) and compared with the accumulated values of the center row (C5). If C5*9 is less than the sum of all rows then no ridge is detected and the pixel is set to black. If C5*9 is greater than or equal to the sum then a ridge is detected and the pixel is set to white.
Minutiae Detection
The algorithm uses the feature detection templates shown in Figure 9. These 10 feature types can be decomposed into ridge terminations or bifurcations. The templates are used to detect features by sweeping the image both horizontally (2 × 3 kernel) and vertically (3 × 2 kernel). The orientation of extracted minutiae can be in any one of 32 (0–31) directions with zero (0) at the top of image. Direction is quantized in 11.25 degree increments proceeding clockwise from the zero reference direction.
Minutiae Quality
High-quality minutiae occur where the local neighborhood has both well-defined ridges and valleys and when the values cover the entire gray scale [93,94,97]. So if the neighborhood has a mean of 127 (1/2 way between white 255 and black 0) and a standard deviation greater than 64 (wide range) individual minutiae extracted from this neighborhood are considered to be both high-quality and reliable. The algorithm for assessing overall quality combines the quality map described in Table 1 with the specific gray scale values and ranges which define reliability as listed above.
Minutiae Output
MINDTCT outputs several maps that define ridgelines and minutiae (Table 1). These maps contain grids of integers, where each cell in the grid represents an 8 × 8 pixel neighborhood in the image. These maps include the direction map, low contrast map, low flow map, high curve map, and quality map. The maps are represented by a grid of numbers, each corresponding to a 8 × 8 block in the fingerprint image. Here again we must note the importance of pixel-based operations to the successful analysis of imagery. Extracted minutiae are contained in a formatted listing of attributes associated with each detected minutiae. This file is organized with one space delimited line per minutiae containing its x and y coordinate, direction angle, and the minutiae quality.
3. Results
As an example of the application of this approach, and an evaluation of its utility for remote sensing analysis and interpretation within the aeolian environment, we applied MINDTCT to a range of remotely sensed dunefield images derived from the Mars HiRISE data acquisition campaign [98], which produces 25 cm resolution images. However, we note that application of the MINDTCT algorithm is not limited to HiRISE and has been successfully applied to dune images from a wide range of Martian imagery sources including the MRO Context Camera (5.5 m resolution) and the Mars Orbiter Camera (MOC 1.5 to 12 m resolution). As well, we note that MINDTCT has been successfully applied over a range of terrestrial image types ranging from Landsat (14.8 m panchromatic and ~28 m multispectral resolutions) to hand held camera perspective images of centimeter-scale dune ripples. While our approach across all of these imagery types has focused on the extraction of dune defects (terminations and bifurcations), we note that our extraction process, in concert with other tools within the MINDTCT processing evironment and a Geographic Information System (GIS) spatial analysis environment may also be used to extract dune crestlines, their local direction, and the spatial organization of both defects and crests.
3.1. Application of MINDTCT to Remotely Sensed HiRISE Imagery of Martian TARs
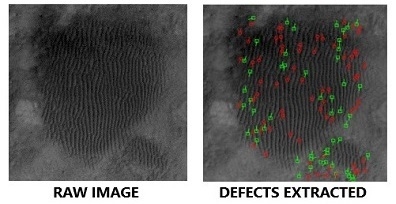
To evaluate MINDTCT in its raw state we first applied MINDTCT to a high-resolution image of a simple TAR field in an ~1 km diameter crater located on a delta within Jezero Crater (Figure 4 and Figure 10a). TARs crests average ~25–27 m of separation so at a pixel resolution of 25 cm/pixel the average pixel spacing is ~100–110 pixels. This is ~12–14× the resolution of the ten print fingerprint images MINDTCT is tuned to. Figure 10b shows the results of the extraction process with 136 defects extracted. Misplacement of both bifurcations (green) and terminations (red) as well as missed defects of both types, especially along the edge of the TAR field, are readily apparent.
With the problems introduced by pixel resolution and edge issues in mind we used MINDTCT in concert with preprocessing of raw digital images to analyze TARs of different types at four localities on the Meridini Plain Mars Exploration Rover (MER) Spirit landing site (Figure 11) (Image ESP_037709_1650 NASA/JPL/University of Arizona). We chose these four localities from over 300 TAR occurrences to specifically evaluate the ability of MINDTCT to extract defects from different TAR types (defined below in Table 2), image resolutions and complexity, as well TAR spacing and field complexity.
Site F275-276 on the southern flank of the Columbia Hills consists of a simple TAR field within a poorly defined crater (Figure 12). TARs at this locality are generally oriented N/S with crests spaced ~2.5 m apart. These TAR and image characteristics produce a ~10-pixel TAR spacing at the raw image resolution (Figure 12a) which is close to the native MINDTCT tuning. There is some scanline noise in the image generally oriented N/S and while resolution is 0.25 cm/pixel, this portion of the raw image (Figure 11) exhibits some graininess and appears slightly degraded. Overall this image, both in appearance and crest spacing appears more like a raw 10-print fingerprint image (Figure 1f) than other TAR fields that we analyzed.
MINDTCT analysis (Figure 12b) resulted in the extraction of 123 defects with 71 terminations and 52 bifurcations (Termination to Bifurcation Ratio (T/B) ~1.37). With few exceptions, MINDTCT extracted all the interior defects correctly. Like the previous example MINDTCT missed some terminations at the edge of the TAR field but the percentage correctly detected improved to ~48% capturing 31 terminations at the edge of the field while missing ~33 terminations. Image enhancement using a combination of smoothing, despeckling and thresholding in ImageJ [99] (not shown) improved both the detection of local flow and contrast at the field edge, capturing ~60 to 75% of the field edge terminations depending on the combination of enhancements used.
Site L09-10 (Figure 13a) is a TAR field within a double crater with a low dividing ridge. TAR spacing is ~2.75 m which is equal to ~13 pixels at the raw image resolution. Unlike the relatively simple TAR structure exhibited at Site F275-276, this field is more complex with indications of an interference pattern between the two subfields, branching structures, and short connecting low ridges perpendicular to the primary TAR orientation.
Analysis of the field with MINDTCT resulted in the extraction of 245 defects with 141 terminations and 104 bifurcations (Figure 13b). The T/B ratio of ~1.35 suggests a tendency towards a forked pattern. A variation in the defect direction horizontally across the image and an abrupt 90-degree change in the upper right of the image potentially complicate defect extraction. Unlike the prior extraction issues with algorithmic edge effects, it appears that MINDTCT correctly extracted most terminations at the edge of the field. This is likely due to the higher contrast between the field and the edge of the double crater.
Site L188 (Figure 14a) illustrates a far more complex TAR field with sinuous features, significant directional variability and crest spacing, and a networked structure. Dune spacing varies from 2.0 to 3.0 m equating to a pixel spacing of eight to 12 pixels. The western edge of the field has excellent contrast while other portions of the edge of the field are characterized by low contrast and poorly defined crests.
MINDTCT extracted 351 defects, with an almost equal quantity of terminations (180) and bifurcations (171) (T/B ~1.05) (Figure 14b). In areas where the underlying TAR structure resembles a fingerprint (Figure 14b; lower left and upper right) MINDTCT performs well. However, in the portions of the field that are sinuous (lower right) or networked (upper center) MINDTCT performs poorly. This is potentially indicative of patterns that differ significantly from the regular spacing, roughly parallel ridges and noncrossing structure that characterizes standard MINDTCT 10-print input.
As a final test of MINDTCT we selected a TAR field at Site L02 (Figure 15a) that exhibited a complex combination of ridge types and spacings. The spacing of much of the TAR field ranges from 2 to 3 m. The exception is the central portion of the field which has both a different structure and well-defined ridges with an ~10 m spacing. These larger features exhibit a branching structure as well as smaller narrow crests radiating at rightangles to the main crest lines.
The results (Figure 15b), as expected from the prior examples, display a high degree of variability depending of the spacing, structure and TAR type. A large number of defects (1314) were extracted with type and quality varying significantly. The termination/bifurcation ratio (T/B) for the entire image is ~0.98 (651/663), however it is clear from Figure 15c–f that this ratio varies considerably. Portions of the field with a combination of sinuous and crossing ridges (Figure 15c) are dominated by terminations with a T/B of ~1.4, while other parts of the field exhibit a hatched pattern (Figure 15d) with far more terminations than bifurcations (T/B ~1.7). Portions of the field with primarily linear ridges (Figure 15e) are characterized by T/B ratios ranging from ~0.5 to 0.7. Defects on the widely spaced ridges of central portion of the image (Figure 15f) were poorly captured, however the closely spaced ridges that branch off of them were partially captured.
Our results suggest that further refinement of the MINDTCT algorithm, with specific tuning for imagery of aeolian features, may be required for before it can be applied to TAR fields with variable complexity and scale. However, and even with this constraint, it is clear that MINDTCT output, through quantification of the T/B ratio across different portions of complex fields, may be useful in determining their underlying spatial pattern. This spatial patterning, as expressed in the organization, relative occurrence, and T/B ratio [29,67], is potentially a measure of underlying physical processes that formed them. Quantification of TAR field metrics therefore can aid our understanding TAR formation and evolution.
3.2. Extraction Enhancement By Tuning MINDTCT
Clearly, the application of MINDTCT to aeolian features is just a first step towards more robust feature extraction methodologies. Many defects are located inaccurately or not detected at all. In Figure 10b and Figure 14b the total lack of extraction in portions of the image where TAR crests are widely spaced indicates that the algorithmic approach of MINDTCT does not work on high resolution images with a large number of pixels between crests.
To improve the application of the MINDTCT algorithm, and assuming, as noted above, that the underlying programming is tuned specifically to normal 10-print fingerprint inputs, we resampled the Figure 10 TAR image such that the average pixel spacing between TAR crests matched that of fingerprint ridges (eight pixels). Namely we resampled the data in ImageJ [99] (Image-> Transform-> Bin-) using a 10× resample and a mean operator. The results (Figure 16) show a realistic extraction of terminations (25) and bifurcations (18). This extraction is best in the center of the field but is inconsistent at the upper and lower edges of the field, failing to capture 42 terminations at the edge of the field and 8 bifurcations. Manually adding these missing 42 terminations and 8 bifurcations produces a termination/bifurcation ratio (T/B) of 2.62 which conforms to the simple to forked class of Balme et al. [100,101]. MINDICT found fewer defects in the resampled image, but their locations and distributions are far more even and accurate, even though the software did not identify a majority of field edge terminations.
This result is not dissimilar to incomplete extraction of fingerprint minutiae at the edge of a 10-print image. Figure 17 illustrates an extraction from a 10-print (f0275_02.png). Here most defects in the center of the image are correctly extracted. Because the algorithmic approach of MINDTCT views the edge of each fingerprint ridge relative to an adjacent unpopulated field as neighborhoods where no valid ridge flow exists and with low contrast and low flow as defined in Table 1, defects are rarely defined in low contrast areas. The few defects found at these locations are usually considered to be of poor quality and normally are not used in fingerprint matching algorithms [38,102,103,104,105,106].
4. Discussion
The application of fingerprint minutiae extraction software to remotely sensed dunefield imagery provides several advantages to the dune defect extraction process over existing methods: ease of use, well-developed and researched processing environment [32], availability of the software at minimal or no cost [32,99], and the ability for the software to run within many processing environments. Nevertheless, the extraction of minutiae from fingerprints [33,102] as well as defects from satellite derived dune field images remains a difficult task [20,29]. A future application of our methodology could be to use extracted defects to more objectively classify TAR morphologies. Past efforts have been made to categorize TARs [100,101,107]. These categorization systems broadly address two features of the TARs—(1) relative spatial context and (2) crest patterns (Table 2)—both of which are important in understanding the formative and evolutionary processes that produce TARs. However, at present, classifying TARs by either of these schemes remains a time-intensive and subjective manual endeavor.
Building a database of TARs and their spatial arrangement would potentially allow for the correlation of defect properties in TARs (e.g., termination/bifurcation occurrence ratio, defect orientation and location) with their corresponding ridge crest pattern. These connections would provide a more objective method for categorizing TARs by ridge crest pattern (Table 3). A generalized example is provided in Figure 18.
5. Conclusions and Suggestions for Future Research
Establishing a link between crest defects, which are well documented and understood in terrestrial environments, and TAR morphologies, which are distinct, but poorly understood, could provide a new and robust perspective into the formative history of TARs. However, further refinement and automation of the ‘fingerprinting’ extraction technique from satellite imagery is required before rigorous large-scale studies of this type can be conducted.
As we have shown, the difficulty increases when high resolution imagery does not conform to the ‘tuned’ 10-print resolution used by MINDTCT. These issues are exacerbated when the dune field is complex with a mix of features that do not conform to the characteristics of a fingerprint, namely perpendicular ridges, and crossing structures. However, even with these constraints, MINDTCT applied to ‘properly formatted’ remotely sensed dune/TAR imagery was shown to extract aeolian dune field defects quickly and accurately.
‘Properly formatted’ in our approach in essence implies that the original dune/TAR image must be reformmatted to look more like a fingerprint. This includes (1) redefining an image of dune crests, which are typically sharp edged and often indicated by rapid brightness change (sunlit/shadow transitions), through filtering and thresholding, such that they resemble the 10-print dark ridge/light valley format of fingerprint images; (2) altering the dune image resolution through resampling such that it matches the native resolution of the 10-print image (~8–10 pixel spacing between ridges); (3) altering image quality and removing noise through despeckling when necessary to remove fine detail that ‘confuses’ the MINDTCT algorithm; (4) dealing with edge effects where the MINDTCT algorithm fails to capture defects in low-contrast, low-directionality, and low-flow portions of the image; and (5) dealing with defects in critical zones of the dune field (such as singular points) that are deleted by MINDTCT even though they may be correctly detected in the initial subroutines [32,103,104] or spurious defects outside of the dune field area [104]. In addition to these issues, the quality of the defects should also be assessed to determine how estimated defect positions and angles differ from the real defect characteristics [29,108]. Erroneous detections, including identifying both missing and spurious defects may be dealt with using post-processing techniques [32,109,110,111].
Our work suggests that additional ‘tuning’ of the MINDTCT source code, such that it can better be applied to remotely sensed imagery for dune defect extraction, is possible. While we used remotely sensed imagery of Transverse Aeolian Ridges (TARs) on Mars to illustrate our approach, the algorithmic formulation of MINDTCT may also be appropriate for extraction of defects from imagery for a wide range of aeolian features from fine-scale ripples to fields of longitudinal and transverse dunes. We further note that this technique could also, through discipline specific modifications, be applied to remotely sensed images of features exhibiting defects ranging from crevasses in ice sheets [112,113,114] to bedform ripples in streams [115,116].
Author Contributions
Conceptualization, L.S.; Methodology, L.S., T.N.-M., & J.W.; Formal Analysis, L.S., T.N.-M., & J.W.; Writing—Original Draft Preparation, L.S.; Writing—Review & Editing, L.S., T.N.-M., & J.W.
Funding
This research received no external funding.
Acknowledgments
Administrative and technical support provided by the University of New Mexico, Department of Earth and Planetary Sciences. Computing resources provided by the Center for Rapid Environmental Assessment and Terrain Evaluation CREATE) and the Center for Advanced Research Computing (CARC) at the University of New Mexico. Travel funds for presenting an early version of this research provided by the University of New Mexico’s Earth and Planetary Sciences Caswell/Silver Foundation. The authors would also like to thank two anonymous reviewers who provided insightful comments that improved the manuscript.
Conflicts of Interest
The authors declare no conflict of interest.
References
- Tsoar, H. The Dynamics of Longitudinal Dunes: Final Technical Report; US Army European Research Office: London, UK, 1978. [Google Scholar]
- Tsoar, H. Dynamic processes acting on a longitudinal (seif) sand dune. Sedimentology 1983, 30, 567–578. [Google Scholar] [CrossRef]
- Wasson, R.J.; Fitchett, K.; Mackey, B.; Hyde, R. Large-scale patterns of dune type, spacing and orientation in the Australian continental dunefield. Aust. Geogr. 1988, 19, 89–104. [Google Scholar] [CrossRef]
- Werner, B.T.; Gillespie, D.T. Fundamentally discrete stochastic model for wind ripple dynamics. Phys. Rev. Lett. 1993, 71, 3230–3233. [Google Scholar] [CrossRef] [PubMed]
- Werner, B.T.; Kocurek, G. Bed-form dynamics: Does the tail wag the dog? Geology 1997, 25, 771–774. [Google Scholar] [CrossRef]
- Werner, B.T.; Kocurek, G. Bedform spacing from defect dynamics. Geology 1999, 27, 727–730. [Google Scholar] [CrossRef]
- Andreotti, B.; Fourriere, A.; Ould-Kaddour, F.; Murray, B.; Claudin, P. Giant aeolian dune size determined by the average depth of the atmospheric boundary layer. Nature 2009, 457, 1120. [Google Scholar] [CrossRef]
- Gao, X.; Chen, X.; Cao, J.; Deng, Z.; Liu, C.; Feng, J. A novel method of fingerprint minutiae extraction based on Gabor phase. In Proceedings of the International Conference on Image Processing, Hong Kong, China, 26–29 September 2010; pp. 3077–3080. [Google Scholar]
- Day, M.; Kocurek, G. Pattern similarity across planetary dunefields. Geology 2018, 46, 999–1002. [Google Scholar] [CrossRef]
- Lancaster, N. A Bibliography of Dunes: Earth, Mars, and Venus. 1988, NASA Contractor Report 4149. Available online: https://ntrs.nasa.gov/archive/nasa/casi.ntrs.nasa.gov/19880017750.pdf (accessed on 1 May 2019).
- Watson, M.G.A.; Ewing, R.C.; Weitz, C.M.; Lewis, K.W.; Lamb, M.P.; Ehlmann, B.L.; Rubin, D.M. Morphologic diversity of Martian ripples: Implications for large-ripple formation. Geophys. Res. Lett. 2018, 45, 10229–10239. [Google Scholar]
- Greeley, R.; Iversen, J.D. Wind as a Geological Process: On Earth, Mars, Venus and Titan; Cambridge University Press: Cambridge, UK, 1985. [Google Scholar]
- Shao, Y. Physics and Modelling of Wind Erosion; Springer Science & Business Media: Berlin, Germany, 2000. [Google Scholar]
- Werner, B.T. A steady-state model of wind-blown sand transport. J. Geol. 1990, 98, 1–17. [Google Scholar] [CrossRef]
- Zimbelman, J.R. Transverse aeolian ridges on Mars: First results from HiRISE images. Geomorphology 2010, 121, 22–29. [Google Scholar] [CrossRef]
- Lancaster, N. Linear dunes on Titan. Science 2006, 312, 702–703. [Google Scholar] [CrossRef]
- Lorenz, R.D.; Wall, S.; Radebaugh, J.; Boubin, G.; Reffet, E.; Janssen, M.; Stofan, E.; Lopes, R.; Kirk, R.; Elachi, C.; et al. The sand seas of Titan: Cassini RADAR observations of longitudinal dunes. Science 2006, 312, 724–727. [Google Scholar] [CrossRef]
- Rubin, D.M.; Hesp, P.A. Multiple origins of linear dunes on Earth and Titan. Nat. Geosci. 2009, 2, 653. [Google Scholar] [CrossRef]
- Silvestro, S.; Vaz, D.A.; Yizhaq, H.; Esposito, F. Dune-like dynamic of Martian aeolian large ripples. Geophys. Res. Lett. 2016, 43, 8384–8389. [Google Scholar] [CrossRef]
- Scuderi, L.A.; Weissmann, G.S.; Hartley, A.J.; Yang, X.; Lancaster, N. Application of Database Approaches to the Study of Earth’s Aeolian Environments: Community Needs and Goals. Aeolian Res. 2017, 27, 79–109. [Google Scholar] [CrossRef]
- Ayrton, H.; Ayrton, W.E. The origin and growth of ripple-mark. Proc. R. Soc. Lond. A 1910, 84, 285–310. [Google Scholar] [CrossRef]
- Evans, O.F. The classification of wave-formed ripple marks. J. Sediment. Res. 1941, 11, 37–41. [Google Scholar] [CrossRef]
- Bagnold, R.A. Motion of waves in shallow water. Interaction between waves and sand bottoms. Proc. R. Soc. Lond. A 1946, 187, 1–18. [Google Scholar] [Green Version]
- Mabbutt, J.A.; Sullivan, M.E. The formation of longitudinal dunes: evidence from the Simpson Desert. Austral. Geogr. 1968, 10, 483–487. [Google Scholar] [CrossRef]
- Goudie, A.S. Statistical laws and dune ridges in southern Africa. Geogr. J. 1969, 135, 404–406. [Google Scholar] [CrossRef]
- Bullard, J.E.; Thomas, D.S.G.; Livingstone, I.; Wiggs, G.F.S. Analysis of linear sand dune morphological variability, southwestern Kalahari Desert. Geomorphology 1995, 11, 189–203. [Google Scholar] [CrossRef]
- Werner, B.T. Eolian dunes: Computer simulations and attractor interpretation. Geology 1995, 23, 1107–1110. [Google Scholar] [CrossRef]
- Telfer, M.W.; Hesse, P.P. Palaeoenvironmental reconstructions from linear dunefields: Recent progress, current challenges and future directions. Quat. Sci. Rev. 2013, 78, 1–21. [Google Scholar] [CrossRef]
- Telfer, M.W.; Fyfe, R.M.; Lewin, S. Automated mapping of linear dunefield morphometric parameters from remotely-sensed data. Aeolian Res. 2015, 19, 215–224. [Google Scholar] [CrossRef]
- Berry, J.; Stoney, D.A. History and Development of Fingerprinting. In Advances in Fingerprint Technology, 22nd ed.; Lee, H.C., Gaensslen, R.E., Eds.; CRC Press: Boca Raton, FL, USA, 2001; pp. 13–52. [Google Scholar]
- Watson, C.I.; Garris, M.D.; Tabassi, E.; Wilson, C.L.; McCabe, R.M.; Stanley, J.S.; Ko, K. User’s Guide to NIST Biometric Image Software (NBIS), National Institute of Standards and Technology, 2006. Available online: http://fingerprint.nist.gov/NFIS/ (accessed on 1 May 2019).
- Watson, C.I.; Garris, M.D.; Tabassi, E.; Wilson, C.L.; McCabe, R.M.; Janet, S.; Ko, K. User’s Guide to NIST Biometric Image Software (NBIS); National Institute of Standards and Technology: Gaithersburg, MD, USA, 2010.
- Hong, L.; Jain, A. Classification of fingerprint images. In Proceedings of the Scandinavian Conference on Image Analysis, Kangerlussuaq, Greenland, 7–11 June 1999; Volume 2, pp. 665–672. [Google Scholar]
- Bansal, R.; Sehgal, P.; Bedi, P. Effective morphological extraction of true fingerprint minutiae based on the hit or miss transform. Int. J. Biom Biostat. 2010, 4, 71–85. [Google Scholar]
- Bansal, R.; Sehgal, P.; Bedi, P. Minutiae Extraction from Fingerprint Images—A Review. Int. J. Comput. Sci. Issues 2011, 8, 74–85. [Google Scholar]
- Akinyokun, O.C.; Adegbeyeni, E.O. Scientific Evaluation of the Process of Scanning and Forensic Analysis of Fingerprints on Ballot Papers. Available online: https://www.abacademies.org/Public/Proceedings/Proceedings24/ALERI%20 Proceedings.pdf (accessed on 4 May 2019).
- Jiang, X.; Yau, W.Y. Fingerprint minutiae matching based on the local and global structures. In Proceedings of the 15th International Conference on Pattern Recognition, Barcelona, Spain, 3–7 September 2000. [Google Scholar]
- Hong, L.; Wan, Y.; Jain, A.K. Fingerprint image enhancement: Algorithm and performance evaluation. IEEE Trans. Pattern Anal. Mach. Intell. 2001, 20, 777–789. [Google Scholar] [CrossRef]
- Trivedi, A.K.; Thounaojam, D.M.; Pal, S. A robust and non-invertible fingerprint template for fingerprint matching system. Forensic Sci. Int. 2018, 288, 256–265. [Google Scholar] [CrossRef] [PubMed]
- Babatunde, I.G.; Akinyokun, O.C.; Kayode, A.B.; Olatunbosun, O. Adaptive and faster approach to fingerprint minutiae extraction and validation. Int. J. Comput. Sci. Secur. 2011, 5, 414–424. [Google Scholar]
- NIST Special Database 4: NIST 8-Bit Gray Scale Images of Fingerprint Image Groups (FIGS). National Institute of Standards and Technology, U.S. Department of Commerce. Available online: https://www.nist.gov/srd/nist-special-database-4 (accessed on 11 December 2018).
- Fryberger, S.G.; Dean, G. A Study of Global Sand Seas; US Geological Survey Professional Paper 1052; 1979; pp. 137–169. Available online: https://pubs.er.usgs.gov/publication/pp1052 (accessed on 11 December 2018).
- Bristow, C.S.; Bailey, S.D.; Lancaster, N. The sedimentary structure of linear sand dunes. Nature 2000, 406, 56–59. [Google Scholar] [CrossRef]
- Andreotti, B.; Claudin, P.; Douady, S. Selection of dune shapes and velocities. Part 1: Dynamics of sand, wind and barchans. Eur. Phys. J. 2002, B28, 321–339. [Google Scholar] [CrossRef]
- Lancaster, N. Geomorphology of Desert Dunes; Routledge: London, UK, 1995. [Google Scholar]
- Bagnold, R.A. The Physics of Blown Sand and Desert Dunes; Dover Publications: Mineola, NY, USA, 2012; 265p. [Google Scholar]
- Livingstone, I. Geomorphological significance of windflow patterns over a Namib linear dune. In Aeolian Geomorphology; Allen & Unwin: Crows Nest, Australia, 1986; pp. 97–112. [Google Scholar]
- Wasson, R.J.; Hyde, R. Factors determining desert dune type. Nature 1983, 304, 337–339. [Google Scholar] [CrossRef]
- Livingstone, I. Monitoring surface change on a Namib linear dune. Earth Surf. Process. Landf. 1989, 14, 317–332. [Google Scholar] [CrossRef]
- Lancaster, N. The Namib Sand Sea: Dune Forms, Processes, and Sediments; CRC Press: Boca Raton, FL, USA, 1989. [Google Scholar]
- Lancaster, N. Geomorphology of Desert Dunes; Routledge: Abingdon, UK, 2013. [Google Scholar]
- Kocurek, G.; Ewing, R.C.; Mohrig, D. How do bedform patterns arise? New views on the role of bedform interactions within a set of boundary conditions. Earth Surf. Process. Landf. 2010, 35, 51–63. [Google Scholar] [CrossRef]
- Ewing, R.C.; Kocurek, G.A. Aeolian dune interactions and dune-field pattern formation: White Sands Dunefield, New Mexico. Sedimentology 2010, 57, 1199–1219. [Google Scholar] [CrossRef]
- Ewing, R.C.; Kocurek, G. Aeolian dune-field pattern boundary conditions. Geomorphology 2010, 114, 175–187. [Google Scholar] [CrossRef]
- Landry, W.; Werner, B.T. Computer simulations of self-organized wind ripple patterns. Phys. D 1994, 77, 238–260. [Google Scholar] [CrossRef]
- Anderson, R.S. Eolian ripples as examples of self-organization in geomorphological systems. Earth Sci. Rev. 1990, 29, 77–96. [Google Scholar] [CrossRef]
- McLean, S.R. The stability of ripples and dunes. Earth Sci. Rev. 1990, 29, 131–144. [Google Scholar] [CrossRef]
- Rubin, D.; Hunter, R. Bedform alignment in directionally varying flows. Science 1987, 237, 276–278. [Google Scholar] [CrossRef]
- Courrech du Pont, S.; Narteau, C.; Gao, X. Two modes for dune orientation. Geology 2014, 42, 743–746. [Google Scholar] [CrossRef]
- Greeley, R.; Lancaster, N.; Lee, S.; Thomas, P. Martian aeolian processes, sediments, and features. In Mars; University of Arizona Press: Tucson, AZ, USA, 1992; pp. 730–766. [Google Scholar]
- Anderson, F.S.; Greeley, R.; Xu, P.; Lo, E.; Blumberg, D.G.; Haberle, R.M.; Murphy, J.R. Assessing the Martian surface distribution of aeolian sand using a Mars general circulation model. J. Geophys. Res. Planets 1999, 104, 18991–19002. [Google Scholar] [CrossRef] [Green Version]
- Bridges, N.; Geissler, P.; Silvestro, S.; Banks, M. Bedform migration on Mars: Current results and future plans. Aeolian Res. 2013, 9, 133–151. [Google Scholar] [CrossRef] [Green Version]
- Williams, J.P.; van der Bogert, C.H.; Pathare, A.V.; Michael, G.G.; Kirchoff, M.R.; Hiesinger, H. Dating very young planetary surfaces from crater statistics: A review of issues and challenges. Meteorit. Planet. Sci. 2018, 53, 554–582. [Google Scholar] [CrossRef]
- Berman, D.C.; Balme, M.R.; Rafkin, S.C.; Zimbelman, J.R. Transverse aeolian ridges (TARs) on Mars II: distributions, orientations, and ages. ICARUS 2011, 213, 116–130. [Google Scholar] [CrossRef]
- Berman, D.C.; Balme, M.R.; Michalski, J.R.; Clark, S.C.; Joseph, E.C. High-resolution investigations of Transverse Aeolian Ridges on Mars. ICARUS 2018, 312, 247–266. [Google Scholar] [CrossRef]
- Bourke, M.C.; Wilson, S.A.; Zimbelman, J.R. The Variability of TARs in Troughs on Mars. Available online: https://www.researchgate.net/publication/23703055_The_Variability_of_Transverse_Aeolian_Ripples_in_Troughs_on_Mars (accessed on 1 May 2019).
- Wilson, S.A. Transverse Aeolian Ridge (TAR). Encyclopedia of Planetary Landforms. Available online: https://doi.org/10.1007/978-1-4614-3134-3 (accessed on 1 May 2019).
- Lapotre, M.G.A.; Ewing, R.C.; Lamb, M.P.; Fischer, W.W.; Grotzinger, J.P.; Rubin, D.M.; Lewis, K.W.; Ballard, M.J.; Day, M.; Gupta, S.; et al. Large wind ripples on Mars: A record of atmospheric evolution. Science 2016, 353, 55–58. [Google Scholar] [CrossRef] [Green Version]
- Zimbelman, J.R.; Williams, S.H. Eolian dunes and deposits in the western United States as analogs to wind-related features on Mars. In The Geology of Mars: Evidence from Earth-Based Analogs; Cambridge University Press: Cambridge, UK, 2007; pp. 232–264. [Google Scholar]
- Zimbelman, J.R.; Scheidt, S.P. Topographic Profiles across a Large Reversing Dune, to Aid in Evaluating the Reversing Dune Hypothesis for TARs on Mars. Available online: https://www.lpi.usra.edu/meetings/dunes2012/pdf/7003.pdf (accessed on 1 May 2019).
- Zimbelman, J.R.; Scheidt, S.P. Precision topography of a reversing sand dune at Bruneau Dunes, Idaho, as an analog for Transverse Aeolian Ridges on Mars. ICARUS 2014, 230, 29–37. [Google Scholar] [CrossRef]
- Zimbelman, J.R.; Williams, S.H.; Johnston, A.K. Cross-sectional profiles of sand ripples, megaripples, and dunes: A method for discriminating between formational mechanisms. Earth Surf. Proc. Landf. 2012, 37, 1120–1125. [Google Scholar] [CrossRef]
- Montgomery, D.R.; Bandfield, J.L.; Becker, S.K. Periodic bedrock ridges on Mars. J. Geophys. Res. 2012, 117, E03005. [Google Scholar] [CrossRef]
- Zimbelman, J.R. Spatial resolution and the geologic interpretation of Martian morphology: Implications for subsurface volatiles. ICARUS 1987, 71, 257–267. [Google Scholar] [CrossRef]
- Edgett, K.S.; Parker, T.J. “Bright” Aeolian Dunes on Mars: Viking Orbiter Observations. In Proceedings of the Lunar and Planetary Science Conference XXIX, Houston, TX, USA, 16–20 March 1998. [Google Scholar]
- Thomas, P.C.; Malin, M.C.; Carr, M.H.; Danielson, G.E.; Davies, M.E.; Hartmann, W.K.; Ingersoll, A.P.; James, P.B.; McEwen, A.S.; Soderblom, L.A.; et al. Bright dunes on Mars. Nature 1999, 397, 592. [Google Scholar] [CrossRef]
- Malin, M.C.; Edgett, K.S. Mars Global Surveyor Mars Orbiter Camera: interplanetary cruise through primary mission. J. Geophys. Res. 2001, 106, 23429–23570. [Google Scholar] [CrossRef]
- Foroutan, M.; Zimbelman, J.R. Mega-ripples in Iran: A new analog for transverse aeolian ridges on Mars. ICARUS 2016, 274, 99–105. [Google Scholar] [CrossRef]
- Hugenholtz, C.H.; Barchyn, T.E. A terrestrial analog for transverse aeolian ridges (TARs): Environment, morphometry, and recent dynamics. ICARUS 2017, 289, 239–253. [Google Scholar] [CrossRef]
- Derickson, D.; Kocurek, G.; Ewing, R.C.; Bristow, C. Origin of a complex and spatially diverse dune-field pattern, Algodones, southeastern California. Geomorphology 2008, 99, 186–204. [Google Scholar] [CrossRef]
- Al-Masrahy, M.A.; Mountney, N.P. Remote sensing of spatial variability in aeolian dune and interdune morphology in the Rub’ Al-Khali, Saudi Arabia. Aeolian Res. 2013, 11, 155–170. [Google Scholar] [CrossRef] [Green Version]
- Varma, S.; Shah, V.; Banerjee, B.; Buddhiraju, K.M. Change detection of desert sand dunes: a remote sensing approach. Adv. Remote Sens. 2014, 3, 10–22. [Google Scholar] [CrossRef]
- Fagan, J.F. The origins of facial pattern recognition. In Psychological Development from Infancy: Image to Intention; Routledge: London, UK, 2017. [Google Scholar]
- Jain, A.K.; Duin, R.P.; Mao, J. Statistical pattern recognition: A review. IEEE Trans. Pattern. Anal. Mach. Intell. 2000, 22, 4–37. [Google Scholar] [CrossRef]
- Webb, A.R. Statistical Pattern Recognition; John Wiley & Sons: Hoboken, NJ, USA, 2003. [Google Scholar]
- Shih, F.Y. Image Processing and Pattern Recognition: Fundamentals and Techniques; John Wiley & Sons: Hoboken, NJ, USA, 2010. [Google Scholar]
- Canny, J. A computational approach to edge detection. IEEE Trans. Pattern. Anal. Mach. Intell. 1986, 6, 679–698. [Google Scholar] [CrossRef]
- Kundu, A. Robust edge detection. Pattern Recognit. 1990, 23, 423–440. [Google Scholar] [CrossRef]
- Shrivakshan, G.T.; Chandrasekar, C. A comparison of various edge detection techniques used in image processing. Int. J. Comput. Sci. Issues 2012, 9, 269–276. [Google Scholar]
- Al-Amri, S.S.; Kalyankar, N.V.; Khamitkar, S.D. Image segmentation by using edge detection. Int. J. Comput. Sci. Eng. 2010, 2, 804–807. [Google Scholar]
- Blaschke, T. Object based image analysis for remote sensing. ISPRS J. Photogramm. Remote Sens. 2010, 65, 2–16. [Google Scholar] [CrossRef] [Green Version]
- Mather, P.; Tso, B. Classification Methods for Remotely Sensed Data; CRC Press: Boca Raton, FL, USA, 2016. [Google Scholar]
- Peralta, D.; Galar, M.; Triguero, I.; Miguel-Hurtado, O.; Benitez, J.M.; Herrera, F. Minutiae filtering to improve both efficacy and efficiency of fingerprint matching algorithms. Eng. Appl. Artif. Intell. 2014, 32, 37–53. [Google Scholar] [CrossRef]
- Peralta, D.; Galar, M.; Triguero, I.; Paternain, D.; García, S.; Barrenechea, E.; Benítez, J.M.; Bustince, H.; Herrera, F. A survey on fingerprint minutiae-based local matching for verification and identification: Taxonomy and experimental evaluation. Inf. Sci. 2015, 315, 67–87. [Google Scholar] [CrossRef]
- Peralta, D.; García, S.; Benitez, J.M.; Herrera, F. Minutiae-based fingerprint matching decomposition: methodology for big data frameworks. Inf. Sci. 2017, 408, 198–212. [Google Scholar] [CrossRef]
- Stock, R.M.; Swonger, C.W. Development and Evaluation of a Reader of Fingerprint Minutiae; Cornell Aeronautical Laboratory: Buffalo, NY, USA, 1969. [Google Scholar]
- Yager, N.; Amin, A. Fingerprint classification: a review. Pattern. Anal. Appl. 2004, 7, 77–93. [Google Scholar] [CrossRef]
- McEwen, A.S.; Eliason, E.M.; Bergstrom, J.W.; Bridges, N.T.; Hansen, C.J.; Delamere, W.A.; Grant, J.A.; Gulick, V.C.; Herkenhoff, K.E.; Keszthelyi, L.; et al. Mars reconnaissance orbiter’s high resolution imaging science experiment (HiRISE). J. Geophys. Res. Planets 2007, 112, 40. [Google Scholar] [CrossRef]
- Schneider, C.A.; Rasband, W.S.; Eliceiri, K.W. NIH Image to ImageJ: 25 years of image analysis. Nat. Methods 2012, 9, 671–675. [Google Scholar] [CrossRef] [Green Version]
- Balme, M.R.; Bourke, M.C. Preliminary results from a new study of transverse aeolian ridges (TARS) on Mars. In Proceedings of the 36th Lunar and Planetary Science Conference, Houston, TX, USA, 14–18 March 2006. [Google Scholar]
- Balme, M.; Berman, D.C.; Bourke, M.C.; Zimbelman, J.R. Transverse Aeolian Ridges (TARs) on Mars. Geomorphology 2008, 101, 703–720. [Google Scholar] [CrossRef] [Green Version]
- Maio, D.; Maltoni, D. Direct gray-scale minutiae detection in fingerprints. IEEE Trans. Pattern Anal. Mach. Intell. 1997, 19, 27–40. [Google Scholar] [CrossRef] [Green Version]
- Greenberg, S.; Aladjem, M.; Kogan, D. Fingerprint image enhancement using filtering techniques. Real-Time Imaging 2002, 8, 227–236. [Google Scholar] [CrossRef]
- Peralta, D.; Triguero, I.; Sanchez-Reillo, R.; Herrera, F.; Benítez, J.M. Fast fingerprint identification for large databases. Pattern Recognit. 2014, 47, 588–602. [Google Scholar] [CrossRef]
- Peralta, D.; Triguero, I.; García, S.; Saeys, Y.; Benitez, J.M.; Herrera, F. Distributed incremental fingerprint identification with reduced penetration rates using a hierarchical classification based on feature fusion and selection. Knowl-Based. Syst. 2017, 126, 91–103. [Google Scholar] [CrossRef]
- Jain, A.; Hong, L.; Bolle, R. On-line fingerprint verification. IEEE Trans. Pattern Anal. Mach. Intell. 1997, 19, 302–314. [Google Scholar] [CrossRef] [Green Version]
- Wilson, S.A.; Zimbelman, J.R. Latitude-dependent nature and physical characteristics of transverse aeolian ridges on Mars. J. Geophys. Res. Planets 2004, 109, E10003. [Google Scholar] [CrossRef]
- Jiang, X.; Yau, W.; Ser, W. Detecting the fingerprint minutiae by adaptive tracing the gray-level ridge. Pattern Recognit. 2001, 34, 999–1013. [Google Scholar] [CrossRef]
- Jain, A.; Prabhakar, S.; Hong, L. A multichannel approach to fingerprint classification. IEEE Trans. Pattern Anal. Mach. Intell. 1999, 21, 348–359. [Google Scholar] [CrossRef] [Green Version]
- Chikkerur, S.; Govindaraju, V.; Pankanti, S.; Bolle, R.M.; Ratha, N.K. Novel Approaches for Minutiae Verification in Fingerprint Images. Available online: http://citeseerx.ist.psu.edu/viewdoc/download?doi=10.1.1.134.8773&rep=rep1&type=pdf (accessed on 1 May 2019).
- Chang, J.H.; Fan, K.C. Fingerprint ridge allocation in direct gray-scale domain. Pattern Recognit. 2001, 34, 1907–1925. [Google Scholar] [CrossRef] [Green Version]
- Harper, J.T.; Humphrey, N.F.; Pfeffer, W.T. Crevasse patterns and the strain-rate tensor: a high-resolution comparison. J. Glaciol. 1998, 44, 68–76. [Google Scholar] [CrossRef] [Green Version]
- Herzfeld, U.C.; Zahner, O. A connectionist-geostatistical approach to automated image classification, applied to the analysis of crevasse patterns in surging ice. Comput. Geosci. 2001, 27, 499–512. [Google Scholar] [CrossRef]
- Swift, D.A.; Jones, A.H. Going against the flow: Testing the hypothesis of pulsed axial glacier flow. Earth Surf. Process. Landf. 2018, 43, 2754–2761. [Google Scholar] [CrossRef]
- Perron, J.T.; Myrow, P.M.; Huppert, K.L.; Koss, A.R.; Wickert, A.D. Ancient record of changing flows from wave ripple defects. Geology 2018, 46, 875–878. [Google Scholar] [CrossRef]
- Sarkar, K.; Mazumder, B.S. Space time evolution of sand bed topography and associated flow turbulence: experiments with statistical analysis. Stoch. Environ. Res. Risk Assess. 2018, 32, 501–525. [Google Scholar] [CrossRef]
Figure 1.
Dune crest and fingerprint ridgeline forms. a. Linear dunes Namib Desert −24.43 15.17, b. Transverse Aeolian Ridges (TARS) on Mars (Image ESP_036397_1785) c. Linear dunes on Titan (Cassini T8 flyby, Oct. 2005, 8°S, 264°W, ~ 300 m resolution). d. Perspective view of ripples on larger dune slope facet (1 cm resolution) from a digital handheld camera. Note crest bifurcations and terminations. e. Ripples on dunes Nili Patera, Mars (High Resolution Imaging Science Experiment (HiRISE) image PIA18818). f. Raw ten-print image f0444_03 from the NIST fingerprint database [41] showing arch structure, ridge organization and bifurcations, and terminations (mm resolution).

Figure 2.
Dune types and wind direction relationships. a. Linear dunes and their generating wind field. b. Transverse dunes and their generating wind field. c. Linear and transverse dune features and their attributes [20].
Figure 2.
Dune types and wind direction relationships. a. Linear dunes and their generating wind field. b. Transverse dunes and their generating wind field. c. Linear and transverse dune features and their attributes [20].

Figure 3.
Linear dune defect formation and migration. The dominant wind vector is represented here by the filled arrow, while the migration of the dune defects are represented as open arrows. Transport parallel to crest lines produces downwind migration of defects (terminations: black circles) and upwind migration of Y-junctions (bifurcations: white filled circle) [6].

Figure 4.
Jezero Crater Delta (Mars 2020 Landing site) a. Color altimetry of digital elevation model. Latitude 18.49° Longitude 77.41°, Scale 1.00 m/pixel. (DTEEC_002387_1985_003798_1985_U01) b. The large unnamed crater on the southern portion of the delta that contains a field of TARs that will potentially be visited and interogated during the Mars 2020 rover mission. This TAR field is analyzed in Section 3.1 and Section 3.2. Images provided by NASA/JPL/University of Arizona.


Figure 6.
Ridge Flow Direction Calculation. Top left: 24 × 24 grid oriented 0°. Top Right: Rotational reference frame. Lower: Range of possible orientations separated by 11.25° [31,32].

Figure 7.
Waveform patterns over a 24-pixel field. Top to bottom: 1, 2, 4, and 8-cycle windows.

Figure 8.
Ridge flow detection approach. a. 7 × 9 grid is used to sum values. b. Rotated grid centered on the pixel to which the sum will acrue [32].
Figure 8.
Ridge flow detection approach. a. 7 × 9 grid is used to sum values. b. Rotated grid centered on the pixel to which the sum will acrue [32].

Figure 9.
Feature extraction templates. Horizontal image sweeps [31,32]. The templates are rotated 90° for vertical image sweeps. Blue box (terminations) and red box (bifurcations) represent the most basic extraction kernals.

Figure 10.
a. Unnamed crater Jezero delta. High Resolution Imaging Science Experiment (HiRISE) Image ESP_037396_1985. Map projected scale 25 cm/pixel. North is up. Acquired 19 July 2014. (Image NASA/JPL/University of Arizona). b. Defects extracted using the full resolution image (3088 × 2280 pixels). Green circles and red squares are bifurcations and terminations respectively. Defects missed by the MINDTCT algorithm not shown.


Figure 11.
Meridini Plain MER Spirit landing and exploration site. Four TAR test sites indicated.

Figure 12.
Site F275-276 (175.615°, −14.633°, Projection GCS_Mars). a. Full resolution image (25 cm/pixel). TAR spacing in image pixels approximates MINDTCT input fingerprint ridge spacing. b. Defect extraction. Color key same as Figure 10. Radiating lines represent defect orientation.
Figure 12.
Site F275-276 (175.615°, −14.633°, Projection GCS_Mars). a. Full resolution image (25 cm/pixel). TAR spacing in image pixels approximates MINDTCT input fingerprint ridge spacing. b. Defect extraction. Color key same as Figure 10. Radiating lines represent defect orientation.

Figure 13.
Site L09-10 (175.613, −14.514 decimal degrees, −260,101.2515 m, −860,177.3776 m, Projection GCS_Mars). a. Raw image. b. Enhanced MINDTCT processed image. Color key same as Figure 10.
Figure 13.
Site L09-10 (175.613, −14.514 decimal degrees, −260,101.2515 m, −860,177.3776 m, Projection GCS_Mars). a. Raw image. b. Enhanced MINDTCT processed image. Color key same as Figure 10.

Figure 14.
Site L188. (175.64, −14.727 decimal degrees, −258,319.587 m, −872,801.8553 m, Projection GCS_Mars). a. Raw image. b. MINDTCT processed image. Color key same as Figure 10.
Figure 14.
Site L188. (175.64, −14.727 decimal degrees, −258,319.587 m, −872,801.8553 m, Projection GCS_Mars). a. Raw image. b. MINDTCT processed image. Color key same as Figure 10.


Figure 15.
Site L02. (175.561, −14.53 decimal degrees, −263,485.6683m, −860,874.5724m, Projection GCS_Mars). a. Raw image. 25 cm/pixel. b. Defect extraction. c. Zoom of field with a combination of sinuous and crossing ridges. d. Zoom of field with primarily crossing pattern. e. Zoom of field with primarily linear ridges. f. Zoom of central region with widely spaced ridges and crossing structure. Color key same as Figure 10.

Figure 16.
MINDTCT extraction from a resampled image (binned by 10 pixels). Green boxes (terminations) and red circles (bifurcations) with direction indicated by vectors from their center points.
Figure 16.
MINDTCT extraction from a resampled image (binned by 10 pixels). Green boxes (terminations) and red circles (bifurcations) with direction indicated by vectors from their center points.

Figure 17.
Fingerprint minutiae extraction. Image f0275_02.png from the NIST fingerprint database [41]. Note the lack of termination extraction at the edges of the fingerprint like that seen in the TAR extraction in Figure 16.

Figure 18.
TAR representational schemes. (a) (Traced) Generalized TAR crests following the categorization scheme of [101]. (A) Simple, (B) forked, (C) sinuous, (D) barchan-like, and (E) networked. (b) (Annotated) Generalized TAR crests with annotated defects. Terminations (red circles) and bifurcations (green circles) are marked. More than 400 defects were located in these five small examples. (c) (Defects) Extracted defects from each TAR morphology. Even without direction information, each morphology’s defects are distinctly different, with the exception of forked vs. sinuous TARs.


Table 1.
MINDTCT Output.
| Output Type | Output Description |
|---|---|
| Direction Map | 16 integer bidirectional units. A value of −1 in this map represents a neighborhood where no valid ridge flow was determined. |
| High-Curvature Map | Cell values of 1 represent 8 × 8 pixel neighborhoods in the image that are located within a high-curvature region, otherwise cell values are set to 0. |
| Low-Contrast Map | Cell values of 1 represent 8 × 8 pixel neighborhoods in the image that are located within a low-contrast region, otherwise cell values are set to 0. |
| Low-Flow Map | Cell values of 1 represent 8 × 8 pixel neighborhoods in the image that are located within a region where a dominant directional frequency could not be determined, otherwise cell values are set to 0. |
| Quality Map | Five discrete levels of quality. Each value in the map representing an 8 × 8 pixel neighborhood in the fingerprint image. A cell value of 4 represents highest quality, while a cell value of 0 represents lowest possible quality. |
| Minutiae Detection Results | A text file with the minutiae number, x,y location, minutiae direction, quality and type (bifurcation (BIF) or ridge ending (RIG)) |
| Crest Pattern | Topographic Control |
|---|---|
| Simple | Confined |
| Forked | Controlled |
| Sinuous | Influenced |
| Barchan-like | Independent |
| Networked |
Table 3.
Expected TAR defect properties.
| Balme et al. [101] Crest Pattern Categories | Expected Defect Properties | ||||
|---|---|---|---|---|---|
| Termination Frequency | Termination Orientation | Bifurcation Frequency | Bifurcation Orientation | Termination: Bifurcation Ratio | |
| Simple | Many | Unidirectional | None | N/A | Very high |
| Forked | Many | Unidirectional | Few | Unidirectional | High |
| Sinuous | Many | Unidirectional | Few | Unidirectional | Intermediate |
| Barchan-like | Few | Bidirectional | Many | Bidirectional | Low |
| Networked | Few | None | Many | Bidirectional | Very low |
© 2019 by the authors. Licensee MDPI, Basel, Switzerland. This article is an open access article distributed under the terms and conditions of the Creative Commons Attribution (CC BY) license (http://creativecommons.org/licenses/by/4.0/).
Share and Cite
MDPI and ACS Style
Scuderi, L.; Nagle-McNaughton, T.; Williams, J. Trace Evidence from Mars’ Past: Fingerprinting Transverse Aeolian Ridges. Remote Sens. 2019, 11, 1060. https://doi.org/10.3390/rs11091060
AMA Style
Scuderi L, Nagle-McNaughton T, Williams J. Trace Evidence from Mars’ Past: Fingerprinting Transverse Aeolian Ridges. Remote Sensing. 2019; 11(9):1060. https://doi.org/10.3390/rs11091060
Chicago/Turabian StyleScuderi, Louis, Timothy Nagle-McNaughton, and Joshua Williams. 2019. "Trace Evidence from Mars’ Past: Fingerprinting Transverse Aeolian Ridges" Remote Sensing 11, no. 9: 1060. https://doi.org/10.3390/rs11091060
Note that from the first issue of 2016, this journal uses article numbers instead of page numbers. See further details here.