Validation of Streaklines as Recorders of Synoptic Flow Direction in a Deltaic Setting


1
Department of Geosciences, University of Arkansas, Fayetteville, AR 72701, USA
2
Department of Earth and Environmental Sciences, University of New Orleans, New Orleans, LA 70148, USA
*
Author to whom correspondence should be addressed.
Remote Sens. 2020, 12(1), 148; https://doi.org/10.3390/rs12010148
Submission received: 16 November 2019
/
Revised: 19 December 2019
/
Accepted: 25 December 2019
/
Published: 2 January 2020
(This article belongs to the Special Issue Remote Sensing of Estuarine, Lagoon and Delta Environments)
Abstract
:Knowledge of the flow patterns within distributary systems is key for understanding deltaic hydro- and morpho-dynamics, yet synoptic measurements of flow fields remain virtually nonexistent. As a means of overcoming this problem, a small number of studies have used biogenic surface films as synoptic flow tracers, under the assumption that biofilm streaklines are tangent to the local flow direction. Here we rigorously test this assumption and show that, despite flow patterns that change severely in space and time (over a range >270°), streaklines are relatively accurate synoptic flow tracers for the Wax Lake Delta, in Louisiana. When the incoming discharge was greater than 2400 m3/s with stable or falling tides, the streakline-derived flow direction departed from near bed flow direction measurements of 22.8° (root mean square). When the discharge was greater than 2400 m3/s and the tides were rising greater than 0.03 m/hr, they were accurate within 28.0°. Under conditions of discharge less than 2400 m3/s and tidal change less than a positive 0.03 m/hr, they were accurate within 33.3°, while during low discharge and rising tides they were accurate within 58.9°. Accuracy varied with distance from the delta, with proximal sites having greater precision. Our results demonstrate that a streakline-derived flow direction can characterize the spatiotemporal variability in the flow directions, but that the accuracy is significantly influenced by the hydrodynamic conditions and location within the network.

1. Introduction
River deltas are rapidly evolving landforms that host roughly 400 million people, productive ecosystems, and important infrastructures across the globe [1]. The rapid construction and erosion of river delta deposits stems from the large sediment transport capacity and energy gradients supplied by rivers, tides, and waves in environments with sufficient sediment supply. Rising sea levels and the significant human modification of river deltas have created an urgent need to understand the hydraulic processes that control erosion and deposition in river deltas [2,3,4].
The measurement of synoptic flow patterns is an important blind spot in the ongoing study of delta hydraulics. Sensor deployments and ship-based measurements in river deltas provide essential measurements of fluid properties, velocity, shear stress, and sediment transport [5,6,7]. However, the divergence of sediment transport, which controls erosion and deposition, requires the measurement of the spatial changes in the flow properties (the Lagrangian reference frame), which is difficult to resolve across the rapidly varying environments of river deltas. While it is relatively straightforward to estimate the average flow direction of a channel from a map, it is far more difficult in transitional regions, in submerged channels, and on the unchannelized delta front.
Sediment transport divergence and bed change can be examined through use of hydraulic models, which vary in complexity and application [8,9,10,11,12,13,14,15,16]. However, such models require information about boundary conditions (e.g., bathymetry, grain sizes, and hydraulic conditions) in order to investigate specific river deltas. Hence, synoptic measurements of deltaic flow patterns have the potential to complement the existing approaches of studying delta hydraulics.
Biofilms act as passive tracers on the water surface, and can be mapped as a means of estimating the flow direction in river deltas. Surface biofilms composed of n-alkanes and fatty acids affect both the roughness and the emissivity of the water surface, making them readily identifiable using remote sensing imagery [17,18,19]. Seppke et al. [20] demonstrated that sea surface biofilms can be used as flow tracers to derive mesoscale (>200 km), as well as sub-mesoscale (<200 km) sea surface current fields.
Similar films are seen in remotely sensed imagery on many river deltas around the world in both near infrared (Landsat, Sentinel) and synthetic aperture radar (Envisat, UAVSAR) imagery. The films are organized into curvilinear features extending from the delta, which can reach >10 km in length (“streaklines”). If streaklines can be assumed to passively track depth-averaged flows (assumption 1), and flow patterns can be assumed to be steady (flow direction field is constant in time; assumption 2), then the synoptic flow field on a delta front could be assumed to be tangent to the streakline field. Shaw et al. [21] showed a remarkable correspondence between streakline-derived flow direction and in-situ flow direction measurements, and combined flow direction and bathymetric measurements to calculate spatial accelerations that corresponded well with measured bathymetric changes. Qualitative and quantitative similarities between remotely sensed streaklines and numerical models of delta front flow around distributary channel tips have also been demonstrated [22]. However, streaklines have yet to be directly compared to the contemporaneous measurements of flow direction to test the two assumptions above. The quantitative analysis of these two assumptions is an important step in the further application of streakline-based methods for measuring river delta hydraulics.
In this paper, we directly compare one year of the in-situ flow direction measurements to the remotely sensed flow direction estimates from the streaklines. The measurement differences were analyzed for differing regimes of discharge, tidal change, and wind to understand their influence on the precision of streaklines as tracers of flow. The results of this study provide uncertainty estimates for streakline-based flow direction measurements, and recommendations for the use of this technique in other systems.
2. Methodology
Fieldwork: Located in coastal Louisiana, the Wax Lake Delta (WLD) is approximately 150 km southwest of New Orleans (Figure 1a–c). The sheltered nature of the Atchafalaya Bay, in which the WLD is located, allows for the floating biofilms coming from the vegetated unchannelized regions to remain coherent for several km basinward of the delta, making it an ideal location to track streaklines. The in-situ flow direction data for this study were collected using 10 Lowell Instruments TCM-1 tilt current meters (TCMs) deployed from 21 March 2017 to 23 March 2018 on the WLD. The buoyant TCMs were fastened to an anchor using a short nylon rope and were deployed in water depths ranging from 1.0–2.4 m. The 0.76-m long instrument directly measures the flow direction in the decimeters above the bed, rather than at the surface where the biofilm streaklines exist. As the water flow inclines the TCM, the orientation is recorded from a three-axis accelerometer and a three-axis magnetometer. The instruments recorded the orientation at 16 Hz for 120 s, every six minutes. Subsequently, the measurements were time-averaged, and were processed using Lowell Instruments Domino software, which, through the application of calibration coefficients, transformed the data into speed and direction. The measurements presented here are the 120 s average measured closest to satellite image acquisition. The TCMs were deployed around the tip of Gadwall Pass (Figure 1a). The devices were serviced, and the data downloaded every four months. During deployment, six TCMs were lost, with only T21, T22, T27, and T29 logging data for the full year. T25 was lost after four months with the remainder only logging data for eight months. Furthermore, T24 became immobilized because of a sediment accumulation event and subsequently lost data from 6 May to 30 June 2017.
The water speed and direction at the locations of the TCMs were measured by doing 15-min stationary readings using a boat mounted 1200 kHz Teledyne RiverPro Acoustic Doppler Current Profiler (ADCP). The ADCP data were collected 2 July 2017 and 28 October 2017. The data were then processed using Teledyne WinRiver II software to calculate the velocity profile of the water column. Data that contained more than 10% of bad or missing data were excluded from the data set. The resulting dataset was then analyzed to compare the depth-averaged and near-surface flow directions to further test assumption 2.
Remote Sensing: Copernicus Sentinel data (2017 and 2018), provided by the European Commission’s Copernicus Program, were chosen for this study, because of the resolution of 10 m per pixel. Band 8 Near Infrared (0.83 µm) imagery was used for mapping, as the streaklines were best resolved at this wavelength (Figure 1b,c). Of the available images acquired concurrent to the deployment period, 19 images were deemed appropriate, having both a sufficiently low cloud cover and definable streaklines.
The streakline direction at the TCM locations was mapped at a 1:25,000 scale, without prior knowledge of the TCM measurements. Using ArcMap 10.5.1, a streakline would be selected, then, starting proximal and moving distal, would be manually mapped as a polyline shapefile. The process would then be repeated until all of the streaklines in the footprint of the sensor field had been digitized. At the location of each TCM, smaller polylines were constructed using the derived flow field as a guide. The directions of these smaller polylines were calculated using ArcMap then compared to the direction of the in situ measurement contemporaneous to the image acquisition. The difference between the two was then calculated. All in situ and streakline-derived flow directions are tabulated with environmental conditions in the supplementary material.
Discharge data for the WLD feeder channel input were acquired from the United States Geological Survey gauge (USGS 07381590) in Calumet, LA, located approximately 18 km upstream. Tidal and wind data were acquired from the National Oceanic and Atmospheric Administration Lawma-Amerada Pass station (NOAA #8764227) located approximately 12 km to the southeast. The hourly tidal change data were calculated over the period from half an hour before and after the time of image acquisition. Then, the 6-min averaged wind direction was converted from the direction out (the standard wind format) into the direction into, so as to directly compare it to the TCM flow direction data.
3. Results
The in-situ measurements of the near bed flow direction around the Gadwall Pass channel tip provided by the TCM deployment show that the flow was both spatially and temporally variable over the one-year deployment. When the 19 Sentinel images were acquired, the in situ flow direction measurements in the region varied between highly organized and disorganized, with ranges of 26.9° and 163.25° for 8 October 2017 and 19 August 2017, respectively (Figure 2a,d). The flow direction varied gradually at each TCM deployment, but the flow direction varied by a minimum of 86.4° (T29) and a maximum of 278.5° (T23) across the 19 Sentinel images (Figure 2c,d). Hence, the flow directions on this portion of the delta front are highly variable, and it is problematic to assume a single flow direction at any location or at any time.
A comparison of the in-situ and streakline-based flow directions revealed differences that varied in space and time. In space, the proximity of a deployment to the delta significantly influenced the difference (Figure 3). Proximally situated (T22, T25, T26, T27, T28, and T29; Figure 1a) showed an average root mean square error difference between streakline and in situ measured flow direction (hereafter, just RMSE) of 27.1°. These six stations showed a variation in flow direction of 283.2° over time. Hence, the RMSE associated with streaklines is only 9.6% of the total variation within this region. Distal stations outside (T20, T21, T23, and T24; Figure 1a) had an average RMSE of 57.1°. These four stations showed a variation in flow direction of 313.2° over time. Here, the RMSE was 18% of the total variation. The most proximally positioned TCM (T29) was within the subaqueous channel, and had an RMSE of 11.7° for the 19 images. Meanwhile, the most distal TCM (T23) had an RMSE of 79.5° for the 19 images.
The difference between streakline and in-situ measurements was minimized during large discharges, and stable to falling tides (Figure 4a). The streakline measurements were relatively poorly behaved when the tide was rising at a rate greater than 0.07 m/hr (RMSE = 68.5°). When the tide was falling or rising at a rate less than 0.03 m/hr, the differences were relatively small (RMSE = 25.8°). The water discharge measured at Calumet also significantly affected the difference (Figure 4b). Disregarding tidal change, when the discharge was measured to be greater than 2400 m³/s, the streakline measurements were well behaved (RMSE = 24.6°). Meanwhile, when the discharge was less than 2400 m³/s, the difference in the measurement more than doubled (RMSE = 53.5°).
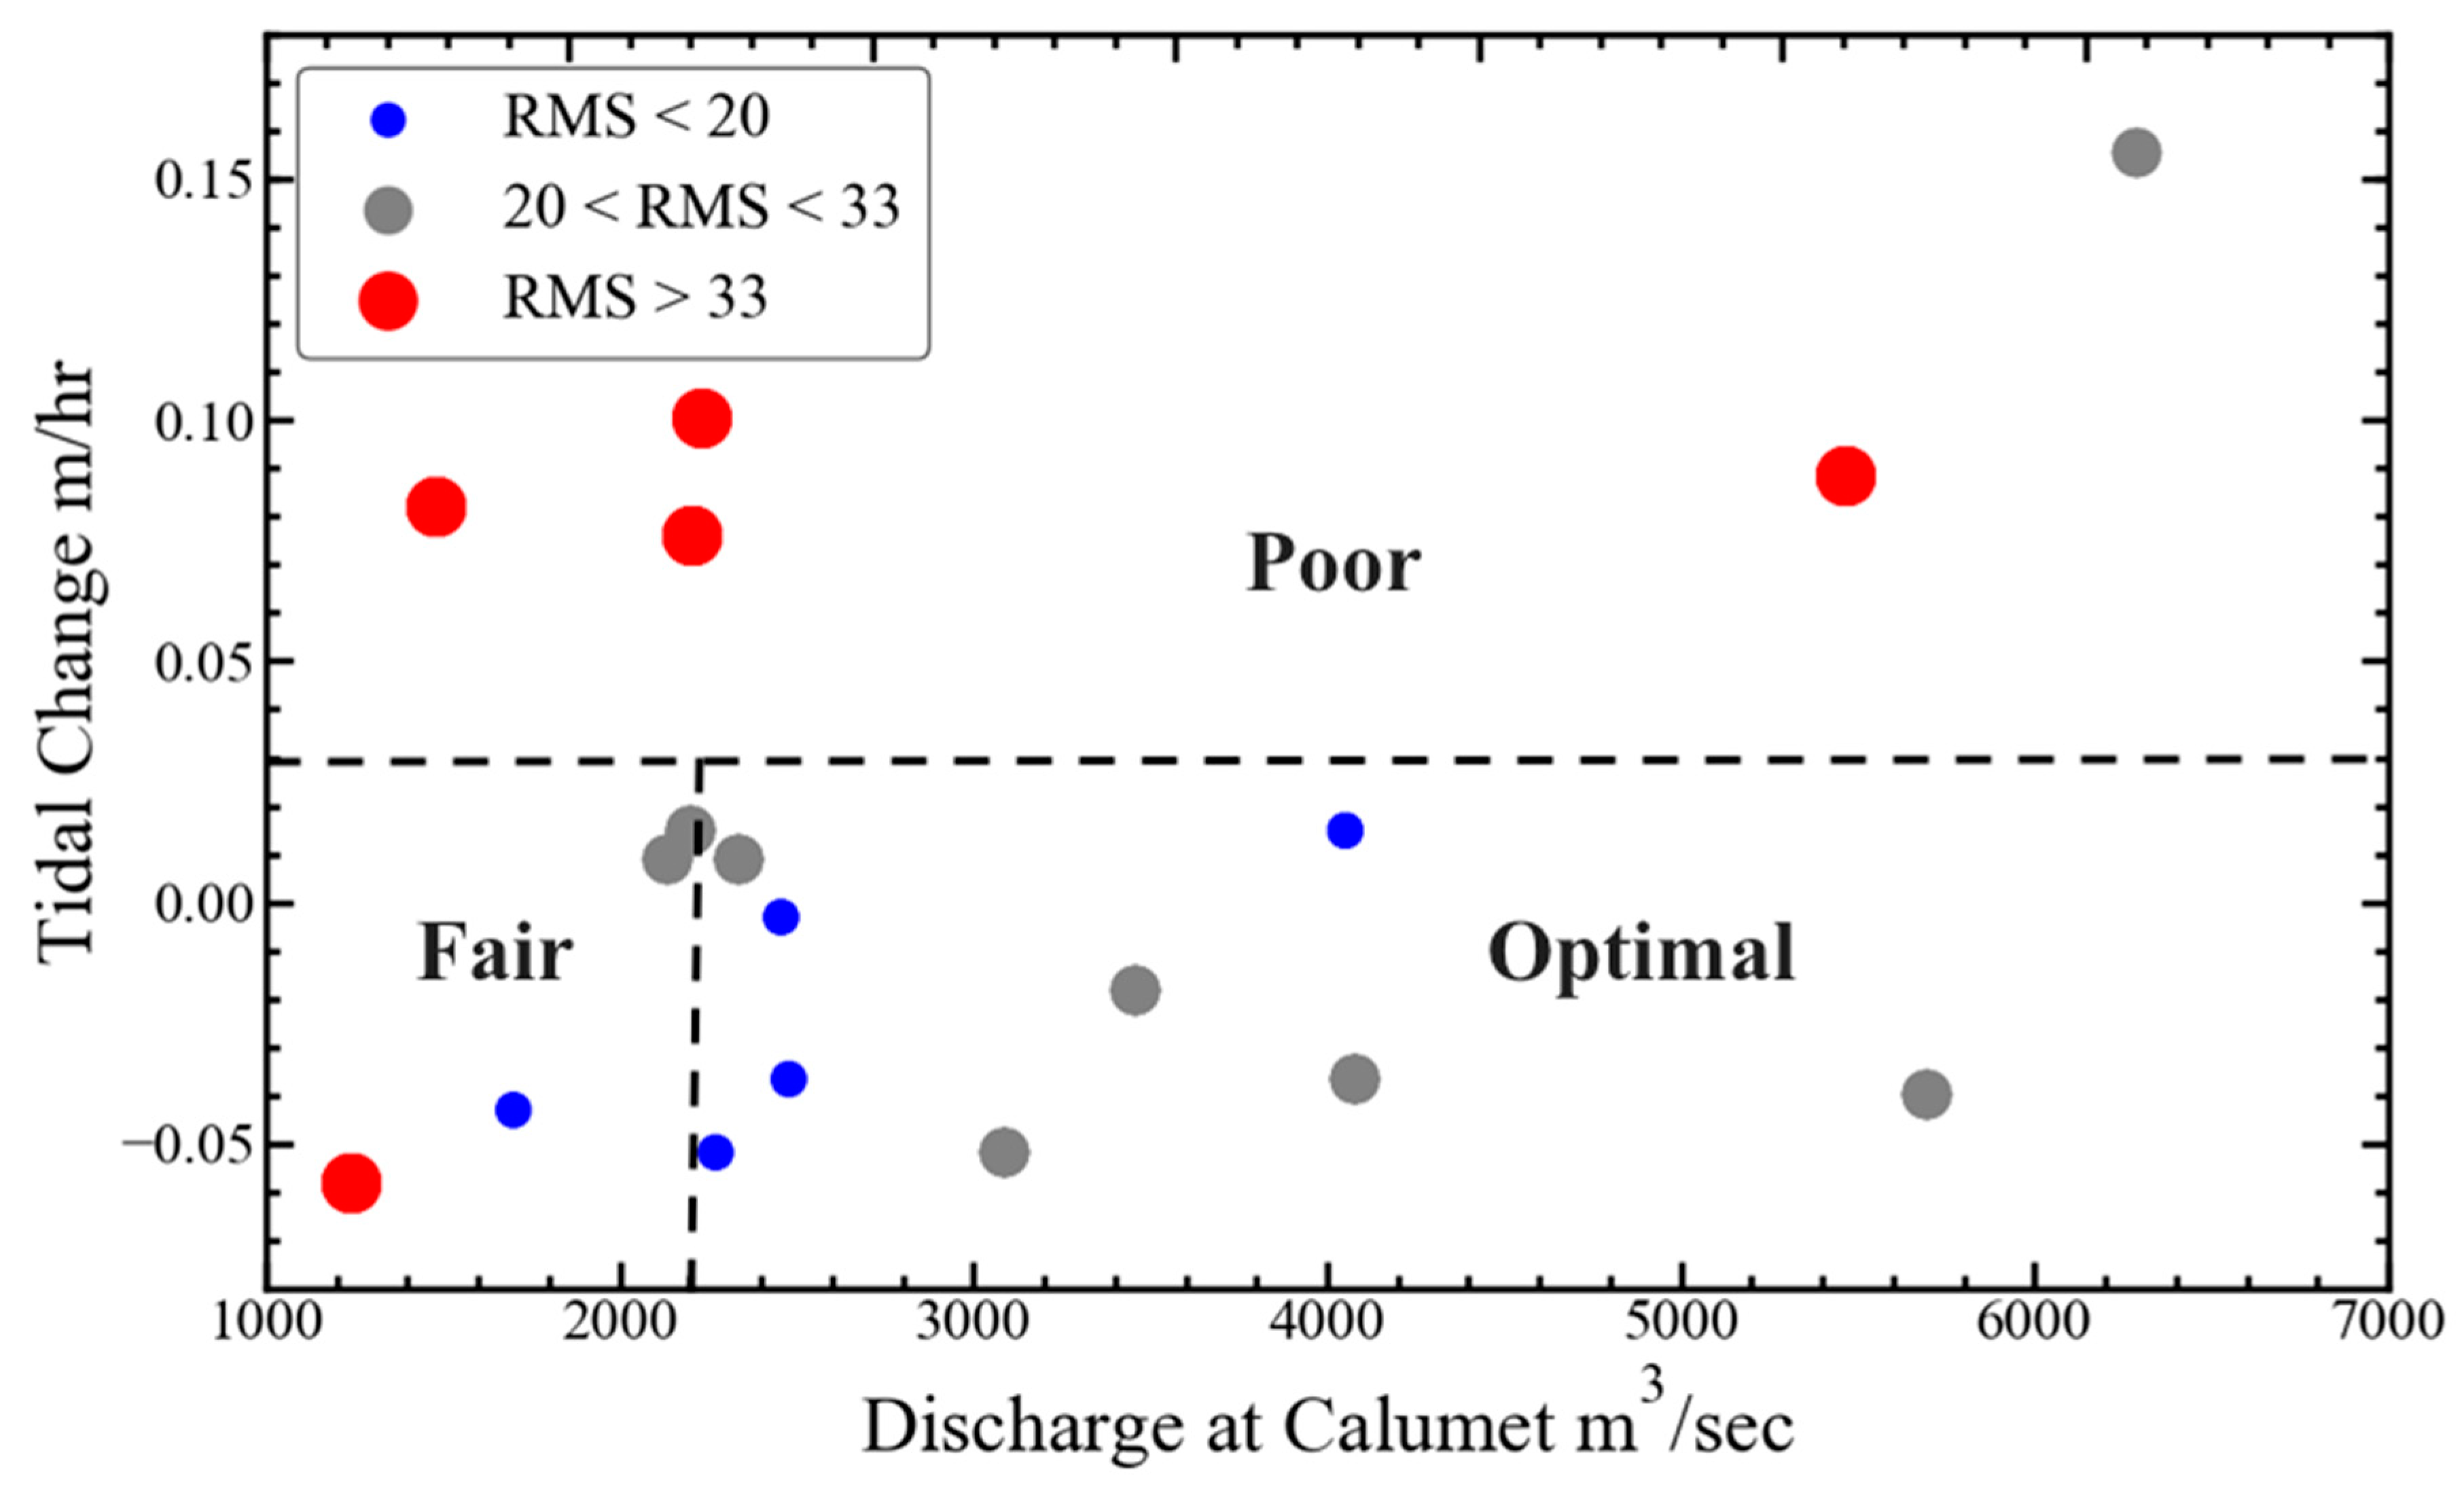
The combination of tidal and discharge conditions compared to the RMSE of an image is shown in Figure 5. For conditions with discharge >2400 m3/s and tidal change <0.03 m/hr, the RMSE difference was 22.79°. These ideal hydraulic conditions provide a 44.8% improvement in measuring the inherent variability of the system compared to indiscriminate measurements.
The ADCP stationary data support the assumption of a steady depth-averaged flow direction. The standard deviation of the direction of flow through the water column ranged from 0.6 to 5.8°. This result indicates that the depth-average flow direction was reliably represented by the water surface flow direction.
As streaklines are a water surface feature, it is also reasonable to ask whether winds can deflect the streakline flow direction from the depth averaged flow direction (violating assumption 2). A comparison of the wind direction to the streakline direction showed no clear relationship (Figure 6). The data show that even under conditions where the wind direction was perpendicular to the streakline direction and of a significant wind speed, the streakline direction was not systematically influenced.
4. Discussion
The results indicate that the precision of the biofilm streaklines as flow tracers is dependent on the combination of three environmental conditions, namely: proximity to the channel network, the tidal cycle, and the incoming discharge. Discrepancies between streakline and in-situ measurements appear to be related primarily to unsteady flows on the delta front, suggesting that assumption 1 does not always hold. The variations between flow direction at the water surface and at the bed appeared to be minimal, suggesting that assumption 2 is sound.
The results from the TCMs located distally demonstrated an accuracy that was significantly dependent on the conditions of discharge and tidal change. Figure 7b shows the amount of variability found at the distally located locations during conditions of sufficient flow and falling tides. Considering that the variation of flow in time is 58.7°, streaklines provide no mapping value during significantly rising tides, but provide strong measurements (44% of measurement variation) during falling tides. Under conditions of low river discharge and rapidly rising tide, TCMs registered wide swings in the flow direction (Figure 7d). Under these conditions, the biofilms that had traveled off the delta as well-behaved streaklines apparently traveled back towards the delta, giving a false impression of flow direction.
The results from the proximal locations demonstrated an accuracy with a lesser dependence on the discharge and tidal change. While the variabilities in the discharge and tidal change produced a large range of directions at these locations (Figure 7), and the streaklines remained in good agreement with the measured direction of the current (Figure 3). It is valuable that the streaklines have an increased accuracy close to the channel network. The morphology of the channel network boundary exerts an important control on the delta evolution [9,12]. The results of this study show that streaklines are a legitimate means of validating flow patterns in this location, where streaklines have been previously used [21,22]. This is likely due to the importance of the subaqueous channel network boundary in setting the delta front flow patterns [12]. Spatial trends in accuracy can also be attributed to the scale of the travel time for a parcel of water through the system, relative to the temporal scale of the tidal influence. Both the incoming discharge and the route set the velocity of flow, and therefore the travel time. When the rate of tidal change is greater than the travel time, the streaklines become disassociated from the flow, causing differences between the tracer and the water flow direction. As the flow travels downstream into the receiving basin, the average velocity decreases [15,21,24]. Therefore, the TCMs located proximally had a higher average velocity with less deviation than the TCMs located distally.
Previous studies, which utilized streaklines, either had significant assumptions or were validated numerically. The direct comparison between the streakline-derived flow fields and the concurrent in situ flow direction measurements in this study provides a new level of validation for this technique. The results also imply that streakline derived flow fields could be used for calibration orvalidation of hydraulic models.
Current numerical hydraulic models require a large set of data regarding boundary conditions, as well as extensive validation, in order to be accurate. While some measurements are easily acquired, a number are quite difficult. The strength of the method investigated in this study is that with relatively little data, a reasonable approximation of the flow field can be constructed for analysis. All that is required is remote sensing imagery and a basic knowledge of discharge and tides.
Through the use of image recognition, the processes could theoretically be automated. While we put some effort into such a recognition algorithm, the variable expression of streaklines and sea states made such an algorithm difficult. However, such a process would drastically reduce the time required for this technique and potentially reduce the differences with in situ measurements described here. An accurate and quick method for use in isolated areas, where data is limited, would be greatly beneficial to future river delta remote sensing efforts. The results of this study demonstrate that streaklines provide a tool that is complimentary to other remote sensing techniques. Flow direction could also be determined from the gradient of the water surface elevations, which can be measured by lidar or other altimetry platforms (Jason, Envisat, SWOT; [25,26,27]). However, the reached averaged water surface slopes on the WLD are typically much less than 1 × 10⁻⁴, and the in-situ data show that directions (and therefore gradients) are highly variable at scales <1 km. It is our understanding that water surface mapping at this precision and scale remains difficult with altimetry platforms. Hence, streakline-derived flow directions with their corresponding uncertainties may significantly augment current and future remote sensing analyses of river deltas.
Recommendations for use on other deltas: Streaklines have been identified on a growing number of river deltas world-wide [22]. The results presented here suggest that the combined conditions of sufficient water export and proximal location should be met for using streaklines to estimate the flow direction so as to minimize unsteady flows. On the Wax Lake Delta, the threshold for water discharge (>2400 m3/s) was satisfied 55% of the days between 1996 and 2019. The threshold for tidal change (<0.03 m/hr) was satisfied 75% of the time at the Amerada Gauge during the study period. Assuming these variables to be independent, this suggests that streakline-based techniques are valid ~40% of the time on the WLD, and that selection as a function of sparse tidal or discharge information could conceivably eliminate the nonconductive hydraulic conditions, particularly for proximal sites, for example, those within a channel network’s convex hull. While the hydrodynamics of anomalous hydrologic events with significant water import (for example, storm surge) would never be accurately characterized, it is fortunate that the conditions of significant delta construction are well characterized by streaklines, and that this method could be a valuable monitoring technique for many applications seeking a greater understanding of delta front flow patterns.
5. Conclusions
The use of remotely sensed biofilm streaklines as synoptic tracers of flow direction in deltaic settings was empirically validated. Tidal change, river discharge, and location were shown to be key factors affecting the accuracy of streakline-derived flow fields. Wind direction and strength were found to have a minimal impact. Importantly, it was shown that streakline derived flow fields were accurate during conditions that are geomorphologically important (e.g., erosion and deposition from floods and falling tides). This study shows that when used properly, streakline derived flow fields can characterize the spatiotemporal variability of the flow into the receiving basin, and potentially validate hydraulic models. This tool has great potential for use on the many large or remote deltas possessing streaklines, where instrumental data is limited but remote sensing imagery is available.
Supplementary Materials
The data used in this study and streakline maps are available in a Figshare repository: https://doi.org/10.6084/m9.figshare.10314245.v1.
Author Contributions
Field work was done by all of the authors, but led by M.A. Data reduction analysis was done by all of the authors, with primary contributions by C.C. and M.A. The writing was done with roughly equal contributions from C.C. and J.B.S. All authors have read and agreed to the published version of the manuscript.
Funding
This work was supported by a U.S. Department of Energy grant to J.S. (DESC0016163).
Conflicts of Interest
The authors declare no conflict of interest.
References
- Tessler, Z.D.; Vörösmarty, C.J.; Grossberg, M.; Gladkova, I.; Aizenman, H.; Syvitski, J.P.M.; Foufoula-Georgiou, E. Profiling risk and sustainability in coastal deltas of the world. Science 2015, 349, 638. [Google Scholar] [CrossRef] [PubMed] [Green Version]
- Edmonds, D.A.; Paola, C.; Hoyal, D.C.J.D.; Sheets, B.A. Quantitative metrics that describe river deltas and their channel networks. J. Geophys. Res. 2011, 116. [Google Scholar] [CrossRef]
- Ericson, J.; Vorosmarty, C.; Dingman, S.; Ward, L.; Meybeck, M. Effective sea-level rise and deltas: Causes of change and human dimension implications. Glob. Planet. Chang. 2006, 50, 63–82. [Google Scholar] [CrossRef]
- Foufoula-Georgiou, E.; Syvitski, J.; Paola, C.; Hoanh, C.T.; Tuong, P.; Vörösmarty, C.; Kremer, H.; Brondizio, E.; Saito, Y.; Twilley, R. International Year of Deltas 2013: A proposal. EOS Trans. Am. Geophys. Union 2011, 92, 340–341. [Google Scholar] [CrossRef] [Green Version]
- Eidam, E.F.; Nittrouer, C.A.; Ogston, A.S.; DeMaster, D.J.; Liu, J.P.; Nguyen, T.T.; Nguyen, T.N. Dynamic controls on shallow clinoform geometry: Mekong Delta, Vietnam. Cont. Shelf Res. 2017, 147, 165–181. [Google Scholar] [CrossRef]
- Hale, R.; Bain, R.; Goodbred, S., Jr.; Best, J. Observations and scaling of tidal mass transport across the lower Ganges–Brahmaputra delta plain: Implications for delta management and sustainability. Earth Surf. Dyn. 2019, 7, 231–245. [Google Scholar] [CrossRef] [Green Version]
- Walker, N.D.; Hammack, A.B. Impacts of Winter Storms on Circulation and Sediment Transport: Atchafalaya-Vermilion Bay Region, Louisiana, U.S.A. J. Coast. Res. 2000, 16, 996–1010. [Google Scholar]
- Bates, C.C. Rational Theory of Delta Formation. AAPG Bull. 1953, 37, 2119–2162. [Google Scholar] [CrossRef]
- Coffey, T.S.; Shaw, J.B. Congruent Bifurcation Angles in River Delta and Tributary Channel Networks: Congruent Bifurcation Angles. Geophys. Res. Lett. 2017, 44, 11427–11436. [Google Scholar] [CrossRef]
- Fagherazzi, S.; Edmonds, D.A.; Nardin, W.; Leonardi, N.; Canestrelli, A.; Falcini, F.; Jerolmack, D.J.; Mariotti, G.; Rowland, J.C.; Slingerland, R.L. Dynamics of river mouth deposits. Rev. Geophys. 2015, 53, 642–672. [Google Scholar] [CrossRef] [Green Version]
- Geleynse, N.; Storms, J.E.A.; Stive, M.J.F.; Jagers, H.R.A.; Walstra, D.J.R. Modeling of a mixed-load fluvio-deltaic system. Geophys. Res. Lett. 2010, 37. [Google Scholar] [CrossRef] [Green Version]
- Ke, W.-T.; Shaw, J.B.; Mahon, R.C.; Cathcart, C.A. Distributary Channel Networks as Moving Boundaries: Causes and Morphodynamic Effects. JGR Earth Surf. 2019, 124, 1878–1898. [Google Scholar] [CrossRef]
- Meselhe, E.A.; Sotiropoulos, F. Three-dimensional numerical model for open-ehannels with free-surfaee variations. J. Hydraul. Res. 2000, 38, 115–121. [Google Scholar] [CrossRef]
- Socolofsky, S.A.; Jirka, G.H. Large-scale flow structures and stability in shallow flows. J. Environ. Eng. Sci. 2004, 3, 451–462. [Google Scholar] [CrossRef]
- Wright, L.D. Sediment transport and deposition at river mouths: A synthesis. Geol. Soc. Am. Bull. 1977, 88, 857. [Google Scholar] [CrossRef]
- Xing, F.; Meselhe, E.A.; Allison, M.A.; Weathers, H.D. Analysis and numerical modeling of the flow and sand dynamics in the lower Song Hau channel, Mekong Delta. Cont. Shelf Res. 2017, 147, 62–77. [Google Scholar] [CrossRef]
- Alpers, W.; Hühnerfuss, H. The damping of ocean waves by surface films: A new look at an old problem. J. Geophys. Res. Oceans 1989, 94, 6251–6265. [Google Scholar] [CrossRef]
- Espedal, H.A.; Johannessen, O.M.; Knulst, J. Satellite detection of natural films on the ocean surface. Geophys. Res. Lett. 1996, 23, 3151–3154. [Google Scholar] [CrossRef] [Green Version]
- Heinrich, H.; Arne, G.; Werner, A.; Reinhard, T.; Volkmar, W.; Lange, P.A. Classification of sea slicks by multifrequency radar techniques: New chemical insights and their geophysical implications. J. Geophys. Res. Oceans 2012, 99, 9835–9845. [Google Scholar] [CrossRef]
- Seppke, B.; Gade, M.; Dreschler-Fischer, L. From Multi-Sensor Tracking of Sea Surface Films to Mesoscale and Sub-Mesoscale Sea Surface Current Fields. In Proceedings of the Remote Sensing of the Ocean, Sea Ice, Coastal Waters, and Large Water Regions 2013, Dresden, Germany, 23–26 September 2013; Volume 8888. [Google Scholar] [CrossRef]
- Shaw, J.B.; Mohrig, D.; Wagner, R.W. Flow patterns and morphology of a prograding river delta. J. Geophys. Res. Earth Surf. 2016, 121, 372–391. [Google Scholar] [CrossRef]
- Shaw, J.B.; Estep, J.D.; Whaling, A.R.; Sanks, K.M.; Edmonds, D.A. Measuring subaqueous progradation of the Wax Lake Delta with a model of flow direction divergence. Earth Surf. Dyn. 2018, 6, 1155–1168. [Google Scholar] [CrossRef] [Green Version]
- Shaw, J.B.; Ayoub, F.; Jones, C.E.; Lamb, M.P.; Holt, B.; Wagner, R.W.; Coffey, T.S.; Chadwick, J.A.; Mohrig, D. Airborne radar imaging of subaqueous channel evolution in Wax Lake Delta, Louisiana, USA. Geophys. Res. Lett. 2016, 43, 5035–5042. [Google Scholar] [CrossRef] [Green Version]
- Hiatt, M.; Passalacqua, P. Hydrological connectivity in river deltas: The first-order importance of channel-island exchange. Water Resour. Res. 2015, 51, 2264–2282. [Google Scholar] [CrossRef] [Green Version]
- Ayoub, F.; Jones, C.E.; Lamb, M.P.; Holt, B.; Shaw, J.B.; Mohrig, D.; Wagner, W. Inferring surface currents within submerged, vegetated deltaic islands and wetlands from multi-pass airborne SAR. Remote Sens. Environ. 2018, 212, 148–160. [Google Scholar] [CrossRef]
- Pham, H.T.; Marshall, L.; Johnson, F.; Sharma, A. Deriving daily water levels from satellite altimetry and land surface temperature for sparsely gauged catchments: A case study for the Mekong River. Remote Sens. Environ. 2018, 212, 31–46. [Google Scholar] [CrossRef]
- Huang, Q.; Long, D.; Du, M.; Zeng, C.; Li, X.; Hou, A.; Hong, Y. An improved approach to monitoring Brahmaputra River water levels using retracked altimetry data. Remote Sens. Environ. 2018, 211, 112–128. [Google Scholar] [CrossRef]
Figure 1.
(a) An image showing the tilt current meter (TCM) locations on the Wax Lake Delta (WLD), with the dashed line representing the divide between the proximal and distal stations. It is composed of a Sentinel 2 image acquired 22 March 2017, with an overlay of a DEM from Shaw et al., 2016 [23]. (b) A map of the United States highlighting the location of Louisiana. (c) A map of Louisiana showing the major rivers and the location of the WLD. (d) A Sentinel 2 Band 8 (0.83 µm) image acquired 22 March 2017, showing streakline-derived flow field (white lines) and flow direction from mapped streaklines (black arrows) compared to in situ flow direction measurements of the flow direction (white arrows). (e) A Sentinel 2 Band 8 (0.83 µm) image acquired 10 June 2017 showing streakline-derived flow field (white lines), and flow direction from mapped streaklines (black arrows) compared to in situ flow direction measurements of flow direction (white arrows), with the dashed line representing the divide between the proximal and distal stations.

Figure 2.
In situ measured flow directions for (a) 10 June 2017 (n = 9); (b) 23 October 2017 (n = 9); (c) T29 (n = 19); (d) T23 (n = 19).
Figure 2.
In situ measured flow directions for (a) 10 June 2017 (n = 9); (b) 23 October 2017 (n = 9); (c) T29 (n = 19); (d) T23 (n = 19).

Figure 3.
The difference between the directly measured and streakline mapped flow direction as a function of the TCM location, with proximal and distal distinguished by marker shape.
Figure 3.
The difference between the directly measured and streakline mapped flow direction as a function of the TCM location, with proximal and distal distinguished by marker shape.

Figure 4.
(a) Comparison of the tidal change and the amount and orientation of difference in the streakline mapped flow direction. The solid black line denotes the threshold condition of a tide rising 0.03 m/hr. (b) Comparison of the discharge at Calumet and the amount and orientation of difference in streakline mapped flow direction. The solid black line denotes the threshold condition of discharge of 2400 m3/s.

Figure 5.
Comparison of the scale of root mean square error (RMSE; as shown by marker size and color) as a function of tidal change and discharge. Dashed lines correspond to the thresholds in Figure 4.
Figure 5.
Comparison of the scale of root mean square error (RMSE; as shown by marker size and color) as a function of tidal change and discharge. Dashed lines correspond to the thresholds in Figure 4.

Figure 6.
Comparison of the difference between the in situ flow direction measurements and streakline derived direction and wind direction in relation to the streakline direction.
Figure 6.
Comparison of the difference between the in situ flow direction measurements and streakline derived direction and wind direction in relation to the streakline direction.

Figure 7.
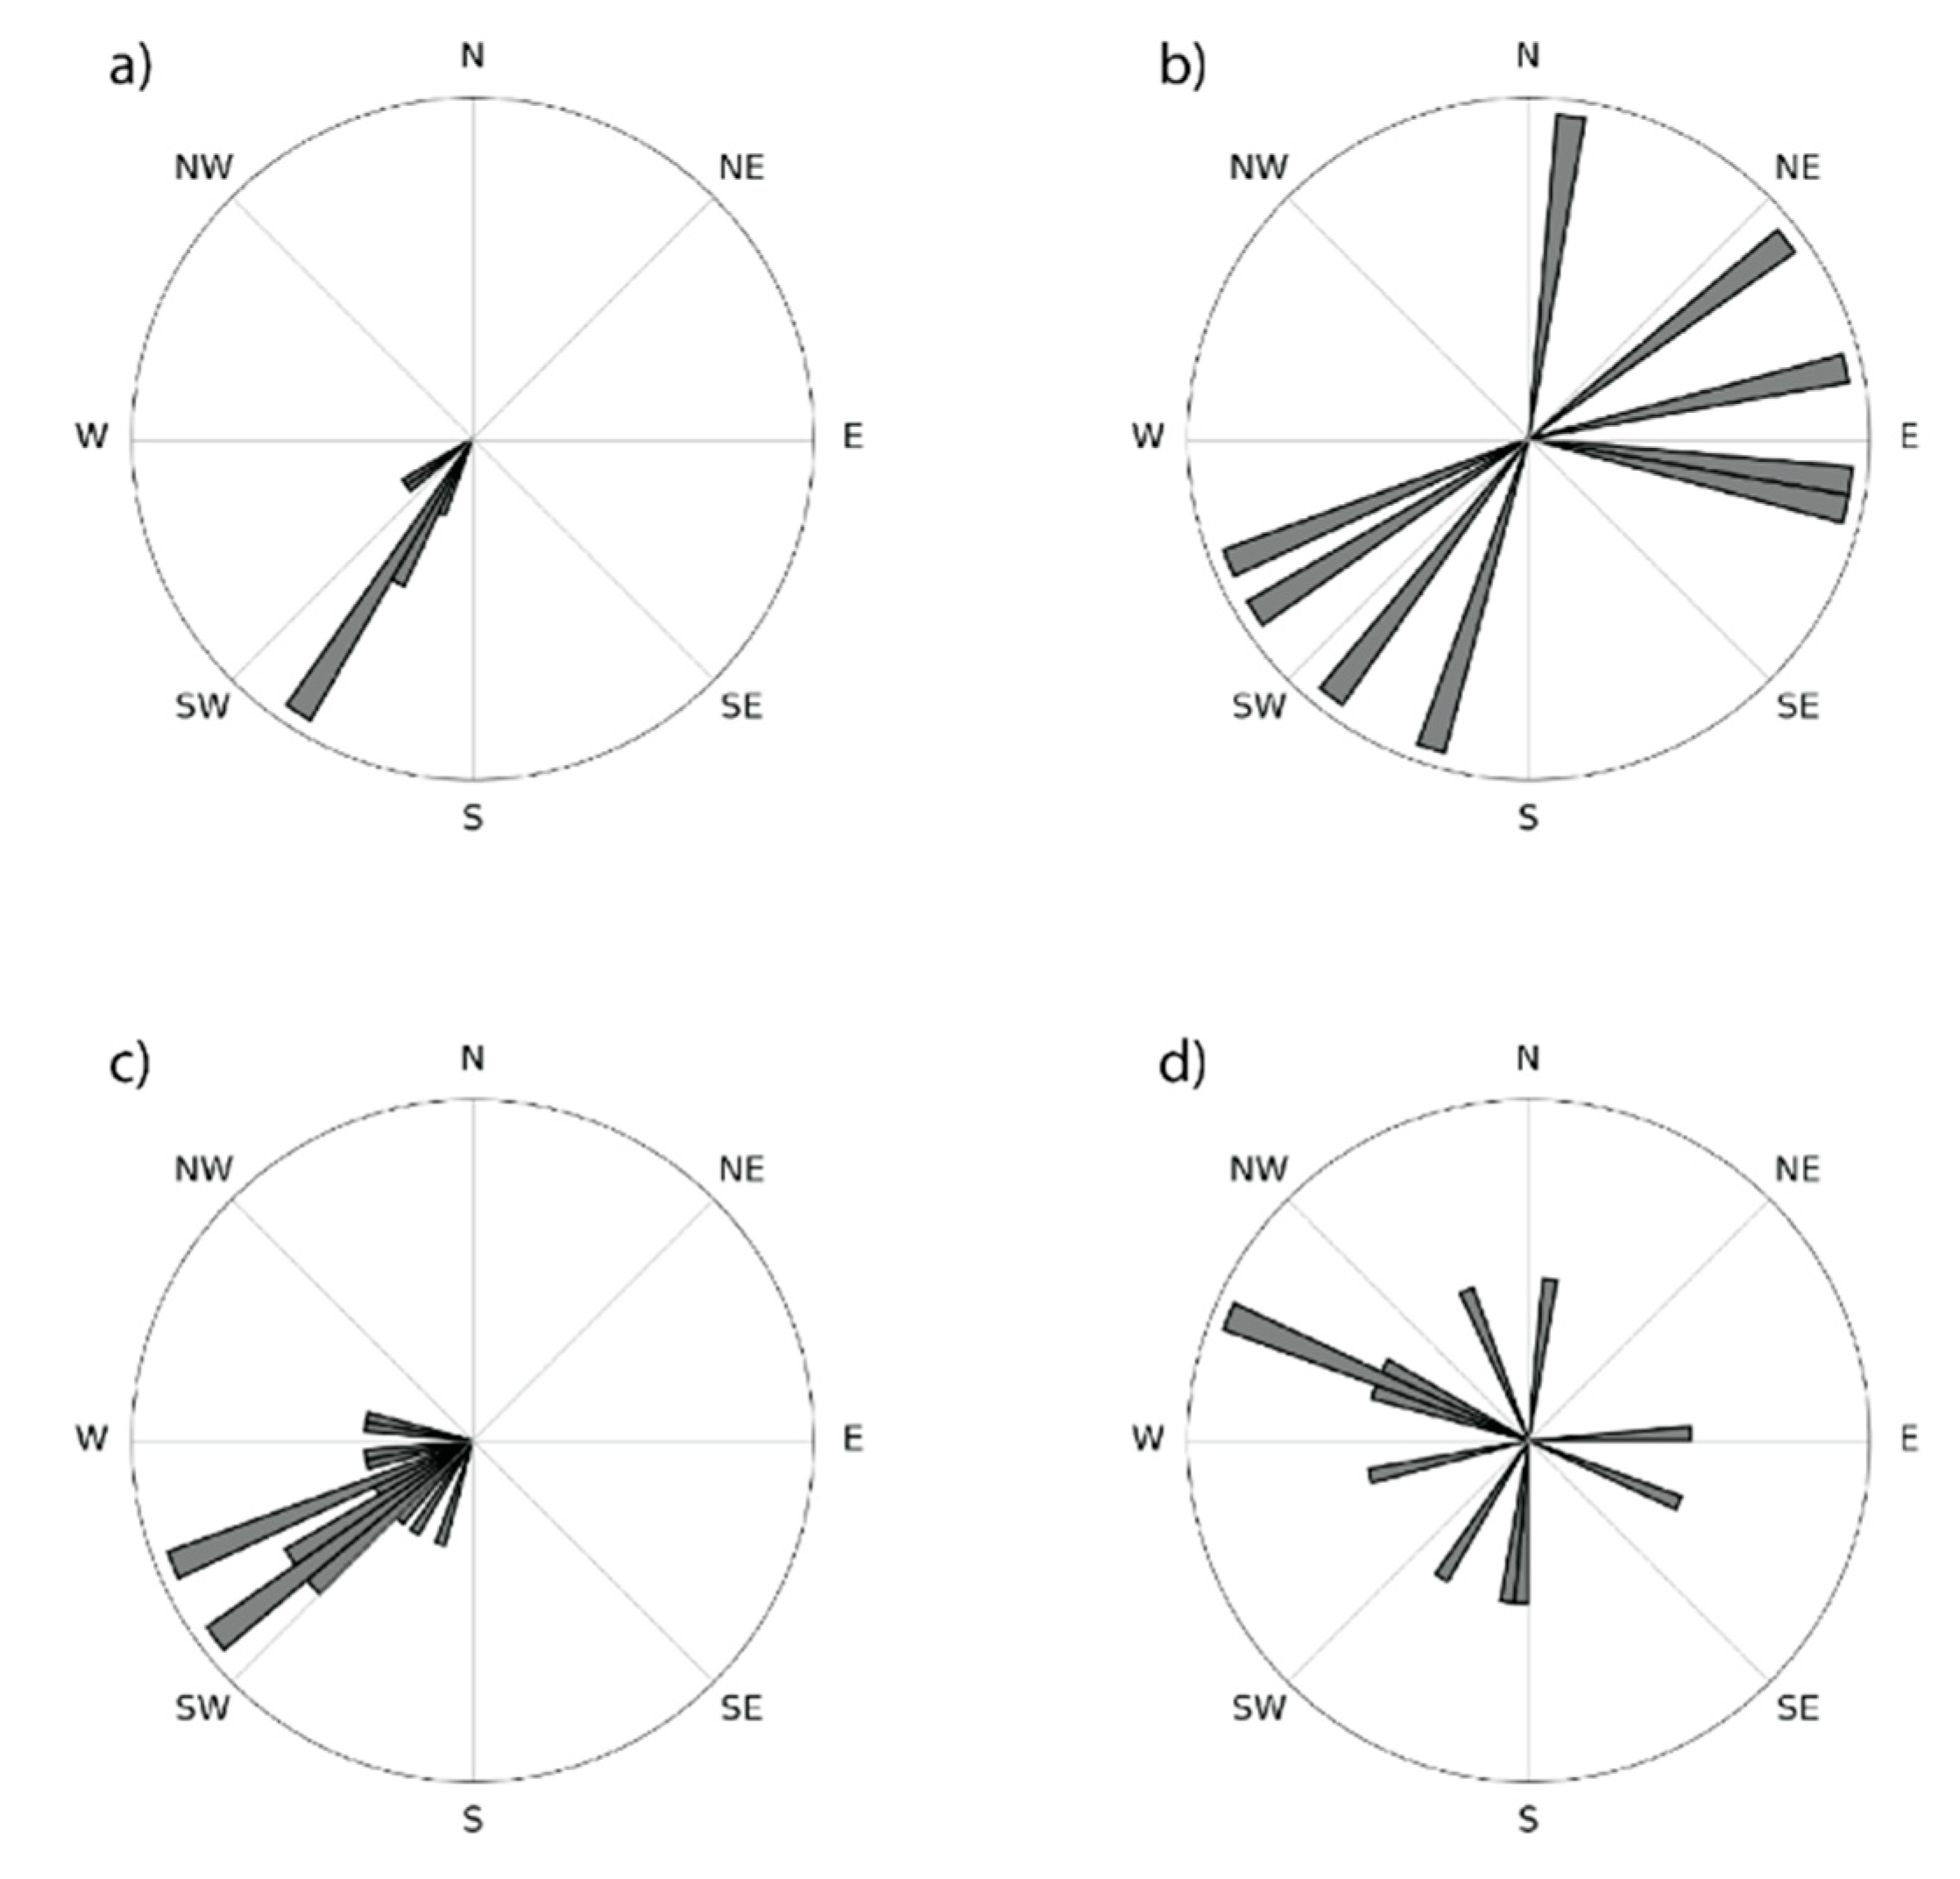
In situ measured flow directions for conditions with discharge >2400 m3/s and tidal change <0.03 m/hr (a) proximally (n = 29) and (b) distally (n = 17). In situ measured flow directions for conditions with discharge <2400 m3/s and tidal change >0.03 m/hr (c) proximally (n = 28) (d) distally (n = 21).
Figure 7.
In situ measured flow directions for conditions with discharge >2400 m3/s and tidal change <0.03 m/hr (a) proximally (n = 29) and (b) distally (n = 17). In situ measured flow directions for conditions with discharge <2400 m3/s and tidal change >0.03 m/hr (c) proximally (n = 28) (d) distally (n = 21).

© 2020 by the authors. Licensee MDPI, Basel, Switzerland. This article is an open access article distributed under the terms and conditions of the Creative Commons Attribution (CC BY) license (http://creativecommons.org/licenses/by/4.0/).
Share and Cite
MDPI and ACS Style
Cathcart, C.; Shaw, J.B.; Amos, M. Validation of Streaklines as Recorders of Synoptic Flow Direction in a Deltaic Setting. Remote Sens. 2020, 12, 148. https://doi.org/10.3390/rs12010148
AMA Style
Cathcart C, Shaw JB, Amos M. Validation of Streaklines as Recorders of Synoptic Flow Direction in a Deltaic Setting. Remote Sensing. 2020; 12(1):148. https://doi.org/10.3390/rs12010148
Chicago/Turabian StyleCathcart, Christopher, John B. Shaw, and Micheal Amos. 2020. "Validation of Streaklines as Recorders of Synoptic Flow Direction in a Deltaic Setting" Remote Sensing 12, no. 1: 148. https://doi.org/10.3390/rs12010148
Note that from the first issue of 2016, this journal uses article numbers instead of page numbers. See further details here.