The Impact of Non-Photosynthetic Vegetation on LAI Estimation by NDVI in Mixed Grassland


1
Department of Ecology, Nanjing Forestry University, Nanjing 210037, China
2
Department of Geography and Planning, University of Saskatchewan, 117 Science Place, Saskatoon, SK S7N5C8, Canada
*
Author to whom correspondence should be addressed.
Remote Sens. 2020, 12(12), 1979; https://doi.org/10.3390/rs12121979
Submission received: 28 May 2020
/
Revised: 16 June 2020
/
Accepted: 17 June 2020
/
Published: 19 June 2020
(This article belongs to the Special Issue Remote Sensing of Crop Residue and Non-photosynthetic Vegetation)
Abstract
:Leaf area index (LAI) is widely used for algorithms and modelling in the field of ecology and land surface processes. At a global scale, normalized difference vegetation index (NDVI) products generated by different remote sensing satellites, have provided more than 40 years of time series data for LAI estimation. NDVI saturation issues are reported in agriculture and forest ecosystems at high LAI values, creating a challenge when using NDVI to estimate LAI. However, NDVI saturation is not reported on LAI estimation in grasslands. Previous research implies that non-photosynthetic vegetation (NPV) reduces the accuracy of LAI estimation from NDVI and other vegetation indices. A question arises: is the absence of NDVI saturation in grasslands a result of low LAI value, or is it caused by NPV? This study aims to explore whether there is an NDVI saturation issue in mixed grassland, and how NPV may influence LAI estimation by NDVI. In addition, in-situ measured plant area index (PAI) by sensors that detect light interception through the vegetation canopy (e.g., Li-cor LAI-2000), the most widely used field LAI collection method, might create bias in LAI estimation or validation using NDVI. Thus, this study also aims to quantify the contribution of green vegetation (GV) and NPV on in-situ measured PAI. The results indicate that NDVI saturation (using the portion of NDVI only contributed by GV) exists in grassland at high LAI (LAI threshold is much lower than that reported for other ecosystems in the literature), and that the presence of NPV can override the saturation effects of NDVI used to estimate green LAI. The results also show that GV and NPV in mixed grassland explain, respectively, the 60.33% and 39.67% variation of in-situ measured PAI by LAI-2000.

1. Introduction
Leaf area index (LAI, see an acronym index in Table A1 from Appendix A) is defined as one-half of the total photosynthetic leaf area (i.e., one-sided live green leaves in the canopy) per ground surface unit in the horizontal direction [1,2]. LAI, an important biophysical parameter which characterizes the canopy structure of terrain surface vegetation [3,4], not only directly influences photosynthetic efficiency by determining light interception [5], but also regulates carbon cycling [6], nutrient cycling [2], evapotranspiration [7] and energy exchange [5] in the atmosphere–biomes interface.
Normalized difference vegetation index (NDVI), which is widely used in ecological and environmental research [8], have been provided as remote sensing products for over forty years on a global scale [9,10,11]. Globally, LAI is mostly estimated by these NDVI products for algorithms and modelling in ecology [1], agriculture [12,13,14], biogeochemistry [15], climate change [16,17], and land surface process research [18]. Therefore, understanding the performance of NDVI on LAI estimation within different terrain ecosystems, plays an important role in LAI applied ecological research across the globe. However, plenty of literatures prove that NDVI has saturation issues when estimating high LAI [19,20,21,22]. Based on previous research, NDVI has saturation issues when LAI exceeds 4, and LAI threshold is even higher for temperate and tropical forest ecosystems [23]. The performance of LAI estimation by NDVI also varies with seasonal changes (i.e., the relationship between NDVI and LAI is poor during the season of maximum LAI), because of the NDVI saturation issue [24]. The NDVI saturation issue was mostly reported in agricultural studies [25] and the NDVI saturation threshold of LAI varies with different corps [26]. Researchers have developed various new indices to overcome the saturation issue of NDVI, or to increase the saturation threshold of LAI in croplands [27,28,29]. However, the NDVI saturation issue was seldom reported in grasslands [30]. Previous research indicates that large amounts of non-photosynthetic vegetation (NPV), reduce the accuracy for LAI estimation based on the vegetation indices extracted from optical satellite imagery, because a dead component accounts for a high portion of variations in NDVI [31,32]. In general, NDVI (either from satellite imagery or in-situ measured hyper-spectrum) used in the empirical model for LAI estimation in mixed grasslands, is mixed NDVI (“mixed NDVI” in the following context refers to this type of NDVI), containing the information of green vegetation (GV), NPV, soil crust and bare soil [8]. Therefore, the question arises: is the absence of the NDVI saturation issue really due to a relatively low LAI value in grassland compared to other ecosystems, or is it caused by NPV? The answer remains unknown. Therefore, this study aims to explore whether there is an NDVI saturation issue in mixed grassland, and to evaluate the impact of NPV on LAI estimation, using NDVI.
Another factor which may account for the reduced accuracy of LAI estimation by NDVI, is the in-situ measurement of LAI. Field measurements of LAI are destructive sampling (direct method) [12], plant canopy devices (indirect method; e.g., Li-cor LAI-2000 plant canopy analyzer, Li-cor LAI-2200 plant canopy analyzer, Accupar LP-80 Decagon Devices) [2,33,34], and hemispherical photography (indirect method) [35]. Among these three methods, plant canopy devices which capture the light or radiation intercepted by the vegetation canopy are most commonly used due to their convenience and the consistent data they provide. However, this method captures information not only from the green leaves, but also from the stems and dead leaves in the canopy. Thus, the data measured by this method are usually referred to as plant area index (PAI), which is defined as the projected area of all of the vegetation parts in the canopy, including standing dead materials—i.e., NPV includes the standing dead materials of the canopy and the litter-covered ground surface [36]. In conserved, mixed grassland containing up to 40% standing dead materials, particularly uncertain and inaccurate LAI measurements arise when using plant canopy analyzer devices. Therefore, it is crucial to evaluate to what extent the portion of NPV contributes to PAI (this portion referring to non-photosynthetic matter area index (NPVAI) in the following context), measured by plant canopy devices (e.g., LAI-2000). The specific objectives of this research are to: (1) explain the relationship between mixed NDVI, green NDVI (defined as NDVI contributed by green vegetation only), dead NDVI (defined as NDVI contributed by NPV only) and PAI, green LAI (refers to leaf area only for green vegetation which is actually LAI in general context), and NPVAI separately; and (2) quantify the contribution of GV and standing dead materials on the in-situ measurement of PAI by LAI-2000.
2. Methods
2.1. Study Area
The study area is the West Block of Grasslands National Park (GNP, central coordinate: 49° N, 107° W; area: approximately 521 km2), located in southern Saskatchewan, Canada (Figure 1a). GNP, with a 3.4 °C annual mean temperature and 340 mm annual accumulated precipitation, is characterized as a semi-arid mixed grassland ecosystem [8]. The three main grassland vegetation types are upland, sloped and valley grassland, as well as some herbaceous disturbed communities. The upland grassland (Figure 1b) is dominated by needle-and-thread grass (Stipa comata Trin. and Rupr.), western wheatgrass (Agropyron smithii Rydb.) and blue grama grass (Bouteloua gracilis (HBK) Lang. ex Steud.). The valley grassland (Figure 1c) is dominated by western wheatgrass (Agropyron smithii Rydb.) and northern wheatgrass (Agropyron dasystachym), mixed with a high density of shrub species. The sloped grassland (Figure 1d) contains species of both upland and valley grassland; and the invasive species in the disturbed communities (Figure 1e) are smooth brome (Bromus inermis Layss.), crested wheatgrass (Agropyron cristatum) and sweet clover (Melilotus officinalis).
GNP was first designated as a national park in 1984 [37]. Most of the lands in the current park holding region were bought in 1985, and the rest of the park holding area was acquired in 1987, 1990, 1991, 1998, and 2000. As a result of conservation actions (removing all of the larger grazers), large amounts of NPV were accumulated over approximately 30 years, increasing the risk of fire and reducing biodiversity [8]. It also brings with it the challenge of biophysical parameter estimation, via remote sensing technology and LAI field data collection by plant canopy analyzer. Since 2006, Parks Canada has started to combine basin grazing and prescribe fire as grassland restoration methods, to reduce the risk of NPV (fuel load), control invasive species, and preserve native grass communities.
2.2. Data Collection
Fieldwork was conducted from June 20, 2014 until July 2, 2014, during the maximum growing season of the northern semi-arid mixed prairie. Fourteen sites (Figure 1a) were selected based on a stratified random sampling design, with the consideration of different grassland types (Figure 1a) and accessibility, including 4 sites in upland grassland, 5 sites in sloped grassland, 3 sites in valley grassland, and 2 sites in disturbed communities. In each site, two 100 m transects were set perpendicularly crossed with each other in the center, and twenty 50 cm × 50 cm quadrats with 10 m intervals were set up along the transects excluding the cross center (Figure 2), to capture the heterogeneity of the biophysical parameters of each site. In each quadrat, ground cover including grass, forb, shrub, standing dead vegetation, litter, lichen, moss, bare soil, and rock coverage were collected by a visualized estimation (a subjective measurement method for vegetation cover); hyperspectral reflectance was measured by analytical spectral devices (ASD) field-portable FieldSpec® Pro Spectroradiometer (wavelength from 350 nm to 2500 nm), between 10 a.m. and 2 p.m. with a clear sky (i.e., the optimum time period for taking reflectance measurement is within ±2 h of local noon, because the interval between the reflectance measurement is a function of the change rate of the solar elevation angle on a clear day); and LAI data were collected by Li-cor LAI-2000, with one above canopy measurement in a shadow region, and six below canopy measurements within each quadrat.
To test the effects of NPV on LAI estimation from NDVI, and on field measured PAI using LAI-2000, one random quadrat was additionally selected in each (Figure 2) of the 10 sites—3 sites with portions of shrub were excluded, and the hyperspectral data of one site from the distributed community were omitted due to climate effects. In this random quadrat, both PAI and hyperspectral data were recorded before and after the aboveground green vegetation was completely removed in the quadrat (see Table A2 from Appendix B: data collected for each quadrat).
2.3. The Relationship between Green Leaf Area Index (LAI), Photosynthetic Matter Area Index (NPVAI), Plant Area Index (PAI) and Green, Dead, and Mixed Normalized Difference Vegetation Index (NDVI)
In this study, hyperspectral NDVI [38] based on field measured hyperspectral data (Equation (1) were used to test the correlation between PAI, green LAI and NPVAI.
where and mean the reflectance in the wavelength of 800 nm and 670 nm of field measured hyperspectral data.
Mixed NDVI was calculated using the spectra measured by the ASD in each random quadrat before the green grass was removed (Figure 3a,b), and PAI was measured by LAI-2000 in each random quadrat before the green grass was removed (Figure 3b), while NPVAI was measured by LAI-2000 after the green grass was removed in each random quadrat (Figure 3c). Dead NDVI was calculated using the hyper-spectrum measured by the ASD, after the green vegetation was removed in each random quadrat (Figure 3a,c). Green LAI was the difference between PAI and NPVAI, and green NDVI was the difference between mixed NDVI and dead NDVI. Then, the relationships between PAI and mixed NDVI, green LAI and green NDVI, NPVAI and dead NDVI were tested by linear regression or segmented linear regression in R software.
2.4. Impact of NPV on Field Measured LAI by LAI-2000
In this study, the ANOVA table from the linear regression result (using the l m function in the R software version 3.3.1 (R Core Team 2018)), was used to calculate the percentage of explained variation of PAI from GV and NPV (i.e., the following context of NPV only refers to standing dead vegetation instead of litter), separately. In the linear regression model, PAI was included as the response variable, and field measured GV and NPV cover were both included as explanatory variables. To minimize the effects of spatial autocorrelation and high heterogeneity in the mixed prairie, field measured parameters (in this case, GV, NPV and PAI) were averaged by 20 quadrats, excluding the random site (Figure 2) in each site, before linear regression using R software was performed. The column “Sum Sq” in the ANOVA table (one result from linear regression) contains the variation of response variable (PAI) explained by both the green cover and the NPV cover, as well as the unexplained variation of the response variables because of residuals. The summary of the explained by all of the explanatory variables and the unexplained variation, is the total variation of PAI (sum square of the difference from the mean value of PAI). In this study, the percentage of the variation explained by each explanatory variable was calculated (Equations (2) and (3)) [39].
where and mean the percentage of the variation of PAI explained by field measured GV and NPV cover respectively; and are the explained variation of PAI by field measured GV and NPV cover, respectively; is the total variation of PAI, which is .
To emphasize the separate effects of GV and NPV on PAI, the relative effects of field measured GV and NPV cover were calculated (Equations (4) and (5)).
where and are the relative effects of field measured GV and NPV cover on PAI, respectively, if GV and NPV cover both have significant impacts on PAI; and are the percentage of variation of PAI explained by GV and NPV cover, respectively.
The calculated relative effects of GV and NPV cover on PAI were used to calculate the green LAI and NPVAI (Equations (6) and (7)), which represents the LAI for green leaves and LAI for standing dead leaves, respectively. The NPVAI and green LAI measured in the random quadrat of each site (explained in Section 2.3) are used for the accuracy assessment of green LAI and NPVAI, estimated by the method proposed in this section.
where and are the relative effects of GV and NPV cover on PAI; and and mean green LAI and NPVAI, respectively.
3. Results
3.1. The Relationship between Green, Dead, PAI and Green, Dead, Mixed NDVI
The relationship between mixed NDVI and green LAI fits the linear regression without any saturation issue of NDVI estimation (Figure 4a). The relationship between mixed NDVI and PAI is weaker with higher residuals than that with green LAI (Figure 4b), because the relationship between green NDVI and green LAI (Figure 4c) is completely different from the relationship between dead NDVI and NPVAI (Figure 4d). The relationship between green LAI and green NDVI shows the saturation issues of LAI estimation by NDVI (Figure 4c), which means that NDVI has the potential strength to estimate a lower LAI, but is too weak to evaluate a larger value of LAI if there are negligible effects from NPV. When NPVAI exceeds 1.56 in the study area, dead NDVI has a significantly stronger correlation with NPVAI, while NDVI has no correlation with NPVAI when it is less than 1.56 (Figure 4d).
3.2. Contribution of GV and NPV Cover on Field Measured PAI by LAI-2000
3.3. Validation of the Estimated Green LAI and NPVAI
The estimated green LAI and NPVAI based on the relative effects of GV and NPV cover on PAI, measured by the LAI-2000, have a high correlation and similar value to the field measured green LAI and NPVAI, respectively (Figure 5). The estimated green LAI is slightly higher than the green LAI calculated by the PAI minus NPVAI of each random quadrat (overestimation, Figure 5a). The estimated NPVAI is underestimated compared to the field measured NPVAI, when the NPVAI value is high (Figure 5b).
4. Discussion
4.1. The Relationship between NDVI and LAI
The NDVI products derived from remotely sensed imagery refer to mixed NDVI, which contains the information of GV, NPV and soil background including litter, soil crust and bare soil, while the estimated LAI of those NDVI products is assumed to be the green LAI. In a mixed prairie, mixed NDVI has a satisfactory performance on green LAI estimation (Figure 4a), without any saturation issue of NDVI. However, in-situ measured PAI by LAI-2000 is not a good option, as the input parameter or validation for LAI estimation by NDVI (Figure 4b) due to the effects of NPV. Mixed NDVI highly overestimated the green LAI by a linear regression model of NDVI and in-situ measured PAI (Figure 4a,b). Our results imply that large amounts of NPV override the saturation issue of NDVI, when estimating LAI (Figure 4a,c,d). The phenomenon of the segmented linear relationship between NPVAI and dead NDVI is consistent with our previous findings on the relationship between NDVI and dead cover from the same study area [8]. The results also show that NDVI used for ecological applications (LAI estimation in this case), brings errors for spatial variation due to the large amount of NPV (Figure 4d), and brings errors for seasonal and temporal variations because the linear relationship between green NDVI and green LAI is not stable, but changes in a different data range of LAI (Figure 4c).
4.2. Contribution of GV and NPV on In-Situ Measured PAI
The results of this study indicate that LAI-2000 not only captures LAI from GV, but also from NPV in grassland canopy (i.e., standing dead materials). Based on the theory of plant canopy analyzer, field measured PAI is estimated by light or radiation interception through vegetation canopy. Standing dead materials, a main part of vegetation canopy in long-term conserved grasslands, have a high impact on field LAI data collection because NPV also absorbs sunlight in some wavelength ranges. The results of this research prove that GV and NPV cover have some potential to separate the green LAI and NPVAI quantitatively from field-collected PAI by LAI-2000 (Figure 5), and especially to extract green LAI from in-situ measured PAI by LAI-2000, using coverage data (Figure 5a). GV and NPV relatively explained 60.33% and 39.67% of the variation of field measured PAI, respectively (Table 1), in the study area (long-term conserved mixed grasslands) with a dead cover range from 0% to 87% based on the quadrat data, or from 7% to 32% based on the site averaged data. The overestimated green LAI (Figure 5a) indicates that the relative variation of PAI explained by GV is even slightly less than 60.33% in the mixed grassland with a large amount of NPV. The underestimated NPVAI shows that NPV might account for more than 39.67% of the relative variation of field measured PAI (Figure 5b), and the influence of NPV on field measured PAI by LAI-2000 along with the increasing NPVAI (Figure 5b). Even though green LAI and GV cover have a significantly high correlation in grassland regions [12] and other types of ecosystems [40,41], they are different in ecological concept. Our results show that GV and NPV cover only explained 38.85% total variation of the in-situ measured PAI by LAI-2000, which indicates that other ecological parameters (i.e., the overlap of leaves, which is not detected by cover data) contribute to PAI.
5. Conclusions
The main conclusions found in this research are as follows: (1) mixed NDVI (including information from both GV and NPV) has a significant positive relationship with green LAI (R2 = 0.57, P < 0.05), while green NDVI has a logarithmic regression with green LAI (R2 = 0.71, P < 0.05), and dead NDVI has a piecewise linear regression with NPVAI (R2 = 0.81, P < 0.05, breakpoint of NPVAI: 1.56); (2), as the large amounts of NPV in the mixed grassland override the saturation effects of NDVI for green LAI estimation; (3) the GV and NPV of the canopy in the mixed grassland relatively explain 60.33% and 39.67% variation of the PAI measured using LAI-2000, respectively. Our results regarding the relationship between the mixed NDVI and PAI, the mixed NDVI and green LAI, the green NDVI and green LAI, and the dead NDVI and dead LAI, imply that NPV should be put under consideration for research related to LAI estimation, using NDVI products on a regional or global scale, or studies using field measured LAI by plant canopy devices (e.g., Li-cor LAI-2000 plant canopy analyzer) in mixed grasslands characterized by high portions of NPV.
Author Contributions
The contribution for D.X. was to come up with the initial ideas, conduct fieldwork, develop the methodology, analyze the data and write the manuscript. D.A. contributed to the improvement of the methodology. X.G. contributed to guiding the organization on the initial ideas and research direction, and revise the manuscript. All authors have read and agreed to the published version of the manuscript.
Funding
This research was funded by the Natural Sciences and Engineering Research Council (NSERC) of Canada (GRPIN-2016-03960) and the Six Talent Peaks Program of Jiangsu Province (TD-XYDXX-006).
Acknowledgments
The authors would like to acknowledge the field crew for collecting the field data.
Conflicts of Interest
The authors declare no conflict of interest.
Appendix A

Table A1.
An Index Table of Abbreviations.
| Abbreviations | Terms |
|---|---|
| LAI | Leaf Area Index |
| NDVI | Normalized Difference Vegetation Index |
| NPV | Non-Photosynthetic Vegetation |
| NPVAI | Non-Photosynthetic Matter Area Index |
| PAI | Plant Area Index |
| GV | Green Vegetation |
| GNP | Grasslands National Park |
| ASD | Analytical Spectral Devices |
Appendix B
Table A2.
Data Collected in the Random Quadrat in Each Site.
| Community Type | Before Removing Green Vegetation | After Removing Green Vegetation | Dominant Species | ||
|---|---|---|---|---|---|
| NDVIHyper | LAI | NDVIHyper | LAI | ||
| Disturbed community | 0.64 | 4.27 | 0.28 | 1.54 | Smooth brome Crested wheatgrass |
| Sloped grassland | 0.52 | 2.83 | 0.25 | 1.18 | Western wheatgrass Needle-and-thread grass Blue grama grass |
| Sloped grassland | 0.56 | 3.25 | 0.20 | 1.82 | Western wheatgrass Needle-and-thread grass Blue grama grass |
| Sloped grassland | 0.36 | 0.46 | 0.27 | 0.21 | Western wheatgrass |
| Sloped grassland | 0.46 | 1.22 | 0.24 | 0.72 | Western wheatgrass Needle-and-thread grass Blue grama grass |
| Sloped grassland | 0.49 | 2.16 | 0.29 | 0.92 | Needle-and-thread grass Blue grama grass |
| Upland grassland | 0.49 | 2.38 | 0.21 | 1.48 | Needle-and-thread grass Blue grama grass Northern wheatgrass |
| Upland grassland | 0.39 | 3.44 | 0.15 | 2.07 | Western wheatgrass |
| Valley grassland | 0.59 | 4.01 | 0.24 | 1.61 | Western wheatgrass Smooth brown Crested wheatgrass |
| Valley grassland | 0.41 | 3.72 | 0.16 | 2.07 | Western wheatgrass |
References
- Fang, H.L.; Li, W.J.; Myneni, R.B. The impact of potential land cover misclassification on modis leaf area index (LAI) estimation: A statistical perspective. Remote Sens. 2013, 5, 830–844. [Google Scholar] [CrossRef] [Green Version]
- Liu, X.H.; Wang, L. Feasibility of using consumer-grade unmanned aerial vehicles to estimate leaf area index in mangrove forest. Remote Sens. Lett. 2018, 9, 1040–1049. [Google Scholar] [CrossRef]
- Fang, H.L.; Liang, S.L.; Townshend, J.R.; Dickinson, R.E. Spatially and temporally continuous lai data sets based on an integrated filtering method: Examples from North America. Remote Sens. Environ. 2008, 112, 75–93. [Google Scholar] [CrossRef]
- Li, D.; Gu, X.F.; Pang, Y.; Chen, B.W.; Liu, L.X. Estimation of forest aboveground biomass and leaf area index based on digital aerial photograph data in Northeast China. Forests 2018, 9, 275. [Google Scholar] [CrossRef] [Green Version]
- Ryu, Y.; Verfaillie, J.; Macfarlane, C.; Kobayashi, H.; Sonnentag, O.; Vargas, R.; Ma, S.; Baldocchi, D.D. Continuous observation of tree leaf area index at ecosystem scale using upward-pointing digital cameras. Remote Sens. Environ. 2012, 126, 116–125. [Google Scholar] [CrossRef]
- Sakamoto, T.; Gitelson, A.A.; Wardlow, B.D.; Arkebauer, T.J.; Verma, S.B.; Suyker, A.E.; Shibayama, M. Application of day and night digital photographs for estimating maize biophysical characteristics. Precis. Agric. 2012, 13, 285–301. [Google Scholar] [CrossRef] [Green Version]
- Wan, H.W.; Wang, J.D.; Liang, S.L.; Fang, H.L.; Xiao, Z.Q. Estimating leaf area index by fusing modis and misr data. In Proceedings of the 2006 IEEE International Geoscience and Remote Sensing Symposium, Denver, CO, USA, 31 July–4 August 2006; IEEE: New York, NY, USA, 2006. [Google Scholar]
- Xu, D.D.; Guo, X.L.; Li, Z.Q.; Yang, X.H.; Yin, H. Measuring the dead component of mixed grassland with landsat imagery. Remote Sens. Environ. 2014, 142, 33–43. [Google Scholar] [CrossRef]
- Fan, X.; Liu, Y. A global study of ndvi difference among moderate-resolution satellite sensors. ISPRS J. Photogramm. Remote Sens. 2016, 121, 177–191. [Google Scholar] [CrossRef]
- Bai, Y.; Yang, Y.; Jiang, H. Intercomparison of AVHRR GIMMS3g, Terra MODIS, and SPOT-VGT NDVI products over the Mongolian plateau. Remote Sens. 2019, 11, 2030. [Google Scholar] [CrossRef] [Green Version]
- Albarakat, R.; Lakshmi, V. Comparison of normalized difference vegetation index derived from landsat, modis, and avhrr for the mesopotamian marshes between 2002 and 2018. Remote Sens. 2019, 11, 1245. [Google Scholar] [CrossRef] [Green Version]
- Xiong, Y.D.; West, C.P.; Brown, C.P.; Green, P.E. Digital image analysis of old world bluestem cover to estimate canopy development. Agron. J. 2019, 111, 1247–1253. [Google Scholar] [CrossRef] [Green Version]
- Sanches, G.M.; Duft, D.G.; Kolln, O.T.; Luciano, A.C.D.; De Castro, S.G.Q.; Okuno, F.M.; Franco, H.C.J. The potential for rgb images obtained using unmanned aerial vehicle to assess and predict yield in sugarcane fields. Int. J. Remote Sens. 2018, 39, 5402–5414. [Google Scholar] [CrossRef]
- Walthall, C.; Dulaney, W.; Anderson, M.; Norman, J.; Fang, H.L.; Liang, S.L. A comparison of empirical and neural network approaches for estimating corn and soybean leaf area index from Landsat ETM+ imagery. Remote Sens. Environ. 2004, 92, 465–474. [Google Scholar] [CrossRef]
- Fang, H.L.; Liang, S.L.; Kuusk, A. Retrieving leaf area index using a genetic algorithm with a canopy radiative transfer model. Remote Sens. Environ. 2003, 85, 257–270. [Google Scholar] [CrossRef]
- Fang, H.L.; Liang, S.L. Retrieving leaf area index with a neural network method: Simulation and validation. IEEE Trans. Geosci. Remote 2003, 41, 2052–2062. [Google Scholar] [CrossRef] [Green Version]
- Jiang, C.Y.; Ryu, Y.; Fang, H.L.; Myneni, R.; Claverie, M.; Zhu, Z.C. Inconsistencies of interannual variability and trends in long-term satellite leaf area index products. Glob. Change Biol. 2017, 23, 4133–4146. [Google Scholar] [CrossRef] [PubMed]
- Fang, H.L.; Liang, S.L. A hybrid inversion method for mapping leaf area index from MODIS data: Experiments and application to broadleaf and needleleaf canopies. Remote Sens. Environ. 2005, 94, 405–424. [Google Scholar] [CrossRef]
- Gu, Y.; Wylie, B.K.; Howard, D.M.; Phuyal, K.P.; Ji, L. NDVI saturation adjustment: A new approach for improving cropland performance estimates in the Greater Platte River Basin, USA. Ecol. Indic. 2013, 30, 1–6. [Google Scholar] [CrossRef]
- Liu, F.; Qin, Q.; Zhan, Z. A novel dynamic stretching solution to eliminate saturation effect in NDVI and its application in drought monitoring. Chin. Geogr. Sci. 2012, 22, 683–694. [Google Scholar] [CrossRef]
- Wang, Z.; Yao, F.; Li, W.; Wu, J. Saturation correction for nighttime lights data based on the relative NDVI. Remote Sens. 2017, 9, 759. [Google Scholar] [CrossRef] [Green Version]
- Houborg, R.; McCabe, M.F. A hybrid training approach for leaf area index estimation via cubist and random forests machine-learning. Isprs J. Photogramm. 2018, 135, 173–188. [Google Scholar] [CrossRef]
- Brantley, S.T.; Zinnert, J.C.; Young, D.R. Application of hyperspectral vegetation indices to detect variations in high leaf area index temperate shrub thicket canopies. Remote Sens. Environ. 2011, 115, 514–523. [Google Scholar] [CrossRef] [Green Version]
- Wang, Q.; Adiku, S.; Tenhunen, J.; Granier, A. On the relationship of NDVI with leaf area index in a deciduous forest site. Remote Sens. Environ. 2005, 94, 244–255. [Google Scholar] [CrossRef]
- Hashimoto, N.; Saito, Y.; Maki, M.; Homma, K. Simulation of reflectance and vegetation indices for unmanned aerial vehicle (UAV) monitoring of paddy fields. Remote Sens. 2019, 11, 2119. [Google Scholar] [CrossRef] [Green Version]
- Tan, C.-W.; Zhang, P.-P.; Zhou, X.-X.; Wang, Z.-X.; Xu, Z.-Q.; Mao, W.; Li, W.-X.; Huo, Z.-Y.; Guo, W.-S.; Yun, F. Quantitative monitoring of leaf area index in wheat of different plant types by integrating NDVI and Beer-Lambert law. Sci. Rep. 2020, 10, 929. [Google Scholar] [CrossRef] [PubMed]
- Zhang, L.; Qiao, N.; Baig, M.H.A.; Huang, C.; Lv, X.; Sun, X.; Zhang, Z. Monitoring vegetation dynamics using the universal normalized vegetation index (UNVI): An optimized vegetation index-viupd. Remote Sens. Lett. 2019, 10, 629–638. [Google Scholar] [CrossRef]
- Sun, Y.; Ren, H.; Zhang, T.; Zhang, C.; Qin, Q. Crop leaf area index retrieval based on inverted difference vegetation index and NDVI. IEEE Geosci. Remote Sens. Lett. 2018, 15, 1662–1666. [Google Scholar] [CrossRef]
- Cao, Z.; Cheng, T.; Ma, X.; Tian, Y.; Zhu, Y.; Yao, X.; Chen, Q.; Liu, S.; Guo, Z.; Zhen, Q.; et al. A new three-band spectral index for mitigating the saturation in the estimation of leaf area index in wheat. Int. J. Remote Sens. 2017, 38, 3865–3885. [Google Scholar] [CrossRef]
- Asam, S.; Fabritius, H.; Klein, D.; Conrad, C.; Dech, S. Derivation of leaf area index for grassland within alpine upland using multi-temporal rapideye data. Int. J. Remote Sens. 2013, 34, 8628–8652. [Google Scholar] [CrossRef]
- Li, Z.Q.; Guo, X.L. A suitable NDVI product for monitoring spatiotemporal variations of lai in semiarid mixed grassland. Can. J. Remote Sens. 2012, 38, 683–694. [Google Scholar] [CrossRef]
- He, Y.; Guo, X.L.; Wilmshurst, J. Studying mixed grassland ecosystems I: Suitable hyperspectral vegetation indices. Can. J. Remote Sens. 2006, 32, 98–107. [Google Scholar] [CrossRef]
- Zhang, J.; Yang, C.H.; Zhao, B.Q.; Song, H.B.; Hoffmann, W.C.; Shi, Y.Y.; Zhang, D.Y.; Zhang, G.Z. Crop classification and LAI estimation using original and resolution-reduced images from two consumer-grade cameras. Remote Sens. 2017, 9, 1054. [Google Scholar] [CrossRef] [Green Version]
- Lin, Q.A.; Huang, H.G.; Yu, L.F.; Wang, J.X. Detection of shoot beetle stress on yunnan pine forest using a coupled liberty2-inform simulation. Remote Sens. 2018, 10, 1133. [Google Scholar] [CrossRef] [Green Version]
- Nagai, S.; Saitoh, T.M.; Noh, N.J.; Yoon, T.K.; Kobayashi, H.; Suzuki, R.; Nasahara, K.N.; Son, Y.; Muraoka, H. Utility of information in photographs taken upwards from the floor of closed-canopy deciduous broadleaved and closed-canopy evergreen coniferous forests for continuous observation of canopy phenology. Ecol. Inform. 2013, 18, 10–19. [Google Scholar] [CrossRef]
- Li, Z.Q.; Guo, X.L. A suitable vegetation index for quantifying temporal variation of leaf area index (LAI) in semiarid mixed grassland. Can. J. Remote Sens. 2010, 36, 709–721. [Google Scholar] [CrossRef]
- Xu, D.D.; Guo, X.L. A study of soil line simulation from Landsat images in mixed grassland. Remote Sens. 2013, 5, 4533–4550. [Google Scholar] [CrossRef] [Green Version]
- Wu, C.; Niu, Z.; Tang, Q.; Huang, W. Estimating chlorophyll content from hyperspectral vegetation indices: Modeling and validation. Agr. For. Meteorol. 2008, 148, 1230–1241. [Google Scholar] [CrossRef]
- Xu, D.D.; Koper, N.; Guo, X.L. Quantifying the influences of grazing, climate and their interactions on grasslands using landsat tm images. Grassl. Sci. 2018, 64, 118–127. [Google Scholar] [CrossRef]
- Pan, G.; Li, F.M.; Sun, G.J. Digital camera based measurement of crop cover for wheat yield prediction. In Proceedings of the Igarss: 2007 IEEE International Geoscience and Remote Sensing Symposium, Barcelona, Spain, 23–27 June 2007; IEEE: New York, NY, USA, 2007. [Google Scholar]
- Diago, M.P.; Correa, C.; Millan, B.; Barreiro, P.; Valero, C.; Tardaguila, J. Grapevine yield and leaf area estimation using supervised classification methodology on rgb images taken under field conditions. Sensors 2012, 12, 16988–17006. [Google Scholar] [CrossRef] [Green Version]
Figure 1.
Vegetation community types in Grasslands National Park. (a) The vegetation community data were first investigated in 1983 and were updated in 1995. (b) Upland grassland. (c) Valley grassland. (d) Sloped grassland. (e) Disturbed communities.
Figure 1.
Vegetation community types in Grasslands National Park. (a) The vegetation community data were first investigated in 1983 and were updated in 1995. (b) Upland grassland. (c) Valley grassland. (d) Sloped grassland. (e) Disturbed communities.

Figure 2.
Quadrat set up in each site and field data collection.
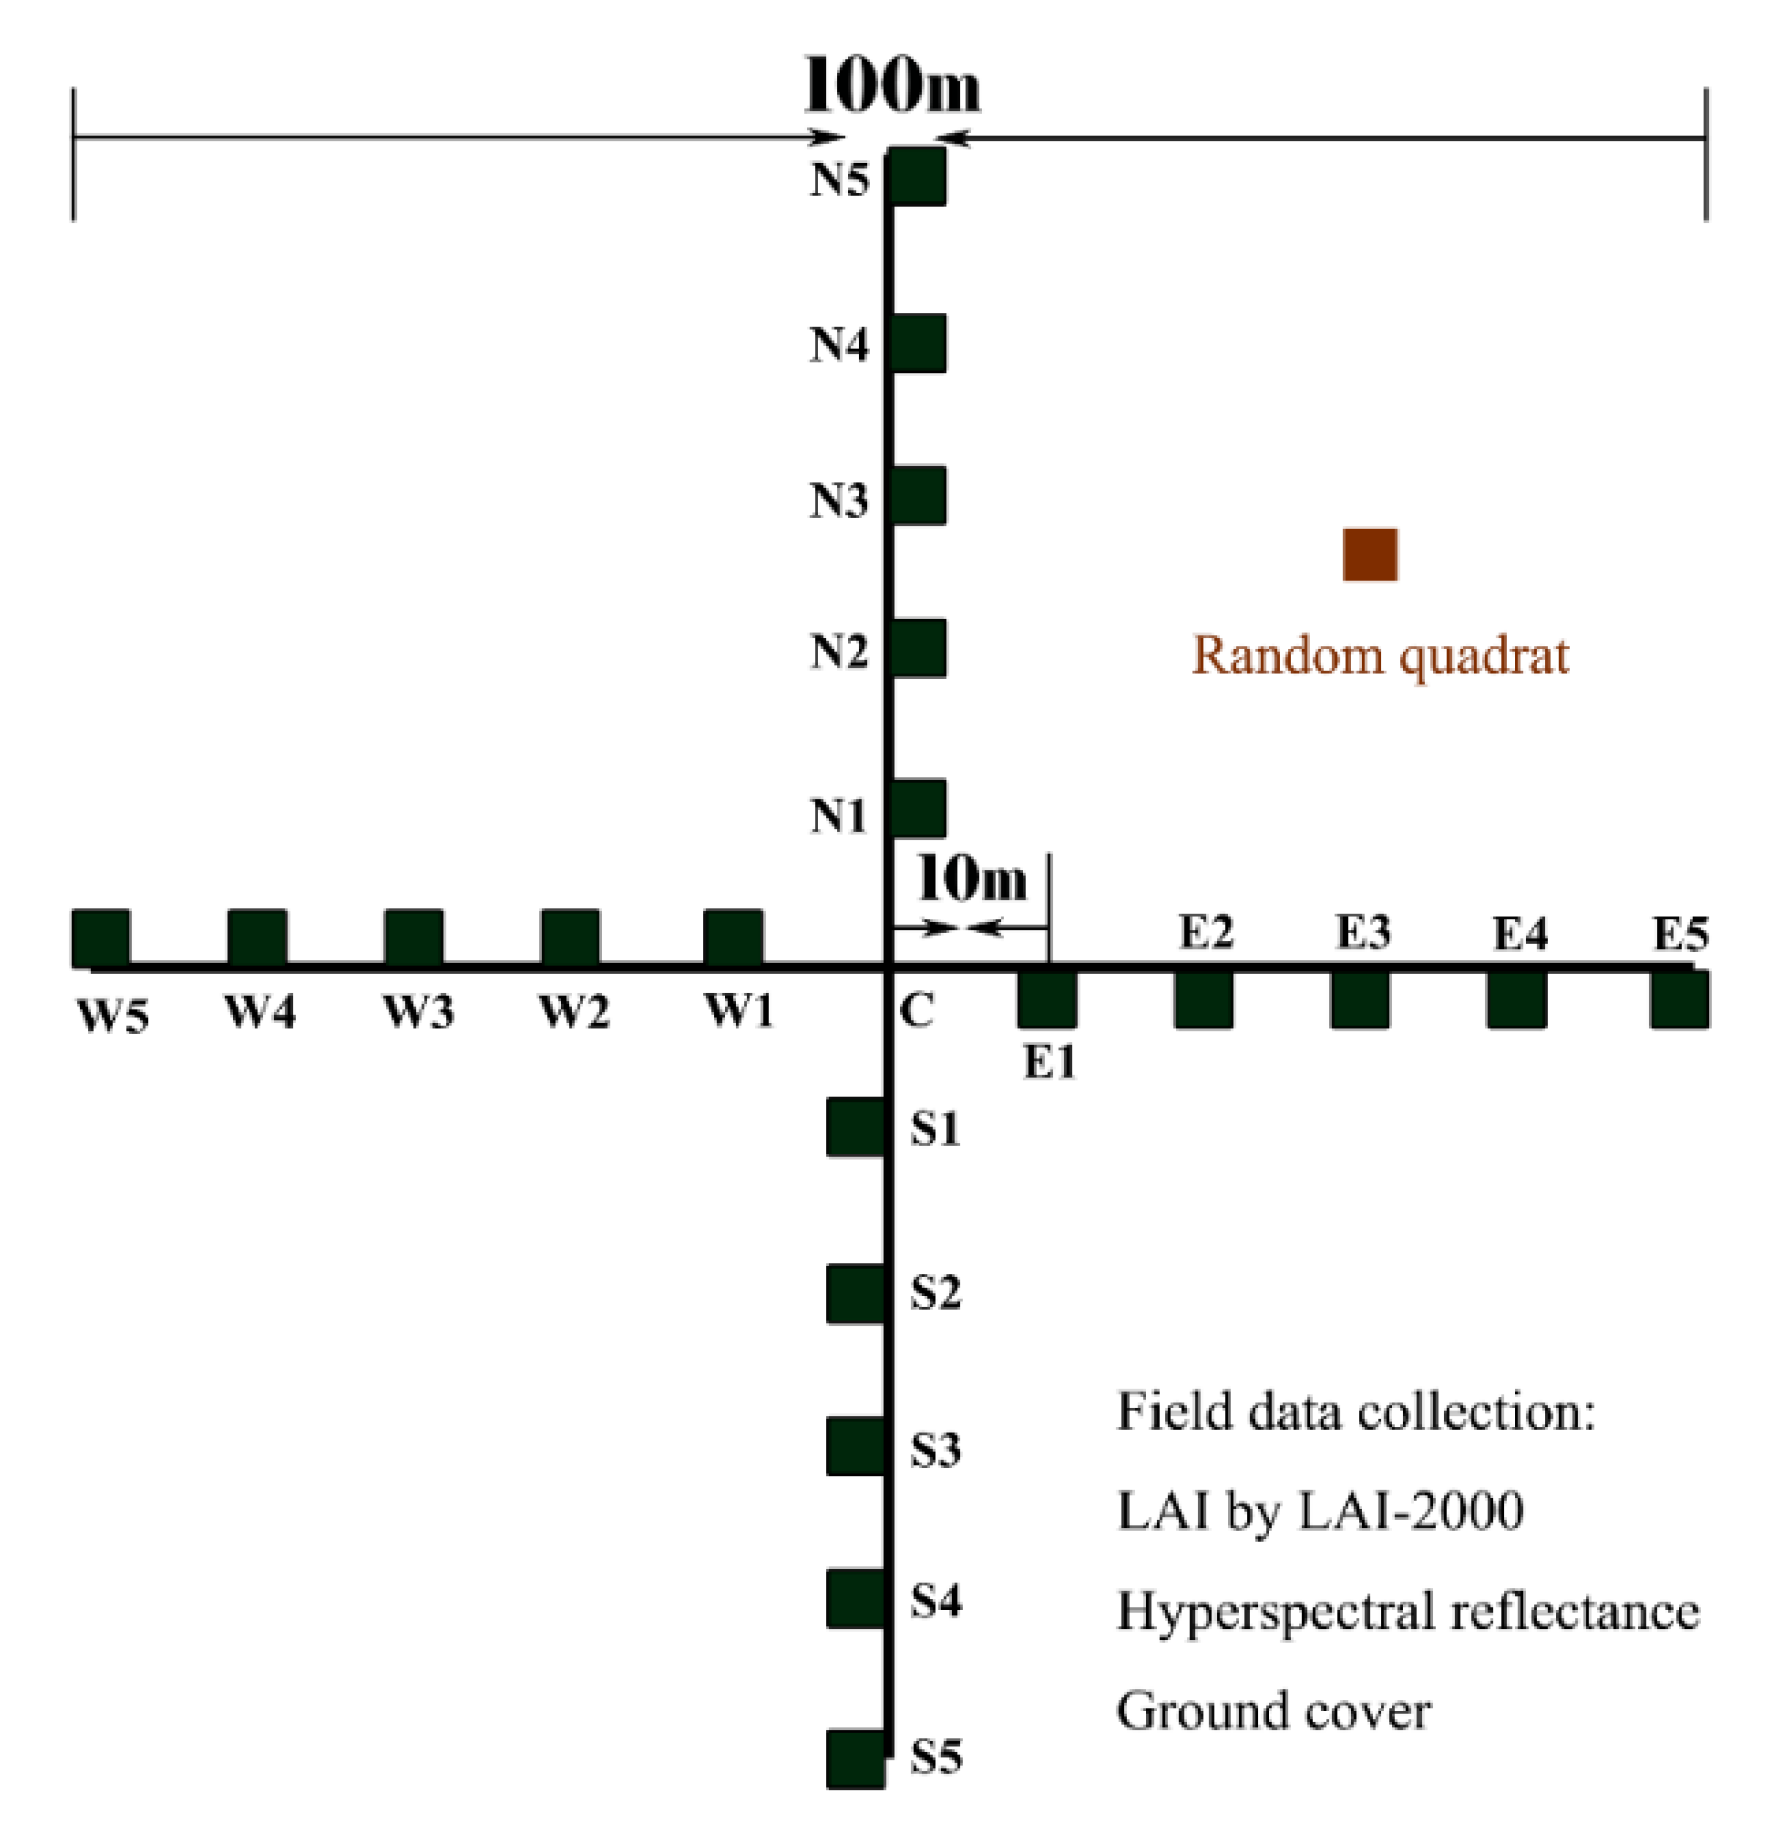
Figure 3.
Hyper-spectra of one random quadrat (i.e., the missing data in the wavelength region of 1351–1430 nm and 1801–1950 nm is due to the noise from the sensors connections of the three detectors, which facilitated spectra measurement of the analytical spectral devices (ASD)). (a) Hyper-spectra for the random quadrat before and after green vegetation was removed. (b) One sample random quadrat before green vegetation was removed and hyper-spectrum for b is the orange line in a (legend: “before”). (c) the same random quadrat after green grass was removed and hyper-spectrum of c is the grey line in a (legend: “after”).
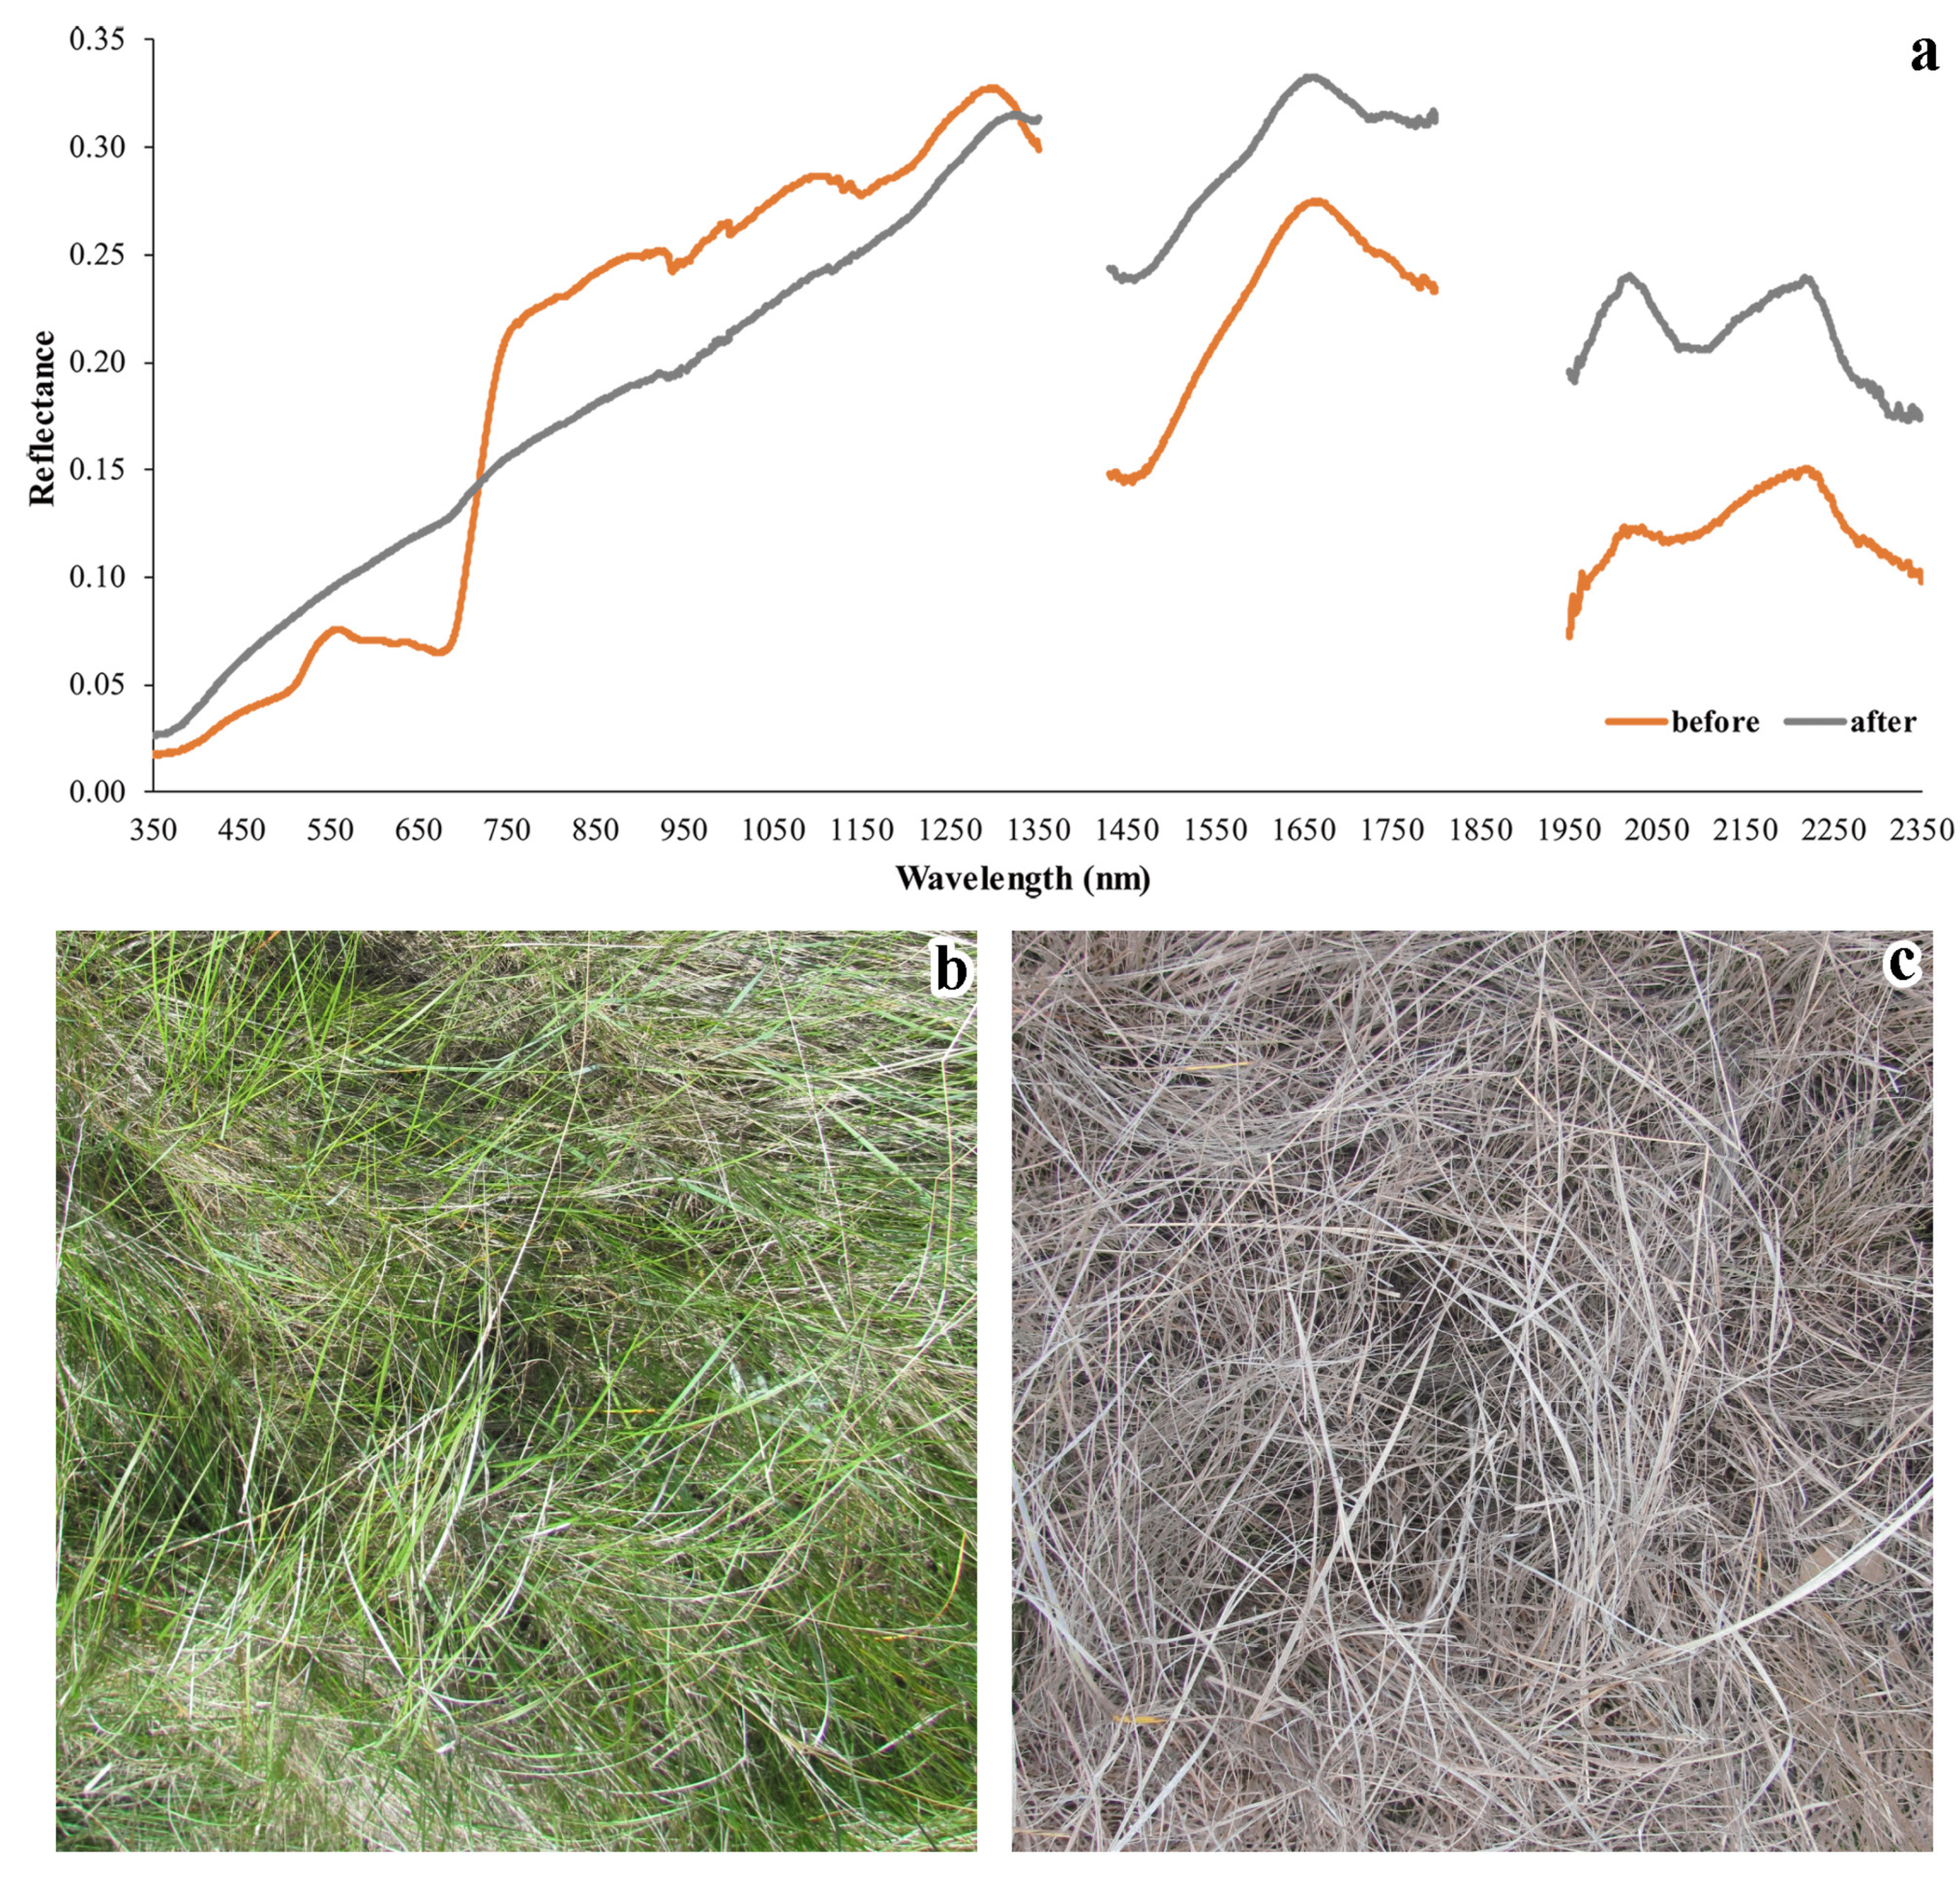
Figure 4.
The relationship between hyperspectral NDVI and LAI. (a) Mixed NDVI and Green LAI. (b) Mixed NDVI and PAI. (c) Green NDVI and Green LAI. (d) Dead NDVI and NPVAI.
Figure 4.
The relationship between hyperspectral NDVI and LAI. (a) Mixed NDVI and Green LAI. (b) Mixed NDVI and PAI. (c) Green NDVI and Green LAI. (d) Dead NDVI and NPVAI.
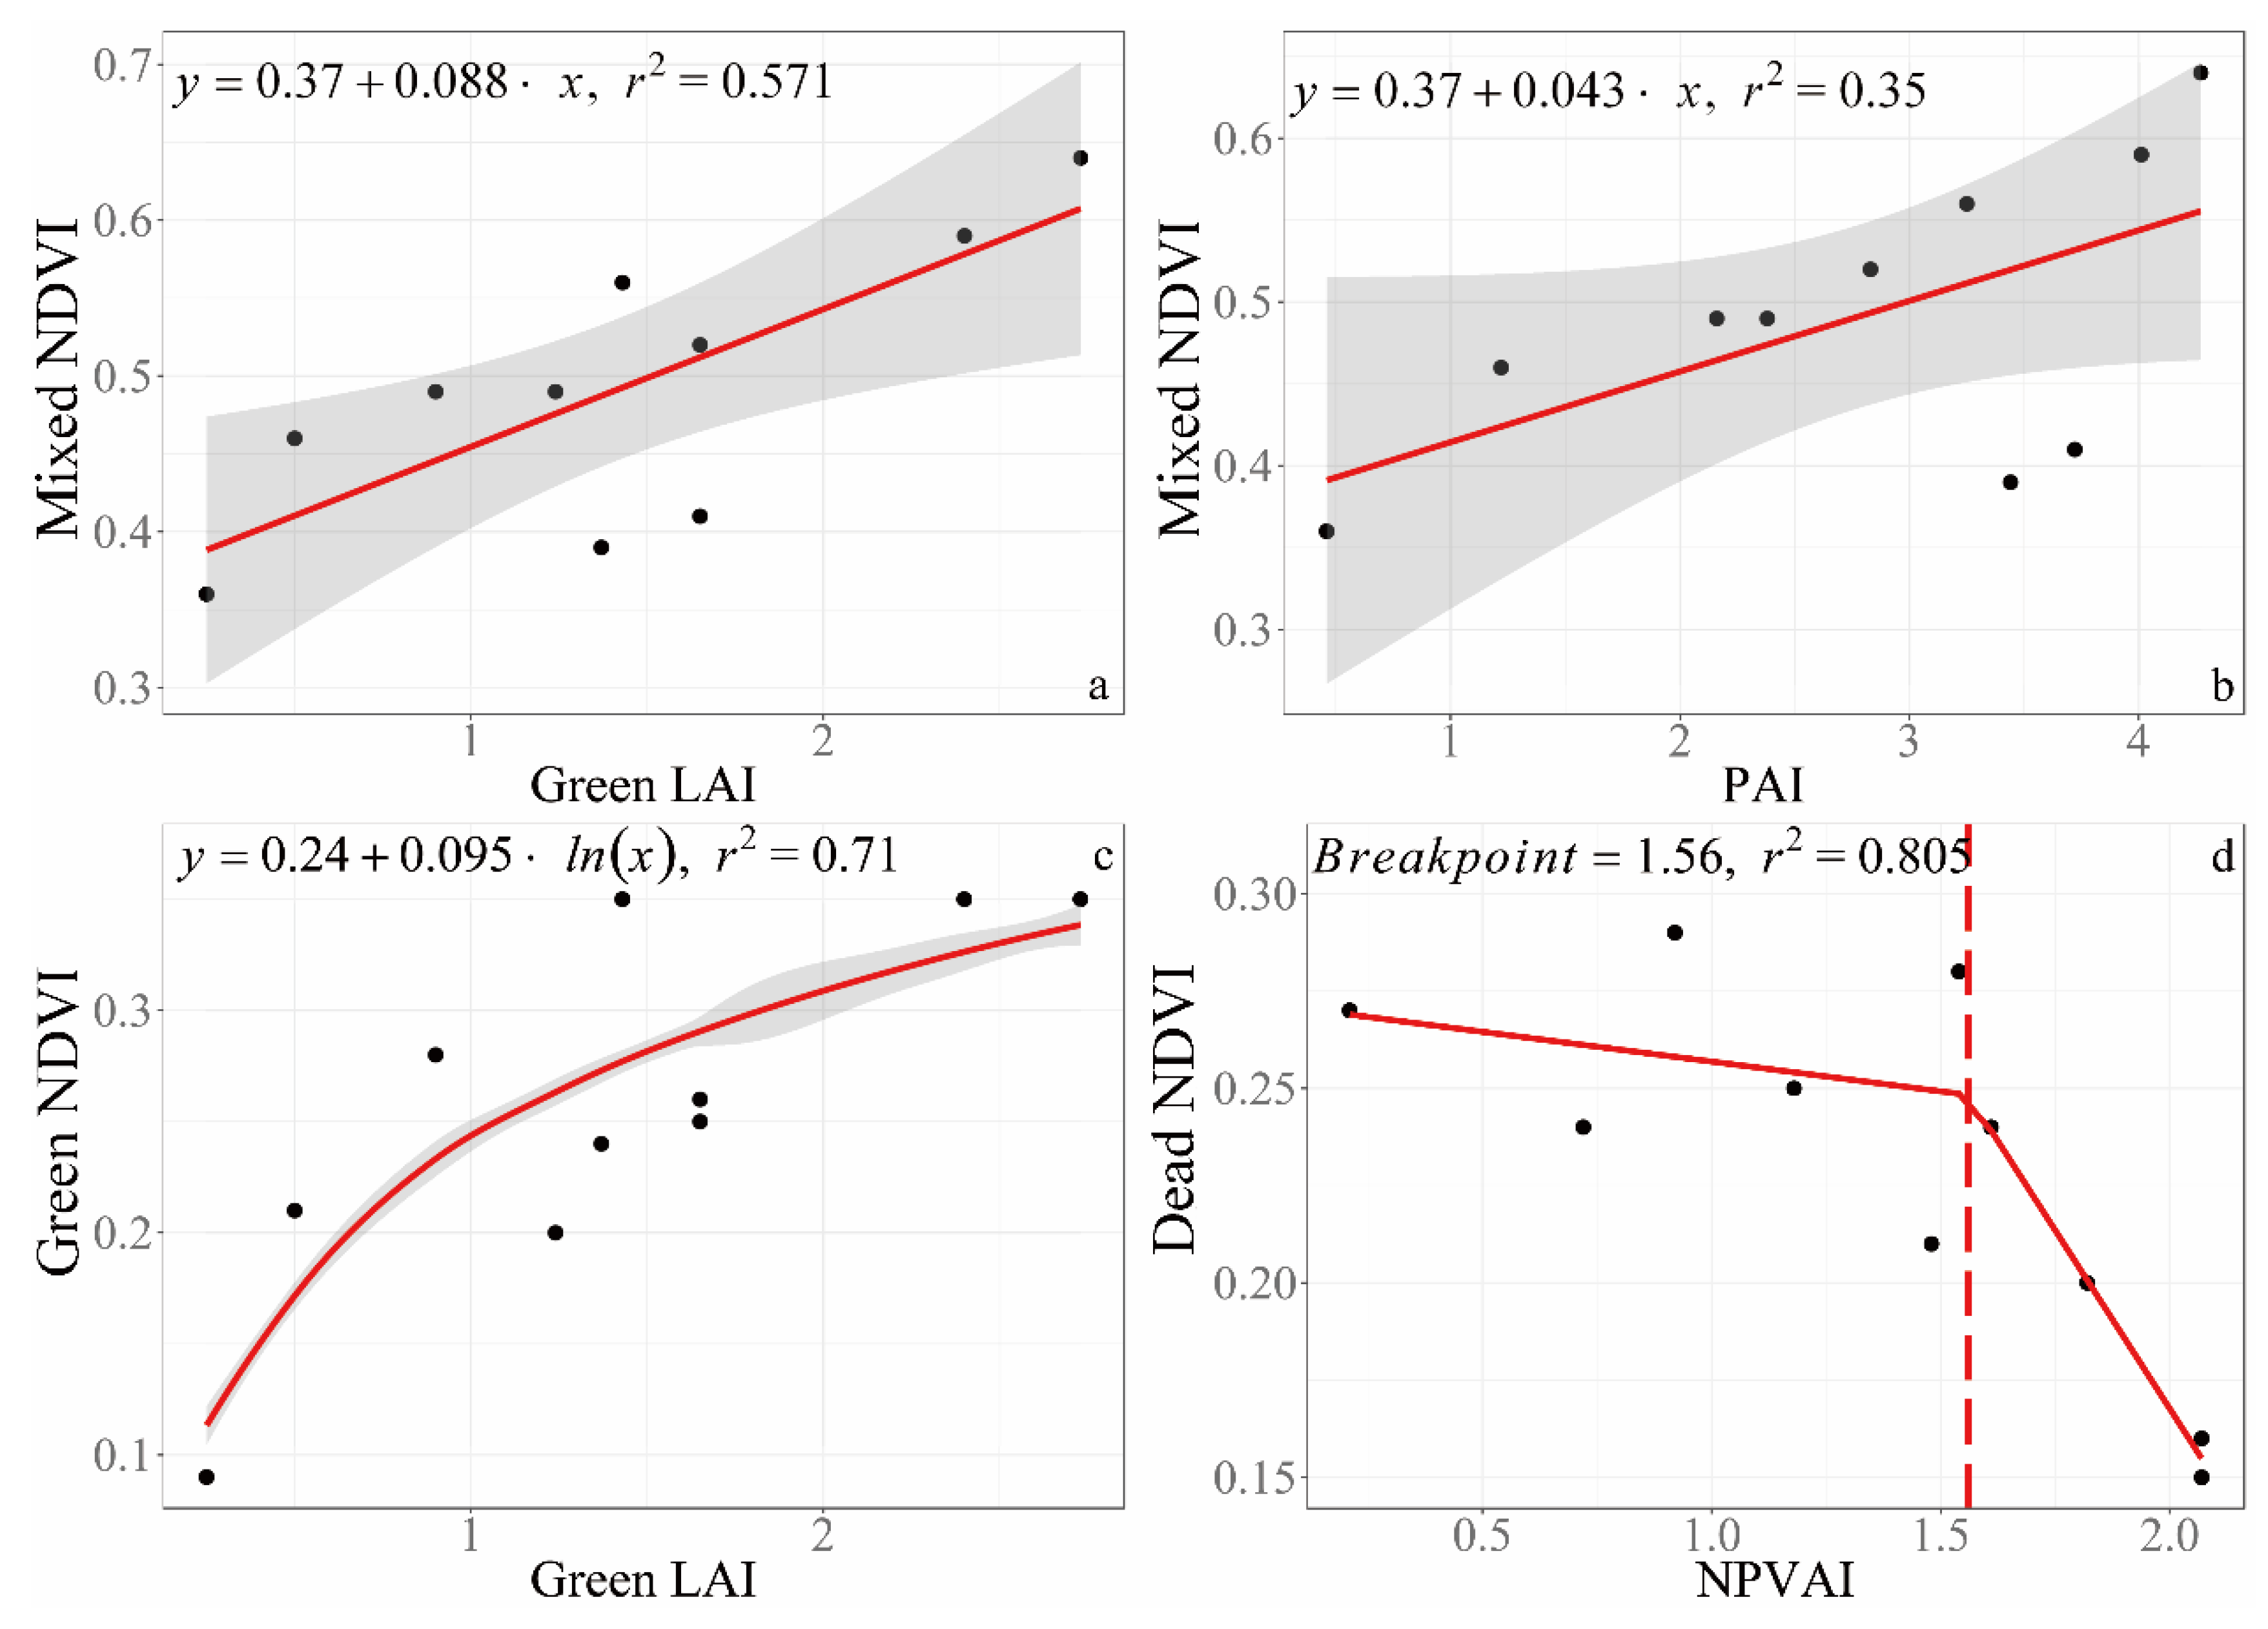
Figure 5.
Comparing estimated green and NPVAI with the field measured LAI of each random quadrat (the red solid line is the regression line; the blue line is the 1:1 line).
Figure 5.
Comparing estimated green and NPVAI with the field measured LAI of each random quadrat (the red solid line is the regression line; the blue line is the 1:1 line).
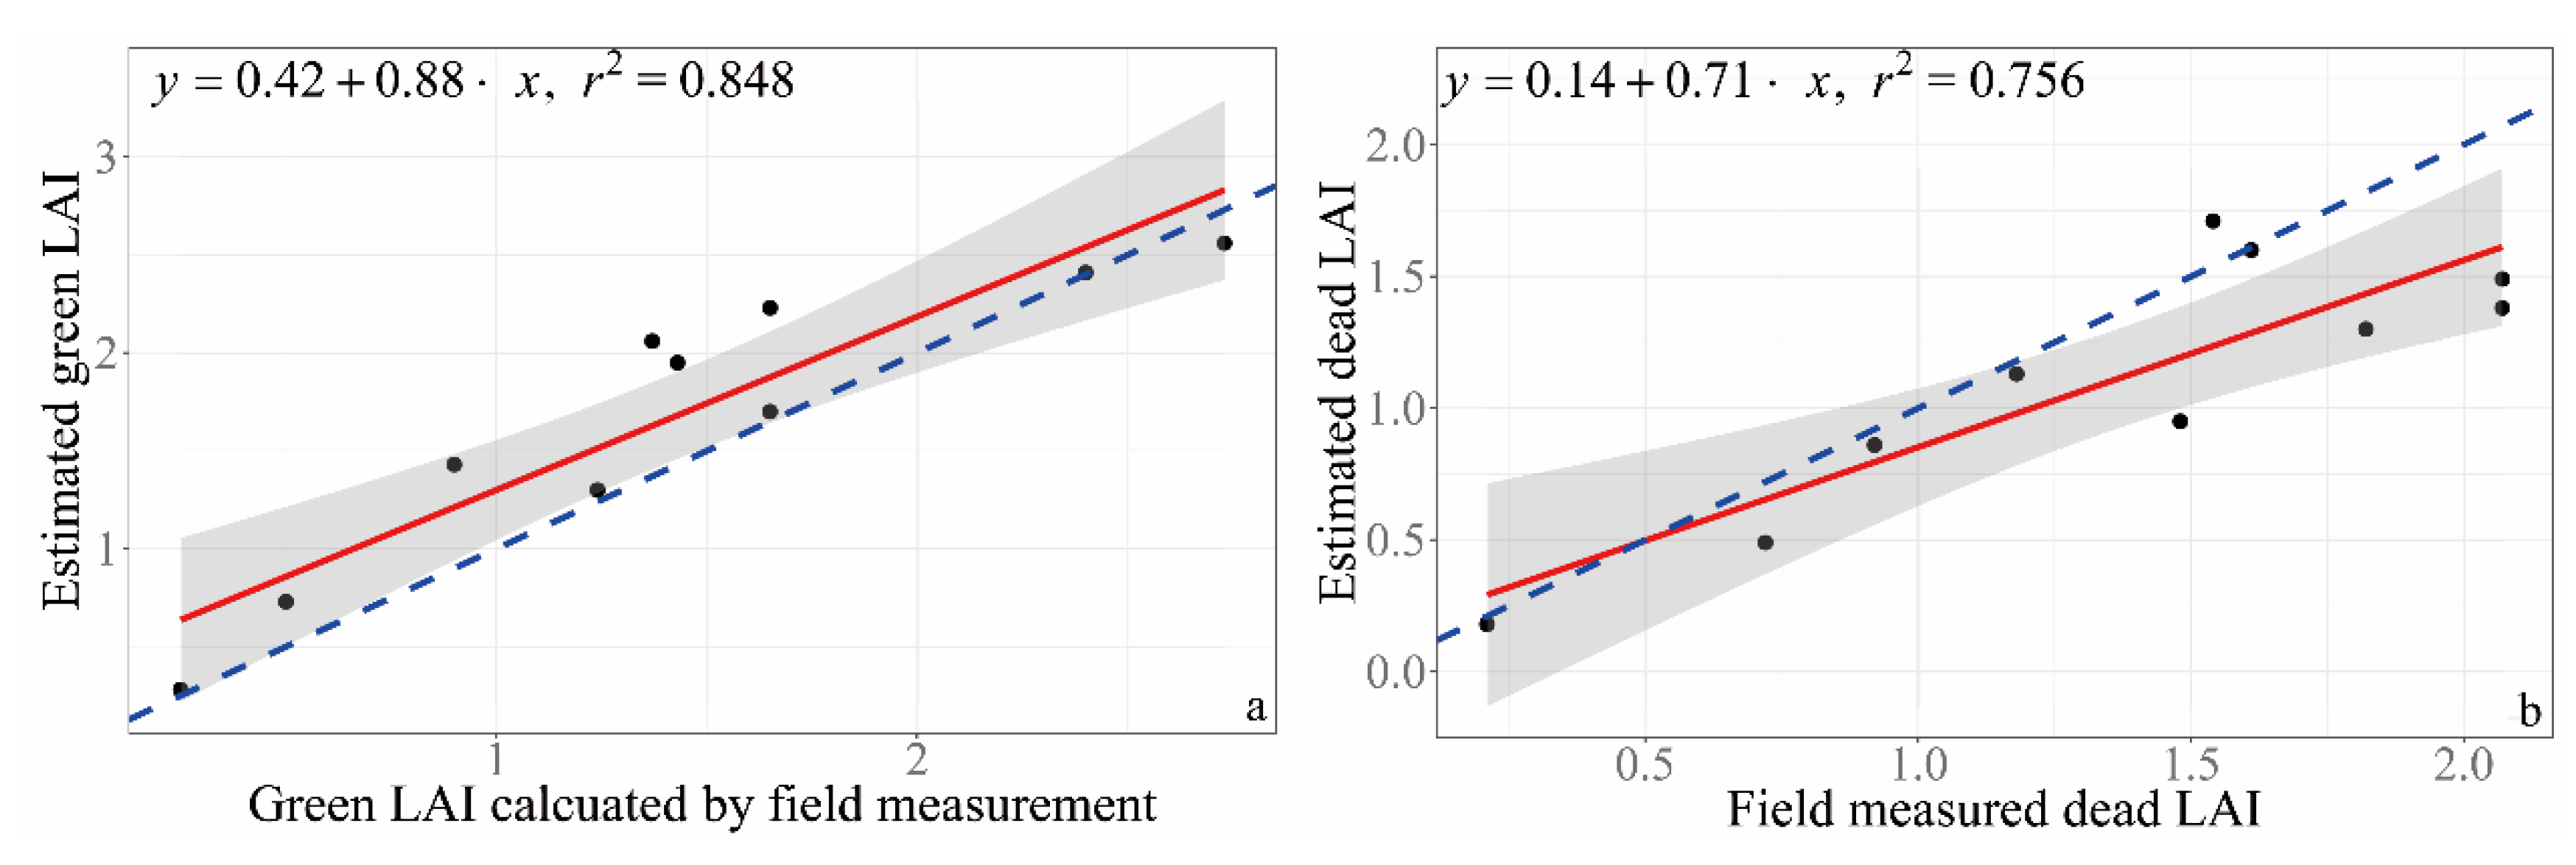
Table 1.
Relative effects of green and standing dead cover on field measured LAI averaged by each site.
Table 1.
Relative effects of green and standing dead cover on field measured LAI averaged by each site.
| Site Data | Coefficient | Sum Sq | F | P | Explained Variation (%) | Relative Effects (%) |
|---|---|---|---|---|---|---|
| dead cover | 0.04151 | 60.532 | 68.333 | <0.001 | 15.45% | 39.67% |
| green cover | 0.04139 | 92.056 | 103.92 | <0.001 | 23.50% | 60.33% |
| residual | 239.177 | |||||
| total | 391.765 | 38.95% | 100.00% |
© 2020 by the authors. Licensee MDPI, Basel, Switzerland. This article is an open access article distributed under the terms and conditions of the Creative Commons Attribution (CC BY) license (http://creativecommons.org/licenses/by/4.0/).
Share and Cite
MDPI and ACS Style
Xu, D.; An, D.; Guo, X. The Impact of Non-Photosynthetic Vegetation on LAI Estimation by NDVI in Mixed Grassland. Remote Sens. 2020, 12, 1979. https://doi.org/10.3390/rs12121979
AMA Style
Xu D, An D, Guo X. The Impact of Non-Photosynthetic Vegetation on LAI Estimation by NDVI in Mixed Grassland. Remote Sensing. 2020; 12(12):1979. https://doi.org/10.3390/rs12121979
Chicago/Turabian StyleXu, Dandan, Deshuai An, and Xulin Guo. 2020. "The Impact of Non-Photosynthetic Vegetation on LAI Estimation by NDVI in Mixed Grassland" Remote Sensing 12, no. 12: 1979. https://doi.org/10.3390/rs12121979
Note that from the first issue of 2016, this journal uses article numbers instead of page numbers. See further details here.