Rapid Change Detection of Flood Affected Area after Collapse of the Laos Xe-Pian Xe-Namnoy Dam Using Sentinel-1 GRD Data


1
Environmental Assessment Group, Korea Environment Institute, Sejong 30147, Korea
2
Center for Environmental Data Strategy, Korea Environment Institute, Sejong 30147, Korea
*
Author to whom correspondence should be addressed.
Remote Sens. 2020, 12(12), 1978; https://doi.org/10.3390/rs12121978
Submission received: 12 May 2020
/
Revised: 15 June 2020
/
Accepted: 18 June 2020
/
Published: 19 June 2020
(This article belongs to the Special Issue Earth Observation from KOMPSAT Optical, Thermal and Radar Satellite Images)
Abstract
:Water-related disasters occur frequently worldwide and are strongly affected by a climate. Synthetic aperture radar (SAR) satellite images can be effectively used to monitor and detect damage because these images are minimally affected by weather. This study analyzed changes in water quantity and flooded area caused by the collapse of the Xe-Pian Xe-Namnoy Dam in Laos on 23 July 2018, using Sentinel-1 ground range detected (GRD) images. The collapse of this dam gained worldwide attention and led to a large number of casualties at least 98 people, as well as enormous economic losses. Thus, it is worth noting that this study quantitatively analyzed changes in both the Hinlat area, which was flooded, and the Xe-Namnoy reservoir. This study aims to suggest a practical method of change detection which is to simply compute flood extent and water volume in rapidly analysis. At first, a -stable distribution was fitted to intensity histogram for removing the non-water-affected pixels. This fitting differs from other typical histogram fitting methods, which is applicable to histograms with two peaks, as it can be applied to histograms with not only two peaks but also one peak. Next, another type of threshold based on digital elevation model (DEM) data was used to correct for residual noise, such as speckle noise. The results revealed that about 2.2 108 m3 water overflowed from the Xe-Namnoy reservoir, and a flooded area of about 28.1 km3 was detected in the Hinlat area shortly after the dam collapse. Furthermore, the water quantity and flooded area decreased in both study areas over time. Because only SAR GRD images were used in this study for rapid change detection, it is possible that more accurate results could be obtained using other available data, such as optical images with high spatial resolution like KOMPSAT-3, and in-situ data collected at the same time.
1. Introduction
In recent decades, numerous natural disasters related to water, such as floods, typhoons, and tsunamis, have occurred worldwide, causing a huge amount of damage [1,2,3]. Water disasters have the character of being relatively predictable compared to other natural disasters due to their interactions with climate and the surrounding topography. Therefore, establishing a monitoring system for water resources with careful and consistent observations is essential. Optical images are very useful data in flood detection, and there have been several previous studies using them [4,5,6,7,8]. Since water disasters are affected by a climate, however, there was a limit to the use of optical images corresponding to the research period. Therefore, it is effective to detect and monitor their damage using synthetic aperture radar (SAR) data as well as data from other type of satellites such as optical satellites [9,10,11,12,13]. Among SAR satellites, Sentinel-1 has a 12-day revisit period. However, because this system has two satellites operating simultaneously, Sentinel-1A and −1B alternately capture the same area every six days. Additionally, Sentinel-1 series data products are distributed free of charge; this advantage, in combination with the short revisit cycle, has led to their extensive use in disaster-related studies, such as those focusing on earthquake and water disasters including floods [14,15,16,17]. In particular, several flood-related studies have been conducted by using Sentinel-1 data because they provided as C-band data enable continuous monitoring without being affected by weather conditions [18,19,20,21,22].
Water resources are being strongly affected by the rapidly changing climate, and the magnitude of water-related disasters such as tsunamis, large-scale flooding in savanna climate areas, and the periodic El Niño event is increasing. The importance of continuous monitoring of water resources is becoming more apparent [23,24]. In particular, satellite data have been actively used for research into water-related disasters, due to the wide range of damage and the difficulty of directly accessing affected areas; these data are also used to prevent secondary damage by predicting the direction of water movement [10,25,26,27,28].
The collapse of the Xe-Pian Xe-Namnoy Saddle Dam in Laos on 23 July 2018 caused one of the largest floods in recent years, resulting in at least 98 individuals reported missing and 6600 residents affected, as well as economic damage [29]. In this study, quantitative changes in the Xe-Namnoy reservoir related to the dam collapse were determined based on images taken before the dam collapse, and the change in flooded area in the Hinlat area was calculated, using 19 Sentinel-1 ground range detected (GRD) images collected from 13 July 2018 to 29 October 2018. A histogram fitting method was used to set the threshold for flood extent calculation; this method is frequently applied to assess floods using SAR data [30,31,32,33,34].
Because the backscatter coefficients of SAR images differ for the same object depending on when the image was taken, the pass (ascending or descending), and weather, each threshold was set according to the pass of the image. Specifically, the ascending image acquired on 13 July 2018 and the descending image acquired on 17 July 2018 were used as reference image. To account for differences associated with the pass direction, a set of 10 ascending images acquired after the collapse, 9 descending images acquired after the collapse, and a single image taken before the collapse in each pass direction was used for flood extent calculation. The primary objective of this study was to calculate quantitative changes in the Xe-Namnoy reservoir and changes in flooded area in the Hinlat area based on the differences between images acquired before and after the collapse.
To compute the area of water surface in the Xe-Namnoy reservoir and flood extent in the Hinlat area, a threshold which distinguishes flood pixels was obtained by fitting an -stable distribution to intensity histogram. Water volume which outflowed from the Xe-Namnoy reservoir was calculated by multiplying the water surface in the Xe-Namnoy reservoir by DEM data, which corresponds to the water surface. With this uncomplicated method, the quantitative analysis of changes in flood extent and water volume in the Xe-Namnoy reservoir and the Hinlat area is not only feasible but also practical.
2. Study Area and Datasets
2.1. Study Area
The Xe-Pian Xe-Namnoy Dam is located in Champasak Province in the southeast of Laos (Figure 1). It consists of two main dams (Xe-Pian Dam and Xe-Namnoy Dam) and five saddle dams (Saddle Dams A–E). Among the saddle dams, Saddle Dam D collapsed on 23 July 2018. As a result, a large amount of water was released from the Xe-Namnoy reservoir, which is located on the right side of Saddle Dam D, and flowed along the Vang Nagao River on the left side of Saddle Dam D, which has a low elevation relative to the Xe-Namnoy reservoir. The Xe-Namnoy reservoir (Figure 1a) and the Hinlat area, which was affected by flooding (Figure 1b), were selected as study areas for calculating the change in volume of water due to this outflow and the areal extent of flooding, respectively.
The first study area, the Xe-Namnoy reservoir, is located at an elevation of about 836.5 m. This area has a minimum elevation of 688 m and a maximum elevation of 1074 m, and the difference in elevation of 121.3 m, located about 29.52 km south of Saddle Dam D (Figure 2b). This area Hinlat has a fairly large range of elevation of 850 m, with a minimum elevation of 72 m and a maximum of 927 m. In this area, areas of very high elevation are present on the north and east edges, but the areas of flooding, indicated as dark areas in Figure 2b, had an average elevation of less than 105 m. In such cases, where the difference in elevation between the flooded area and the non-flooded area is large, noise removal with high accuracy plays a key role in improving the accuracy of results.
Most of the Hinlat area appears in dark in color on the SAR amplitude image, perhaps because this area is covered by bare soil (Figure 1b). Backscatter coefficients differ according to conditions such as soil moisture and surface roughness, generally with lower values when soil moisture is lower and surface roughness is lower. In the optical images taken before the collapse of the dam, the Hinlat area appears to be mostly bare soil with the exception of some trees (Figure 3). Because most of the Hinlat area has few structures such as buildings or trees, its surface roughness is low, which should lead to a low backscatter coefficient. Therefore, without other sources of data, such as optical data, it is difficult to distinguish water from bare soil using a single SAR amplitude image. However, it is possible to distinguish between bare soil and the area flooded due to the dam collapse by extracting the value change relative to the reference image. The specific method is described in Section 3.
2.2. Datasets
This study used 19 Sentinel-1 interferometric wide (IW)-mode images in VV polarization channel collected from 13 July 2018 to 29 October 2018, in conjunction with the NASA Shuttle Radar Topography Mission (SRTM) Digital Elevation Model (DEM). Table 1 lists specific information about the Sentinel-1 data used in this study.
Sentinel-1 IW mode data are collected at with an incidence angle range of 29.1° to 46.0°, a swath width of 250 km, and a ground resolution of 5 20 m [35]. For efficient processing and analysis of SRTM DEM data, which have a spatial resolution of 30 m, both Sentinel-1 and DEM data were resampled to 10 m in this study. Sentinel-1 IW mod GRD data are provided as single polarization data (VV) or dual polarization data (VV and VH), with most IW modes captured in dual polarization. Previous research has revealed that VV polarization data has higher level of accuracy VH polarization data for flood detection [12]. Therefore, in this study, in order to detect the extent of flooding with high accuracy, VV images were used to detect water-based pixels that changed over time due to the dam collapse and to determine the change in the volume of water using DEM data.
3. Methodology
To minimize the noise effect in Sentinel-1 GRD data and accurately extract the flood extent, data were processed via the following three steps; note that here, flood extent refers to both water pixels and flooded pixels.
To be specific, in the first step, a Wiener filter and non-local means filter (NL filter) were applied sequentially to reduce speckle noise. The second step was the calculation of thresholds through histogram fitting with an -stable distribution. Based on these thresholds, flood extents were extracted. Because SAR amplitude data contains speckle noise, complete extraction of water pixels and masking of non-water pixels using the thresholds of a histogram is difficult. Therefore, in the final step, DEM data were also considered to remove noise in the extracted flood extent data obtained in the previous step. The specific data processes are illustrated in Figure 4.
3.1. Application of Wiener Filter and Non-Local Means Filter
Pre-processing of VV data was performed using Sentinel application platform (SNAP) software, which is used worldwide for Sentienl-1 data processing. Because Sentinel-1 GRD data contains various types of noise, including thermal noise, and speckle noise, it is essential to perform pre-processing. First, after calibrating for thermal noise, radiometric calibration was performed to convert the digital pixel values to the backscatter coefficient, as was geometric calibration to correct for errors caused by side-looking operation. As a result of calibration, intensity VV images were calculated with the dB scale. Intensity images from both radiometric and geometric calibration were applied to the Wiener filter and NL filter, sequentially.
The Winer filter, which is known to be an effective tool for reducing speckle noise, has been used to remove noise from SAR data in many previous studies [36,37]. In this study, after applying the Wiener filter to remove noise, the NL filter was applied to blur the noise and more clearly classify the flood extent. The NL filter was described by Buades et al. [38] and considers all pixels in the image when obtaining the value of the target pixel. In other words, it is a noise filter that can be effectively applied to flood extent detection, as it removes speckle noise while preserving the geometric features of the image.
The pixel value, which is multiplied by target pixel and weight (), is calculated using the following equation Buades et al. [38]:
where is a weight coefficient which is proportional to similarity between and pixel and is an intensity gray level of pixel .
3.2. Calculation of Threshold through Histogram Fitting with an -Stable Distribution
To calculate the flood extent, a difference image () was calculated by subtracting the image taken after flooding from the image taken before flooding using the following equation:
where is an ith image after the collapse, is an image, which means reference image, before the collapse, and is difference image between and .
With regard to difference image calculation, the probability density function (PDF) of intensity for the difference image generally appears as a normal distribution with a mean of zero. Because backscattering is negligible due to the specular reflection of the incident microwave radiation on the surface of water, water appears to have a low backscattering value, and flooded areas exhibit a similar phenomenon in SAR imagery [32,39]. Therefore, the change in volume of water was assumed to have a positive value in the Xe-Namnoy reservoir where water area was reduced, whereas for flooded pixels, such as those in the Hinlat area, it would have a negative value.
In previous studies, the gamma distribution was fitted to the histogram of the water portion of images assuming that the water portion followed a gamma distribution [30,32,34]. However, this assumption has a limitation in that it can be applied only when a peak appears in the water portion of the intensity histogram. Depending on the proportion of water in an image of the study area, it is possible that two peaks may not be apparent in the histogram, and instead only one broad peak may appear at low values corresponding to water. Therefore, to calculate the threshold for distinguishing water and flooded areas in the same manner at the two study sites with different water proportions, water and flooded areas were assumed to correspond to the thick tail of the entire intensity distribution.
Additionally, to correct for geometric distortions in SAR images, that is, foreshortening, layover, and shadow effects, each reference image was applied according to the pass when calculating the difference image. The ascending image acquired on 13 July 2018 and the descending image on 17 July 2018 were used as reference images for each pass direction. After calculating the difference image () for each of the two study areas based on the reference images, an -stable distribution was fitted to the intensity distribution histogram of each difference image. Next, the value at the point where the histogram and fitting curve met was set as the threshold value (Figure 5). The -stable distribution was used for setting the threshold because this distribution is known to be suitable for high-skewness and heavy tailed data [40,41].
A common feature of both study areas is that the intensity histograms show a peak near zero. However, the shape of the histogram tail differs because the ratio of water or flooded area in the two study areas differs (Figure 5). Unlike the histogram for the Hinlat area (Figure 5b), the intensity histogram of the difference image for the Xe-Namnoy reservoir shows a gentle peak around the range of 10 to 15 (Figure 5a). Additionally, the value of water pixels is positive in the difference image of the Xe-Namnoy reservoir, where stored water was lost, in contrast to that of Hinlat area.
The intensity histogram of the difference image for the Hinlat area had a relatively long and thick tail in the negative direction compared to the positive direction (Figure 5b). Because the Hinlat area experience flood damage due to water that outflowed from the Xe-Namnoy reservoir after the collapse of the dam, flooded pixels had negative values in the difference image. Although the histogram for the Hinlat did not show two peaks as clearly as that of the Xe-Namnoy reservoir, the thick tail in the negative portion of histogram for the Hinlat was thought to represent flooded pixels, because water and flooded pixels have low backscatter coefficients. Moreover, the flooded area may be fully covered with water or contain only traces caused by water scouring. Therefore, specular reflection may be lower than that of an actual water surface, and accordingly, the backscatter coefficient may be lower than that of water. For this reason, the absolute value of the intensity of water-based pixels is smaller in the intensity histogram of the Hinlat area, which contains flooded pixels, than in that of the Xe-Namnoy reservoir, which contains water pixels.
To calculate the flood extent on each date from the difference image, the -stable distribution was fitted to the histogram in both study areas, and the first point of contact with the histogram was set as the threshold for the water of flooded area. Next, pixels above (for the Xe-Namnoy reservoir) or below (for the Hinlat area) the threshold were considered non-water and were masked.
3.3. Noise Removal Using DEM Data
After the flood extent was extracted using the threshold value based on the histogram, DEM data were used to remove speckle noise remaining in the flood extent image. This step is a powerfully effective method of removing speckle noise in areas that contain large elevation differences within the study area, such as the Hinlat area. If this step is skipped, speckle noise may not be properly removed, which would lead to serious calculation errors. After a number of trials, the threshold values that preserve the flood extent as much as possible in this study were identified as 785 m for the Xe-Namnoy reservoir and 105 m for the Hinlat area, respectively. Values above these thresholds in both study areas were considered noise and removed.
3.4. Calculation of Water Outflow Area and Volume
To calculate both the flooded area and volume of water released due to the dam collapse, a value of 0 was assigned to non-water pixels including noise, which was removed through the processes described in Section 3.1, Section 3.2 and Section 3.3, while 1 was assigned to flooded pixels. The flood extent was calculated by multiplying the number of pixels with a value of 1 by the pixel size of 10 10 m2 in each study area.
For water volume calculation, only DEM data and flood extent were considered. Wang et al. computed water volume by multiplying the difference DEM value by cell size of water column [42]. This computation method is simple and easy, yet practical. For using this method, the surface of water within the Xe-Namnoy reservoir was assumed to be flat in this study. Next, the highest elevation within the flood extent of the Xe-Namnoy reservoir was identified, and the elevation difference was calculated by subtracting the highest elevation value from each pixel’s elevation value within the flood extent. The amount of water released by the dam collapse was calculated by multiplying the elevation difference obtained through this process with the flood extent of the Xe-Namnoy reservoir.
4. Results
In this study, the volume of water released from the Xe-Namnoy reservoir after the dam collapse was calculated using Sentinel-1 intensity data. In the image of the Xe-Namnoy reservoir before the dam collapse, the water system appears to have developed primarily in the southwest direction, but also to have appeared in various other directions (Figure 1a). However, compared to the image of Xe-Namnoy reservoir prior to the dam collapse, the water quantity in the reservoir after the dam collapse appears significantly reduced overall. In particular, most of the water stored on the right side of the water system from the north-south perspective appeared to be released, and the water system in that area was reduced in size, while a large amount of water outflowed to the southwest and south of the reservoir (Figure 6a).
Prior to the collapse of the dam, the Hinlat area was mostly covered with bare soil and a river with a 50 m width was present around 106°27’E to 106°30’E (Figure 1a). However, in the image taken after the dam collapsed, the width of the river near 14°45’N 106°28’E was about 120 m, more than double the width before the dam collapse (Figure 6b). Additionally, flooding due to the dam collapse was observed along the Vang Nagao River, which is located between longitudes of 106°27’E and 106°30’E, and the area of bare soil between longitudes of 106°27’E to 106°31’E and latitudes of 14°44’N to 14°45’N. In addition to flooding around the Vang Nagao River in the Hinlat area, quite large flood extent was also detected far from the river in the Hinlat area, between longitudes of 106°30’E to 106°34’E and latitudes of 14°42’N to 14°44’N (Figure 6b).
To quantitatively calculate the amount of water released from the Xe-Namnoy reservoir and the resulting flooding in the Hinlat area, the difference between the image taken after the dam collapse and the reference image (Table 1) was computed for each pass direction, and then the flood extent was calculated. The results confirmed that the surface area of water in the Xe-Namnoy reservoir continuously decreased (around −8.909 104 m2/day), and the area damaged by flooding in the Hinlat area gradually decreased (around −8.691 105 m2/day) (Figure 7). The slope of the fitting curve line was assumed to be the rate of flood extent reduction. The rate of flood extent reduction in the Hinlat area was about 10 times faster than the rate of water level decline in the Xe-Namnoy reservoir. Therefore, it is thought that the rate of flood extent reduction in the Hinlat area is faster than the rate at which water is drained from the deep reservoir.
In the Xe-Namnoy reservoir area, stored water decreased due to the dam collapse, causing the area of the water system to become smaller than that before the dam collapse (Figure 7a). Compared to the image from 13 July 2018, water area was reduced by about 17.8 km2 on 25 July 2018 and about 19.7 km2 on 06 08 2018. On 18 August 2018, however, the water area increased by about 1.8 km2 compared to that on 06 08 2018. Accurate analysis of the cause for this change is hard due to limitations of the available data, but it is highly likely that it rained during that period considering that May to September is the rainy season in Laos. The trend of decreasing water area is more distinct in the ascending image than the descending image. After the dam collapse on 23 July 2018, the surface area of water stored in the Xe-Namnoy reservoir continued to decrease, reducing the total area to about 21.0 km2 after three months.
The Hinlat area, which is mostly covered by bare soil, was flooded with a large amount of water due to the dam collapse, and the flooded area gradually decreased as the water drained (Figure 7b). Compared to 13 July 2018, flooding was detected in an area of about 28.1 km2 on 25 July 2018 and about 18.1 km2 on August 6, and the areal extent of flooding decreased over time. However, in accordance with the graph of the Xe-Namnoy reservoir, the flooding area increased to 21.0 km2 on August 18, which was about 3.0 km2 greater than the area observed on 06 August 2018. After the dam collapse on 23 July 2018, the flood extent in the Hinlat area continued to decrease. Due to this trend, the areal flood extent was below 1.0 km2 in all images taken after October. The decreasing trend of flood extent, however, was more distinct in the ascending image than in the descending image, as shown in the area graph of the Xe-Namnoy reservoir. The reason for different results by orbit is described in Section 5.
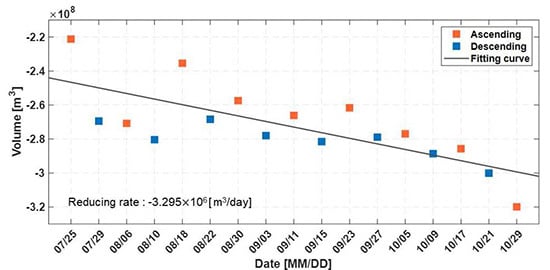
For quantitative calculation of the quantity of water released due to the dam collapse, the change in volume of water in Xe-Namnoy reservoir was computed using DEM data (Figure 8). Compared to the total volume of water before the dam collapse, about 2.2 108 m3 of water outflowed on 25 July 2018, which is two days after the collapse. Despite the fact that it was not immediately after the collapse, quite a large amount of water flowed out and the amount of water in the reservoir continued to decrease during the research period (about −3.295 106 m3/day). Compared to 13 July 2018, about 3.2 108 m3 of water was released by 29 October 2018, representing a difference of about 1.0 108 m3 from the volume on 25 July 2018, which was immediately after the dam collapse (Figure 8).
5. Discussion and Conclusions
For quick recovery and damage prevention, flood monitoring via remote sensing is necessary.
In this study, the amount of water released from Xe-Namnoy reservoir and the resulting flooded area around Hinlat were computed using Sentinel-1 GRD images acquired before and after the collapse of the Xe-Namnoy Dam in Laos. The results confirmed that the outflow volume decreased in the Xe-Namnoy reservoir as the area of water stored in the reservoir decreased over time. Only two days after the dam collapse, about 2.2 108 m3 water was released from the Xe-Namnoy reservoir. This water flowed along the Vang Nagao River, causing major damage in the Hinlat area.
The correlation between the two study areas over time was analyzed based on changes in water area, volume of water, and flooded area over time using 17 images taken after the dam collapsed. Because water from Xe-Namnoy reservoir flowed into the Hinlat area along the Vang Nagao River, the area and volume results on 25 July 2018, immediately after the dam collapse, should be correlated between the two regions.
Although both the water volume of the Xe-Namnoy reservoir and the flood extent of the Hinlat area were decreasing over time, it was confirmed that there were more distinct changes in the ascending images than the descending ones. Some previous researches have confirmed that backscatter coefficient values are slightly different depending on the operating orbit, even if the data had been acquired in the same region with similar weather conditions [43,44]. Dumitru et al. confirmed that it is classified with approximately 7–8% higher accuracy in ascending images than descending images [43]. Mahdavi et al. compared backscatter coefficients of ascending and descending images of the spring and winter seasons under similar conditions, respectively. In their study, since evapotranspiration does not occur and water freezes in winter, wind has little effect on surface roughness. Thus, there was little difference between backscatter values of the ascending images and descending images. However, they identified that the backscatter values in the water portion acquired in the spring season showed a difference of more than about 5dB between the ascending and descending images [44]. In this study, likewise, it was confirmed that backscatter coefficients slightly differ in ascending and descending images which were acquired in the same time period. The main objective of this study is to detect flood extents as quickly as possible that change over time regardless of the orbit. Thus, it is hoped that further studies on results that differ by orbit would be conducted in the future.
Furthermore, the results should have been validated by using the proven reference data. For instance, optical data and field data could be useful reference data for flood area calculation. Since this study uses only the backscatter coefficient value for the purpose of rapid detection, there is a limit to the accuracy confidence of the flood extent. In the future study, more improved research would be carried out by considering validation process through other data to the calculation of the flood area.
In this study, two main changes caused by the saddle dam collapse were detected using 19 Sentinel-1 GRD data. The first change was that the water surface area and water volume decreased in the Xe-Namnoy reservoir as a huge amount of water stored was released following the dam collapse. The other change was that flood extent, caused by the outflow of water from the Xe-Namnoy reservoir in the Hinlat area, was reduced over time.
Comparing the flood extent of the Xe-Namnoy reservoir with that of Hinlat area, the flood extents in both study sites continuously decreased during the research period. The rate of flood extent reduction was confirmed to be almost 10 times faster in the Hinlat area than in the Xe-Namnoy reservoir. After the saddle dam collapse on 23 July, the difference in flood extent between 25 July 2018 and 29 October 2018 in the Xe-Namnoy reservoir was 3,196,900 m2 and the difference in the Hinlat area was 21,824,500 m2. The total amount of water that flowed out of the Xe-Namnoy reservoir during the period from 25 July 2018 through 29 October 2018 was 98,740,100 m3. These remarkable changes represent that the voluminous water which flowed out from the Xe-Namnoy reservoir inundated the Hinlat area.
In conclusion, change detection of the flood extent and volume in this study can be implemented in near real-time flood detection. The results of this study represent the meaningful analysis using the SAR GRD data through the detection of quantitative change in the Xe-Namnoy reservoir and the Hinlat area. In this study, there were some limitations that SAR GRD images alone were insufficient for determining the correlation between the two study areas. The correlation between the two study areas could be more clearly demonstrated by using data such as geological information and images of the area of the Vang Nagao River downstream of the Hinlat region. Through verifications using the optical data or InSAR coherence data, accuracy of flood extent calculation could improve, and then, flood extent would be computed more accurately in the future. Specifically, more accurate results could be derived using optical data or interferometric SAR (InSAR) data, e.g., from the KOMPSAT series or Sentinel series. Especially, interferometric coherence of InSAR data would be useful when correlating flood area because it detects the change in the slave image based on the master image.
Author Contributions
Conceptualization, Y.K. and M.-J.L.; Data curation, Y.K.; Formal analysis, Y.K.; Investigation, Y.K. and M.-J.L.; Methodology, Y.K. and M.-J.L.; Project administration, M.-J.L.; Resources, Y.K.; Software, Y.K.; Supervision, M.-J.L.; Validation, Y.K. and M.-J.L.; Visualization, Y.K.; Writing—original draft, Y.K.; Writing—review and editing, M.-J.L. All authors have read and agreed to the published version of the manuscript.
Funding
This research was conducted at Korea Environment Institute (KEI) with support from ‘Service Program for Demand-Responsive Water Supply’ by Korea Environment Industry & Technology Institute (KEITI), and funded by Korea Ministry of Environment (MOE) (2019002650001) and with support from the Basic Science Research Program through the National Research Foundation of Korea (NRF) funded by the Ministry of Education (NRF-2018R1D1A1B07041203).
Acknowledgments
The authors thanks to K-water Research Institute.
Conflicts of Interest
The authors declare no conflict of interest.
References
- Hirabayashi, Y.; Mahendran, R.; Koirala, S.; Konoshima, L.; Yamazaki, D.; Watanabe, S.; Kim, H.; Kanae, S. Global flood risk under climate change. Nat. Clim. Chang. 2013, 3, 816–821. [Google Scholar] [CrossRef]
- Kundzewicz, Z.W.; Ulbrich, U.; Graczyk, D.; Krüger, A.; Leckebusch, G.C.; Menzel, L.; Pińskwar, I.; Radziejewski, M.; Szwed, M. Summer floods in Central Europe–climate change track? Nat. Hazards 2005, 36, 165–189. [Google Scholar] [CrossRef]
- Pielke, R.A., Jr.; Downton, M.W. Precipitation and damaging floods: Trends in the United States, 1932–1997. J. Clim. 2000, 13, 3625–3637. [Google Scholar] [CrossRef] [Green Version]
- Amarnath, G. An algorithm for rapid flood inundation mapping from optical data using a reflectance differencing technique. J. Flood Risk Manag. 2013, 7, 239–250. [Google Scholar] [CrossRef]
- Li, J.; Yang, X.; Ma_ei, C.; Tooth, S.; Yao, G. Applying Independent Component Analysis on Sentinel-2 Imagery to Characterize Geomorphological Responses to an Extreme Flood Event near the Non-Vegetated. Río Colorado Terminus, Salar de Uyuni, Bolivia. Remote Sens. 2018, 10, 725. [Google Scholar] [CrossRef] [Green Version]
- Ogilvie, A.; Belaud, G.; Delenne, C.; Bailly, J.S.; Bader, J.C.; Oleksiak, A.; Ferry, L.; Martin, D. Decadal monitoring of the Niger Inner Delta flood dynamics using MODIS optical data. J. Hydrol. 2015, 523, 368–383. [Google Scholar] [CrossRef] [Green Version]
- Rokni, K.; Ahmad, A.; Selamat, A.; Hazini, S. Water feature extraction and change detection using multitemporal landsat imagery. Remote Sens. 2014, 6, 4173–4189. [Google Scholar] [CrossRef] [Green Version]
- Sun, D.L.; Yu, Y.Y.; Goldberg, M.D. Deriving water fraction and flood maps from MODIS images using a decision tree approach. IEEE J. Sel. Top. Appl. Earth Obs. Remote Sens. 2011, 4, 814–825. [Google Scholar] [CrossRef]
- Jung, Y.T.; Park, S.-E.; Baek, C.-S.; Kim, D.-H. Evaluation of polarimetric parameters for flood detection using PALSAR-2 quad-pol data. Korean J. Remote Sens. 2018, 34, 117–126. [Google Scholar]
- Kussul, N.; Shelestov, A.; Skakun, S. Flood monitoring from SAR data. In Use of Satellite and In-Situ Data to Improve Sustainability; Springer: Heidelberg, Germany, 2011; pp. 19–29. [Google Scholar]
- Martinis, S.; Twele, A.; Voigt, S. Unsupervised extraction of flood-induced backscatter changes in SAR data using Markov image modeling on irregular graphs. IEEE Trans. Geosci. Remote. Sens. 2010, 49, 251–263. [Google Scholar] [CrossRef]
- Refice, A.; Capolongo, D.; Pasquariello, G.; D’Addabbo, A.; Bovenga, F.; Nutricato, R.; Lovergine, F.P.; Pietranera, L. SAR and InSAR for flood monitoring: Examples with COSMO-SkyMed data. IEEE J. Sel. Top. Appl. Earth Obs. Remote. Sens. 2014, 7, 2711–2722. [Google Scholar] [CrossRef]
- Schlaffer, S.; Matgen, P.; Hollaus, M.; Wagner, W. Flood detection from multi-temporal SAR data using harmonic analysis and change detection. Int. J. Appl. Earth Obs. 2015, 38, 15–24. [Google Scholar] [CrossRef]
- Imperatore, P.; Azar, R.; Calo, F.; Stroppiana, D.; Brivio, P.A.; Lanari, R.; Pepe, A. Effect of the vegetation fire on backscattering: An investigation based on Sentinel-1 observations. IEEE J. Sel. Top. Appl. Earth Obs. Remote. Sens. 2017, 10, 4478–4492. [Google Scholar] [CrossRef]
- Martinis, S.; Plank, S.; Ćwik, K. The use of Sentinel-1 time-series data to improve flood monitoring in arid areas. Remote Sens. 2018, 10, 583. [Google Scholar] [CrossRef] [Green Version]
- Navarro, G.; Caballero, I.; Silva, G.; Parra, P.-C.; Vázquez, Á.; Caldeira, R. Evaluation of forest fire on Madeira Island using Sentinel-2A MSI imagery. Int. J. Appl. Earth Obs. 2017, 58, 97–106. [Google Scholar] [CrossRef] [Green Version]
- Twele, A.; Cao, W.; Plank, S.; Martinis, S. Sentinel-1-based flood mapping: A fully automated processing chain. Int. J. Remote Sens. 2016, 37, 2990–3004. [Google Scholar] [CrossRef]
- Amitrano, D.; Di Martino, G.; Iodice, A.; Riccio, D.; Ruello, G. Unsupervised Rapid Flood Mapping Using Sentinel-1 GRD SAR Images. IEEE Trans. Geosci. Remote Sens. 2018, 56, 3290–3299. [Google Scholar] [CrossRef]
- Bioresita, F.; Puissant, A.; Stumpf, A.; Malet, J.-P. A Method for Automatic and Rapid Mapping of Water Surfaces from Sentinel-1 Imagery. Remote Sens. 2018, 10, 217. [Google Scholar] [CrossRef] [Green Version]
- Tavus, B.; Kocaman, S.; Gokceoglu, C.; Nefeslioglu, H.A. Considerations on the use of Sentinel-1 data in flood mapping in urban areas: Ankara (Turkey) 2018 floods. Int. Arch. Photogramm. Remote Sens. Spat. Inf. Sci. 2018, XLII-5, 575–581. [Google Scholar] [CrossRef] [Green Version]
- Carreño Conde, F.; De Mata Muñoz, M. Flood Monitoring Based on the Study of Sentinel-1 SAR Images: The Ebro River Case Study. Water 2019, 11, 2454. [Google Scholar] [CrossRef] [Green Version]
- Tsyganskaya, V.; Martinis, S.; Marzahn, P. Flood Monitoring in Vegetated Areas Using Multitemporal Sentinel-1 Data: Impact of Time Series Features. Water 2019, 11, 1938. [Google Scholar] [CrossRef] [Green Version]
- Kidd, C.; Levizzani, V.; Turk, J.; Ferraro, R. Satellite Precipitation Measurements for Water Resource Monitoring 1. J. Am. Water Resour. 2009, 45, 567–579. [Google Scholar] [CrossRef]
- Kim, S.; Lee, Y. Present Status and Future Prospect of Satellite Image Uses in Water Resources Area. Korean J. Ecol. Environ. 2018, 51, 105–123. [Google Scholar]
- Brakenridge, G.; Tracy, B.; Knox, J. Orbital SAR remote sensing of a river flood wave. Int. J. Remote Sens. 1998, 19, 1439–1445. [Google Scholar] [CrossRef]
- Clement, M.; Kilsby, C.; Moore, P. Multi-temporal synthetic aperture radar flood mapping using change detection. J. Flood Risk Manag. 2018, 11, 152–168. [Google Scholar] [CrossRef]
- Jain, S.K.; Singh, R.; Jain, M.; Lohani, A. Delineation of flood-prone areas using remote sensing techniques. Water Resour. Manag. 2005, 19, 333–347. [Google Scholar] [CrossRef]
- Sanyal, J.; Lu, X. Application of remote sensing in flood management with special reference to monsoon Asia: A review. Nat. Hazards 2004, 33, 283–301. [Google Scholar] [CrossRef]
- Cheng, S.; Zhao, W.; Yin, Z. PS-InSAR Analysis of Collapsed Dam and Extraction of Flood Inundation Areas in Laos Using Sentinel-1 SAR Images. In Proceedings of the 2019 IEEE 4th Advanced Information Technology, Electronic and Automation Control Conference (IAEAC), Chengdu, China, 20–22 December 2019; pp. 2605–2608. [Google Scholar]
- Giustarini, L.; Hostache, R.; Matgen, P.; Schumann, G.J.-P.; Bates, P.D.; Mason, D.C. A change detection approach to flood mapping in urban areas using TerraSAR-X. IEEE Trans. Geosci. Remote. Sens. 2012, 51, 2417–2430. [Google Scholar] [CrossRef] [Green Version]
- Giustarini, L.; Hostache, R.; Kavetski, D.; Chini, M.; Corato, G.; Schlaffer, S.; Matgen, P. Probabilistic flood mapping using synthetic aperture radar data. IEEE Trans. Geosci. Remote. Sens. 2016, 54, 6958–6969. [Google Scholar] [CrossRef]
- Matgen, P.; Hostache, R.; Schumann, G.; Pfister, L.; Hoffmann, L.; Savenije, H. Towards an automated SAR-based flood monitoring system: Lessons learned from two case studies. Phys. Chem. Earth 2011, 36, 241–252. [Google Scholar] [CrossRef]
- Park, S.-E. Detection of water bodies from Kompsat-5 SAR data. Korean J. Remote Sens. 2016, 32, 539–550. [Google Scholar] [CrossRef] [Green Version]
- Ulaby, F.T.M. Microwave Remote Sensing: Active and Passive. Volume 1-Microwave Remote Sensing Fundamentals and Radiometry; Addison-Wesley: Boston, MA, USA, 1981. [Google Scholar]
- Bourbigot, M.; Johnsen, H.; Piantanida, R.; Hajduch, G. Sentinel-1 product definition. In MDA Document Number: SEN-RS-52–7440; Reference S1-RS-MDA-52-7440; ESA: Frascati, Italy, 2016. [Google Scholar]
- Caprari, R.S.; Goh, A.S.; Moffatt, E.K. Noise and speckle reduction in synthetic aperture radar imagery by nonparametric Wiener filtering. Appl. Opt. 2000, 39, 6633–6640. [Google Scholar] [CrossRef] [PubMed]
- Solbo, S.; Eltoft, T. A stationary wavelet-domain wiener filter for correlated speckle. IEEE Trans. Geosci. Remote. Sens. 2008, 46, 1219–1230. [Google Scholar] [CrossRef]
- Buades, A.; Coll, B.; Morel, J.M. A review of image denoising algorithms, with a new one. Multiscale Model. Simul. 2005, 4, 490–530. [Google Scholar] [CrossRef]
- Chini, M.; Pelich, R.; Pulvirenti, L.; Pierdicca, N.; Hostache, R.; Matgen, P. Sentinel-1 InSAR coherence to detect floodwater in urban areas: Houston and Hurricane Harvey as a test case. Remote Sens. 2019, 11, 107. [Google Scholar] [CrossRef] [Green Version]
- Liang, Y.; Chen, W. A survey on computing Lévy stable distributions and a new MATLAB toolbox. Signal Process. 2013, 93, 242–251. [Google Scholar] [CrossRef]
- Nolan, J. Stable Distributions: Models for Heavy-Tailed Data; Birkhauser: New York, NY, USA, 2003. [Google Scholar]
- Wang, Y.; Liao, M.; Sun, G.; Gong, J. Analysis of the water volume, length, total area and inundated area of the Three Gorges Reservoir, China using the SRTM DEM data. Int. J. Remote Sens. 2005, 26, 4001–4012. [Google Scholar] [CrossRef]
- Dumitru, C.O.; Datcu, M. Information content of very high resolution SAR images: Study of feature extraction and imaging parameters. IEEE Trans. Geosci. Remote Sens. 2013, 51, 4591–4610. [Google Scholar] [CrossRef]
- Mahdavi, S.; Amani, M.; Maghsoudi, Y. The effects of orbit type on synthetic aperture RADAR (SAR) backscatter. Remote Sens. Lett. 2019, 10, 120–128. [Google Scholar] [CrossRef]
Figure 1.
Map of the study area showing the locations of the study sites. (a) Xe-Namnoy reservoir, (b) Hinlat area. The four saddle dams are indicated with blue triangle. Saddle Dam D, which collapsed on 23 July 2018, is marked with a red star.
Figure 1.
Map of the study area showing the locations of the study sites. (a) Xe-Namnoy reservoir, (b) Hinlat area. The four saddle dams are indicated with blue triangle. Saddle Dam D, which collapsed on 23 July 2018, is marked with a red star.

Figure 2.
DEM images at (a) Xe-Namnoy reservoir, (b) Hinlat area.

Figure 3.
Landsat 8 image of the Hinlat area acquired on 16 01 2018, before the dam collapsed.

Figure 4.
Flowchart for the calculation of flood extent and volume.

Figure 5.
Histogram and -stable distribution fitting for the difference image difference image between August 6 and July 13 at (a) Xe-Namnoy reservoir and (b) Hinlat area.
Figure 5.
Histogram and -stable distribution fitting for the difference image difference image between August 6 and July 13 at (a) Xe-Namnoy reservoir and (b) Hinlat area.

Figure 6.
Intensity image acquired on 25 July 2018, after the dam collapse at (a) Xe-Namnoy reservoir, and (b) Hinlat area.
Figure 6.
Intensity image acquired on 25 July 2018, after the dam collapse at (a) Xe-Namnoy reservoir, and (b) Hinlat area.

Figure 7.
Two graphs showing gradual decreases in (a) the water area at the Xe-Namnoy reservoir, and (b) the area of flooding in the Hinlat region.
Figure 7.
Two graphs showing gradual decreases in (a) the water area at the Xe-Namnoy reservoir, and (b) the area of flooding in the Hinlat region.

Figure 8.
Graph showing gradually decreasing water volume in the Xe-Namnoy reservoir.


Table 1.
Sentinel-1 SAR images used for water outflow detection.
| Acquisition Date | Orbit | Track | Note |
|---|---|---|---|
| 13 July 2018 | Ascending | 128 | * Pre-event |
| 17 July 2018 | Descending | 18 | ** Pre-event |
| 25 July 2018 | Ascending | 128 | Post-event |
| 29 July 2018 | Descending | 18 | Post-event |
| 6 August 2018 | Ascending | 128 | Post-event |
| 10 August 2018 | Descending | 18 | Post-event |
| 18 August 2018 | Ascending | 128 | Post-event |
| 22 August 2018 | Descending | 18 | Post-event |
| 30 August 2018 | Ascending | 128 | Post-event |
| 03 September 2018 | Descending | 18 | Post-event |
| 11 September 2018 | Ascending | 128 | Post-event |
| 15 September 2018 | Descending | 18 | Post-event |
| 23 September 2018 | Ascending | 128 | Post-event |
| 27 September 2018 | Descending | 18 | Post-event |
| 5 October 2018 | Ascending | 128 | Post-event |
| 9 October 2018 | Descending | 18 | Post-event |
| 17 October 2018 | Ascending | 128 | Post-event |
| 21 October 2018 | Descending | 18 | Post-event |
| 29 October 2018 | Ascending | 128 | Post-event |
* Image used as the reference image in ascending images. ** Image used as the reference image in descending images.
© 2020 by the authors. Licensee MDPI, Basel, Switzerland. This article is an open access article distributed under the terms and conditions of the Creative Commons Attribution (CC BY) license (http://creativecommons.org/licenses/by/4.0/).
Share and Cite
MDPI and ACS Style
Kim, Y.; Lee, M.-J. Rapid Change Detection of Flood Affected Area after Collapse of the Laos Xe-Pian Xe-Namnoy Dam Using Sentinel-1 GRD Data. Remote Sens. 2020, 12, 1978. https://doi.org/10.3390/rs12121978
AMA Style
Kim Y, Lee M-J. Rapid Change Detection of Flood Affected Area after Collapse of the Laos Xe-Pian Xe-Namnoy Dam Using Sentinel-1 GRD Data. Remote Sensing. 2020; 12(12):1978. https://doi.org/10.3390/rs12121978
Chicago/Turabian StyleKim, Yunjee, and Moung-Jin Lee. 2020. "Rapid Change Detection of Flood Affected Area after Collapse of the Laos Xe-Pian Xe-Namnoy Dam Using Sentinel-1 GRD Data" Remote Sensing 12, no. 12: 1978. https://doi.org/10.3390/rs12121978
Note that from the first issue of 2016, this journal uses article numbers instead of page numbers. See further details here.