Coastline Fractal Dimension of Mainland, Island, and Estuaries Using Multi-temporal Landsat Remote Sensing Data from 1978 to 2018: A Case Study of the Pearl River Estuary Area


Abstract
:
1. Introduction
- To classify the coastline of the Pearl River Estuary as estuarine, mainland, and island coastlines, and then calculate the coastline length and FD of each type of coastline.
- To analyze the reasons for the length increases and differences between different types of coastlines and discuss comparisons between estuaries and Parts I–IV of the main body.
- To analyze the reasons for variations in FD throughout the 40-year time period and how different circumstances influenced the FD.
- To discuss how natural and anthropogenic factors impacted on FD and coastline length, and compare the FD of the study site with other coastal areas of China.
2. Materials and Methods
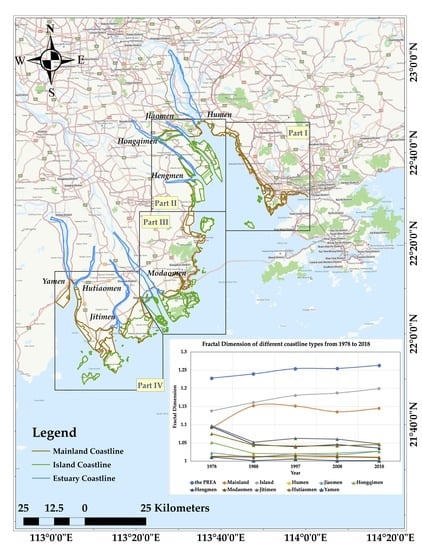
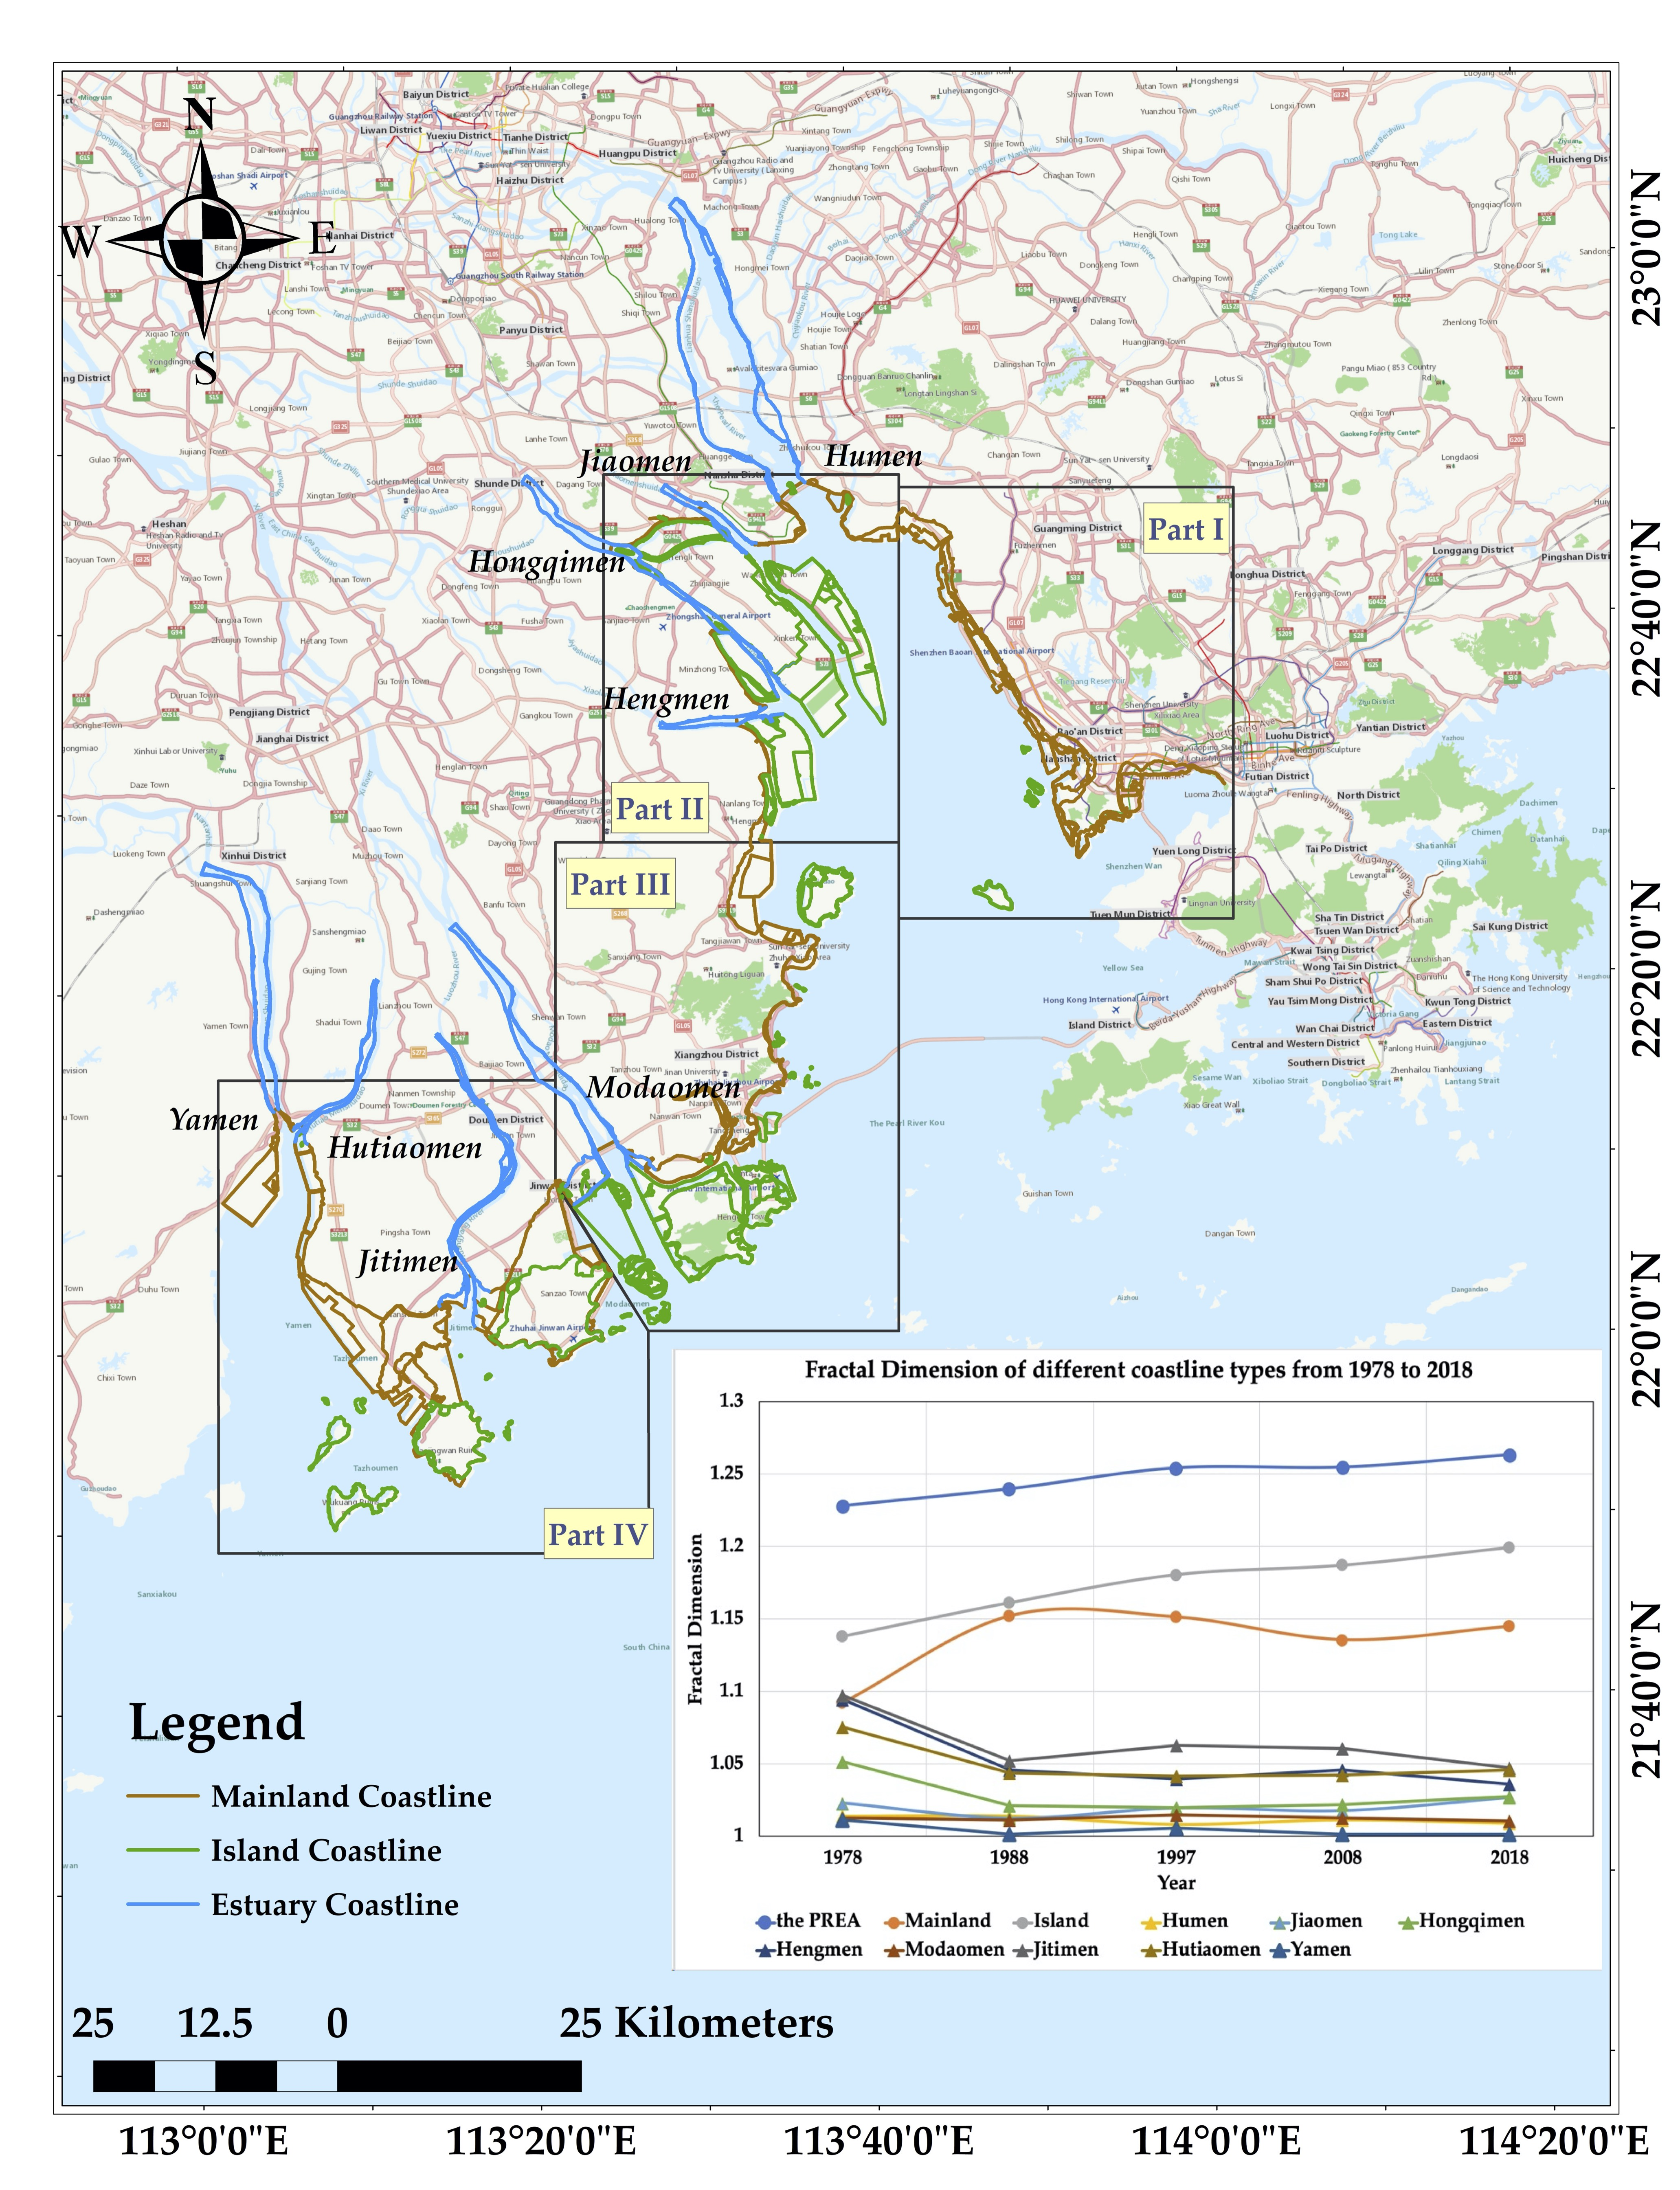
2.1. Study Area
2.2. Remote Sensing Dataset
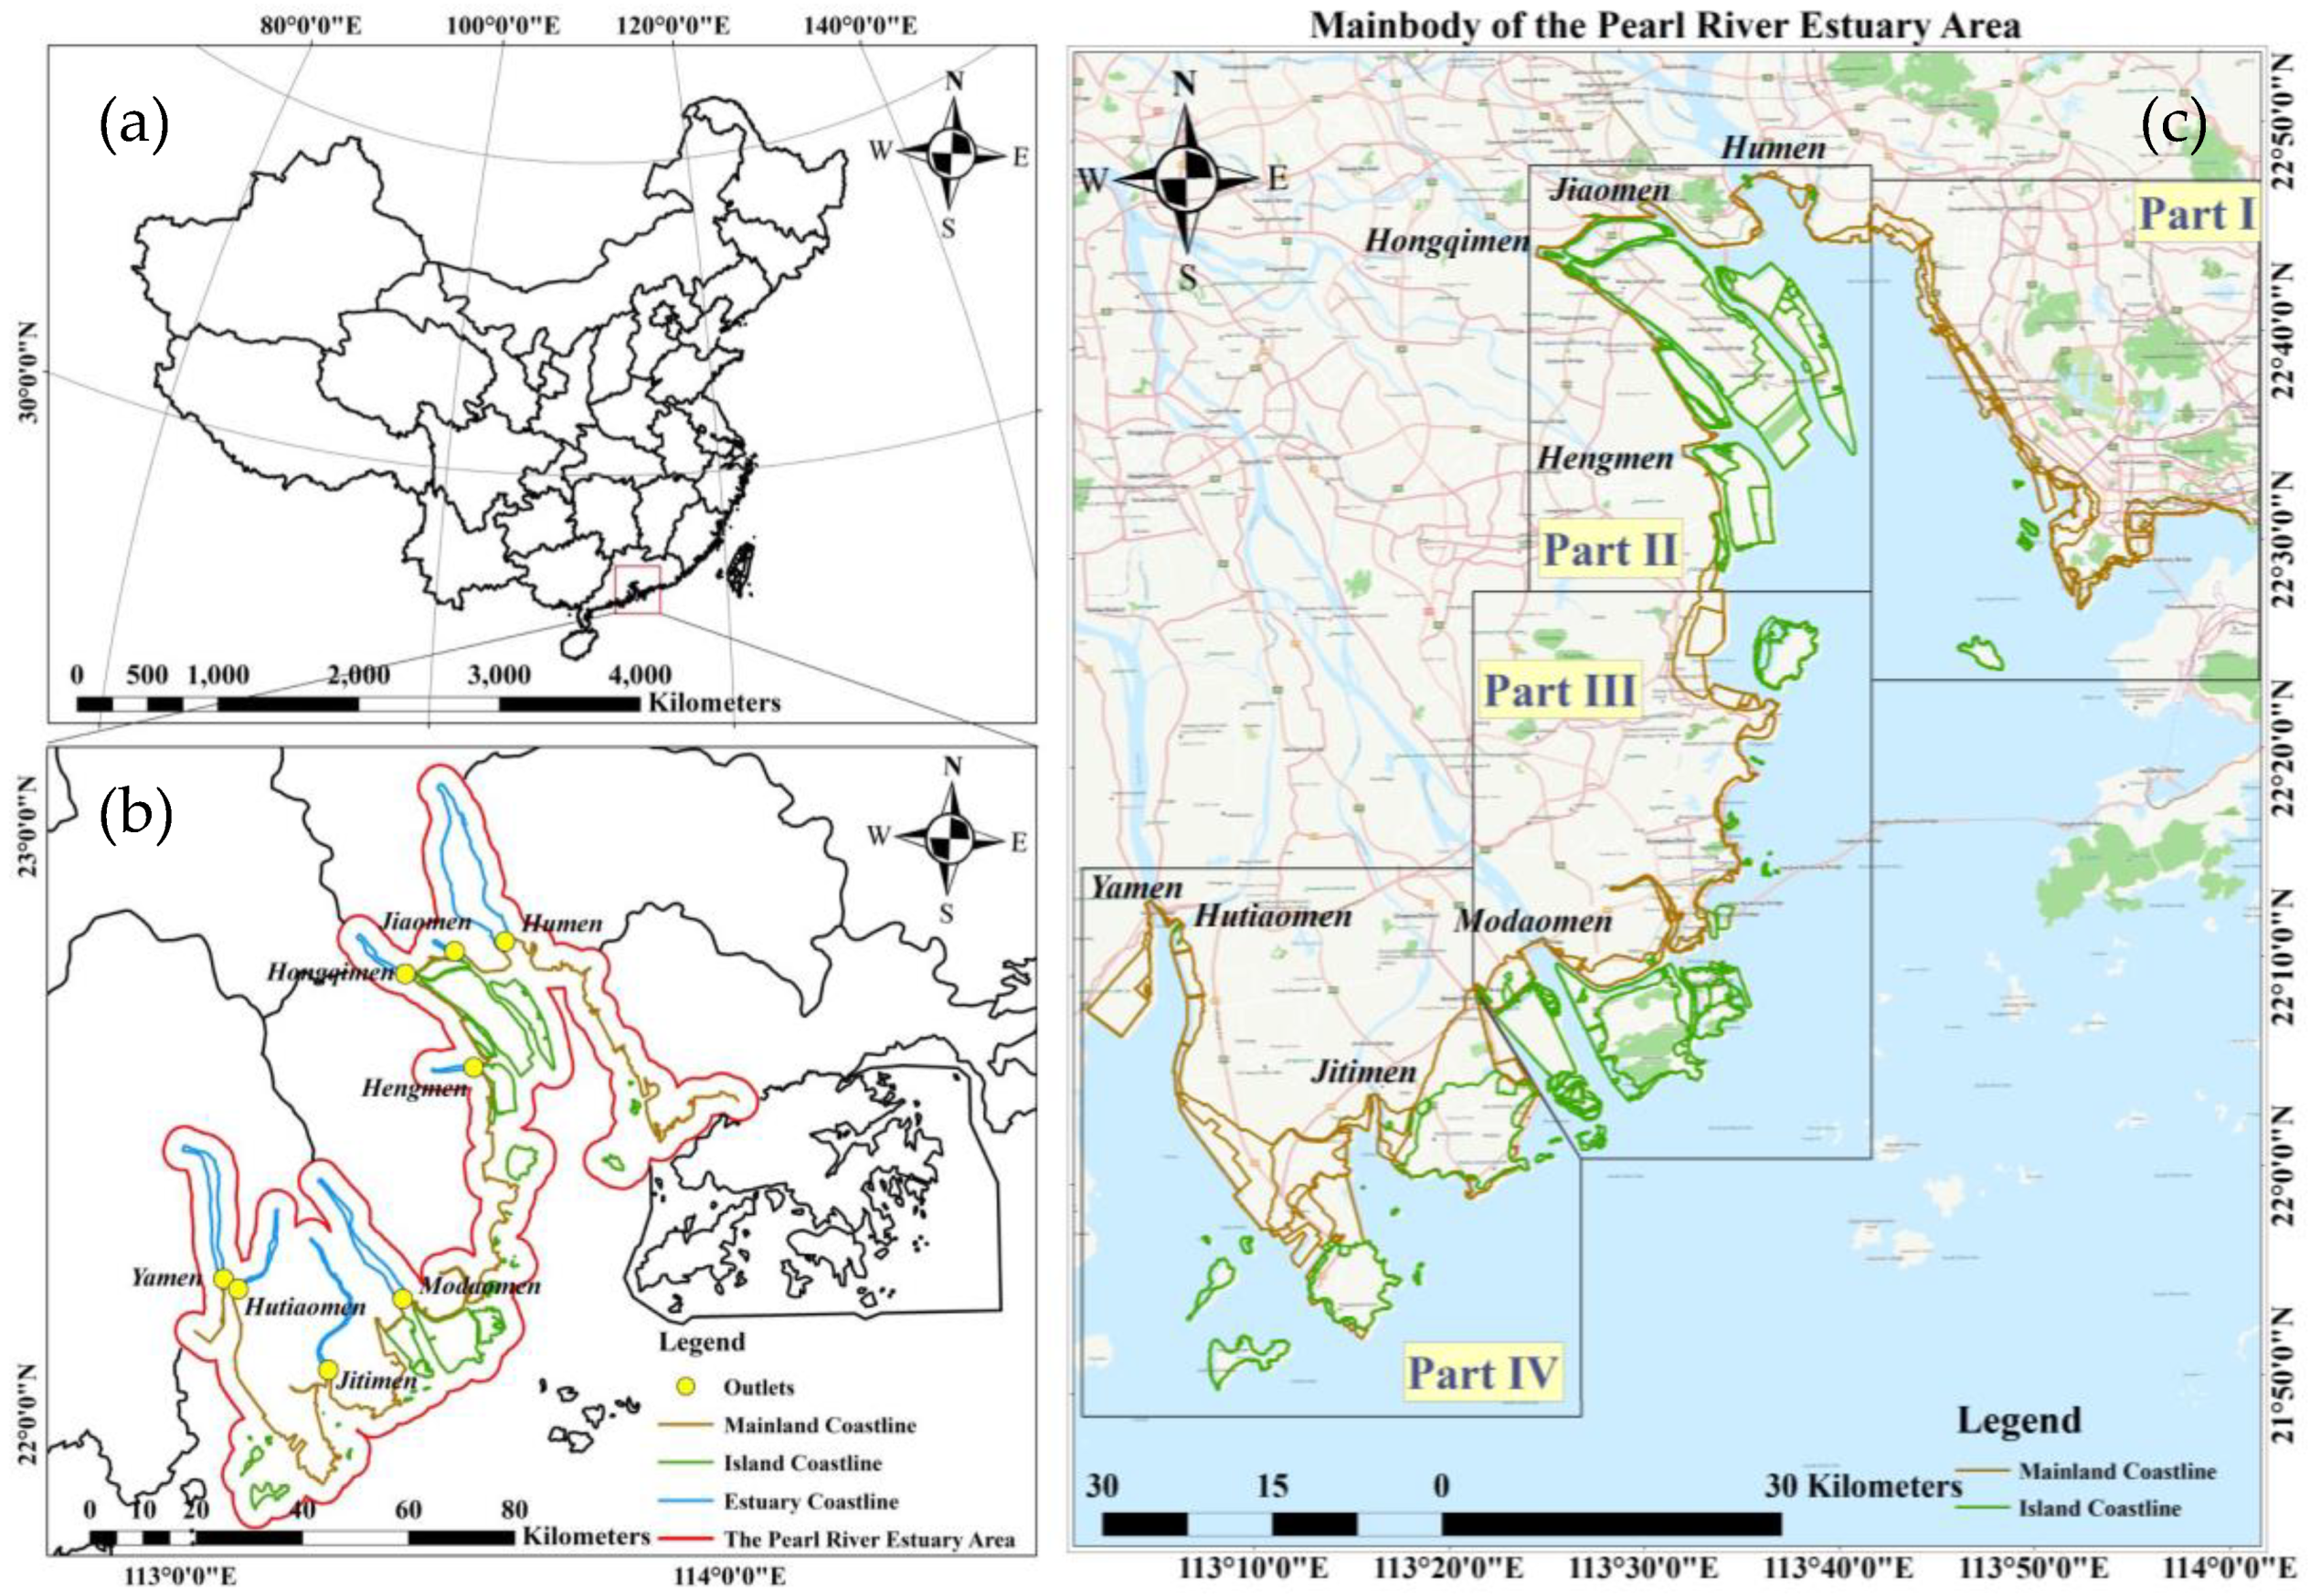
2.3. Coastline Extraction and Accuracy Assessment
2.4. Fractal Dimension Calculation
3. Results
3.1. Result of Accuracy Assessment
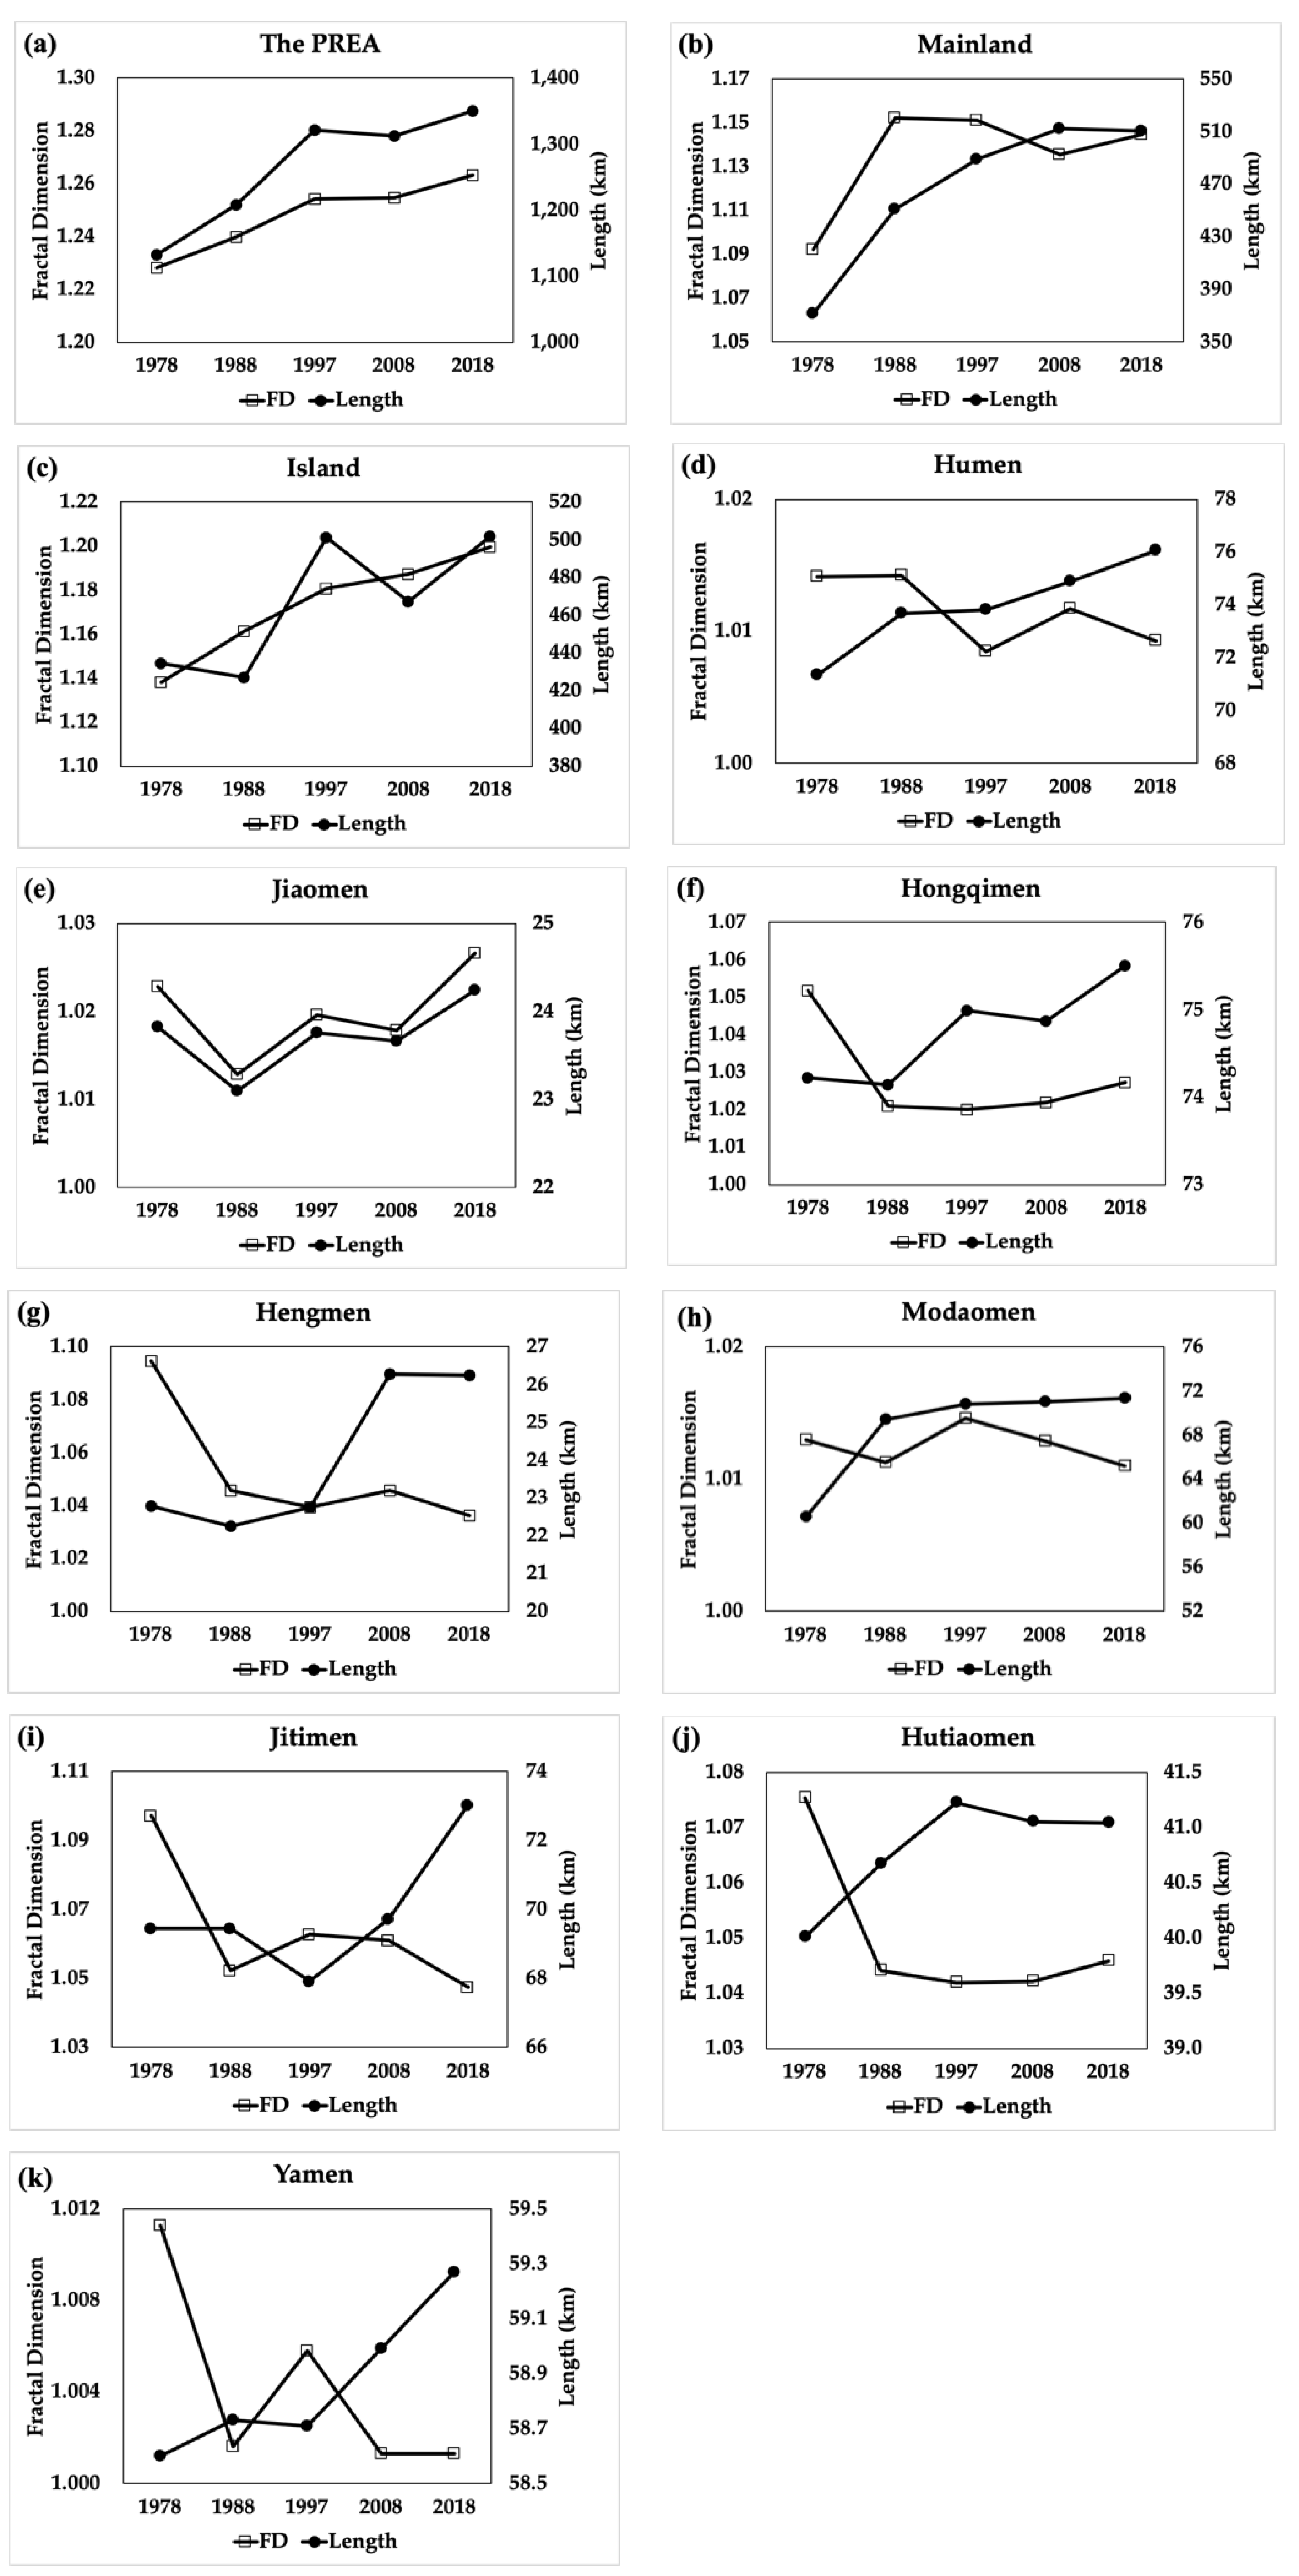
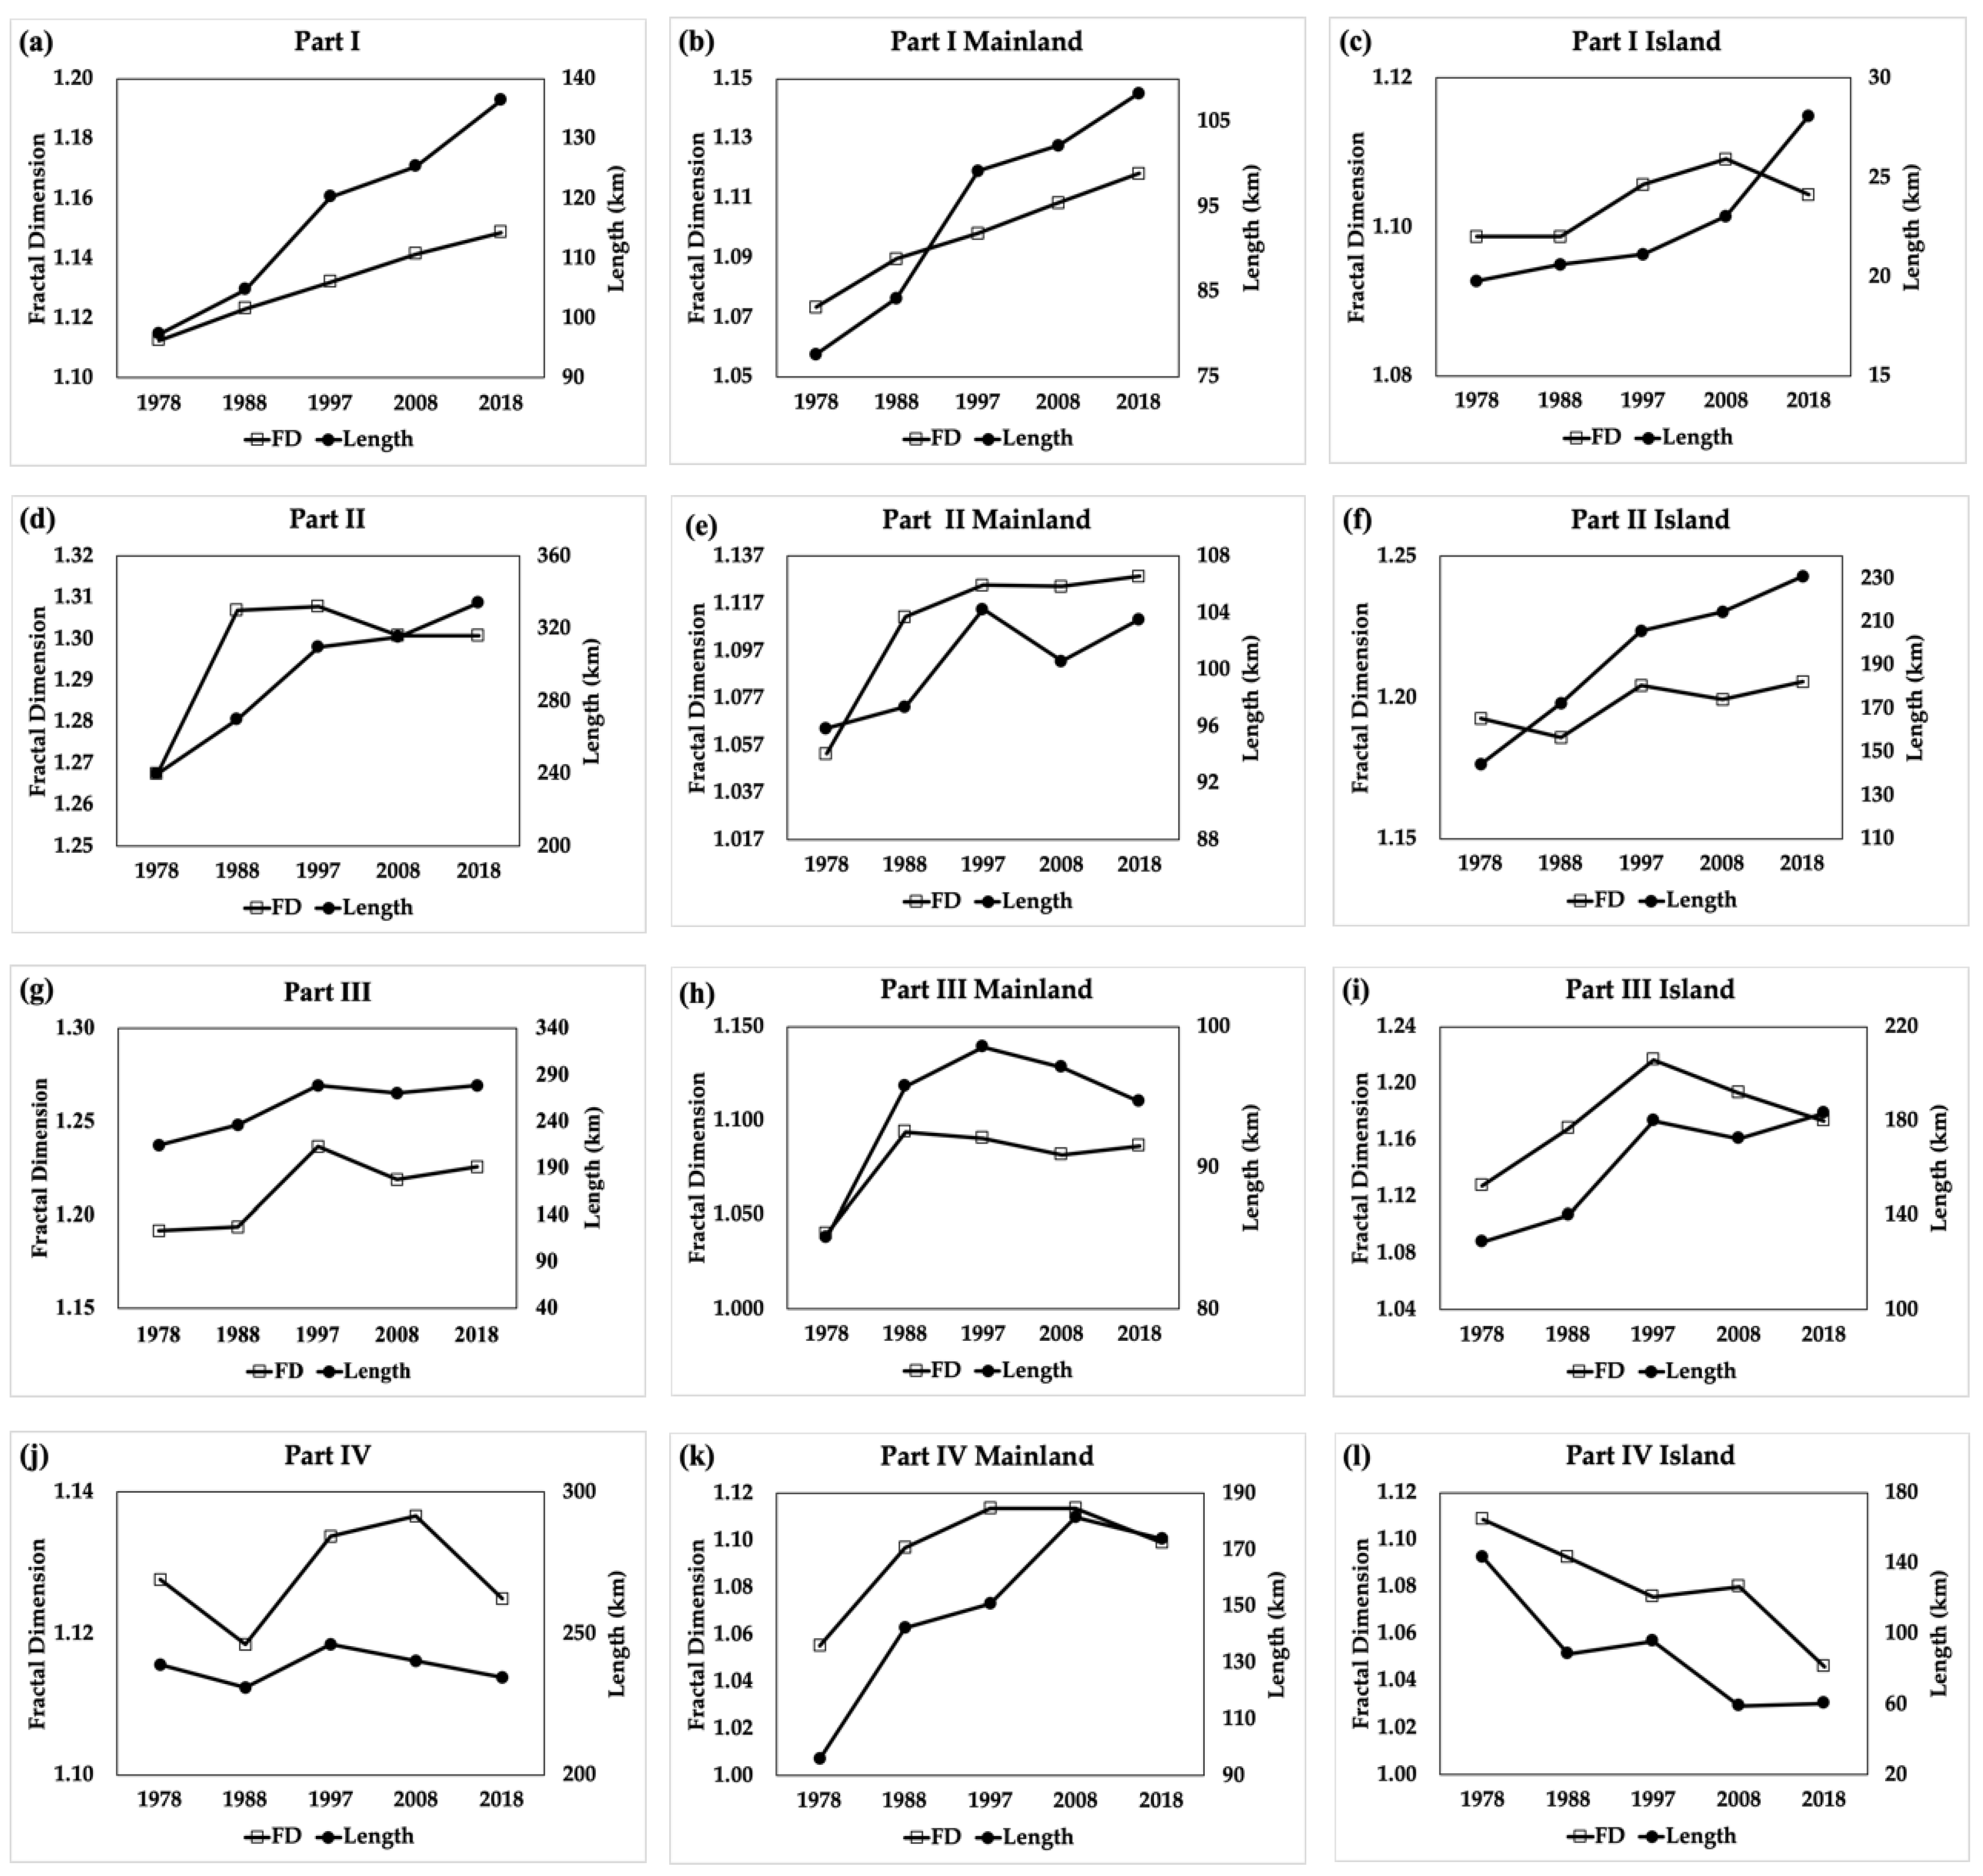
3.2. Length of Coastlines
3.3. Fractal Dimension
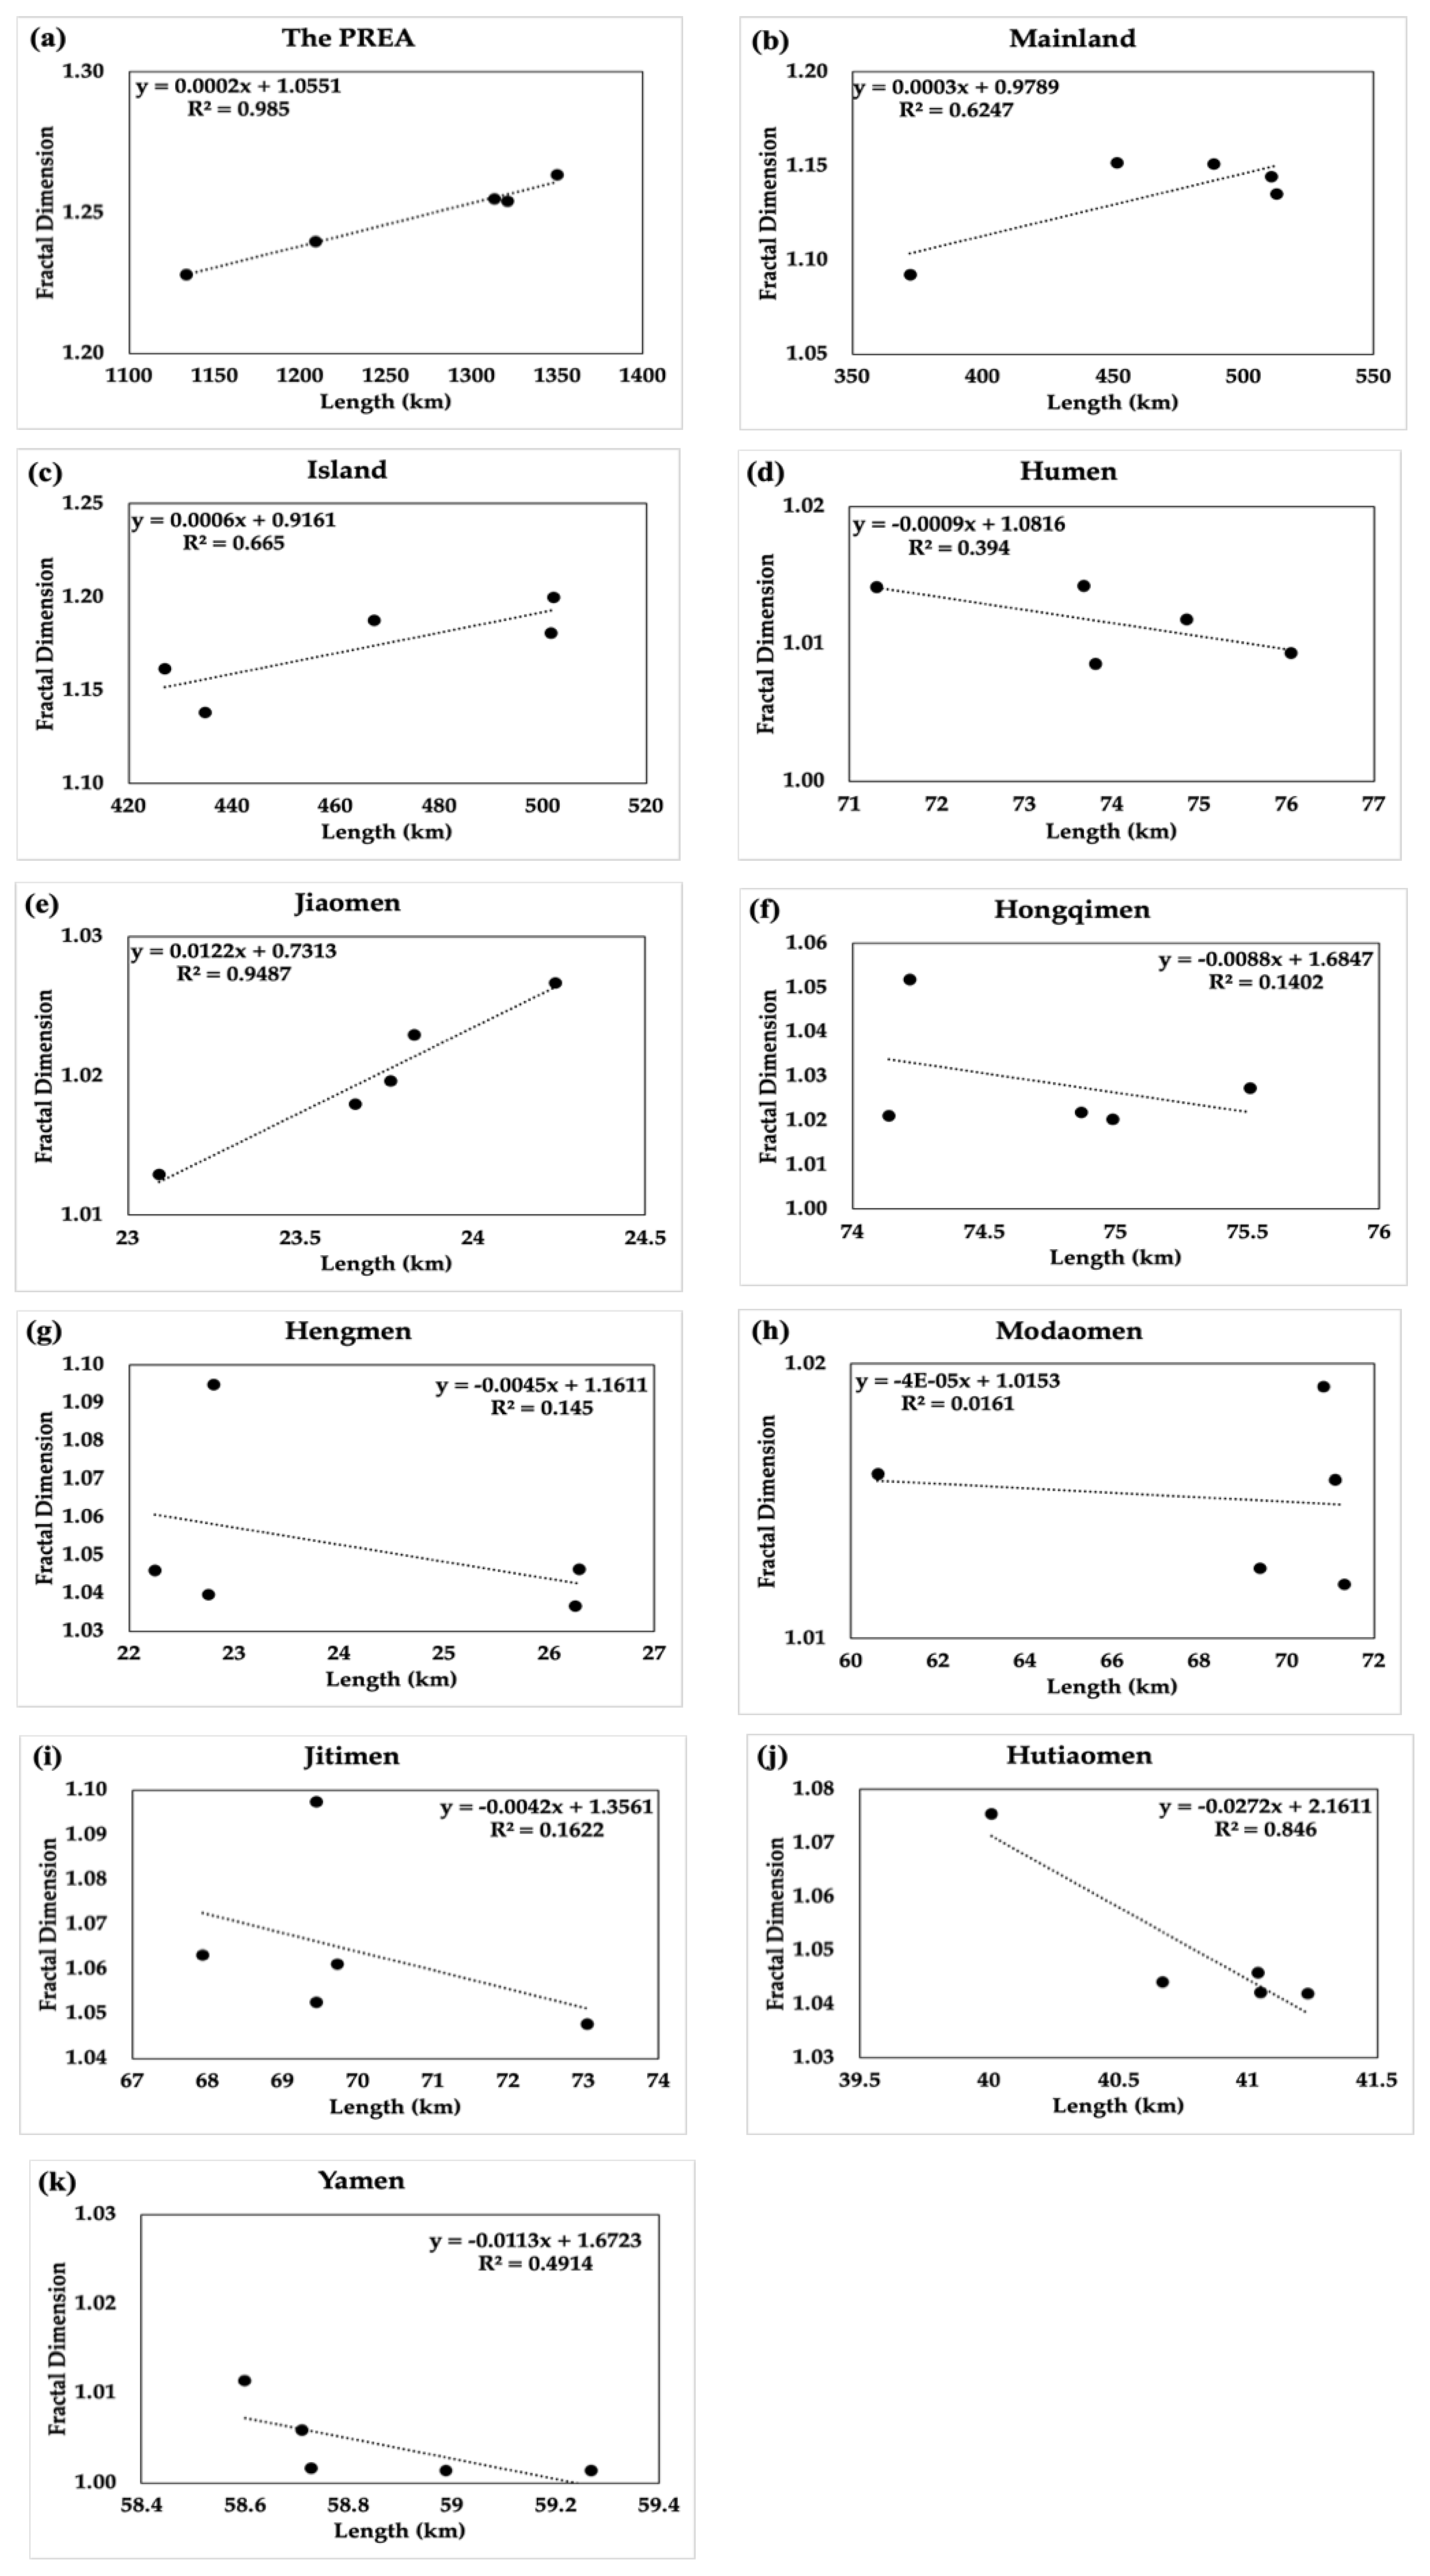
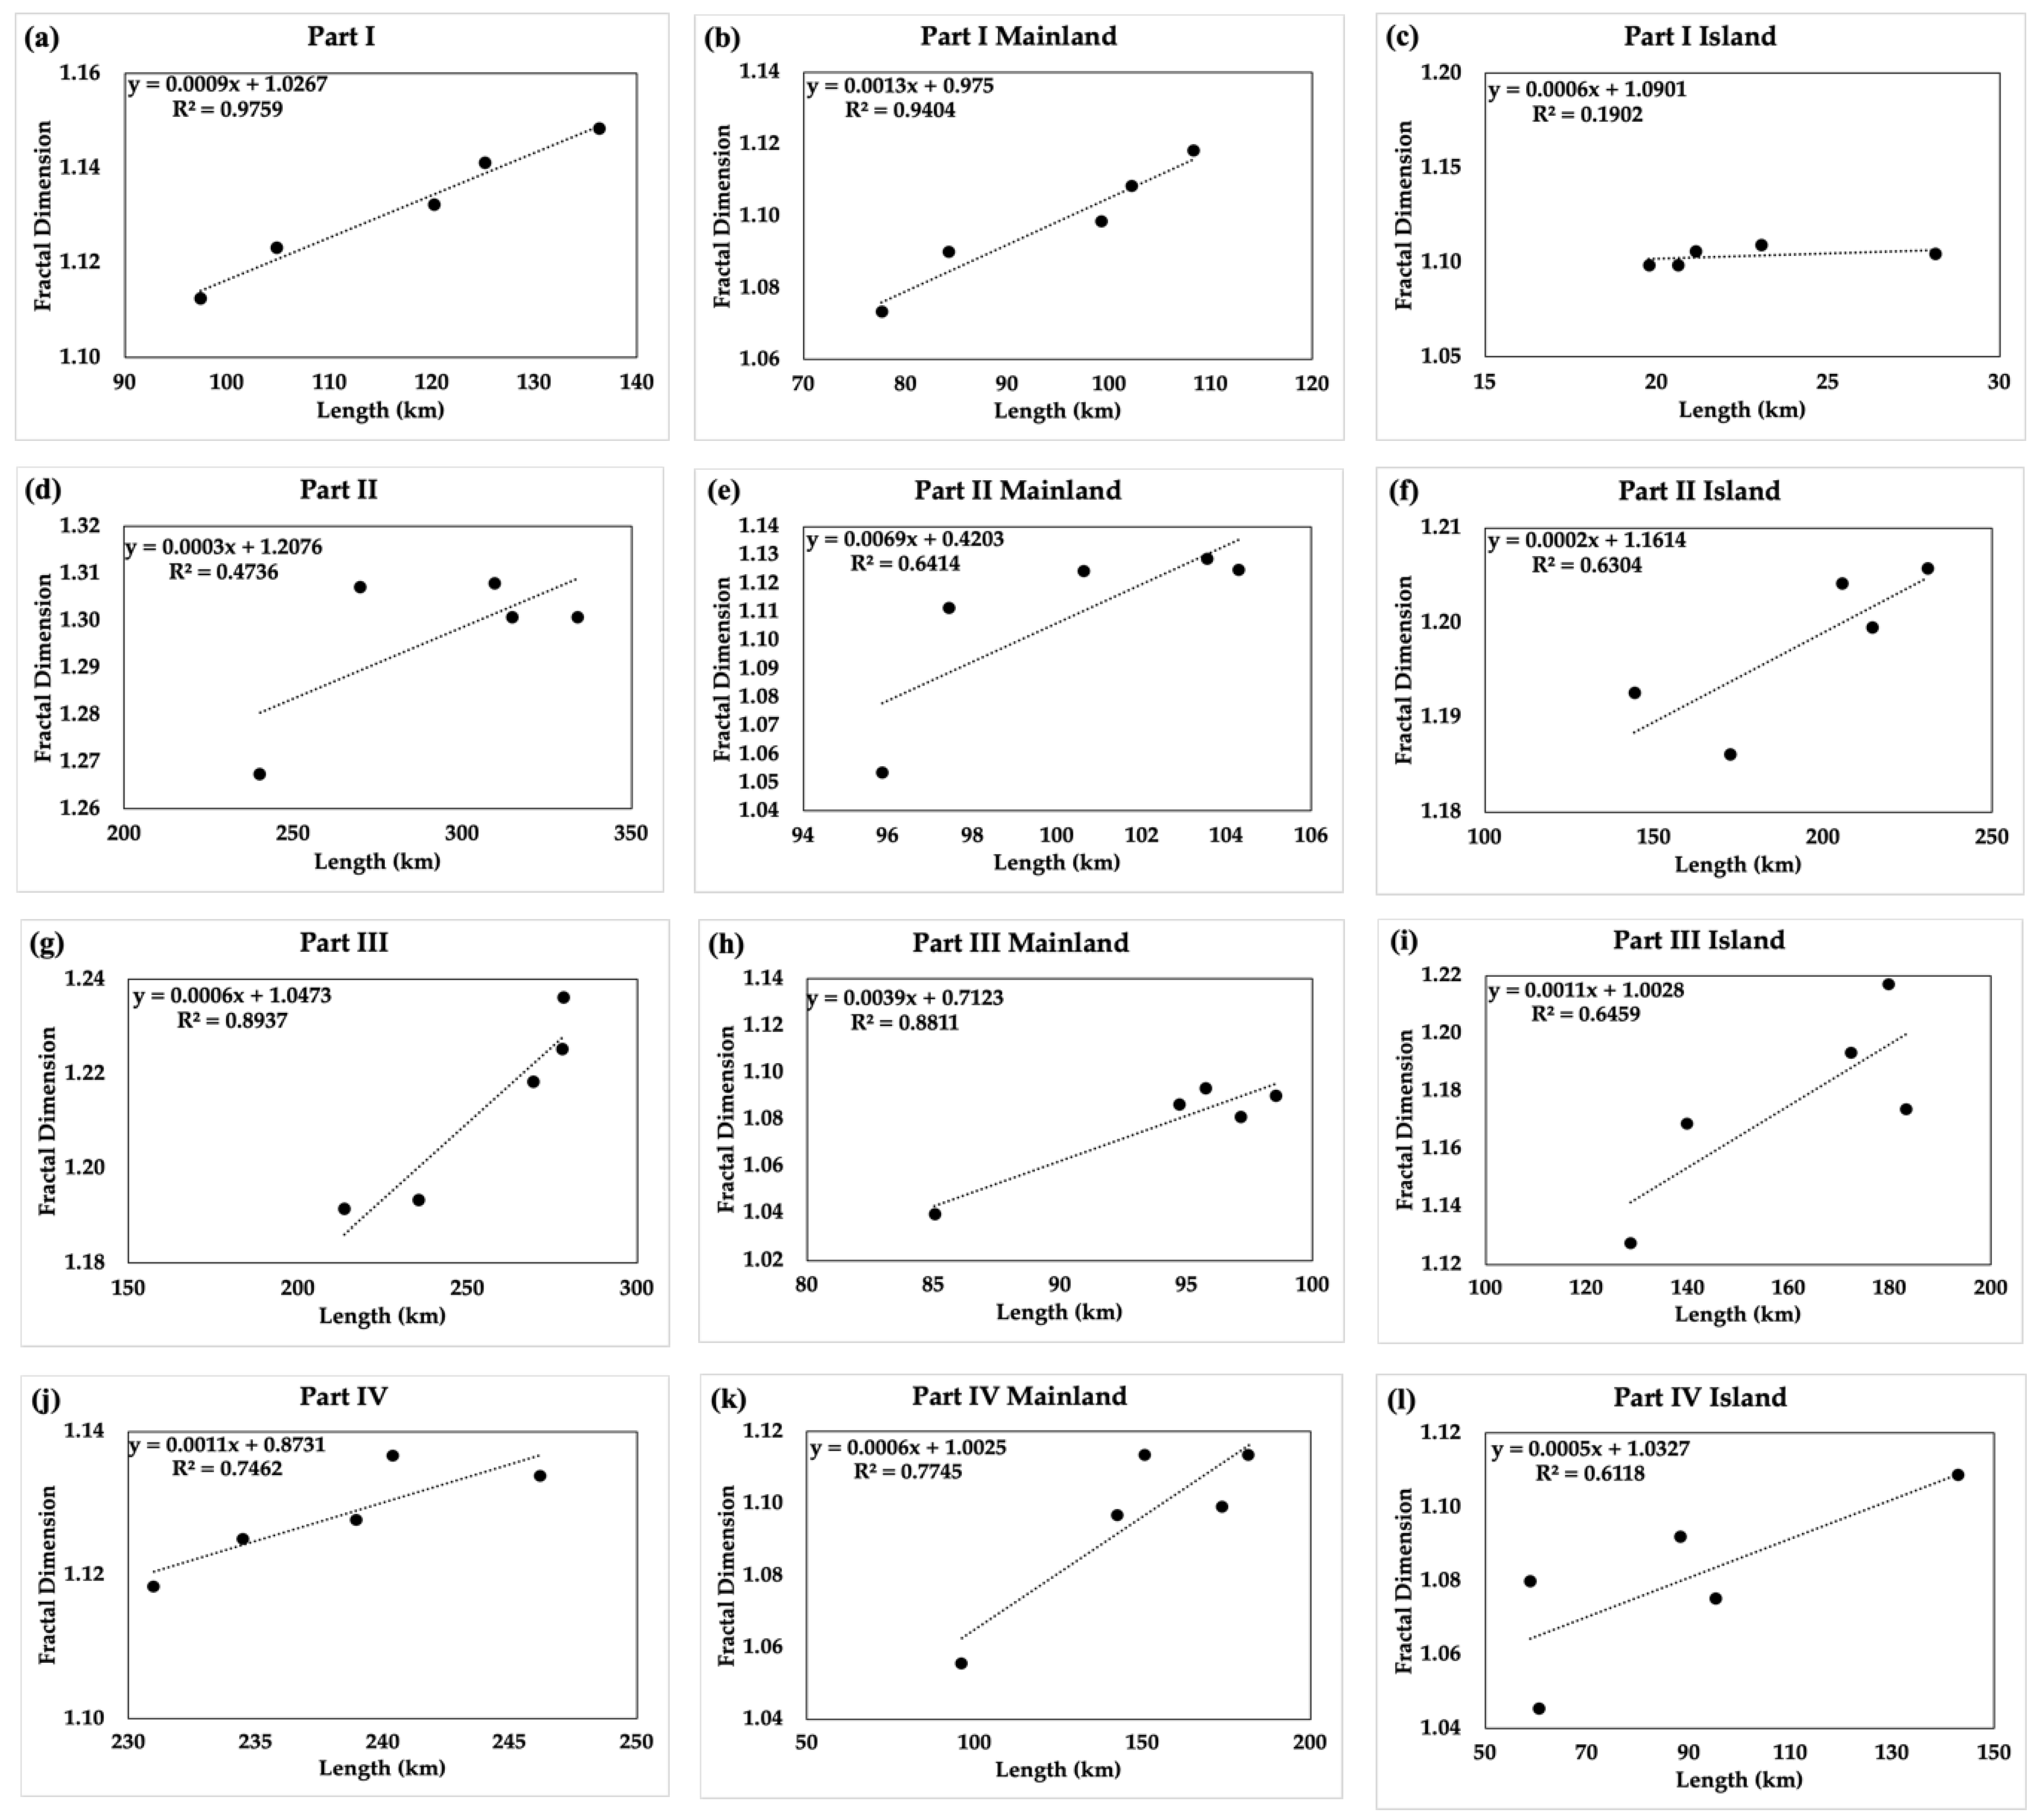
3.4. Relationship Between Coastline Length and FD
4. Discussion
4.1. Driving Factors of Coastline Variations
4.2. Driving Factors of FD Variations
4.3. Relationship Between Coastline Length and FD
5. Conclusions
Author Contributions
Funding
Acknowledgments
Conflicts of Interest
References
- Alesheikh, A.A.; Ghorbanali, A.; Nouri, N. Coastline change detection using remote sensing. Int. J. Environ. Sci. Technol. 2007, 4, 61–66. [Google Scholar] [CrossRef] [Green Version]
- Ruckelshaus, M.H.; Guannel, G.; Arkema, K.; Verutes, G.; Griffin, R.; Guerry, A.; Silver, J.; Faries, J.; Brenner, J.; Rosenthal, A. Evaluating the benefits of green infrastructure for coastal areas: Location, location, location. Coast. Manag. 2016, 44, 504–516. [Google Scholar] [CrossRef]
- Modava, M.; Akbarizadeh, G.; Soroosh, M. Integration of spectral histogram and level set for coastline detection in sar images. IEEE Trans. Aerosp. Electron. Syst. 2018, 55, 810–819. [Google Scholar] [CrossRef]
- Wu, T.; Hou, X.; Xu, X. Spatio-temporal characteristics of the mainland coastline utilization degree over the last 70 years in china. Ocean Coast. Manag. 2014, 98, 150–157. [Google Scholar] [CrossRef]
- Wang, Z.-H.; Feng, J.; Nie, X.-P. Recent environmental changes reflected by metals and biogenic elements in sediments from the guishan island, the pearl river estuary, china. Estuar. Coast. Shelf Sci. 2015, 164, 493–505. [Google Scholar] [CrossRef]
- Sun, J.; Li, Y.P.; Gao, P.P.; Xia, B.C. A mamdani fuzzy inference approach for assessing ecological security in the pearl river delta urban agglomeration, china. Ecol. Indic. 2018, 94, 386–396. [Google Scholar] [CrossRef]
- Liu, W.; Zhan, J.; Zhao, F.; Yan, H.; Zhang, F.; Wei, X. Impacts of urbanization-induced land-use changes on ecosystem services: A case study of the pearl river delta metropolitan region, china. Ecol. Indic. 2019, 98, 228–238. [Google Scholar] [CrossRef]
- Hu, X.; Wang, Y. Coastlines change of the pearl river estuary in the past 40 years using landsat dataset and its environmental implications. In IGARSS 2019-2019 IEEE International Geoscience and Remote Sensing Symposium; IEEE: Yokohama, Japan, 2019; pp. 8197–8200. [Google Scholar]
- Ai, B.; Zhang, R.; Zhang, H.; Ma, C.; Gu, F. Dynamic process and artificial mechanism of coastline change in the pearl river estuary. Reg. Stud. Mar. Sci. 2019, 30, 100715. [Google Scholar] [CrossRef]
- Cui, B.-L.; Li, X.-Y. Coastline change of the yellow river estuary and its response to the sediment and runoff (1976–2005). Geomorphology 2011, 127, 32–40. [Google Scholar] [CrossRef]
- Li, W.; Gong, P. Continuous monitoring of coastline dynamics in western florida with a 30-year time series of landsat imagery. Remote Sens. Environ. 2016, 179, 196–209. [Google Scholar] [CrossRef]
- Sagar, S.; Roberts, D.; Bala, B.; Lymburner, L. Extracting the intertidal extent and topography of the australian coastline from a 28 year time series of landsat observations. Remote Sens. Environ. 2017, 195, 153–169. [Google Scholar] [CrossRef]
- Mandelbrot, B. How long is the coast of britain? Statistical self-similarity and fractional dimension. Science 1967, 156, 636–638. [Google Scholar] [CrossRef] [PubMed] [Green Version]
- Nayak, S.R.; Mishra, J.; Palai, G. Analysing roughness of surface through fractal dimension: A review. Image Vis. Comput. 2019, 89, 21–34. [Google Scholar] [CrossRef]
- Yang, Y.; Liu, S. Estimation and modeling of pressure-dependent gas diffusion coefficient for coal: A fractal theory-based approach. Fuel 2019, 253, 588–606. [Google Scholar] [CrossRef]
- Fu, H.; Wang, W.; Chen, X.; Pia, G.; Li, J. Grain boundary design based on fractal theory to improve intergranular corrosion resistance of twip steels. Mater. Des. 2020, 185, 108253. [Google Scholar] [CrossRef]
- Dellino, P.; Liotino, G. The fractal and multifractal dimension of volcanic ash particles contour: A test study on the utility and volcanological relevance. J. Volcanol. Geotherm. Res. 2002, 133, 1–18. [Google Scholar] [CrossRef]
- De Pippo, T.; Donadio, C.; Mazzarella, A.; Paolillo, G.; Pennetta, M. Fractal geometry applied to cosatal and submarine features. Zeitschrift für Geomorphologie 2003, 48, 185–199. [Google Scholar]
- Donadio, C.; Magdaleno, F.; Mazzarella, A.; Mathias Kondolf, G. Fractal dimension of the hydrographic pattern of three large rivers in the mediterranean morphoclimatic system: Geomorphologic interpretation of russian (USA), ebro (spain) and volturno (italy) fluvial geometry. Pure Appl. Geophys. 2014, 172, 1975–1984. [Google Scholar] [CrossRef]
- McCaffrey, K.; Johnson, J.D.; Feely, M. Use of fractal statistics in the analysis of mo-cu mineralisation at mace head, county galway. Ir. J. Earth Sci. 1993, 12, 139–148. [Google Scholar]
- Koukouvelas, I.K.; Pe-Piper, G.; Piper, D.J.W. The relationship between length and width of plutons within the crustal-scale cobequid shear zone, northern appalachians, Canada. Int. J. Earth Sci. 2006, 95, 963–976. [Google Scholar] [CrossRef]
- Li, J.; Ye, M.; Pu, R.; Liu, Y.; Guo, Q.; Feng, B.; Huang, R.; He, G. Spatiotemporal change patterns of coastlines in zhejiang province, china, over the last twenty-five years. Sustainability 2018, 10, 477. [Google Scholar] [CrossRef] [Green Version]
- Zhu, X.; Cai, Y. Study on fractal dimension of chinese coastline and its character. Adv. Mar. Sci. 2004, 22, 157–162. [Google Scholar]
- Xu, J.; Zhang, Z.; Zhao, X.; Wen, Q.; Zuo, L.; Wang, X.; Yi, L. Spatial and temporal variations of coastlines in northern china (2000–2012). J. Geogr. Sci. 2014, 24, 18–32. [Google Scholar] [CrossRef]
- Porter-Smith, R.; McKinlay, J. Mesoscale coastal complexity and its relationship to structure and forcing from marine processes. Mar. Geol. 2012, 323–325, 1–13. [Google Scholar] [CrossRef]
- Donadio, C.; Paliaga, G.; Radke, J.D. Tsunamis and rapid coastal remodeling: Linking energy and fractal dimension. Prog. Phys. Geogr. Earth Environ. 2019, 44, 550–571. [Google Scholar] [CrossRef]
- Pentland, A.P. Fractal-based description of natural scenes. IEEE Trans. Pattern Anal. Mach. Intell. 1984, PAMI-6, 661–674. [Google Scholar] [CrossRef]
- Gagnepain, J.J.; Roques-Carmes, C. Fractal approach to two-dimensional and three-dimensional surface roughness. Wear 1986, 109, 119–126. [Google Scholar] [CrossRef]
- Carr, J.R.; Benzer, W.B. On the practice of estimating fractal dimension. Math. Geol. 1991, 23, 945–958. [Google Scholar] [CrossRef]
- Jiang, J.; Plotnick, R.E. Fractal analysis of the complexity of united states coastlines. Math. Geol. 1998, 30, 535–546. [Google Scholar] [CrossRef]
- Chen, Q.; Yuan, H.; Chen, P. Short-term effects of artificial reef construction on the taxonomic diversity and eco-exergy of the macrobenthic faunal community in the pearl river estuary, china. Ecol. Indic. 2019, 98, 772–782. [Google Scholar] [CrossRef]
- Zhao, Y.; Zou, X.; Cao, L.; Xu, X. Changes in precipitation extremes over the pearl river basin, southern china, during 1960–2012. Quat. Int. 2014, 333, 26–39. [Google Scholar] [CrossRef]
- Wu, C.; Yang, S.; Huang, S.; Mu, J. Delta changes in the pearl river estuary and its response to human activities (1954–2008). Quat. Int. 2016, 392, 147–154. [Google Scholar] [CrossRef]
- Xu, C.; Xu, Y.; Hu, J.; Li, S.; Wang, B. A numerical analysis of the summertime pearl river plume from 1999 to 2010: Dispersal patterns and intraseasonal variability. J. Mar. Syst. 2019, 192, 15–27. [Google Scholar] [CrossRef]
- Zhang, G.; Cheng, W.; Chen, L.; Zhang, H.; Gong, W. Transport of riverine sediment from different outlets in the pearl river estuary during the wet season. Mar. Geol. 2019, 415, 105957. [Google Scholar] [CrossRef]
- Peng, J.; Wang, A.; Liu, Y.; Liu, W. Assessing the atmospheric oxygen balance in a region of rapid urbanization: A case study in the pearl river delta, china. Sustainability 2015, 7, 13055–13072. [Google Scholar] [CrossRef] [Green Version]
- Wang, X.; Liu, Y.; Ling, F.; Liu, Y.; Fang, F. Spatio-temporal change detection of ningbo coastline using landsat time-series images during 1976–2015. ISPRS Int. J. Geo-Inf. 2017, 6, 68. [Google Scholar] [CrossRef] [Green Version]
- Tan, Z.; Li, W. The application of arcgis and fractal theory in cartography generalization evaluation. Urban Geotech. Investig. Surv. 2015, 1, 56–59. [Google Scholar]
- Zhang, Y.; Zhang, J.; Jing, X.; Song, D.; Zhao, J. Historical changes of the length and fractal dimension of chinese coastline since 1990. Mar. Environ. Sci. 2015, 34, 406–410. [Google Scholar]
- Su, Y.; Sun, Q.; Hou, M. Study on coastal fractal of yellow river delta. Resour. Ind. 2008, 10, 103–107. [Google Scholar]
- Zhu, X. Fractal character of china bedrock coastline. Chin. J. Oceanol. Limnol. 2004, 22, 130–135. [Google Scholar]
- Hou, X.; Wu, T.; Hou, W.; Chen, Q.; Wang, Y.; Yu, L. Characteristics of coastline changes in mainland china since the early 1940s. Sci. China Earth Sci. 2016, 59, 1791–1802. [Google Scholar] [CrossRef]
- Zhang, L.; Pan, Y.; Lei, H.; Huang, B.; Zhou, B. Remote sensing monitoring and analysis of zhejiang terrestrial coastline evolution in the past 30 year. Bull. Sci. Technol. 2017, 33, 54–59. [Google Scholar]
- Ruggiero, P.; Kaminsky, G.M.; Gelfenbaum, G. Linking proxy-based and datum-based shorelines on a high-energy coastline: Change analyses. J. Coast. Res. 2003, 38, 57–82. [Google Scholar]
- Jongejan, R.; Ranasinghe, R.; Wainwright, D.; Callaghan, D.P.; Reyns, J. Drawing the line on coastline recession risk. Ocean Coast. Manag. 2016, 122, 87–94. [Google Scholar] [CrossRef]
- Schoneich-Argent, R.I.; Hillmann, F.; Cordes, D.; Wansing, R.A.D.; Merder, J.; Freund, J.A.; Freund, H. Wind, waves, tides, and human error?—Influences on litter abundance and composition on german north sea coastlines: An exploratory analysis. Mar. Pollut Bull. 2019, 146, 155–172. [Google Scholar] [CrossRef]
- Thoai, D.T.; Dang, A.N.; Kim Oanh, N.T. Analysis of coastline change in relation to meteorological conditions and human activities in ca mau cape, viet nam. Ocean Coast. Manag. 2019, 171, 56–65. [Google Scholar] [CrossRef]
- Zhang, J.; Su, F.; Ding, Z. Sea reclamation status of countries around the south china sea from 1975 to 2010. Sustainability 2017, 9, 878. [Google Scholar] [CrossRef] [Green Version]
- Heise, B.; Harff, J.; Ren, J.; Liang, K. Patterns of potential sediment erosion in the pearl river estuary. J. Mar. Syst. 2010, 82, S62–S82. [Google Scholar] [CrossRef]
- Dai, S.B.; Yang, S.L.; Cai, A.M. Impacts of dams on the sediment flux of the pearl river, southern china. Catena 2008, 76, 36–43. [Google Scholar] [CrossRef]


| Date (yy/mm/dd) | Spacecraft Identifier/Sensor Identifier | WRS Path-Row | Cloud Cover (%) | Spatial Resolution (m) | Real-Time Tidal Level (cm) | Tidal Difference (cm) |
|---|---|---|---|---|---|---|
| 1978/11/02 | Landsat 2 MSS | 122-44 | 0 | 80 | 208 | - |
| 1978/11/02 | Landsat 2 MSS | 122-45 | 1 | 80 | 208 | - |
| 1988/11/24 | Landsat 5 TM | 122-44 | 9 | 30 | 174 | -34 |
| 1988/11/24 | Landsat 5 TM | 122-45 | 3 | 30 | 174 | -34 |
| 1997/08/29 | Landsat 5 TM | 122-44 | 1 | 30 | 268 | 50 |
| 1997/08/29 | Landsat 5 TM | 122-45 | 3 | 30 | 268 | 50 |
| 2008/12/09 | Landsat 7 ETM+ | 122-44 | 0 | 30 | 195 | -13 |
| 2008/12/09 | Landsat 7 ETM+ | 122-45 | 0 | 30 | 195 | -13 |
| 2018/02/12 | Landsat 8 OLI_TIRS | 122-44 | 7.55 | 30 | 190 | -18 |
| 2018/02/12 | Landsat 8 OLI_TIRS | 122-45 | 9.09 | 30 | 190 | -18 |
| Group | Error (m) | Group | Error (m) | Group | Error (m) | Group | Error (m) | Group | Error (m) | Average Error (m) | SD (m) | RMSE (m) | TMAE (m) |
|---|---|---|---|---|---|---|---|---|---|---|---|---|---|
| 1 | 27.24 | 21 | 29.60 | 41 | 22.52 | 61 | 9.31 | 81 | 4.71 | 16.21 | 11.99 | 20.12 | 28.28 |
| 2 | 5.31 | 22 | 4.46 | 42 | 26.00 | 62 | 16.73 | 82 | 1.30 | ||||
| 3 | 14.98 | 23 | 12.69 | 43 | 31.25 | 63 | 0.99 | 83 | 20.59 | ||||
| 4 | 18.81 | 24 | 1.03 | 44 | 17.41 | 64 | 36.58 | 84 | 37.49 | ||||
| 5 | 10.03 | 25 | 25.50 | 45 | 26.35 | 65 | 0.83 | 85 | 14.72 | ||||
| 6 | 7.99 | 26 | 24.81 | 46 | 17.13 | 66 | 38.65 | 86 | 22.18 | ||||
| 7 | 7.70 | 27 | 5.62 | 47 | 14.27 | 67 | 39.86 | ||||||
| 8 | 9.67 | 28 | 18.43 | 48 | 5.44 | 68 | 29.99 | ||||||
| 9 | 20.16 | 29 | 10.62 | 49 | 4.83 | 69 | 33.80 | ||||||
| 10 | 10.72 | 30 | 7.83 | 50 | 31.61 | 70 | 3.59 | ||||||
| 11 | 4.57 | 31 | 23.82 | 51 | 3.47 | 71 | 6.10 | ||||||
| 12 | 15.25 | 32 | 23.67 | 52 | 9.84 | 72 | 5.24 | ||||||
| 13 | 8.96 | 33 | 4.59 | 53 | 17.74 | 73 | 39.51 | ||||||
| 14 | 3.93 | 34 | 12.34 | 54 | 9.67 | 74 | 6.22 | ||||||
| 15 | 22.34 | 35 | 20.72 | 55 | 27.22 | 75 | 11.47 | ||||||
| 16 | 9.73 | 36 | 20.37 | 56 | 5.64 | 76 | 18.48 | ||||||
| 17 | 4.22 | 37 | 5.08 | 57 | 5.45 | 77 | 10.01 | ||||||
| 18 | 1.66 | 38 | 8.35 | 58 | 14.25 | 78 | 35.66 | ||||||
| 19 | 31.58 | 39 | 3.46 | 59 | 32.66 | 79 | 0.99 | ||||||
| 20 | 13.80 | 40 | 59.00 | 60 | 20.89 | 80 | 35.07 |
| Different Types | 1978 | 1988 | 1997 | 2008 | 2018 | |
|---|---|---|---|---|---|---|
| The PREA | 1133.43 | 1208.55 | 1321.16 | 1312.9 | 1349.73 | |
| Mainland | 371.71 | 451.14 | 488.57 | 512.45 | 510.36 | |
| Islands | 434.82 | 426.93 | 501.52 | 467.42 | 502.17 | |
| Estuaries | Humen | 71.32 | 73.68 | 73.82 | 74.87 | 76.05 |
| Jiaomen | 23.83 | 23.09 | 23.76 | 23.66 | 24.24 | |
| Hongqimen | 74.22 | 74.14 | 74.99 | 74.87 | 75.51 | |
| Hengmen | 22.81 | 22.25 | 22.76 | 26.29 | 26.25 | |
| Modaomen | 60.62 | 69.38 | 70.82 | 71.09 | 71.32 | |
| Jitimen | 69.45 | 69.45 | 67.94 | 69.72 | 73.05 | |
| Hutiaomen | 40.01 | 40.67 | 41.23 | 41.05 | 41.04 | |
| Yamen | 58.60 | 58.73 | 58.71 | 58.99 | 59.27 | |
| Locations | Types | 1978 | 1988 | 1997 | 2008 | 2018 |
|---|---|---|---|---|---|---|
| Part I | Total length | 97.38 | 104.83 | 120.28 | 125.23 | 136.38 |
| Mainland | 77.62 | 84.22 | 99.14 | 102.21 | 108.28 | |
| Island | 19.76 | 20.61 | 21.14 | 23.02 | 28.10 | |
| Part II | Total length | 240.13 | 269.84 | 309.87 | 315.11 | 334.35 |
| Mainland | 95.88 | 97.44 | 104.27 | 100.63 | 103.53 | |
| Island | 144.25 | 172.40 | 205.60 | 214.48 | 230.82 | |
| Part III | Total length | 213.71 | 235.69 | 278.35 | 269.41 | 277.85 |
| Mainland | 85.05 | 95.73 | 98.52 | 97.11 | 94.68 | |
| Island | 128.65 | 139.95 | 179.83 | 172.30 | 183.16 | |
| Part IV | Total length | 239.00 | 230.99 | 246.20 | 240.42 | 234.54 |
| Mainland | 96.19 | 142.51 | 150.81 | 181.52 | 173.97 | |
| Island | 142.81 | 88.48 | 95.29 | 58.90 | 60.58 |
| Different Types of Coastline | 1978 | 1988 | 1997 | 2008 | 2018 | ||
|---|---|---|---|---|---|---|---|
| The PREA | FD | 1.228 | 1.240 | 1.254 | 1.255 | 1.263 | |
| R2 | 0.999 | 0.998 | 0.999 | 0.999 | 0.999 | ||
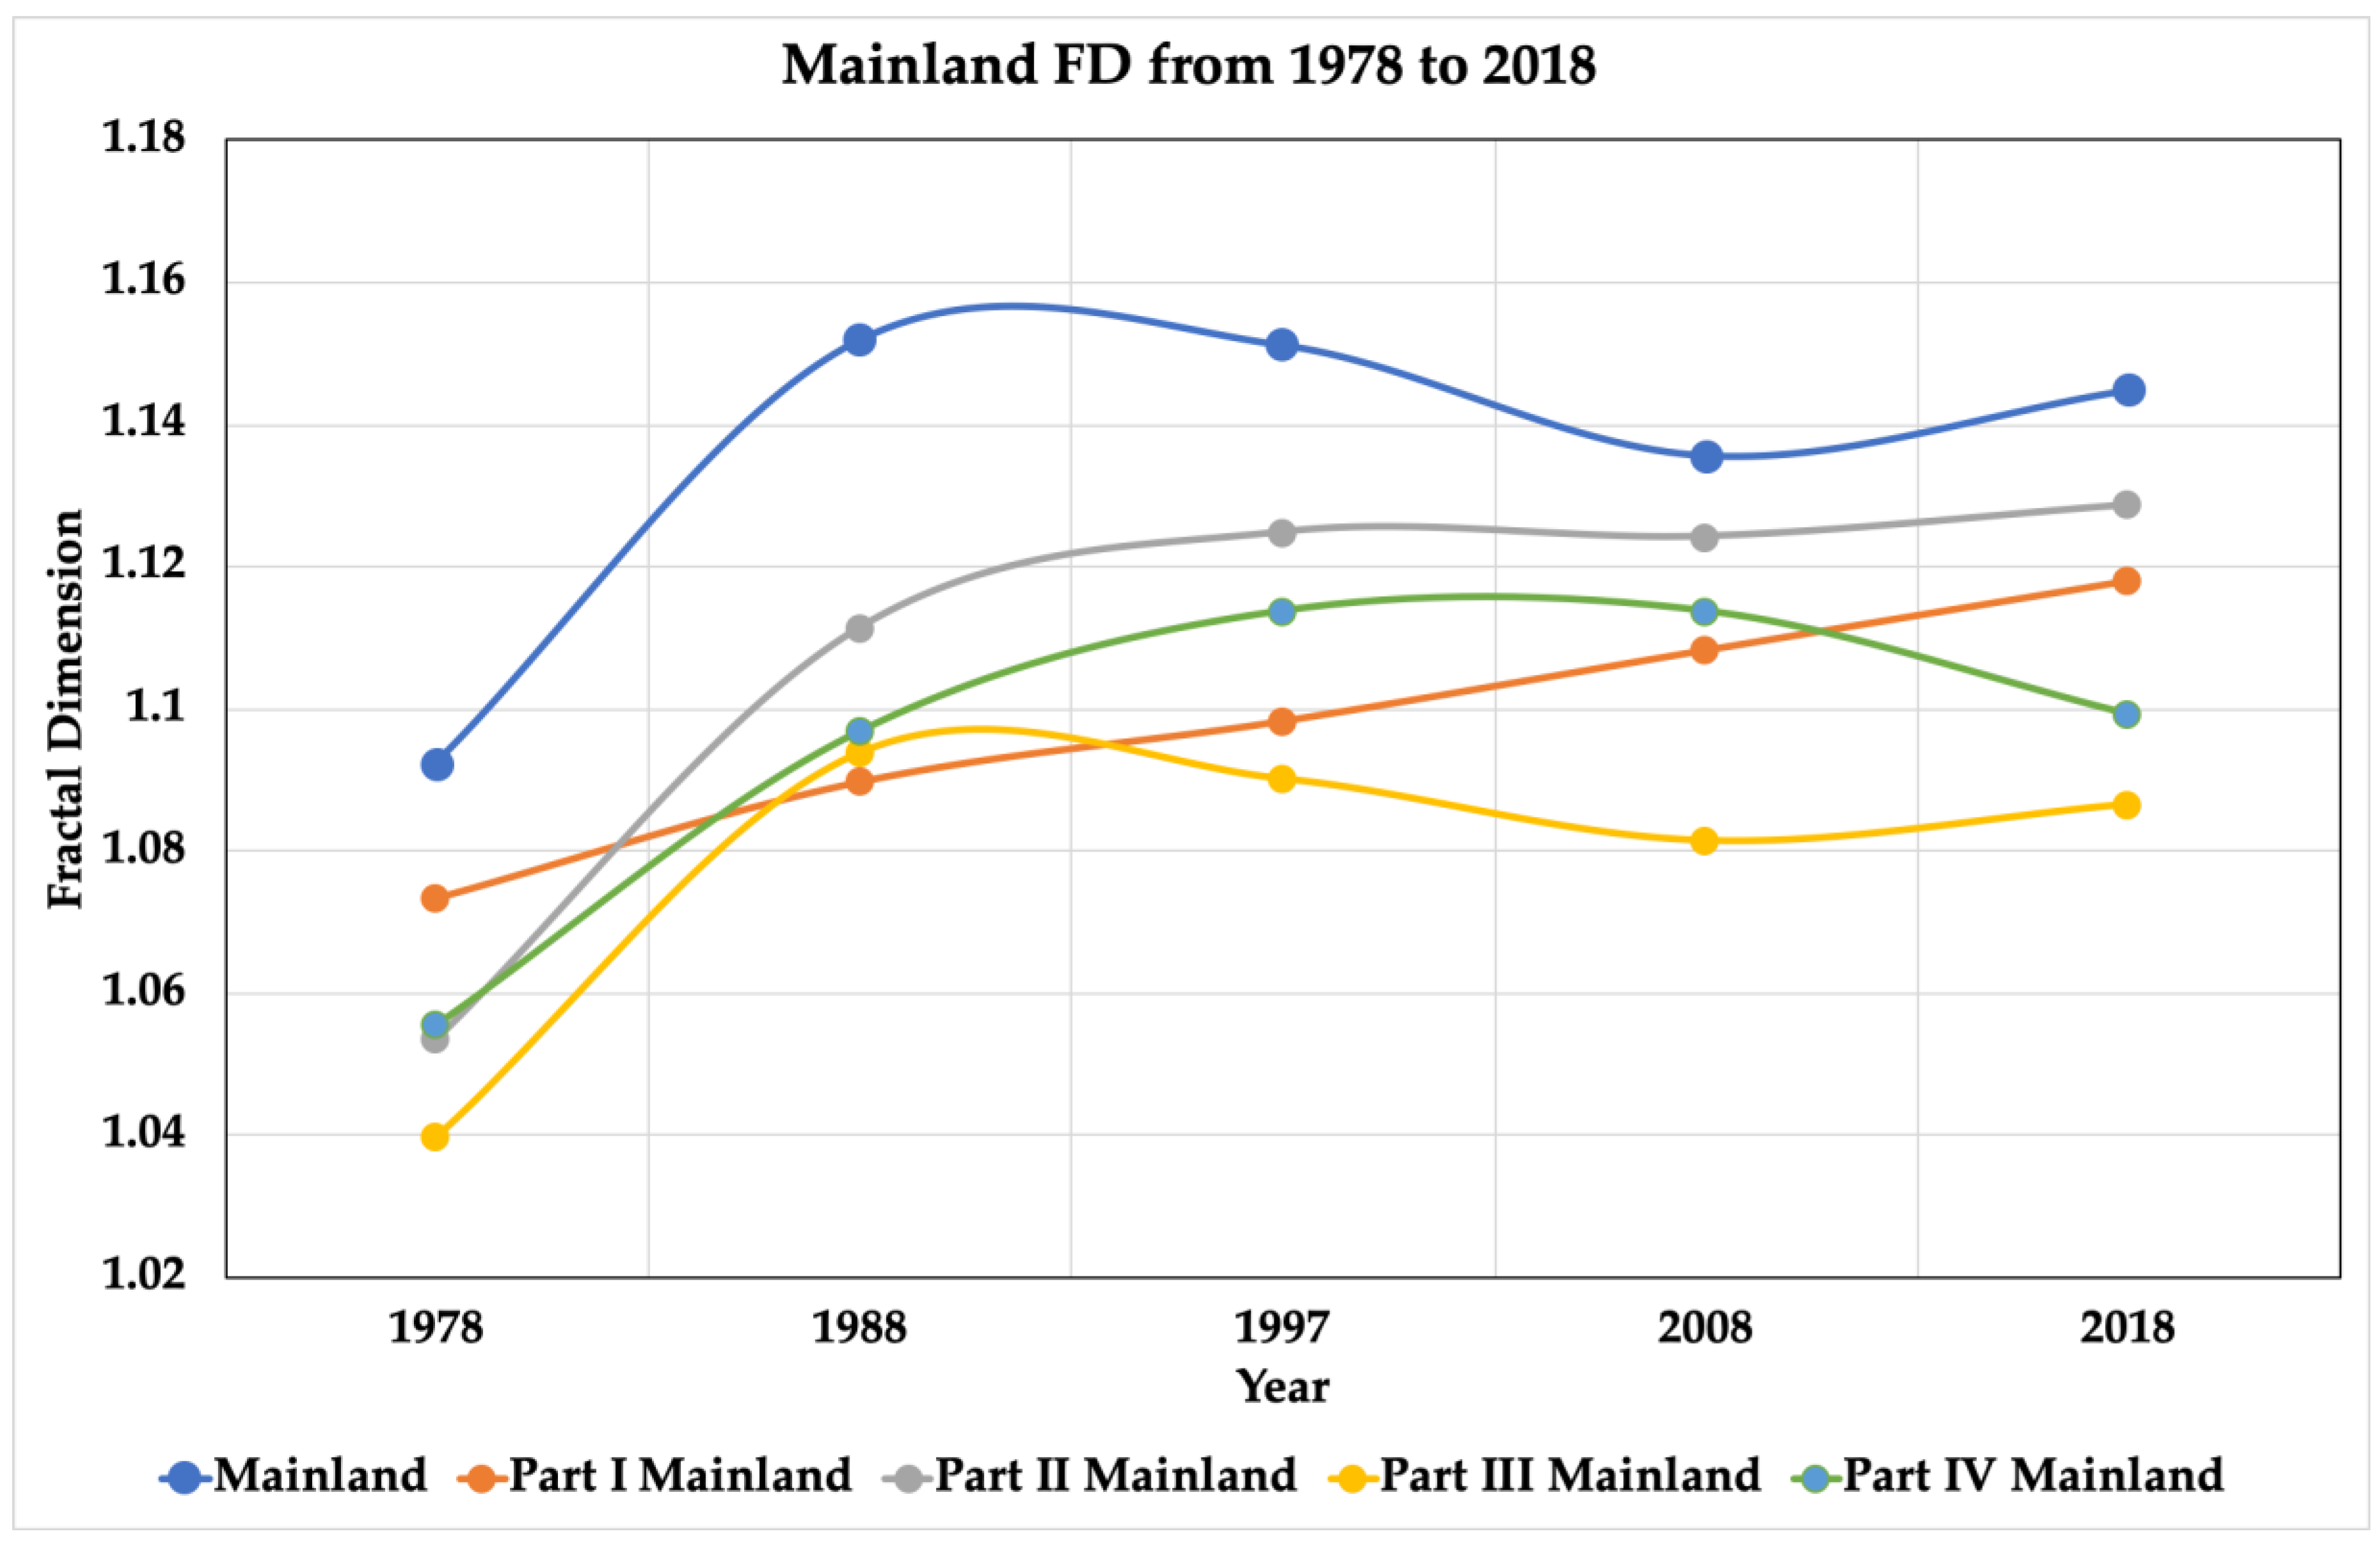
| Mainland | FD | 1.092 | 1.152 | 1.151 | 1.136 | 1.145 | |
| R2 | 0.999 | 0.997 | 0.999 | 0.999 | 0.999 | ||
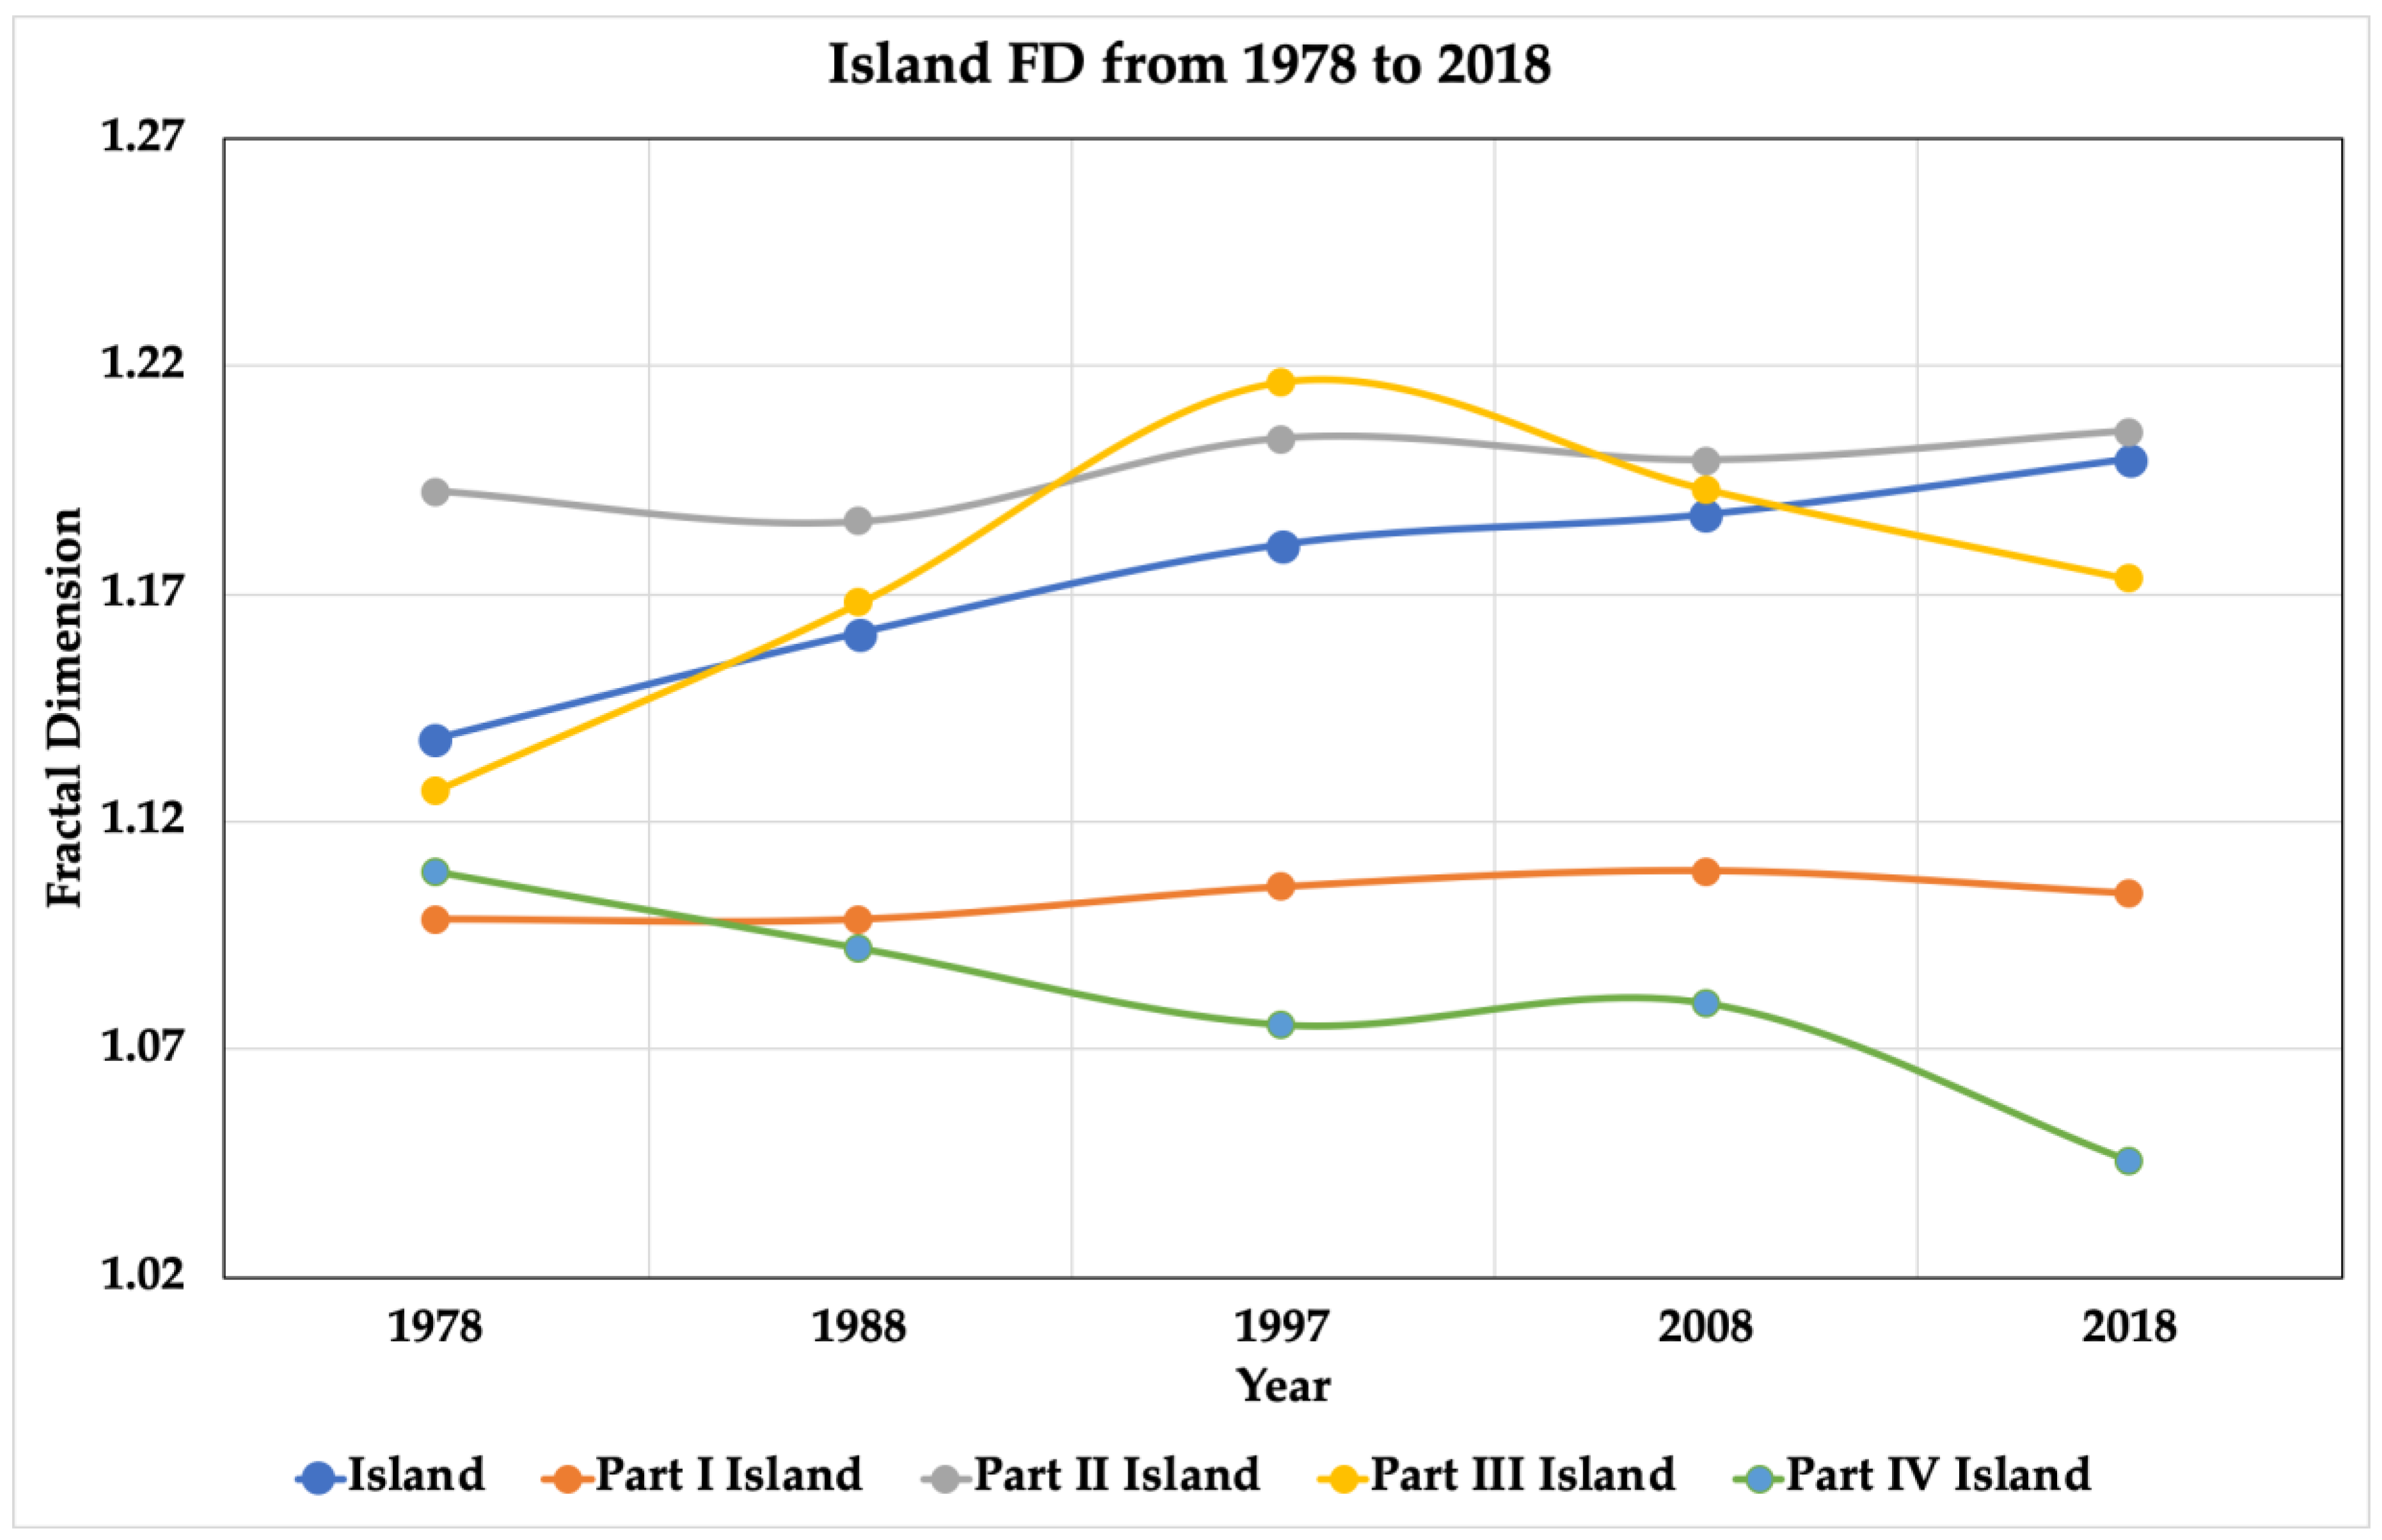
| Islands | FD | 1.138 | 1.161 | 1.181 | 1.187 | 1.200 | |
| R2 | 1 | 0.999 | 0.999 | 0.999 | 0.999 | ||
| Estuaries | Humen | FD | 1.041 | 1.014 | 1.009 | 1.012 | 1.009 |
| R2 | 0.995 | 1 | 1 | 1 | 1 | ||
| Jiaomen | FD | 1.023 | 1.013 | 1.020 | 1.018 | 1.027 | |
| R2 | 0.999 | 0.999 | 0.999 | 0.999 | 0.999 | ||
| Hongqimen | FD | 1.052 | 1.021 | 1.020 | 1.022 | 1.027 | |
| R2 | 0.998 | 0.999 | 0.999 | 0.999 | 0.999 | ||
| Hengmen | FD | 1.095 | 1.046 | 1.040 | 1.046 | 1.036 | |
| R2 | 0.998 | 0.999 | 0.999 | 0.998 | 0.999 | ||
| Modaomen | FD | 1.013 | 1.011 | 1.015 | 1.013 | 1.011 | |
| R2 | 0.999 | 0.999 | 0.999 | 0.999 | 1 | ||
| Jitimen | FD | 1.097 | 1.052 | 1.063 | 1.061 | 1.048 | |
| R2 | 0.997 | 0.997 | 0.997 | 0.997 | 0.998 | ||
| Hutiaomen | FD | 1.076 | 1.044 | 1.042 | 1.042 | 1.046 | |
| R2 | 0.999 | 0.999 | 0.999 | 0.999 | 0.998 | ||
| Yamen | FD | 1.011 | 1.002 | 1.006 | 1.001 | 1.001 | |
| R2 | 0.999 | 1 | 0.999 | 1 | 0.999 | ||
| Different Part of the Main Body | 1978 | 1988 | 1997 | 2008 | 2018 | ||
|---|---|---|---|---|---|---|---|
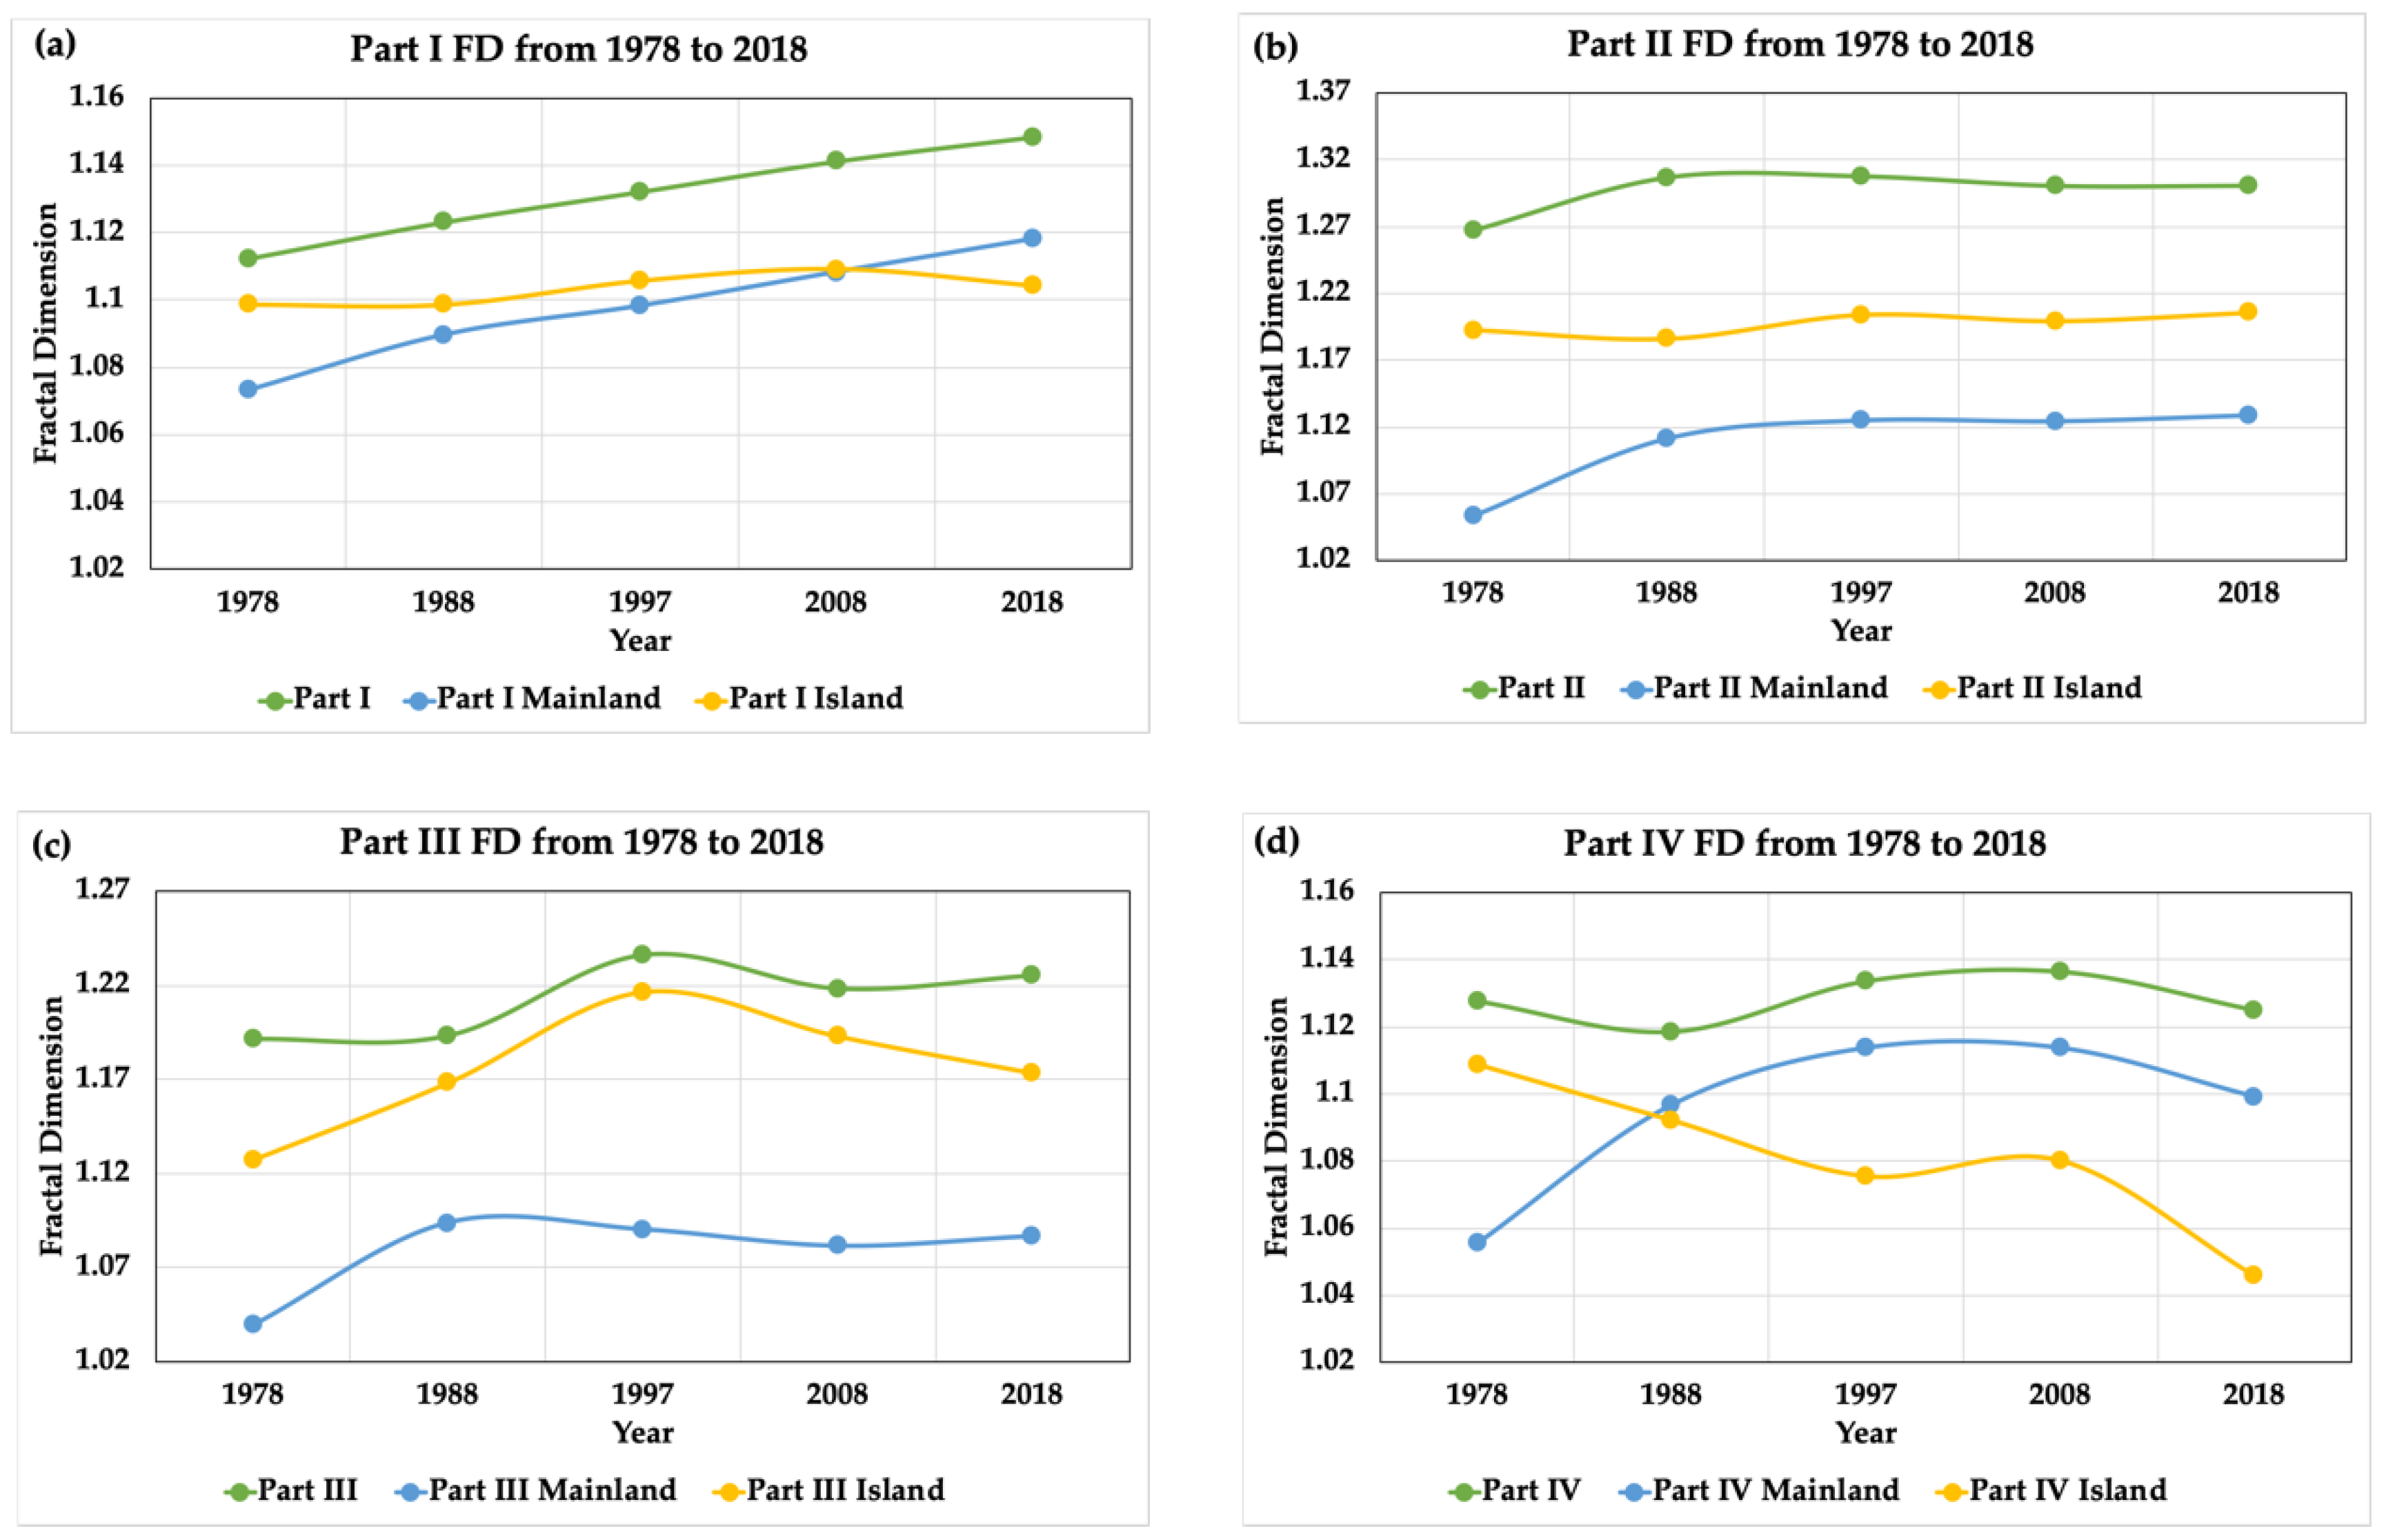
| Part I | Total | FD | 1.112 | 1.123 | 1.132 | 1.141 | 1.148 |
| R2 | 0.999 | 0.999 | 0.999 | 0.999 | 0.999 | ||
| Mainland | FD | 1.073 | 1.090 | 1.098 | 1.108 | 1.118 | |
| R2 | 0.999 | 0.999 | 0.999 | 0.999 | 0.999 | ||
| Island | FD | 1.099 | 1.099 | 1.106 | 1.109 | 1.104 | |
| R2 | 0.996 | 0.998 | 0.999 | 0.993 | 0.993 | ||
| Part II | Total | FD | 1.267 | 1.307 | 1.308 | 1.301 | 1.301 |
| R2 | 0.999 | 0.996 | 0.996 | 0.997 | 0.997 | ||
| Mainland | FD | 1.053 | 1.111 | 1.125 | 1.124 | 1.129 | |
| R2 | 0.999 | 0.996 | 0.996 | 0.997 | 0.996 | ||
| Island | FD | 1.193 | 1.186 | 1.204 | 1.200 | 1.206 | |
| R2 | 0.999 | 0.998 | 0.998 | 0.998 | 0.998 | ||
| Part III | Total | FD | 1.191 | 1.193 | 1.236 | 1.218 | 1.225 |
| R2 | 0.998 | 0.999 | 0.999 | 0.998 | 0.998 | ||
| Mainland | FD | 1.040 | 1.094 | 1.090 | 1.082 | 1.087 | |
| R2 | 0.999 | 0.998 | 0.999 | 1 | 0.999 | ||
| Island | FD | 1.127 | 1.168 | 1.217 | 1.193 | 1.173 | |
| R2 | 0.991 | 0.998 | 0.998 | 0.997 | 0.999 | ||
| Part IV | Total | FD | 1.128 | 1.118 | 1.134 | 1.1367 | 1.125 |
| R2 | 0.999 | 0.999 | 0.998 | 0.999 | 0.999 | ||
| Mainland | FD | 1.055 | 1.097 | 1.114 | 1.114 | 1.099 | |
| R2 | 0.999 | 0.999 | 0.998 | 0.999 | 0.999 | ||
| Island | FD | 1.109 | 1.092 | 1.075 | 1.080 | 1.046 | |
| R2 | 0.999 | 0.999 | 0.999 | 0.999 | 0.998 | ||
© 2020 by the authors. Licensee MDPI, Basel, Switzerland. This article is an open access article distributed under the terms and conditions of the Creative Commons Attribution (CC BY) license (http://creativecommons.org/licenses/by/4.0/).
Share and Cite
Hu, X.; Wang, Y. Coastline Fractal Dimension of Mainland, Island, and Estuaries Using Multi-temporal Landsat Remote Sensing Data from 1978 to 2018: A Case Study of the Pearl River Estuary Area. Remote Sens. 2020, 12, 2482. https://doi.org/10.3390/rs12152482
Hu X, Wang Y. Coastline Fractal Dimension of Mainland, Island, and Estuaries Using Multi-temporal Landsat Remote Sensing Data from 1978 to 2018: A Case Study of the Pearl River Estuary Area. Remote Sensing. 2020; 12(15):2482. https://doi.org/10.3390/rs12152482
Chicago/Turabian StyleHu, Xinyi, and Yunpeng Wang. 2020. "Coastline Fractal Dimension of Mainland, Island, and Estuaries Using Multi-temporal Landsat Remote Sensing Data from 1978 to 2018: A Case Study of the Pearl River Estuary Area" Remote Sensing 12, no. 15: 2482. https://doi.org/10.3390/rs12152482