Bridge Inspection Using Unmanned Aerial Vehicle Based on HG-SLAM: Hierarchical Graph-Based SLAM


1
School of Electrical Engineering, Korea Advanced Institute of Science and Technology, 291 Daehak-ro, Daejeon 34141, Korea
2
Department of Civil and Environmental Engineering, Korea Advanced Institute of Science and Technology, 291 Daehak-ro, Daejeon 34141, Korea
3
School of Electrical Engineering, KI-Robotics, and KI-AI, Korea Advanced Institute of Science and Technology, 291 Daehak-ro, Daejeon 34141, Korea
*
Author to whom correspondence should be addressed.
Remote Sens. 2020, 12(18), 3022; https://doi.org/10.3390/rs12183022
Submission received: 16 July 2020
/
Revised: 10 September 2020
/
Accepted: 11 September 2020
/
Published: 16 September 2020
(This article belongs to the Special Issue Latest Developments in 3D Mapping with Unmanned Aerial Vehicles)
Abstract
:With the increasing demand for autonomous systems in the field of inspection, the use of unmanned aerial vehicles (UAVs) to replace human labor is becoming more frequent. However, the Global Positioning System (GPS) signal is usually denied in environments near or under bridges, which makes the manual operation of a UAV difficult and unreliable in these areas. This paper addresses a novel hierarchical graph-based simultaneous localization and mapping (SLAM) method for fully autonomous bridge inspection using an aerial vehicle, as well as a technical method for UAV control for actually conducting bridge inspections. Due to the harsh environment involved and the corresponding limitations on GPS usage, a graph-based SLAM approach using a tilted 3D LiDAR (Light Detection and Ranging) and a monocular camera to localize the UAV and map the target bridge is proposed. Each visual-inertial state estimate and the corresponding LiDAR sweep are combined into a single subnode. These subnodes make up a “supernode” that consists of state estimations and accumulated scan data for robust and stable node generation in graph SLAM. The constraints are generated from LiDAR data using the normal distribution transform (NDT) and generalized iterative closest point (G-ICP) matching. The feasibility of the proposed method was verified on two different types of bridges: on the ground and offshore.
1. Introduction
Over the last decade, the public’s awareness of the importance of safety management has been increasing due to a series of large-scale safety accidents. Preventing the collapse of large structures is crucial, as it causes not only human harm, but also huge economic loss. The importance of structural diagnosis and maintenance to prevent structure collapse and safety accidents is increasing. The number of structures, such as bridges and buildings, is steadily growing both in Korea and abroad, and the number of aging structures more than 30 years old has also increased. Existing safety diagnosis and maintenance have limitations. The reliability of the diagnosis results is low; efficient internal and external inspections are difficult; and time and monetary costs are high because professional personnel are performing visual inspections or using nondestructive testing equipment. Therefore, developing autonomous systems for efficient inspection and maintenance of structures, such as bridges and high-rise buildings, is necessary.
With the increasing demands for autonomous systems in the field of inspection, the use of unmanned aerial vehicles (UAVs) to replace human labor is becoming more frequent. Perhaps the greatest obstacle to fully automated bridge inspection using a UAV is the GPS (Global Positioning System)-denied environment found under a bridge. For automated bridge inspection, being able to estimate the UAV location is necessary. Aerial vehicles, which are typically used outdoors, estimate their locations on the basis of integrated information obtained from the GPS and an onboard inertial navigation system (INS). However, due to the nature of large bridges, the area below such a bridge is a sheltered area where GPS signals are not available, and due to the influence of the many steel structures that compose the bridge, estimation by a UAV of its precise location is difficult. Nevertheless, to perform inspections under large bridges, autonomous UAVs need to be able to accurately estimate their positions and follow a planned path.
Since the beginning of the 21st Century, many studies have addressed the inspection of structures using robotic technologies [1,2,3,4,5,6,7,8,9,10,11]. However, most of these approaches require preinstalled infrastructures, such as ropes or other platforms, or are mostly controlled by human operators. In addition, the accessibility of some parts of bridges is limited for these systems. Although a few robots have been developed that do not require supporting infrastructures, they do not have sufficient payloads and do not guarantee safety during operation [12,13,14].
Previously, our team introduced several wall-climbing-type UAVs for micro-inspection of the surfaces of bridges [15,16,17]. While these UAVs may overcome the shortcomings of the above systems, the technological readiness level is not high enough to operate them for a long time, so they are not suitable for use in bridge inspection immediately. Nevertheless, with the development of UAV technology, UAVs have recently begun to be used in many fields. UAVs equipped with sensors such as GPS receivers, inertial measurement units (IMUs), and cameras have made it possible to inspect bridges on a large scale, overcoming the disadvantages of traditional methods. For example, some studies proposed a method that involved acquiring an image of the underside of a bridge using a camera mounted on top of a UAV, which was later analyzed by a specialist [18]. Similarly, a method for detecting cracks in steel bridge members based on image data obtained using small UAVs has been presented [19]. A visual inspection strategy was introduced based on the use of a UAV to generate a 3D point cloud and an image map using images captured by a camera [20]. Another work suggested a visual servoing method to stabilize image capture for a target position by applying soft-force feedback based on comparisons of the captured images [21]. In general, however, most of the contributions listed above are heavily reliant on low-level stabilization control and GPS signals for position maintenance, or at least they assume certain situations. The major remaining problem is that when UAVs are flying near or below a bridge for inspection, the GPS signal might be lost, resulting in unstable flight and consequently causing the acquired image quality to degrade. This has been the greatest challenge hindering the use of UAVs in the field of bridge inspection. One solution for localization and mapping in a GPS-denied environment is simultaneous localization and mapping (SLAM) based on various sensors, such as IMUs, cameras, and LiDARs (Light Detection and Ranging).
In 2015, the Robotics Institute of Carnegie Mellon University developed a project called the Aerial Robotic Infrastructure Analyst (ARIA), which introduced a new concept to bridge inspection. In ARIA, the researchers used a UAV with a rotating 2D LiDAR to estimate its odometry and map the target bridge. The developed algorithm, called LiDAR odometry and mapping (LOAM) [22], enabled safe, efficient, and high-precision assessment of critical infrastructure. With LOAM, the UAV could fly safely near or under bridges; however, the feasibility tests performed for verification were conducted in bridge environments with short paths and little movement. Later, a lightweight and ground-optimized LOAM (LeGO-LOAM) [23] was proposed; however, it was utilized for ground vehicles. Surfel-based mapping (SuMA) [24] was proposed to provide 3D LiDAR odometry and mapping using surfels, which are efficient in representing large environments. In addition, considerable recent studies on deep-learning-based LiDAR odometry or SLAM have been carried out and have shown its potential [25,26,27].
In recent years, researchers have become interested in implementing either visual SLAM or odometry in the absence of GPS signals; examples of the corresponding methods include parallel tracking and mapping (PTAM) [28], large-scale direct SLAM (LSD-SLAM) [29], oriented FAST and rotated BRIEF SLAM (ORB-SLAM) [30], semidirect visual odometry (SVO) [31], direct sparse odometry (DSO) [32], and monocular visual-inertial state estimator (VINS-Mono) [33]. Most of them have shown excellent results in terms of localization and mapping. Nevertheless, the environments near bridges are often subject to harsh conditions involving strong winds or obstacles, and consequently, the need for a more robust algorithm to prevent crashing of UAVs carrying expensive inspection equipment has emerged.
To overcome the disadvantages of vision-only and LiDAR-only methods, LiDAR has been widely incorporated with other techniques in recent years. Some researchers proposed a SLAM method called vision-enhanced LiDAR odometry and mapping (VELO), which relies on multiple cameras tightly coupled with a LiDAR [34]. The authors of LOAM [22] improved on their previous work by taking visual odometry output as a motion prior followed by LiDAR odometry; the corresponding method is known as V-LOAM [35]. A tightly coupled LiDAR inertial odometry and mapping method called LIO-mapping [36] has also been developed that adopts the scheme of LOAM in combination with VINS-Mono. In addition, industry or governmental research institutes have also provided solutions that can be used for the surveillance of various types of infrastructure using UAVs by applying LiDAR-based 3D SLAM methods [37,38]. However, these methods are not optimized for practical inspection, and modifying either the hardware or software to better suit the user’s purpose is not easy.
An overview of our group’s entire framework of research on autonomous structural inspection is shown in Figure 1. In our previous papers, we presented significant results related to coverage path planning [39] and a brief introduction to the overall framework that consists of preflight 3D mapping, viewpoint selection, and path planning followed by in-flight localization and online inspection [40]. In this paper, we focus on 3D mapping and a localization method in the context of hierarchical graph-based SLAM using multiple sensors and the implementations of high-level control of the autonomous flight for the purpose of bridge inspection using a UAV. For robustness, visual-inertial (VI) state estimates and the corresponding LiDAR sweep are combined into subnodes. Then, they are combined into a supernode that is comprised of states and a submap (accumulated scan data). The constraints are generated using the LiDAR-based normal distribution transform (NDT) [41,42] and generalized iterative closest point (G-ICP) matching [43]. Before full global optimization, NDT locally optimizes the relationship between subnodes in the hierarchical scheme. This enables accurate localization and mapping of the UAV surroundings for autonomous navigation without operator intervention. Both 3D mapping and localization steps use the hierarchical graph-based (HG)-SLAM structure proposed in this paper. With our system, the drone can fly reliably over and under a bridge and acquire high-quality images sufficient for image-based inspection. In addition, the efficacy of the proposed system is verified through various simulations and experiments. Additionally, using our developed system, another group has performed highly successful bridge inspection and diagnosis based on the acquired image dataset [44].
The main contributions of this paper are listed as follows:
- To the best of our knowledge, this paper presents the first experimental validation that encompasses autonomous bridge inspection with a UAV that utilizes a graph-based SLAM method fusing data from multiple sensors, such as a camera, an inertial measurement unit (IMU), and a 3D LiDAR. It proposes a methodology for each component of the proposed framework for applying a UAV to actual bridge inspection.
- The proposed graph structure for SLAM offers two types of optimization with two different sensors on the aerial vehicle: local (VI odometry (VI-O) and NDT) and global (G-ICP). Although node generation based on VI odometry alone tends to easily diverge depending on the environment, VI odometry combined with NDT-based odometry can robustly generate nodes with hierarchical optimization. Therefore, the robustness of node generation can be guaranteed.
- The proposed method was tested on two different types of large-scale bridges presenting different flight scenarios (Figure 2). The experimental results are compared with other state-of-the-art algorithms based on the ground-truth measurements of the bridges. Our experimental results can be seen on a public media site (experiment video: https://youtu.be/K1BCIGGsxg8).
The rest of this paper is organized as follows. Section 2.1.1 and Section 2.1.2 introduce the proposed hierarchical graph-based SLAM approach in detail. Section 2.2 describes the technical implementation of the control scheme, and Section 3 reports the results of several outdoor experiments. Finally, Section 4 concludes by summarizing the overall implementation, addressing the difficulties and challenges faced and discussing future work.
2. Materials and Methods
2.1. Proposed Hierarchical Graph-Based Slam
2.1.1. Graph Structure
Our approach to the fusion of data from multiple sensors (camera and LiDAR) is based on the pose graph SLAM scheme [45], which is applied to construct and solve nonlinear optimization problems with a limited sensor measurement history and limited UAV states. The overall flow diagram of the proposed SLAM method is presented in Figure 3. The graph essentially consists of a set of nodes and a set of edges. The nodes represent the UAV poses, and the edges constrain the nodes based on the relative measurements of pairs of nodes. In particular, unlike ground mobile robots, the aerial vehicles considered in this paper may be placed in a dangerous situation in the case of incorrect pose estimation; therefore, we define the basic nodes as supernodes and further establish multiple subnodes that make up a supernode (Figure 4). Each supernode represents the UAV pose and submap, and each subnode consists of a state estimation obtained using VI odometry and the corresponding point cloud data. The subnodes are connected by constraints derived via VI odometry, and once a certain number of subnodes are generated, NDT matching creates an additional constraint. The G-ICP algorithm then creates global constraints relating the supernodes, and batch optimization is performed for all poses represented by the supernodes and subnodes.
In the first step, VI odometry is applied to estimate the camera pose in the local coordinates based on information provided by the camera-IMU sensor system mounted on the UAV. Here, we adopt VINS-Mono [33], which is a sliding window smoothing method, as the base node generator. A node is generated every time a pose is estimated through VI odometry. However, the results obtained through VI odometry are subject to some drift error, and moments occur at which no odometry information is provided when the UAV purely rotates or due to sudden movements. Therefore, another sensor-based odometry estimation method is additionally needed to ensure robust node generation.
LiDAR sensors can obtain high-precision information from the environment, allowing a UAV to perform odometry measurements. The basic principle of LiDAR odometry is to calculate the transformation between two consecutive point cloud frames, which are called the reference and input point clouds, through matching. The purpose of the matching process, also called point cloud registration, is to obtain the optimal transformation matrix for matching or aligning the reference frame with the input frame.
NDT [41,42], which is represented in the form of a combination of normal distributions, describes the probability of finding a surface point at a certain position. For NDT-based odometry, regular cubic cells are defined to subdivide the point cloud set, and the points in each cell are continuously modeled by a normal distribution. In this paper, the accuracy of NDT-based odometry is improved by accumulating previous point cloud data. In addition, the result of VI odometry is used to initialize the parameters of the NDT [41]. To estimate the UAV pose at the j-th subnode from the ()-th subnode, the point cloud at the j-th subnode is set as the target point cloud in the NDT function, and the point cloud at the ()-th subnode is set as the query point cloud. The target point cloud () can be defined as the accumulated point cloud data from the ()-th and the j-th subnodes as follows:
where denotes the local LiDAR sweep or the query point cloud for registration at the j-th subnode and is the result of the transformation of pose at the j-th subnode from the ()-th subnode. In this way, the 3D LiDAR scan data are accumulated to form the reference point cloud at every certain step to manage the size of the reference point cloud.
To map the bottom part of the target bridge, we use a tilted 3D LiDAR attached to the underside of the UAV. For mounting on the UAV, the LiDAR is usually small and lightweight, so the scan is sparse. Thus, each UAV pose can have only a very small overlapping area or no overlapping area at all, which may result in low scan matching quality. Since VI odometry provides highly reliable odometry measurements over short intervals, one “supernode” can be created by stacking multiple subnodes generated based on VI odometry and NDT odometry over a certain distance, as shown in Figure 4. When the information from a single LiDAR sweep is not sufficient for matching, an accumulation approach can be used. Let be the i-th supernode consisting of subnodes and their scan data, denoted by , where denotes the subnode belonging to the supernode , denotes the local LiDAR sweep, and k denotes the number of subnodes in the supernode. Let us define the j-th element of the i-th supernode as . Then, the local submap of the i-th supernode can be obtained as follows:
where denotes the coordinate transformation matrix from the LiDAR to the UAV, denotes the transformed subnode in the i-th supernode, and j is a subnode index.
For global scan matching, the supernodes can be registered using their local point cloud maps via the iterative closest point (ICP) algorithm [46]. The ICP algorithm is a simple way of calculating the transformation between two consecutive scans by recursively searching for pairs of neighboring points in the two scans and minimizing the sum of the point-to-point or point-to-plane distances. However, because the local maps generated via VI and NDT odometry can be sparse in density, the normal ICP algorithm that relies on point-to-point or point-to-plane relationships cannot achieve clear matching. Therefore, instead of normal ICP matching, G-ICP matching [43] is applied, which can utilize sparse data to capture the data tendency during the optimization process. Since the actual surface is assumed to be at least partially distinguishable, each small part of the local map can be considered locally planar. Under this assumption, the G-ICP algorithm calculates the covariance value for each point on the local map (the covariance is larger for a direction that is more parallel to the plane and smaller for a direction that is closer to the normal direction). Finally, it checks the similarity of the covariances between each pair of points and sets corresponding matching scores.
2.1.2. Graph Optimization
Once the graph is constructed, the optimization process consists of finding the best node configuration for all available measurements. The measurements are affected by noise, which is assumed to be additive, white, and normally distributed with a mean of zero. Figure 4 shows a graphical description of our pose graph-based SLAM method. Let be the state vector, where the node is a pose vector; let be the set of measurement values; and let be the information matrix of the measurements, which is the inverse of the covariance matrix. Then, denotes the residual error between the actual and predicted observations as follows:
where denotes the predicted measurement derived from the nodes. Maximum-likelihood estimation (MLE) seeks the optimal state configuration , as follows:
where denotes a set of constrained pose pairs . Since optimizing the UAV trajectory is equivalent to minimizing the Mahalanobis distance of the residual errors, i.e., in (3), which is generally a nonlinear function, the optimization problem can be solved through nonlinear least-squares optimization with proper linearization, as follows:
where and are the Hessian and gradient, respectively, of the right-hand side of (4), such that:
where denotes the Jacobian of the error function (3) with respect to . In the present study, the incremental smoothing and mapping (iSAM) algorithm [47] is utilized to optimize the full trajectory of the UAV and generate a precise 3D point cloud map.
2.2. High-Level Control Scheme
The goal of autonomous flight for inspection is to follow a specified path designed to enable the inspection of all surfaces. To achieve this purpose, several points must be considered for control of the UAV. The requirements necessary for autonomous flight are described briefly as follows.
First, when the UAV flies along the specified path, the cumulative image data acquired by the mounted camera must cover all surfaces of the bridge. To meet the first requirement for successful autonomous flight, a path consisting of waypoints is designed based on a prebuilt point cloud map of the bridge as part of preflight processing. Second, two time-consecutive camera images must overlap at a ratio higher than a certain value to ensure that the surface can be continuously inspected. Therefore, the UAV should move at a nearly constant speed when moving along the path. By means of a control scheme with constant speed and heading angle, the UAV can fulfill the second requirement. Finally, it is essential to design an accurate path-following method to allow the UAV to resist wind gusts that would force it off its path and to ensure that the UAV does not miss the bridge surface to be inspected. In this paper, a simplified line-of-sight (LoS) algorithm is used as the path-following scheme. This simplified LoS algorithm is a compact version of the ordinary LoS algorithm [48]. The LoS algorithm is a path-following scheme for natural motion and robust path return that relies on setting local goals along the path based on the perpendicular distance between the UAV position and the path. As in the ordinary LoS algorithm, the simplified LoS algorithm first obtains the next local goal by drawing a sphere. This local goal is defined as the intersection between the path and this sphere, whose radius is the LoS radius and the center point is the location of the UAV. In addition, the LoS vector () between the current location and the local goal of the UAV is obtained. In this way, by applying the simplified LoS algorithm, a velocity vector with the same direction as the LoS vector and a speed () that is suitable for bridge inspection is derived as follows: .
3. Field Experimental Results
3.1. Platform and Experimental Setup
A field test was performed to verify the feasibility of our method for inspecting bridges. Our field experiment platform is shown in Figure 5. The body was designed and developed by a collaborating company; the dimensions are approximately 1090 mm × 1090 mm × 450 mm (length × width × height); the maximum flight time is 30∼35 min; and the weight is 12 kg without batteries (Table 1). The sensor system has frame rates of 40 Hz for the camera, 240 Hz for the IMU, and 10 Hz for the 3D LiDAR. For node generation, VI odometry is run at 20 Hz, and NDT-based odometry is performed at approximately 3 Hz, while G-ICP matching is run at 1 Hz to generate global constraints. The embedded NUCis connected to Pixhawk via Telem2 port, and Pixhawk obtains the current HG-SLAM pose and orientation estimation through the topic /mavros/vision_pose and sends the IMU data, local position for the feedback, and velocity in the body frame to the PC.
In this study, our method was tested for two types of bridges, a riverside bridge and a sea-crossing bridge. For a bridge located on the ground, the camera is installed to look downward to extract feature points of the ground, whereas for a bridge located over the sea (or a river), an upward-looking camera is installed on the UAV instead of a downward-looking camera so that it can see the bottom of the bridge. Deungseon Bridge in Chuncheon, Korea (Figure 6a), and Geobukseon Bridge in Yeosu, Korea (Figure 6b), were chosen as the test sites. For Deungseon Bridge, considering the flight time limitations, we planned a path to inspect only two spans, although the entire bridge is 2 km long. The distance between adjacent spans of the bridge is 50 m, the height of each column is 14.5 m, and the width of the bridge is 11 m. Geobukseon Bridge, on the other hand, has a total length of 744 m and a 230 m span, and in this study, only one span without main towers was tested. The height of each bridge column is 23 m, and the bridge is 20 m wide.
Before fully applying our SLAM algorithm for navigation near an actual bridge, we first tested the stability of the local optimization method (relating subnodes by means of VI and NDT-based odometry constraints once the UAV has moved a certain distance based on the VI odometry results) to ensure the robustness of basic node generation, as explained in Section 2.1.1. Figure 7 shows a noticeable difference. The point cloud map shown in Figure 7a is the result obtained when VI odometry alone is used to generate the nodes. Close inspection of the region in the white circle reveals that the bottom of the bridge and the column appear curved. This is due to the drift error of VI odometry when there are few loop closures, which results in errors in the map and in position estimation as a whole. The cumulative error creates considerable problems when flying over long distances and increases the risk of the UAV falling. In contrast, local optimization with NDT-based odometry results in straight lines for the columns and the bottom of the bridge, as shown in Figure 7b. The resulting position estimates can also be expected to be accurate. This occurs because the estimation is not divergent even if loop closing does not occur frequently since the basic node generation is optimized locally in a hierarchical structure.
Figure 8 compares the results of trajectory estimation using our method with the results obtained using VI odometry and GPS positioning in two different scenarios: straight and zigzag. In the straight scenario, the VI odometry result shows a slightly larger drift in translation and rotation, whereas our proposed method yields a relatively accurate result. In the zigzag scenario, the VI odometry result shows a considerably larger drift than in the previous scenario because the zigzag path includes many pure rotations, which are known to cause significant degeneracy [49]. In both cases, the height estimates obtained via VI odometry also show fluctuations, even though the UAV maintained a height of 5 m.
3.2. Experimental Results
At Deungseon Bridge, the UAV was operated to navigate underneath the bridge except for viewpoint selection and mission triggering, which are not addressed in this paper. The results for the given path are shown in Figure 9 and Figure 10. We conducted two experiments at Deungseon Bridge, one with a simple straight path and one with a complicated zigzag flight path. Our method and LIO-mapping [36] both require an initialization step due to the use of VINS-Mono [33] for initializing extrinsic parameters; therefore, before take-off, we conducted a handheld initialization in both scenarios.
Figure 9 compares the results obtained in the simple straight flight path experiment at Deungseon Bridge using our proposed method, LOAM [22], and LIO-mapping. All methods achieved good localization, without losing the position of the UAV, but showed slightly different error rates in mapping.
Figure 10 compares the results obtained in the zigzag path flight experiment at Deungseon Bridge using our method, LOAM, and LIO-mapping. In this scenario, all three methods also showed good localization performance; however, the mapping results again showed slightly different error rates. The numerical analysis results for both cases are presented in Table 2. The detailed view of the final map of Deungseon Bridge obtained using each method is illustrated in Figure 11. LOAM achieved low-noise mapping performance with clean, straight lines; however, the streetlights were missing in several places, and most of the area of the last bridge column was not mapped, as shown in Figure 11b. In the case of LIO-mapping, the ability to capture straight lines was insufficient compared to LOAM or our method, and as seen from both the front and side views, significant noise was introduced into the map. LIO-mapping also did not achieve good mapping performance for the last bridge column, as shown in Figure 11c. Finally, as seen from a visual inspection of Figure 11a, the performance of our proposed method was superior overall in terms of street lamp representation, straight line reproduction, bridge column mapping, and so on. From the experimental results obtained in these two different scenarios, our method is confirmed to show higher accuracy in performing SLAM for a riverside bridge with many visual and geometric features.
In the case of a sea-crossing bridge, however, the situation is considerably different, with fewer distinctive visual or geometric features than in the case of a riverside bridge; as a result, estimation based on either VI odometry only or LiDAR only may easily fail to converge because the corresponding environment tends to cause almost half of a single image or LiDAR sweep to consist of sky or sea surface. Even if sufficient geometric features exist, VI odometry based on an upward-looking camera becomes vulnerable to disturbances such as changes in illumination caused by sunlight. A greater problem is presented by the strong winds (over 12 m/s on average at the time of the experiment) often encountered under sea-crossing bridges, which cause the risk of loss from falls to be much greater than in the case of land bridges. For these reasons, we conducted remote-controlled navigation at Geobukseon Bridge with a simple path only. Figure 12 compares the 3D maps of Geobukseon Bridge acquired using our method, LOAM, and LIO-mapping. Unlike in the case of Deungseon Bridge, the three algorithms were not all able to produce neat mapping results for Geobukseon Bridge. In the case of LOAM, as shown in Figure 12b, although the results did not significantly diverge, the base deck of the bridge appeared slightly thicker than it did in the results of the other methods due to a slight divergence in the z-axis. LIO-mapping showed better performance in mapping the target bridge than LOAM, but the final map was slightly noisier than that obtained with LOAM due to the frequent occurrence of low sweep matching results, as shown in Figure 12c. By contrast, our method showed good mapping quality without any divergence or mismatch, as visualized in Figure 12a.
Since no precise GPS signal is available under bridges, our algorithm was evaluated by comparing the mapping results with the actual bridge measurements according to the blueprints rather than precise real-time kinematic (RTK)-GPS results. The measured intervals are indicated in Figure 6. To ensure accurate comparisons, the average value for each measured quantity was calculated by randomly sampling 10 points on the corresponding part of the 3D maps obtained via SLAM in each environment using the point-to-point distance measurement tool of the CloudCompare software package [50]. The comparison outcomes are summarized in Table 2. In the case of the proposed algorithm, the errors from the sea-crossing bridge experiment are slightly higher than those for the riverside bridge, but none of them exceeds 2%. In contrast, in the case of LOAM [22], the Deungseon Bridge results show a slightly higher error rate than that of the proposed method for each part, while for the Geobukseon Bridge data, the errors are much higher; for in particular, the error is close to 10%. This finding can be attributed to the divergence of LOAM when the UAV was flying near the middle of the bridge due to the lack of LiDAR feature points provided by the water surface below the bridge. Furthermore, intermittent failure cases due to divergence also occurred. LIO-mapping [36] showed a performance similar to that of LOAM, with an error rate of approximately 1 to 3%; although its mapping error rate for Geobukseon Bridge was lower than that of LOAM, it showed a larger error rate than the proposed method in all cases.
Because the LiDAR is mounted with a tilt angle of 45 degrees at the rear of the UAV for the mapping of the bridge, there are few features in a sweep to be extracted. As mentioned before, the LiDAR data is sparse, and there are few overlapping areas, so the quality of sweep matching is not good. However, our method has a hierarchical structure that accumulates the point cloud map and improves the matching performance. Besides, by additionally using VI-O to overcome the limitations of a single sensor in the feature-poor environment, the robustness of the entire SLAM can be secured. It is analyzed that LOAM (w/o IMU) showed relatively high orientation errors in most rotations, which makes the odometry and mapping inaccurate. This can be seen in Figure 12b, since LOAM processes with a few selected features with high/low curvatures, which makes it less accurate where there are sparse features. It is also difficult to accurately model the relative pose uncertainty since the LOAM only gives constraints between two consecutive scans. LIO-mapping sometimes fails on some mapping sequences due to error-prone data association at Deungseon Bridge (Figure 11c), a relatively cluttered environment. However, at Geobukseon Bridge, in comparison with LOAM, the results show that combining IMU and LiDAR can effectively improve the accuracy of the pose estimation and mapping with limited overlapping of LiDAR sweeps (Figure 12c). Furthermore, LIO mapping showed improved accuracy, benefiting from rotation-constrained refinements in the mapping step.
Finally, Figure 13 shows the results of experiments conducted in accordance with our overall framework for autonomous bridge inspection, as mentioned previously. In this scenario, preflight 3D mapping and path planning followed by in-flight localization and UAV control were applied in sequence. Figure 13a illustrates the estimated trajectory from waypoints #1 to #21 along the bottom part of the bridge. The color bar denotes the speed of the UAV, which can be calculated as the sum of the square root of the velocity on each axis. Because we set the maximum speed to 1 m/s, the values do not exceed this threshold. Figure 13b shows the trajectory plotted on the satellite map for comparison with the GPS-based trajectory, which illustrates the need for precise localization in a GPS-denied environment.
4. Discussion and Conclusions
To support the ongoing shift from human labor toward the use of autonomous systems in structural inspection, this paper demonstrated a hierarchical SLAM algorithm for performing UAV-based inspections of infrastructure to address the unreliability of GPS-based localization underneath structures. To ensure robustness and stability, the proposed SLAM algorithm uses VI odometry and NDT-based odometry to generate multiple subnodes composing each supernode, thus applying a sort of local optimization. Based on the outcomes of this robust odometry method, the G-ICP algorithm is then applied to generate global constraints to globally optimize the complete trajectory. In addition, the details of the high-level control scheme for actually operating a UAV during a bridge inspection mission was introduced to allow the UAV to fly along the given path and cover the entire area of the bridge while maintaining a constant speed to ensure sufficient image quality. The proposed method was evaluated in several outdoor experiments conducted at a riverside bridge and a sea-crossing bridge. Overall, the results demonstrate the feasibility and stable performance of the proposed approach. A few of the difficulties and challenges encountered during the field experiments are summarized below:
- Transient strong winds below the sea-crossing bridge: Even if accurate position estimation is possible under a bridge, if a wind gust of over 10 m/s suddenly occurs, the risk that the UAV will fall markedly increases. Addressing this problem will require improvement of the hardware of the aircraft itself or an improved control algorithm that can better cope with strong winds.
- Difficulty in precise synchronization of the obtained images and pose estimates: In the current system, the image and pose data are stored separately, and the operator manually synchronizes them later. In this case, the possibility that the data may not be properly synchronized arises. Therefore, in the future, the entire image acquisition system will be improved and integrated into the Robot Operating System (ROS) to enable accurate synchronization.
Future research will focus on developing a more reliable SLAM system for field tests at sea-crossing bridges. In addition, methods for online structural inspection permitting on-the-fly detection of bridge defects will be developed as the final step of our framework (Figure 1). With further research, we hope to define a more generalized overall framework for autonomous structural inspection and release an implementation of this framework as open-source software.
Author Contributions
Conceptualization, S.J. and D.C.; methodology, S.J. and S.S.; software, S.J., D.C., and S.S.; validation, S.J., D.C., and S.S.; formal analysis, S.J.; investigation, S.S.; resources, S.J.; data curation, S.S.; writing, original draft preparation, S.J. and D.C.; writing, review and editing, H.M.; visualization, S.J. and S.S.; supervision, H.M. All authors read and agreed to the published version of the manuscript.
Funding
This research was supported by a grant (Contract No. 20200302731-00) from the Drone Safety and Activation Support Consignment Project of the Korea Institute of Aviation Safety Technology (KIAST). We also thank XDrone Co. (22, Yeouidaebang-ro 67-gil, Yeongdeungpo-gu, Seoul, Republic of Korea) for offering a UAV platform.
Acknowledgments
This work was partially supported by BK21 FOUR and Korea Ministry of Land, Infrastructure and Transport 362 (MOLIT) as ‘Innovative Talent Education Program for Smart City’.
Conflicts of Interest
The authors declare no conflict of interest.
References
- DeVault, J.E. Robotic system for underwater inspection of bridge piers. IEEE Instrum. Meas. Mag. 2000, 3, 32–37. [Google Scholar] [CrossRef]
- Prasanna, P.; Dana, K.J.; Gucunski, N.; Basily, B.B.; La, H.M.; Lim, R.S.; Parvardeh, H. Automated crack detection on concrete bridges. IEEE Trans. Autom. Sci. Eng. 2014, 13, 591–599. [Google Scholar] [CrossRef]
- Oh, J.K.; Jang, G.; Oh, S.; Lee, J.H.; Yi, B.J.; Moon, Y.S.; Lee, J.S.; Choi, Y. Bridge inspection robot system with machine vision. Autom. Constr. 2009, 18, 929–941. [Google Scholar] [CrossRef]
- Lee, J.H.; Lee, J.M.; Kim, H.J.; Moon, Y.S. Machine vision system for automatic inspection of bridges. In Proceedings of the Congress on Image and Signal Processing, Hainan, China, 27–30 May 2008; pp. 363–366. [Google Scholar]
- Murphy, R.R.; Steimle, E.; Hall, M.; Lindemuth, M.; Trejo, D.; Hurlebaus, S.; Medina-Cetina, Z.; Slocum, D. Robot-assisted bridge inspection. J. Intell. Robot. Syst. 2011, 64, 77–95. [Google Scholar] [CrossRef]
- Lim, R.S.; La, H.M.; Shan, Z.; Sheng, W. Developing a crack inspection robot for- bridge maintenance. In Proceedings of the IEEE International Conference on Robotics and Automation (ICRA), Shanghai, China, 9–13 May 2011; pp. 6288–6293. [Google Scholar]
- Akutsu, A.; Sasaki, E.; Takeya, K.; Kobayashi, Y.; Suzuki, K.; Tamura, H. A comprehensive study on development of a small-sized self-propelled robot for bridge inspection. Struct. Infrastruct. Eng. 2017, 13, 1056–1067. [Google Scholar] [CrossRef]
- Peel, H.; Luo, S.; Cohn, A.; Fuentes, R. Localisation of a mobile robot for bridge bearing inspection. Auto. Constr. 2018, 94, 244–256. [Google Scholar] [CrossRef]
- Sutter, B.; Lelevé, A.; Pham, M.T.; Gouin, O.; Jupille, N.; Kuhn, M.; Lulé, P.; Michaud, P.; Rémy, P. A semi-autonomous mobile robot for bridge inspection. Auto. Constr. 2018, 91, 111–119. [Google Scholar] [CrossRef] [Green Version]
- La, H.M.; Gucunski, N.; Dana, K.; Kee, S.H. Development of an autonomous bridge deck inspection robotic system. J. Field Robot. 2017, 34, 1489–1504. [Google Scholar] [CrossRef] [Green Version]
- Ikeda, T.; Yasui, S.; Fujihara, M.; Ohara, K.; Ashizawa, S.; Ichikawa, A.; Okino, A.; Oomichi, T.; Fukuda, T. Wall contact by octo-rotor UAV with one DoF manipulator for bridge inspection. In Proceedings of the IEEE/RSJ International Conference on Intelligent Robots and Systems (IROS), Vancouver, BC, Canada, 24–28 September 2017; pp. 5122–5127. [Google Scholar]
- Pham, N.H.; La, H.M. Design and implementation of an autonomous robot for steel bridge inspection. In Proceedings of the 54th Annual Allerton Conference on Communication, Control, and Computing (Allerton), Monticello, IL, USA, 27–30 September 2016; pp. 556–562. [Google Scholar]
- Mazumdar, A.; Asada, H.H. Mag-foot: A steel bridge inspection robot. In Proceedings of the IEEE/RSJ International Conference on Intelligent Robots and Systems (IROS), Louis, MO, USA, 11–15 October 2009; pp. 1691–1696. [Google Scholar]
- Sanchez Cuevas, P.J.; Ramon-Soria, P.; Arrue, B.; Ollero, A.; Heredia, G. Robotic system for inspection by contact of bridge beams using UAVs. Sensors 2019, 19, 305. [Google Scholar] [CrossRef] [PubMed] [Green Version]
- Jung, S.; Shin, J.U.; Myeong, W.; Myung, H. Mechanism and system design of MAV (Micro Aerial Vehicle)-type wall-climbing robot for inspection of wind blades and non-flat surfaces. In Proceedings of the International Conference on Control, Automation and Systems (ICCAS), Busan, Korea, 13–16 October 2015; pp. 1757–1761. [Google Scholar]
- Myeong, W.; Jung, S.; Yu, B.; Chris, T.; Song, S.; Myung, H. Development of Wall-climbing Unmanned Aerial Vehicle System for Micro-Inspection of Bridges. In Proceedings of the Workshop on The Future of Aerial Robotics: Challenges and Opportunities, International Conference on Robotics and Automation (ICRA), Montreal, QC, Canada, 20–24 May 2019. [Google Scholar]
- Myeong, W.; Myung, H. Development of a wall-climbing drone capable of vertical soft landing using a tilt-rotor mechanism. IEEE Access. 2018, 7, 4868–4879. [Google Scholar] [CrossRef]
- Yang, C.H.; Wen, M.C.; Chen, Y.C.; Kang, S.C. An optimized unmanned aerial system for bridge inspection. In Proceedings of the International Symposium on Automation and Robotics in Construction, Oulu, Finland, 15–18 June 2015; Volume 32, pp. 1–6. [Google Scholar]
- Dorafshan, S.; Maguire, M.; Hoffer, N.V.; Coopmans, C. Challenges in bridge inspection using small unmanned aerial systems: Results and lessons learned. In Proceedings of the International Conference on Unmanned Aircraft Systems (ICUAS), Miami, FL, USA, 13–16 June 2017; pp. 1722–1730. [Google Scholar]
- Hallermann, N.; Morgenthal, G. Visual inspection strategies for large bridges using Unmanned Aerial Vehicles (UAV). In Proceedings of the 7th International Conference on Bridge Maintenance, Safety and Management, Shanghai, China, 7–11 July 2014; pp. 661–667. [Google Scholar]
- Metni, N.; Hamel, T. A UAV for bridge inspection: Visual servoing control law with orientation limits. Auto. Constr. 2007, 17, 3–10. [Google Scholar] [CrossRef]
- Zhang, J.; Singh, S. LOAM: LiDAR Odometry and Mapping in Real-time. In Proceedings of the Robotics: Science and Systems (RSS), Pittsburgh, PA, USA, 12–16 July 2014. [Google Scholar]
- Shan, T.; Englot, B. LeGO-LOAM: Lightweight and ground-optimized LiDAR odometry and mapping on variable terrain. In Proceedings of the IEEE/RSJ International Conference on Intelligent Robots and Systems (IROS), Barcelona, Spain, 1–5 October 2018; pp. 4758–4765. [Google Scholar]
- Behley, J.; Stachniss, C. Efficient Surfel-Based SLAM using 3D Laser Range Data in Urban Environments. In Proceedings of the Robotics: Science and Systems (RSS), Pittsburgh, PA, USA, 26–30 June 2018. [Google Scholar]
- Li, Q.; Chen, S.; Wang, C.; Li, X.; Wen, C.; Cheng, M.; Li, J. LO-Net: Deep Real-time LiDAR Odometry. In Proceedings of the IEEE Conference on Computer Vision and Pattern Recognition (CVPR), Long Beach, CA, USA, 16–20 June 2019; pp. 8473–8482. [Google Scholar]
- Chen, X.; Milioto, A.; Palazzolo, E.; Giguere, P.; Behley, J.; Stachniss, C. SuMa++: Efficient LiDAR-based semantic SLAM. In Proceedings of the IEEE/RSJ International Conference on Intelligent Robots and Systems (IROS), Macau, China, 4–8 November 2019; pp. 4530–4537. [Google Scholar]
- Wang, N.; Li, Z. DMLO: Deep Matching LiDAR Odometry. arXiv 2020, arXiv:2004.03796. [Google Scholar]
- Klein, G.; Murray, D. Parallel tracking and mapping for small AR workspaces. In Proceedings of the IEEE and ACM International Symposium on Mixed and Augmented Reality, Nara, Japan, 13–16 November 2007; pp. 1–10. [Google Scholar]
- Engel, J.; Schöps, T.; Cremers, D. LSD-SLAM: Large-scale direct monocular SLAM. In Proceedings of the European Conference on Computer Vision (ECCV), Zurich, Switzerland, 6–12 September 2014; pp. 834–849. [Google Scholar]
- Mur-Artal, R.; Montiel, J.M.M.; Tardos, J.D. ORB-SLAM: A versatile and accurate monocular SLAM system. IEEE Trans. Robot. 2015, 31, 1147–1163. [Google Scholar] [CrossRef] [Green Version]
- Forster, C.; Pizzoli, M.; Scaramuzza, D. SVO: Fast semi-direct monocular visual odometry. In Proceedings of the IEEE International Conference on Robotics and Automation (ICRA), Hong Kong, China, 31 May–5 June 2014; pp. 15–22. [Google Scholar]
- Engel, J.; Koltun, V.; Cremers, D. Direct sparse odometry. IEEE Trans. Pattern. Anal. Mach. Intell. 2017, 40, 611–625. [Google Scholar] [CrossRef] [PubMed]
- Qin, T.; Li, P.; Shen, S. VINS-Mono: A robust and versatile monocular visual-inertial state estimator. IEEE Trans. Robot. 2018, 34, 1004–1020. [Google Scholar] [CrossRef] [Green Version]
- Lu, D.L. Vision-Enhanced LiDAR Odometry and Mapping. Master’s Thesis, Carnegie Mellon University, Pittsburgh, PA, USA, 2016. [Google Scholar]
- Zhang, J.; Singh, S. Visual-LiDAR odometry and mapping: Low-drift, robust, and fast. In Proceedings of the IEEE International Conference on Robotics and Automation (ICRA), Seattle, WA, USA, 25–30 May 2015; pp. 2174–2181. [Google Scholar]
- Ye, H.; Chen, Y.; Liu, M. Tightly coupled 3D LiDAR inertial odometry and mapping. In Proceedings of the IEEE International Conference on Robotics and Automation (ICRA), Montreal, QC, Canada, 20–24 May 2019; pp. 3144–3150. [Google Scholar]
- CSIRO-HoverMap. 2016. Available online: https://research.csiro.au/robotics/hovermap (accessed on 30 June 2020).
- DIBOTICS. 2015. Available online: http://www.dibotics.com/ (accessed on 30 June 2020).
- Jung, S.; Song, S.; Youn, P.; Myung, H. Multi-Layer Coverage Path Planner for Autonomous Structural Inspection of High-Rise Structures. In Proceedings of the IEEE/RSJ International Conference on Intelligent Robots and Systems (IROS), Barcelona, Spain, 1–5 October 2018; pp. 1–9. [Google Scholar]
- Jung, S.; Song, S.; Kim, S.; Park, J.; Her, J.; Roh, K.; Myung, H. Toward Autonomous Bridge Inspection: A framework and experimental results. In Proceedings of the International Conference on Ubiquitous Robots (UR), Jeju, Korea, 24–27 June 2019; pp. 208–211. [Google Scholar]
- Biber, P.; Straßer, W. The normal distributions transform: A new approach to laser scan matching. In Proceedings of the IEEE/RSJ International Conference on Intelligent Robots and Systems (IROS), Las Vegas, NV, USA, 27–31 October 2003; Volume 3, pp. 2743–2748. [Google Scholar]
- Magnusson, M.; Lilienthal, A.; Duckett, T. Scan registration for autonomous mining vehicles using 3D-NDT. J. Field Robot. 2007, 24, 803–827. [Google Scholar] [CrossRef] [Green Version]
- Segal, A.; Haehnel, D.; Thrun, S. Generalized-ICP. In Proceedings of the Robotics: Science and Systems (RSS), Seattle, WA, USA, 28 June–1 July 2009. [Google Scholar]
- Jung, H.J.; Lee, J.H.; Yoon, S.; Kim, I.H. Bridge Inspection and condition assessment using Unmanned Aerial Vehicles (UAVs): Major challenges and solutions from a practical perspective. Smart. Struct. Syst. 2019, 24, 669–681. [Google Scholar]
- Grisetti, G.; Kummerle, R.; Stachniss, C.; Burgard, W. A tutorial on graph-based SLAM. IEEE Intell. Transp. Syst. 2010, 2, 31–43. [Google Scholar] [CrossRef]
- Besl, P.J.; McKay, N.D. Method for registration of 3-D shapes. In Proceedings of the Sensor Fusion IV: Control Paradigms and Data Structures, Boston, MA, USA, 12–15 November 1992; Volume 1611, pp. 586–606. [Google Scholar]
- Kaess, M.; Ranganathan, A.; Dellaert, F. iSAM: Incremental smoothing and mapping. IEEE Trans. Robot. 2008, 24, 1365–1378. [Google Scholar] [CrossRef]
- Fossen, T.I. Marine Control Systems–Guidance. Navigation, and Control of Ships, Rigs and Underwater Vehicles.; Marine Cybernetics: Trondheim, Norway, 2002; ISBN 82-92356-00-2. [Google Scholar]
- Yang, Y.; Geneva, P.; Eckenhoff, K.; Huang, G. Visual-Inertial Odometry with Point and Line Features. In Proceedings of the IEEE/RSJ International Conference on Intelligent Robots and Systems (IROS), Macau, China, 4–8 November 2019; pp. 2447–2454. [Google Scholar]
- CloudCompare. 2016. Available online: https://www.danielgm.net/cc/ (accessed on 30 June 2020).
Figure 1.
Overall framework for autonomous bridge inspection using a UAV (unmanned aerial vehicles). The first two stages, 3D mapping and coverage path planning, are preflight processes. After a precise 3D map is acquired, path planning is performed by extracting the locations at which the target bridge needs to be inspected. Only the 3D mapping and localization steps and the technical control scheme for the autonomous flight system are considered in this paper. Both 3D mapping and localization steps use the hierarchical graph-based (HG)-SLAM (simultaneous localization and mapping) structure proposed in this paper.

Figure 2.
Autonomous bridge inspection in outdoor field tests: (left) bridge bottom part inspection; (right) bridge column inspection.
Figure 2.
Autonomous bridge inspection in outdoor field tests: (left) bridge bottom part inspection; (right) bridge column inspection.

Figure 3.
Overview of the proposed sensor fusion approach based on graph-based SLAM using a camera, an IMU, and a 3D LiDAR (Light Detection and Ranging). For node generation, both visual-inertial (VI) and normal distribution transform (NDT) odometry are used for robustness. Generalized iterative closest point (G-ICP) matching enables global optimization.

Figure 4.
Illustration of the proposed graph structure. The green dashed lines represent the constraints generated through VI- odometry (O)-based pose estimation, and the red dotted line represents the constraint obtained through NDT-based odometry. Thus, each subnode is composed of a state estimate obtained using VI-O and a 3D LiDAR sweep. Note that these two measurements induce local optimization within a set of subnodes to ensure stable node generation. The blue solid lines represent the constraints generated via G-ICP matching, which are used for global optimization.

Figure 5.
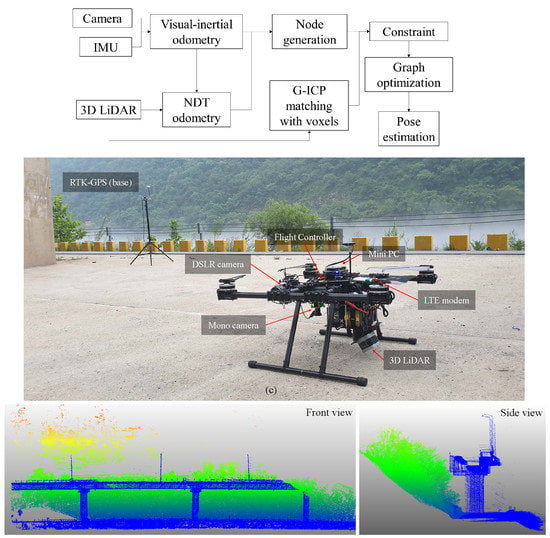
UAV used in this research. This custom-designed quadrotor-type UAV carries various sensors and devices. In the forward direction, a Sony 9 DSLR camera is mounted on a homemade gimbal for bridge inspection. At the top is a PX4-based Pixhawk 2 flight controller with a Here GPS (Global Positioning System) receiver. This GPS receiver is not used in the SLAM system being tested here, but is used later to convert the estimated local position of the drone into the global frame to serve as the ground truth when a GPS signal is available. An embedded Intel i7 NUC with 16 GB of RAM is also included for data processing. A 1280 × 1024 resolution monocular camera (PointGrey FL3-U3-13Y3M-C) is mounted in a downward-looking configuration. A 3D LiDAR system (Velodyne Puck LITE) is mounted with a tilt angle of 45 degrees at the rear of the UAV. It is also equipped with an LTE modem for remote communication, allowing the drone to be remotely operated wherever LTE communication is available.
Figure 5.
UAV used in this research. This custom-designed quadrotor-type UAV carries various sensors and devices. In the forward direction, a Sony 9 DSLR camera is mounted on a homemade gimbal for bridge inspection. At the top is a PX4-based Pixhawk 2 flight controller with a Here GPS (Global Positioning System) receiver. This GPS receiver is not used in the SLAM system being tested here, but is used later to convert the estimated local position of the drone into the global frame to serve as the ground truth when a GPS signal is available. An embedded Intel i7 NUC with 16 GB of RAM is also included for data processing. A 1280 × 1024 resolution monocular camera (PointGrey FL3-U3-13Y3M-C) is mounted in a downward-looking configuration. A 3D LiDAR system (Velodyne Puck LITE) is mounted with a tilt angle of 45 degrees at the rear of the UAV. It is also equipped with an LTE modem for remote communication, allowing the drone to be remotely operated wherever LTE communication is available.

Figure 6.
Experimental environments. (a) Deungseon Bridge (riverside bridge) and (b) Geobukseon Bridge (sea-crossing bridge) ((a) : distance between the first and second columns, : distance between the second and third columns, : bottom width of the bridge, : height of each column; (b) : distance between main columns, : height of each column, : bottom width of the bridge).

Figure 7.
Comparison of mapping results with different node generation methods. (a) Mapping result with VI odometry only. (b) Mapping result with VI and NDT-based odometry. The white circle in (a) indicates the region where the bottom of the bridge and the column appear curved because of drift error, whereas (b) shows more accurate mapping results than (a) for the 3D map of the straight structure.

Figure 8.
Trajectory estimation results. Note that the experiments were conducted under a bridge to compare the results of GPS positioning, VI odometry without loop closure (VI-O w/o LC), and the proposed SLAM method. (a) Estimation comparison for a straight trajectory. (b) Estimation comparison for a zigzag trajectory. (c) Plot of the straight trajectory results on the satellite map (red: GPS, green: VI-O w/o LC, blue: proposed). (d) Plot of the zigzag trajectory results on the satellite map (green: VI-O w/o LC, blue: proposed).

Figure 9.
Experimental results obtained using different methods at Deungseon Bridge for a simple straight path: our method vs. LiDAR odometry and mapping (LOAM) vs. LIO-mapping. (a) Results of the proposed method: The solid red line represents the estimated trajectory of the UAV. The lower right image is the final map. (b) Results of LOAM: The solid white line represents the estimated trajectory of the UAV. The lower right image is the final map. (c) Results of LIO-mapping: The solid red line represents the estimated trajectory of the UAV. The lower right image is the final map.

Figure 10.
Experimental results obtained using different methods at Deungseon Bridge for a complicated zigzag path: our method vs. LOAM vs. LIO-mapping. (a) Results of the proposed method: The white line represents the estimated trajectory of the UAV. The lower right image is the final map. (b) Results of LOAM: The white line represents the estimated trajectory of the UAV. The lower right image is the final map. (c) Results of LIO-mapping: The white line represents the estimated trajectory of the UAV. The lower right image is the final map.

Figure 11.
Front and side views of the final 3D maps of Deungseon Bridge obtained using our method vs. LOAM vs. LIO-mapping: (a) Our method, (b) LOAM, and (c) LIO-mapping.
Figure 11.
Front and side views of the final 3D maps of Deungseon Bridge obtained using our method vs. LOAM vs. LIO-mapping: (a) Our method, (b) LOAM, and (c) LIO-mapping.

Figure 12.
Top and side views of the final 3D maps of Geobukseon Bridge obtained using our method vs. LOAM vs. LIO-mapping: (a) Our method, (b) LOAM, and (c) LIO-mapping.
Figure 12.
Top and side views of the final 3D maps of Geobukseon Bridge obtained using our method vs. LOAM vs. LIO-mapping: (a) Our method, (b) LOAM, and (c) LIO-mapping.

Figure 13.
Field test of the overall framework at Deungseon Bridge. The system was used to obtain a 3D map of the target bridge, and the operator extracted waypoints by specifying the parts requiring inspection on the 3D map. Subsequently, using our proposed SLAM method and high-level control scheme, the UAV flew along the planned trajectory to obtain image data for the bridge. (a) Flight trajectory along the specified waypoints (from #1 to #21). The colors along the line represent the speed of the UAV. (b) Trajectory comparison: GPS (red line) vs. estimated (blue line).


Table 1.
Platform specifications.
| Param. | Value | Param. | Value |
|---|---|---|---|
| Dimensions | 1090 mm × 1090 mm | Height | 450 mm |
| Props. | 26.2 × 8.5 inches | Motor | T-Motor 135 kV |
| Flight time | 30∼35 min | Wind resist. | 8∼10 m/s |
| Battery | 12S 20A | Weight | 12 kg (w/o batt.) |
Table 2.
Experimental results and comparisons (proposed method vs. LOAM [22] vs. LIO-mapping [36]) for Deungseon Bridge (, , , and ) and Geobukseon Bridge (, , and ).
| Proposed | LOAM | LIO-Mapping | |||||
|---|---|---|---|---|---|---|---|
| Dim. | Actual ( ) | Est. () | Err. (%) | Est. () | Err (%) | Est. () | Err (%) |
| 50 | 49.89 | 0.22 | 49.62 | 0.76 | 49.39 | 1.22 | |
| 50 | 49.75 | 0.50 | 49.35 | 1.30 | 49.41 | 1.18 | |
| 14.5 | 14.27 | 1.58 | 14.23 | 1.86 | 14.17 | 2.27 | |
| 11 | 10.90 | 0.91 | 10.88 | 1.09 | 10.67 | 3.00 | |
| 230 | 227.2 | 1.21 | 234.34 | 1.88 | 233.79 | 1.65 | |
| 23 | 22.7 | 1.30 | 23.49 | 2.13 | 23.43 | 1.87 | |
| 20 | 20.32 | 1.60 | 21.96 | 9.80 | 21.59 | 7.95 | |
© 2020 by the authors. Licensee MDPI, Basel, Switzerland. This article is an open access article distributed under the terms and conditions of the Creative Commons Attribution (CC BY) license (http://creativecommons.org/licenses/by/4.0/).
Share and Cite
MDPI and ACS Style
Jung, S.; Choi, D.; Song, S.; Myung, H. Bridge Inspection Using Unmanned Aerial Vehicle Based on HG-SLAM: Hierarchical Graph-Based SLAM. Remote Sens. 2020, 12, 3022. https://doi.org/10.3390/rs12183022
AMA Style
Jung S, Choi D, Song S, Myung H. Bridge Inspection Using Unmanned Aerial Vehicle Based on HG-SLAM: Hierarchical Graph-Based SLAM. Remote Sensing. 2020; 12(18):3022. https://doi.org/10.3390/rs12183022
Chicago/Turabian StyleJung, Sungwook, Duckyu Choi, Seungwon Song, and Hyun Myung. 2020. "Bridge Inspection Using Unmanned Aerial Vehicle Based on HG-SLAM: Hierarchical Graph-Based SLAM" Remote Sensing 12, no. 18: 3022. https://doi.org/10.3390/rs12183022
Note that from the first issue of 2016, this journal uses article numbers instead of page numbers. See further details here.