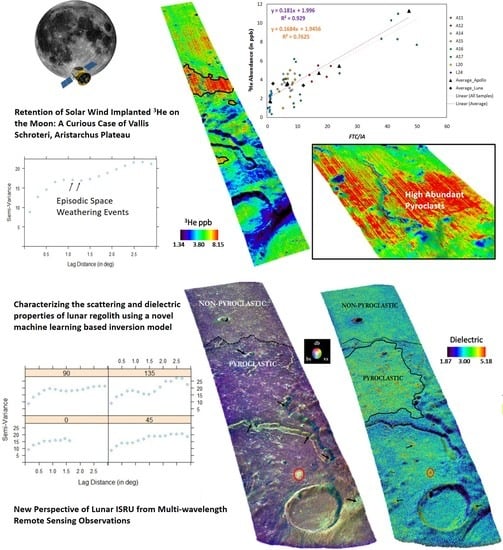
Article

Investigating the Retention of Solar Wind Implanted Helium-3 on the Moon from the Analysis of Multi-Wavelength Remote Sensing Data

1
Faculty of Geo-Information Science and Earth Observation (ITC), University of Twente, 7514 AE Enschede, The Netherlands
2
Indian Institute of Remote Sensing, Indian Space Research Organisation, 4 Kalidas Road, Dehradun 248001, Uttarakhand, India
3
ICEYE, 02150 Espoo, Finland
*
Author to whom correspondence should be addressed.
Remote Sens. 2020, 12(20), 3350; https://doi.org/10.3390/rs12203350
Submission received: 28 August 2020 / Revised: 2 October 2020 / Accepted: 12 October 2020 / Published: 14 October 2020
(This article belongs to the Special Issue Lunar Remote Sensing and Applications)

Abstract

:
The Moon has a large potential for space exploration and mining valuable resources. In particular, 3He provides rich sources of non-radioactive fusion fuel to fulfill cislunar and Earth’s energy demands, if found economically feasible. The present study focuses on developing advanced techniques to prospect 3He resources on the Moon from multi-sensor remote sensing perspectives. It characterizes optical changes in regolith materials due to space weathering as a new retention parameter and introduces a novel machine learning inversion model for retrieving the physical properties of the regolith. Our analysis suggests that the reddening of the soil predominantly governs the retention, along with attenuated mafic band depths. Moreover, semi-variograms show that the spatial variability of 3He is aligned with the episodic weathering events at different timescales. We also observed that pyroclastic regoliths with high dielectric constant and increased surface scattering mechanisms exhibited a 3He abundant region. For ejecta cover, the retention was weakly associated with the dielectric contrast and a circular polarization ratio (CPR), mainly because of the 3He-deficient nature of the regolith. Furthermore, cross-variograms revealed inherent cyclicity attributed to the sequential process of weathering effects. Our study provides new insights into the physical nature and near-surface alterations of lunar regoliths that influence the spatial distribution and retention of solar wind implanted 3He.

Graphical Abstract

1. Introduction

Human exploration of space encounters several challenges for enabling settlements on the Moon and solar planets. This, in particular, concerns the increased applicability of lunar resources for supporting human survival and energy supply. It is important to efficiently identify, characterize, extract, and process lunar resources, along with the lessons learned from the Apollo missions [1]. A relevant issue is the economic feasibility of energy production and the use of 3He resources as fuel, potentially even exporting it back to the Earth. For instance, it is expected that the amount of 3He on the Moon is at least 6.5 × 10⁸ kg, which shows promising signs for operational purposes if mined efficiently [2].
On the Earth’s surface, 3He is mainly found as primordial nuclides escaping from the crust to the atmosphere and outer space [3]: it has also been produced in small quantities in the past [4]. The strong motivation for the commercial use of 3He comes from its potential to produce clean energy in nuclear fusion reactors. Earthly supplies are currently insufficient for large-scale production, whereas the Jovian planets offer a great opportunity to explore the extractability of highly abundant 3He, however, with some limitations including longer expedition periods, stronger gravitational influence, and lack of solid surface [2].
Spatially varying weathering governs the implantation of 3He into the lunar soil. A major product includes glass welded aggregates composed of surrounding glass and mineral fragments formed during the melting of soil [5]. Such regoliths appear darker in reflectance spectroscopy because of the deposition of larger iron particles within recycled grains and enrichment of nanophase metallic iron (npFe0) in accreted rims [4,6]. Weathering also affects the spectral properties: the continuum slope reddens with an increase in the exposure of lunar regoliths, whereas both reflectance and spectral contrast decrease in terms of mafic absorption band depth [7].
One of the weathering agents is solar wind, a stream of charged particles from the Sun. When interacting with the Moon, it results in: (a) an uninterrupted passage of magnetic field components through the Moon and (b) implantation of hot ionized particles. To date, 3He concentrations (of about 20 ppb) in some lunar soils are precisely known [8,9,10]. The abundance of stable 3He depends on both the solar wind supply and the retention of implanted 3He, whereas the less stable inter-grained 3He is additionally controlled by the surface temperature [11]. Retention is further governed by the maturity of the regolith and abundance of electro-conductive minerals like ilmenite [10,12]. Thus, more 3He is retained in mature regoliths with higher ilmenite abundances.
Several research activities have been carried out in retrieving 3He abundance by incorporating the solar wind fluence and optical properties of the regolith in conjunction with the Clementine UVVIS and Apollo landing site data [8,9,10,11]. The Clementine UVVIS data have limited capabilities because of their low spectral resolution and difficulties in calibration, thereby leading to ineffective retrieval of surface maturation and 3He predictions. The physical properties of lunar grains are also controlled by the impact of solar wind plasma. This includes a dielectric variation of the soil which affects the degree of attenuation of electromagnetic radiation when interacting with the regolith, and provides additional insights into the physical characteristics of the regolith for implanting solar wind 3He. Furthermore, differences in the scattering mechanism of regoliths are characterized by different geomorphologic features and their orientations with respect to the surface.
Physical properties of the lunar surface have been mapped with radar astronomy [13]. The bistatic radar imaging of the Moon by the Lunar Reconnaissance Orbiter (LRO) and Earth-based Arecibo Observatory has provided new perspectives of the regolith’s behavior in the presence of volatiles, mainly through a coherent backscattering opposition effect that has not been observed during monostatic campaigns: the circular polarization ratio (CPR) increases at smaller bistatic angles [14,15]. The physical nature of the regolith in terms of dielectric characterization at both global and local scales, however, has not been explored yet. Furthermore, lunar topography is poorly associated with the overall repository of 3He. Hence, there is little knowledge of the spread of 3He concerning depth. This depth component may provide information on potential abundant sources of 3He.
The present work contributes to a better understanding of the retention of solar wind implanted 3He into the lunar regolith. It determines the spatial orientation of future 3He mining reserves while considering the depth decay profile of incoming 3He. This includes developing a quantitative 3He retention model by evaluating the optical effects of space weathering on regolith materials. Moreover, the study aimed to extract the physical properties of the regolith using a novel inversion method that utilizes the potential of machine learning (ML) on solving complex dielectric inversion problems. Here, we employed a physical forward model to provide a large number of realistic learning examples for the ML method. Ultimately, it aims to perform the integration of multi-wavelength datasets for understanding the influence of surface processes on 3He retention.

2. Study Area

The study area was the Vallis Schroteri region, being the largest sinuous lunar rille (Figure 1). The rille emerges in the vicinity of the craters Aristarchus and Herodotus, while its morphologic features spread across the plateau on the nearside of the Moon [16,17]. The plateau is known for its geological diversity in exhibiting regolith depositions of volcanic and impact-related origin [18,19]. Crustal-anorthositic materials mantled by iron-rich pyroclasts and basaltic lava flows display a complex stratigraphic relationship between different features in the plateau [20,21]. Due to the lava emplacement of the crustal layers intermixed with fresh ejecta and dark glassy enrichment, the plateau resembles a topographically elevated terrain of about 2 km relative to that of the surrounding mare regions [21].
Emplacement scenarios of lava similar to that of the terrestrial volcanic construct of the Mauna Loa eruption have been observed. The region of the plateau is characterized by thick pyroclastic deposits of about 20 m, commonly referred to as dark mantled deposits (DMDs) [13,18]. It is a low albedo stratigraphic unit of glassy spheroids with possible emplacement in the Imbrian period (3.7 Ga–3.6 Ga) through large localized lava fountaining events [18,22]. This is aligned with the formation processes of the Vallis Schroteri rille. Previous studies have shown the potential of DMDs to preserve up to 300 ppm of indigenous water [18,19,20,21]. The diversity of the Aristarchus plateau, with a special emphasis on the association of the possible bimodal volcanism of the Cobra head and presence of pyroclastic deposits, makes it a significant nearside candidate for estimating the 3He content, thereby potentially testing in situ resource utilization (ISRU) technologies.

3. Materials and Methods

3.1. Multi-Wavelength Remote Sensing Datasets

Data have been collected from the push-broom imaging spectrometer onboard the Chandrayaan-1 Moon Mineralogy Mapper (M3), which captured the visible to near-infrared (NIR) coverage of 0.42–3.0 μm in 85 spectral bands. Data acquisition of the lunar regolith through M3 was carried out in target and global modes [23]. Target mode captured priority regions from a 100 km orbit at a spatial resolution of 70 m pixel−1, whereas global mode provided full coverage of the Moon operating at a spatial resolution of 140 m pixel−1. The instrument allows a detailed mineralogical assessment for understanding the geological evolution of lunar crustal processes and deep-seated lithologies. For our study, we used thermally and photometrically corrected level 2 M3 data. These data have a spectral coverage that could precisely delineate the effects of space weathering while preserving the spatial resolution, allowing us to analyze the impact of solar wind on the regolith.
A second dataset was collected by the miniature radio frequency (Mini-RF) instrument on board the LRO. This is a side-looking, hybrid-polarized, synthetic aperture radar (SAR) sensor operating in circular transmit, linear receive mode at 12.6 cm (S-band), or 4.2 cm (X-band) wavelengths with an incidence angle of 47° [24,25]. The linear receive data are acquired in either baseline SAR mode or zoom mode by transmitting circularly polarized waves from 50 km altitude [26]. In the present study, the bistatic S-band data acquired by the Mini-RF instrument were analyzed to retrieve the physical properties of the lunar regolith. Furthermore, we used the topographic dataset from the Global Lunar Digital Elevation Model (GLDEM). This DEM has a 100 m spatial resolution with a vertical accuracy of 10–30 m and was prepared through stereo-photogrammetric processing of LRO wide angle camera (WAC) images [27]. For validation, we used the published laboratory-based analysis of 3He from the lunar samples. The details of all the datasets are summarized in Table 1.

3.2. Methods

3.2.1. Theoretical Model of Normalized Solar Wind Fluence on the Moon

We first analyzed the influence of topography on measurements of the integrated solar wind plasma flux distributed across the regolith. Variations in shielding, due to the Earth’s magnetotail, were considered for a synodic month of 29.53 days. We took the average incidence angle ( θ 0 ) of the solar wind equal to 45° with an assumed near-parallel direction to the Moon’s rotation plane [28]. The surface angles ω and γ, in the x and y direction, respectively, were obtained as
ω = tan 1 ( DEM ( i + 1 ,   j ) DEM ( i , j ) R scale ) ,   γ = tan 1 ( DEM ( i ,   j + 1 ) DEM ( i , j ) R scale )
where i and j are the row and column of the DEM and R scale is the map scale of the image.
Due to the differences in the regional topographical setting, the incidence angle of the flux changes locally with surface slopes. The solar wind flux was obtained for each location based upon the selenographic latitude ( λ ) and longitude ( φ ). Let δ be the angular distance from the subsolar point, varying with respect to different sun angle conditions ( δ < 90 ° ), and solar wind ions impact the regolith at a local variable angle of θ 0 l . Then,
θ 0 l = cos 1 ( cos ω cos ( γ θ 0 ) ( cos γ ) 2 ( sin ω ) 2 + ( cos ω ) 2 )
Let F 0 be the maximum fluence along the direction of the ions. Then, the incoming fluence at the sub-solar point equals F 0 cos θ 0 l . Thus, the solar wind plasma fluence ( F ) at any specific location ( λ , φ , θ 0 l ) is represented as
F ( λ ,   φ ,   θ 0 l ) = F 0 cos θ 0 l cos δ
This is further evaluated by implementing the shielding variation using a modified solar wind fluence model, wherein the theoretical correction of the absolute longitudinal error is accounted for [8]. Our model, therefore, estimates the monthly solar wind fluence as
F ( λ ,   φ ,   θ 0 l ) = F 0 cos λ cos θ 0 l { 2 + sin ( φ f π ) sin ( φ + f π ) , | φ | π ( 0.5 f ) 1 + sin ( | φ | f π ) , π ( 0.5 f )   | φ | π ( 0.5 + f ) 2 ,      π ( 0.5 + f )   | φ | π
Equation (4) includes the proportion of uncertainty in the magnetotail shielding, thereby quantifying the most probable amount of plasma flux for all conditions. The estimated solar wind fluence is relative and hence unitless. For four to eight days per month, the Moon is in the Earth’s magnetotail. The model was therefore implemented for f = 0.14 ,   0.17 ,   0.20 ,   0.24 ,   0.27 , where f is the shielded fraction of the Moon’s orbit. Due to the revolution of the Moon, the nearside is comparatively less exposed to the solar wind plasma than the farside. The impact of the Moon’s axial tilt (1.5°) on the plasma distribution is less significant [9], so we discarded this in our analysis.

3.2.2. Quantitative Abundance of Lunar 3He from Space Weathering Perspectives

Solar wind causes weathering of the regolith. We introduced a spectral parametric space for determining the retention hypothesis of the 3He, replacing optical maturity, which is conventionally used. In doing so, we incorporated the contribution of individual space weathering spectral effects on the retained 3He. Three parameters were used: the 1578 nm reflectance band (for reduced albedo, A ), a continuum slope (for increased reddening, C ), and an integrated band depth ratio (for attenuation of diagnostic absorption band depth, I ). Contrary to employing a simple ratio as in [29], C scales the slope of a straight line passing through the UVVIS and NIR spectra of the M3 data.
C = ( 1 R 750 ) ( R 1500 R 750 1.5 0.75 )
Similarly, I regulates the reduced Fe2+ content and the maturation of the regolith. The use of this variable led to enhancements in the regions with significant mafic absorptions and hence is in close agreement with one space weathering effect. Compared to the conventional single parameter band depth, I facilitates an improved perspective of estimating the mafic absorption band strength as a function of dependent mineral characteristics like composition, grain size, abundance, and type. Usually, absorption bands near 1000 nm and 2000 nm represent mafic minerals: both 1000 nm and 2000 nm are indicators for pyroxene, whereas a broad absorption band at 1000 nm in the absence of 2000 nm represents olivine. As both pyroxene and olivine minerals are considered as mafic, the contribution of both the 1000 nm and 2000 nm bands helps to better represent the attenuation effect of space weathering. With space weathering, I is expected to decrease (i.e., the 1000 nm band will strengthen while the 2000 nm band will be less influenced by the surface maturation process). An interpretation is that space weathering causes the regolith to mature, as is represented by three effects on the near-infrared spectra. All these effects contribute to the deposition of larger iron particles within recycled grains and npFe0 enrichments in the accreted rims. Since the ferrous absorption band lies between 750 nm and 950 nm, the matured grains strengthen the 1000 nm absorption band because of the added materials, thereby weakening the I . The expression of I is
I = IBD 2000 IBD 1000
where
IBD 1000 = n = 0 38 1 R 730 + 20 n R c 730 + 20 n
IBD 2000 = n = 0 21 1 R 1658 + 40 n R c 1658 + 40 n
In (5)–(8), R λ , R c λ , IBD λ , and n represent the reflectance, continuum reflectance, and the integrated band depth at a particular λ nm wavelength of the M3 data and the index of the wavelength band, respectively. The 1578 nm albedo band excluded the region of wavelengths dominated by the ferrous absorptions in both olivine and pyroxene. In addition to the optical properties, the presence of ilmenite was mapped in regions with variable TiO2 content using a high correlation coefficient of the FeO–TiO2 diagram, specifically meant for the lunar nearside [30]. The regression equation is given by
log ( T ) = 0.06 ( FeO ) 0.54
Here,   T is the TiO2 content in wt% and FeO denotes its abundance in wt%, which was estimated as in [12]. We next developed a surface maturity parameter to better understand the proportionality of space weathering effects on near-infrared spectra with the optical properties of the regolith. This parameter is denoted by [continuum slope/(albedo × integrated band depth ratio)]: as maturity increases, continuum slope increases, whereas albedo decreases and integrated band depth attenuates. The quantitative basis of the parameter helped us to study the significance of individual space weathering processes on the retention of implanted 3He. In our study, we used 61 samples that returned from the Apollo and Luna missions and compared the product of their known TiO2 abundance and landing site fluence multiplied by the surface maturity parameter with the laboratory-measured 3He measurements in the form of FTC/IA, thereby up-scaling the utility of the method to the Vallis Schroteri study site. This results in a transferrable and reproducible method for estimating the abundance of 3He at both the global and mining scales, as indicated in Figure 2.

3.2.3. Retrieval of Scattering Mechanisms from Lunar Regolith Using m - χ Decomposition Approach

The radar signal was decomposed to discriminate between different scattering patterns within a resolution cell. This helped us to better understand the structural and physical behavior of individual scatterers to the incoming electromagnetic wave. For the lunar regolith, we utilized the m - χ decomposition, which is effective in characterizing odd bounce and even bounce scattering mechanisms compared to the m - δ approach [31].
R = m S 1 ( 1 + sin 2 χ 2 ) , G = S 1 ( 1 m )   , B = m S 1 ( 1 sin 2 χ 2 )
where R , G , and B represent the even-bounce, volume, and odd-bounce scattering mechanisms, respectively; S 1 is the first Stokes parameter; m is the degree of polarization; and χ is the ellipticity parameter of the polarization ellipse for hybrid polarized Mini-RF data.

3.2.4. Machine Learning Inversion Model for Dielectric Characterization of Lunar Regolith

Physical properties of regolith grains are also captured by polarimetric observations, as in Figure 2. In this study, we used the sensitivity of the S-band radar signal toward roughness and surface parameters for modeling the dielectric content of the lunar soil. We did so by simulating the radar backscattering coefficient as a function of dielectric constant ( ε ), RMS height ( σ h ), incidence angle ( θ ), and correlation length ( L ). The simulation was done using the exponential correlation function, assuming that the correlation length equaled 12.6 cm (i.e., the wavelength of the incident radar echo) [32]. Moreover, we implemented the physical modeling of radar backscatter by parametrizing the integral equation model (IEM) for rough surfaces. The expression can be found in [33]. For solving the complex and highly non-linear inversion problem, we employed a multi-layer perceptron (MLP) artificial neural network, which was trained on the simulated data of radar backscatter and surface parameters from the forward IEM. As the selection of input training data is crucial for the model, we used this algorithm to identify the parameters that were sensitive to the radar backscatter.
To retrieve the angular trend of the data, we adopted the single frequency multi-angle (SFMA) configuration [34]. The network topology consists of three input parameters as horizontal and vertical polarized backscattering coefficients ( σ hh , σ vv ) and θ , one output parameter as ε , and two hidden layers with 64 nodes each. The choice of the size of hidden layers was made on a trial and error basis with no further network optimization for the current dielectric inversion problem. The tan h activation function was used to handle the negative inputs, while we adopted the gradient-based ADAM optimizer. The range of parameters ( ε , σ h , θ ) is indicated in Table 2, which was chosen based on typical lunar observations. Before training, the data were split into 20% validation data and 80% training data using uniform random sampling. The performance of the model was evaluated based on the achieved coefficient of determination (R2). After training, the horizontal and vertical components of the Mini-RF S-band bistatic data with the incidence angle were fed into the network to produce an inverted dielectric constant image.

3.2.5. Modeling the Spatial Orientation of 3He with Depth from Variography

The concentration of the 3He content as a function of depth was assessed using the thickness and compaction of the regolith. The background is that the mixing of regolith grains with the actual surficial retention enriches 3He implanted by the solar wind into the deeper regolith. This is illustrated by the exponential decaying 3He profile (i.e., C ( z ) = C 0 exp ( 0.347 z ) where C 0 is 3He concentration on the surface (in ppb) and z is the depth in meters) [10]. Quantitatively, the distribution of 3He ( H d ) is a function of regolith thickness ( d ) [35] and bulk density of the regolith with depth, ρ ( z ) [13]:
H d = 0 d ρ ( z ) C ( z ) d z
Use of constants in C ( z ) ,   d , and ρ ( z ) can be applied to analyze both global and local lunar mapping. In addition to the exponential decay function, we also assumed a uniform vertical distribution of 3He. Subsequently, the spatial component was added for determining the orientation of 3He into the regolith, as in Figure 2. To do so, we generated empirical variograms of 3He derived from the solar wind per unit area, thereby determining the spatial dependence of the measurements as a function of the distance between pairs of 3He points. In total, 8000 spatially referenced points were randomly selected, covering the entire image. Samples, along with their geographical locations, in an equirectangular map projection, were used for further analysis. Since the Moon projection system is not supported in R programming language [36], we used selenographic coordinates. The directional component was introduced by considering the variability of the 3He samples in the 0°, 45°, 90°, and 135° directions. We explored the utility of variogram models in the spatial profile of 3He.

3.2.6. Analysis of Multi-Wavelength Data Using Cross-Variography and Transects

A random sampling of pixels in the image was adopted for the study based on characterizing the modeled 3He abundance and physical content of the regolith. The prime focus was on the Aristarchus plateau signifying various features ranging from ejecta cover to pyroclastic deposits. Different samples of 250 pixels each were selected from high 3He and low 3He zones. Distinct sets of samples were attributed to the pyroclastic/non-pyroclastic deposits north of the Cobra Head and from the extended ejecta cover mantling the Herodotus crater floor. Based on the sample sets, transects were defined for multi-sensor data analysis by plotting the physical content and corresponding 3He measurements. To analyze associations of regolith characteristics with retained 3He, we quantified the spatial variability of 3He and physical properties by calculating the experimental cross-variograms for the combination of two parameters.

3.2.7. Validation

Results of the retention model were validated using the following metrics: the coefficient of determination (R2), the root mean squared error ( RMSE ), the mean absolute error ( MAE ), and the index of agreement ( d index ):
MSE = 1 N i = 1 N ( x pi x oi ) 2
MAE = 1 N i = 1 N | x pi x oi |
d index = 1 [ i = 1 N ( x pi x oi ) 2 i = 1 N ( | x pi 1 N i = 1 N x oi | + | x oi 1 N i = 1 N x oi | ) 2 ]
Here, N is the number of observations, x p is the predicted value, and x o   is the observed value from the Apollo and Luna landing sites. The index of agreement d index is expressed in values between 0, indicating no agreement between the predicted and observed entities, and 1, indicating a perfect match. Additionally, the simulation of the radar backscatter using IEM and inverted dielectric content were validated with the Mini-RF data of the Apollo landing sites and corresponding published laboratory-measured dielectric constant records [13].

4. Results and Analysis

4.1. Quantitative Estimation of Retained 3He from Chandryaan-1 M3Spectroscopy

Sites near the Cobra Head feature and Herodotus crater received an increased fluence of about 40% relative to other geomorphological features [37]. Several highly sloped terrains exhibited reduced plasma flux contents adjacent to the areas with relatively larger accumulation. Moreover, the floor of the bowl-shaped microcraters near the vicinity of the Vallis Schroteri depicted almost negligible fluxes compared to the walls. Furthermore, the estimated solar wind flux across the plateau appeared to be normally distributed, where the associated uncertainty was represented by a standard deviation of 0.03 with the most probable relative flux value of 0.29.
From the analysis of our retention model, we observed a significant correlation between the hybrid parameter and laboratory-measured 3He (Figure 3b). The spatial extent of returned samples from a landing site is necessarily small, and the 3He variations could be assumed to be minimal. Hence, the irregular distribution of the samples in the plot may be attributed to measurement bias. To minimize the bias, averaging of the samples was performed for each site, resulting in a higher correlation coefficient of 0.93. From Figure 3a, we also observed that the most abundant regions were pyroclastic deposits with 3He concentration >7.3 ppb. Moreover, the floor of the Herodotus crater showed significant diversity in the 3He distribution. The central part showed a medium to high concentration while the spatial extent mantled by ejecta cover showed a lower 3He content.
Several hotspots of higher modeled abundance were marked and were associated with reduced mafic absorption band depths compared to the unweathered regolith grains. Additionally, the sites over the top of the Agricola Mountains exhibited higher redness in the continuum slope. The ejecta cover represented the lowest 3He concentration (≈1.45 ppb), mainly because of the highland materials in the immature grains mixed with impact glasses and sufficiently low ilmenite content. By extracting and analyzing the samples, we estimated that 68% of the weathering contributed to the gradual darkening of the ejecta regolith. Furthermore, the lower modeled abundance of retained 3He, particularly near the inner rille, was attributed to high albedo and immature regolith. Referring to Table 3, the correlation significantly improves after averaging of site-dependent samples and hence, resolves the bias (as observed in Figure 3b) to some extent. Comparing the predicted 3He values at the Apollo and Luna landing sites with the actual values yielded a standard error of 1.19 ppb by weight. More details on the comparison are presented in Appendix A.
Figure 4 shows that variation in the maturity of the regolith contributed to the retention dynamics of implanted 3He, with the maximum continuum slope occurring in the pyroclastic regions. Additionally, we observed higher band depth ratios at the regional level compared to albedo. Quantitatively, the pyroclastic regoliths captured most of this effect with 48% contributing to the attenuation of mafic absorption band depths. In some sub-regions, there were prominent deposits, denoted in green tints mixed with yellow color, potentially exhibiting signatures of nanophase iron particles produced during the vaporization of iron-bearing mafic minerals. This was confirmed by the proportion of continuum slope in the regional pyroclastic soils, which was about 40%, thereby commenting on their high maturity nature. Moreover, the walls of the Herodotus crater and Vallis Schroteri had low slope values. Several other features over the Agricola Mountains and those lying near to the rilles represented a decrease in the continuum slope parameter. The floor of the Herodotus crater was characterized by a medium to high level integrated band depth ratio, accounting for 38% in the spectral alteration process of the regolith. The least dominant factor was the continuum slope, accounting for 25%.
The spectra showed an absorption dip at 1000 nm associated with minor absorption features at 2800 nm, indicating olivine deposits subject to hydration. The ejecta regolith was devoid of mafic minerals; ejecta regolith areas close to the Herodotus crater, however, contained hydrated olivine inclusions (E3 and E8 in Figure 4). The immature regions, represented as albedo features in a dark tone, were marked with reduced amounts of 3He. In Figure 4, magenta denotes a high albedo and a continuum slope relative to the integrated band depth ratio, green an equal proportion of continuum slope and integrated band depth ratios, while yellow indicates the pyroclastic regolith that captures higher attenuation of band depths relative to albedo and reddening, with several sub-regions exhibiting green tints over it. We observed non-uniform maturity trends in lunar materials, concerning local weathering effects, thereby influencing the retention.

4.2. Spatial Variations of 3He with Respect to Depth

Modeling the exponential decay profile shows that the abundance of 3He in non-pyroclastic regoliths exhibits contradictory behavior with the concentrations in Figure 3a. The relative spatial distribution after accommodating the regolith thickness profile suggests an overall decrease of about 25% compared to the rest of the region excluding the ejecta cover. Moreover, the increased 3He content per unit area at a few locations indicates the diverse geochemical constraints of the soil. Figure 5a shows the empirical variogram of 8000 randomly sampled points from the low, medium, and high 3He abundant zones. The observed nugget effect was consistent in all directions (Figure 5b), whereas the sill was not reached in the variogram trend, suggesting a longer correlation length.
Considering the intermediate-scale variance, we observed a cyclic pattern in the semi-variance estimates. Weathering of the lunar soil and maturity of the regolith tended to be repetitive in their occurrences. The black arrow indicates an irregular temporal cycle of geologic events. At this interval, the semi-variance was low, indicating a higher correlation of the modeled abundance, the so-called “hole” effect. This is most likely due to the intrinsic micro-scale changes, along with non-retentive characteristics of the soil.
The overall spatial variability of the modeled abundance showed some anisotropy, where the 135° direction exhibited the clearest hole effect, and the variability in the 0° direction followed an exponential trend, thereby exhibiting higher spatial autocorrelation within lag distances of 0.5 deg. The observed pattern replicates the deterministic implantation process where the spatial correlation disappeared after 0.75 deg. As the lunar regolith erodes once every 20 million years, the intensity and frequency of the cyclic pattern are rather weak. We further noticed a systematic increase in the modeled 3He abundance from proximal to distal regions, oriented at 45°, of the Vallis Schroteri. This decreases the spatial correlation as the lag distance increases. The variogram in the 90° direction showed that the variogram reached its sill at around 1 deg, with a slightly undulating shape.
Figure 6a shows that the green color patches in the top portion of the image were the result of ilmenite dichotomy, where the effects of weathering were largely reduced. The quantitative abundance of the sub-region parallel to the linear rille resembled the proportions derived from Figure 3a. The mean areal concentration of 3He equaled 16.40 ppb m−2, as in Figure 6b.

4.3. Physical Properties of Lunar Regolith Using Bistatic Mini-RF S-Band Data

Figure 7a shows that the typical regolith material predominately behaved as a Bragg surface to the incident radar wave, thereby producing specular or surface scattering mechanisms because of the smooth texture of the regolith devoid of cm- to m-scale scatterers. The presence of larger aggregates in the soil eventually introduced an even bounce scattering response. Moreover, steep slopes over the Agricola Mountains signified the double bounce geometry concerning a relatively smooth regolith. There were several occasions of mixed scattering behavior, like the ejecta cover, a terraced wall of the Vallis Schroteri, and freshly formed microcraters. The ejecta blanket was characterized by volume and double bounce scattering. The anomalously high CPR values in the ejecta materials, along with enhanced volume scattering power, further confirmed the hydration behavior, as indicated in the spectral data analysis.
In Figure 7b, pyroclastic regoliths were characterized by a mean CPR of 0.31, with higher values attributed to the presence of microcraters. This is in close agreement with [38]. Additionally, a dominant surface scattering mechanism was observed mainly because of its fine-grained structure and absence of large-sized heterogeneities. The scattering patterns showed that the micro-crater had a mixed dihedral and volume scattering response due to its freshly excavated material. However, the CPR indicator showed a much lower estimate of approximately 0.21, possibly suggesting small-scale roughness.
From the IEM simulations, we observed a decreasing trend of the polarized radar echo with the increase in incidence angle in Figure 8. This was denoted by enhanced scattering powers from the top regolith for θ < 25°. However, the regolith with rock inclusions predominated the scattering behavior for larger incidence angles. Additionally, attenuation of the radar echo became stronger in the subsurface due to the larger radar signal path length at a higher incidence. Hence, it is expected that the dominant scattering mechanism in the S-band frequency is essentially coming from the surface and desiccated rocks mixed with the regolith. This was confirmed in Figure 7a, which indicates the dominance of the blue color (Bragg scattering) over the yellowish-green color (mixed scattering response) in the regolith. With increasing dielectric constant, the Fresnel reflection coefficients increased the surface scattering contribution. Similarly, the radar backscatter was also influenced by surface roughness, which can be compared to the incident wavelength: the backscattering coefficient increased with an increase in the RMS height. This was attributed to the possible orientation of the regolith materials, exhibiting higher Fresnel reflectivity in the HH polarization.
The trend was more evident beyond 1.65 cm RMS height and increased significantly for larger height. In Figure 8, the red color intensity decreased uniformly for HH polarization compared to the radial trend for VV polarization. There was an average −3.25 dB difference between the sensitivity of the horizontal backscatter and vertical backscatter to the dielectric constant. A possible explanation is that minor changes occur in the penetration depths of different polarizations.
In the MLP neural network, the training of 15,600 patterns requires approximately 23.35 s of central processing unit (CPU) time on high-performance computing (HPC) with 3.4 GHz Xeon E7 with 40 cores. The achieved training R2 value equals 0.985 at approximately 175 iterations. Testing the trained network on 3120 radar backscatter patterns yielded an R2 value equal to 0.987. Nearly equal training and testing R2 values signified that the model was not overfitted. Furthermore, validation showed an accuracy equal to RMSE = 0.26 and MAE = 0.13, respectively. Moreover, the estimated degree of the model prediction error equaled 0.996, indicating a strong agreement with the observed dielectric constants.
From the Apollo landing sites, monostatic datasets were fed into the network as bistatic scenes were absent. A comparison of the predicted and measured values showed a low inversion error for all the reported sites (Table 4). However, the reliability of the inversion was restricted by the sample space, which proved to be a limitation in this case.
Figure 9 predicts the modal dielectric constant of the regolith as 2.92 with a standard deviation of 0.17. The extensive mantling of fine-grained deposits in the pyroclastic regolith exhibited a high value of dielectric constant. The boundary between the mare deposits and pyroclastic units, denoted by the dotted black line, was similar to the m-Chi decomposed image in Figure 7a. The blue color in the image characterizes the agglutinated regolith with a low dielectric constant, suggesting an exposed soil–rock interface to the incident radar wave. Several microcraters present in the nearby vicinity of the Vallis Schroteri, marked by black arrows, displayed a predominantly yellow to red color due to the relatively younger regolith.
The floor of the Vallis Schroteri was characterized by high dielectric permittivity, possibly reflecting the volcanic nature of the deposits. It may be expected that the floor contains larger pyroclastic enrichment compared to the marked area (solid black line). This is due to the closer proximity of the regolith to the source volcanic vent, Cobra head. Despite the categorization of dielectric contrast, the values showed relatively low to moderate variations in the region on a global perspective, thereby revealing the physical character of the regolith.

4.4. Understanding the Impact of Surface Processes on the 3He Retentions from Multi-Sensor Perspectives

Figure 10 shows that the relatively younger regolith of the ejecta contains excavated feldspathic highland material associated with low dielectric constant. The retention of 3He tends to decrease for the regolith characterized by reduced dielectric constant values, as shown in Figure 10b. Moreover, it is influenced dramatically by volume scattering as compared to the double bounce scattering mechanism as in Figure 10c. The correlation coefficient declined from 0.5 to 0.34. Since the increased volume scattering originates from the buried anisotropic particles, this is particularly interesting for exploration perspectives. There was a surge in the modeled 3He abundance with the CPR. Figure 10a shows a correlation coefficient equal to 0.55. However, the CPR was low for the entire region, yielding an average pixel value of 0.27, indicating that the variations were caused by roughness.
The cross-variogram analysis in Figure 11 showed a slightly cyclic pattern at higher lag distances. The modeled abundance was correlated with the surface scattering mechanism at lower lag distances, as observed from Figure 11b. The cross-variogram also flattened off at higher lag distances, which may be linked to the negative correlation of the 3He concentration with surface scattering patterns in the ejecta regolith. Figure 11a shows a pure nugget effect. Moreover, there was a spatial autocorrelation between the modeled 3He abundance and surface scattering power in pyroclastic regoliths. This can be observed in Figure 7a with a dominant blue color.
The unboundedness of the spatial pattern emphasizes the relation between both variables. There was a slight dip in the trend before the increment. The reason may be the presence of microcraters responsible for increased roughness variations and lower surface scattering powers. Meanwhile, the associated modeled abundances, being higher than normal, suggest a negative correlation with surface scattering. In contrast, the cross-variogram for the CPR was opposite to the previous case because the representation involves multiple scattering events like dihedral and volume, arising from the immature microcraters.

5. Discussion

5.1. Retention of Solar Wind Implanted 3He on the Moon

Mechanical influences, like the directional slope component and varying regional topography, play a key role in reducing the uncertainties in modeling plasma fluence at the local scale. The percent change of the modeled flux reading was somewhat surprising: a region tended to receive more than 47% of the plasma flux when the local incidence was not considered compared to topographically normalized modeled flux. This trend was a clear overestimation of the relative flux, thereby associating inaccurate modeled 3He abundance. The observed standard deviation of the distribution equaled 5.47%, therefore, we assumed the presence of prospective 3He sites near the Cobra Head feature based on the higher exposure of solar wind plasma. The decrease in the reddening of the spectra of features in the vicinity of primary rille was mainly caused by the deposition of the immature material on the surface, either through mass wasting or to local impact events. Hence, both local maturity and pyroclastic content govern the estimation of the continuum slope. For instance, on the floor of the Herodotus crater, the weathered regolith is representative of the higher attenuation of mafic absorption band depths than darkening and reddening effects. Additionally, the ejecta cover overlaying the Herodotus crater exhibited high albedo, which represents the freshly excavated material from several depths.
Several factors contribute to the retention of 3He, particularly in the pyroclastic deposits. Concerning the spectral properties, the presence of glass-rich materials indeed enhances the 3He concentration. We already observed that the attenuation of spectra from pyroclastic deposits was higher compared to the spectra from the ejecta cover. Based on these two regions, we can derive the limit of modeled 3He abundance. First, we found that the contribution of albedo was lowest, mainly due to the immature regolith, resulting in larger granular size, which provides less surface area to volumetric weight for the incoming 3He from the solar wind. Second, as the spectra from the pyroclastic region attenuated most, we further explored the retention dynamics of 3He. Interestingly, the results showed that there was a high dependence of the integrated band depth ratio parameter for the modeled 3He abundance. This demarks the pyroclastic deposits as a highly abundant zone. Moreover, the greenish tone overlaid on the yellow surrounding of the pyroclastic regolith in Figure 4 showed the dominance of the reddening and band depth attenuation effects compared to the albedo, which contributed to the high prediction of 3He.
The reasons behind the findings are the presence of glass-rich materials and the granular structure of the regolith. The latter effect enhanced the modeled abundance as achieved from the spectral effects of the former. Even from the analysis of Apollo data (in Table 5), particularly for the dark mantle deposit sample 76501 from the Apollo 17 landing site, we saw a higher 3He concentration of 8.8 ppb for grain sizes less than 20 μ m compared to that of the higher granular size where the concentration reduced to around 1.0 ppb. Upon comparison with a light mantle deposit (sample 72501) and an orange (sample 74220), the abundance dropped to 5.8 ppb and 1.1 ppb, respectively, for the grain size of less than 20 μ m. This difference clearly showed a varying glass content in the regolith sample materials, which in turn made the spectral properties an important indicator. Although the orange soil sample was Ti-rich, the presence of glass-rich material dominated the retention mechanism.
An interesting trend was observed in the spatial distribution of 3He: soils with sufficiently larger band depth ratios and continuum slopes retained most of the implanted 3He. This was evident in the outer vicinity of the Cobra Head feature with about 58% of albedo, where the presence of irregular-shaped mineral fragments reduced the retention capabilities of the soil. In such cases, the size of the welded aggregates tended to be larger and it took time to break grains down into smaller sizes, thereby reducing the surface area for the incoming solar wind 3He. Despite a relatively higher ilmenite content, the albedo trends suppressed the regolith and made it less retentive. As the reddening spectral effect is controlled by pyroclastic content, the regoliths with significant continuum slope values retained higher 3He content. In terms of economic feasibility and mining excavator capabilities, the fine-grained, volatile-rich pyroclasts emerge out to be suitable regolith for ISRU operations. The additional presence of hydroxyl ions encapsulated within the granular structure of the soil provides immediate attention for exploring the site.

5.2. Spatial Orientation of Retained 3He

Spatial variability of 3He showed instances of large variation for adjacent sampling cells. The uncertainty in the 3He measurement corresponding to an assigned spatial extent induced a higher nugget effect. Moreover, the spatial patterns observed in the vertical direction provided evidence of small-scale periodic processes influencing the retention scenario of 3He. One such minor effect may be the sequential trap and release of weakly bound inter-grained 3He due to its unstable behavior toward temperature variation. Additionally, the sputtered 3He particles from the less retentive soil tended to latch with the defects in the crystal lattice.
The vertical variogram captured the additional semi-variance from the stratigraphic layering of the lunar surface. The small-scale petrological variations were often difficult to interpret compared to apparent large-scale stratigraphic differences. This became prominent in the directional variograms. For the areal repository of 3He, we saw that the ilmenite content was stronger than other local weathering in the retention process. The distinctness in the modeled 3He abundance was apparent for some concentrated sub-regions, where an equal contribution occurred of reddening and attenuated band depth effects. Furthermore, the average regolith thickness of the region was comparatively low, suggesting lower retention with Ti deficient soils.
Since the vertical distribution of 3He tended to reduce at greater depths, the thicker regolith of the Agricola Mountains weakly influenced the modeled abundance. Thus, mining strategies could be planned for extracting potential 3He volatiles from regoliths with higher ilmenite percentage and optimal thickness with respect to the bedrock. Additionally, the contribution of reddening and attenuated mafic band depth on the retention was significant in delineating the 3He-rich soils.

5.3. Physical Properties of Lunar Regolith

The analysis of Mini-RF data showed the potential of ejecta cover to hold on the buried impact melt glasses, which comes in the category of the cm- to m-scatterer. This indicates that there may be some fresh deposits located at around the 1 m depth within the penetration capabilities of the incident radar wave. These inclusions may contribute to the additional subsurface scattering mechanisms, thereby explaining the significance of mixed ejecta behavior. Furthermore, pyroclastic deposits offer an exploratory perspective of distinct radar response compared to the basaltic mare regolith. The lack of cm- to m-scatterers in the regolith contributed to the dominant surface scattering, while the large-sized buried rocks in the non-pyroclastic region provided the hazy appearance with the included diffuse scattering component.
The inversion model showed that lower dielectric constant values may implicate a higher rate of regolith mixing derived from the prolonged cratering process, thereby resulting in an increased vertical roughness. The penetration of the radar echo thus decreased with a higher proportion of rocks brought to the near-surface from deeper regoliths. The higher dielectric constant of the floor of Vallis Schroteri may be due to the closer proximity of the regolith to the source volcanic vent at Cobra Head. The remarkably higher backscatter arising from the steeply sloped bedrock material with minimal deposition of soil exhibited an increased dielectric contrast relative to the surrounding regolith. Despite the categorization of dielectric contrast, the values showed relatively low to moderate variations in the region at a global perspective.

5.4. Influence of Physical Properties on the Retention of Implanted 3He

Since the incoming solar wind represents a hot ionizing radiation wave, the high dielectric contrast of the regolith may lead to increased sputtering events. This was mainly influenced by the high compaction rate of the regolith. Moreover, penetration of the solar wind plasma in the loosely packed regolith may cause implantations at slightly greater depths. In the ejecta cover, the materials were eventually marked with increased hydration from the spectroscopic analysis. Such an increase may be associated with volume scattering, wherein the specific hotspots of high dielectric constant are formed. Retention of 3He is thus mainly related to the dipole-like grains buried within the gardened regolith. Moreover, in some of the instances, these grains contained exposures of hydroxyl ions, which prove significant for large-scale extractions.
The cyclic pattern in the cross-variogram supports the influence of the reddening effect in addition to the albedo patterns on the retention mechanism across the ejecta cover over the geological timescale. Additionally, it could be inferred that the occurrence of the former effect is comparatively after the latter. One of the space weathering processes that dominate the spatial extent of ejecta materials is the albedo, possibly due to the freshly excavated materials from impacts. This yields a higher content of nanophase iron particles reduced from Fe2+, which decreases the retention with time. Gardening of the regolith is sufficiently high in the ejecta cover due to several microimpacts, which can be seen from increased reddening of several microcraters. In the pyroclastic regolith, increased 3He content was associated with a medium to high range of the dielectric constant. This may be due to the domination of attenuated absorption band depths on relatively matured fine-grained pyroclasts mantling the regolith. Such relation links the physical character of the regolith to 3He accumulation on the Moon.

6. Conclusions

We can conclude that the most promising mining candidates are the pyroclastic deposits, regolith over the Agricola Mountains, the unmantled floor of the Herodotus crater, and several hotspots in the nearby vicinity of the Vallis Schroteri. Reddening of the soil and attenuated mafic absorption band depths dominated the weathering factors for delineating the high 3He abundant zones. The distribution was greatly influenced by the electro-conductive nature of ilmenite as an important retention proxy. The variogram of 3He exhibited cyclicity associated with the periodicity over the geological timescale, as can be explained by weathering processes.
The physical properties of the regolith showed that pyroclastic deposits have an increased response of surface scattering and a moderate to high dielectric constant, possibly due to the fine-grained structure and enhanced hydration. The study further noted that lower abundant regolith of the ejecta cover represented a relatively high correlation with volume scattering. This was attributed to the presence of dipole-like features buried within the regolith. Cyclicity of the cross-variograms at a higher lag distance indicated a reddening contribution to an already albedo-dominated nature within the gardened ejecta regolith. In this regard, our study demonstrates the prospectivity of a lunar site from a 3He resource viewpoint, thereby contributing to the in-situ exploration of lunar resources at mining scales.

Author Contributions

Conceptualization, S.S.; Methodology, S.S., V.T. and S.K.; Software, S.S.; Validation, S.S.; Formal analysis, S.S., V.T., and S.K.; Investigation, S.S.; Resources, S.S., V.T., S.K., and A.S.; Writing—original draft preparation, S.S.; Writing—review and editing, A.S., S.K., and V.T.; Visualization, S.S.; Supervision, V.T. and S.K.; Project administration, A.S.; Funding acquisition, A.S. All authors have read and agreed to the published version of the manuscript.

Funding

This research was supported by the Faculty of Geo-information Science and Earth Observation (ITC), University of Twente, Enschede, The Netherlands.

Acknowledgments

The authors want to acknowledge Wenzhe Fa from Peking University and Tim Swindle from the University of Arizona for making the 3He ground truth measurements accessible and for helpful discussions. We are thankful to the Lunar Geoscience Node, Washington University at St. Louis for providing free access to the datasets used in the study. We are also extremely grateful to the Python, R, and Scikit-learn teams for promoting free and open-source libraries. The authors would also like to thank Abhisek Maiti and Sayantan Majumdar for their valuable inputs on the computational aspects of the study.

Conflicts of Interest

The authors declare no conflict of interest.

Appendix A

We present the comparison of our model with the previous model as in [8], which includes the predicted 3He values at the Apollo landing sites and estimated solar wind fluence at our study site. As the model in [8] presents a modified version of [9] and also uses more sample data, we provide the results concerning the sample size of [8]. For this, we first estimated the modeled solar wind flux values, spectral parameters, and TiO2 content (from the equations in Section 3.2) of the 25 Apollo samples that were used in [8]. After predicting the 3He content from both models, we found that the standard error in our model was 0.5 compared to [8], and the laboratory-measured 3He, where it was 0.52 and 0.56, respectively (as in Figure A1). The differences in the prediction values were mainly caused due to the spatial occurrence of gardening processes that were not subtly represented in the optical maturity image of [8] compared to the individual space weathering spectral effects in our case.
Figure A1. Comparison of laboratory-measured 3He with the predictions made by our model and Fa model [8]. In this, a total of 25 Apollo samples were considered as reported in [8]. The reported standard deviation was 2.62 in the Fa model whereas our model had a standard deviation of 2.52.
Remotesensing 12 03350 g0a1
When measuring at the local scale, ignoring the topography attributes to the spatial homogeneity of solar wind flux, wherein the values are almost similar for all the pixels and hence, directly influences the prediction. Such behavior is capable of introducing uncertainties even though the correlation between the ground truth and prediction is good.
Furthermore, we also compared the solar wind fluence for these 25 Apollo samples with and without topographical constraints. The standard error in the case of our model was 0.004 compared to 0.008 for the Fa model. Vertical roughness is an important factor to consider for the regolith to capture the incoming solar wind 3He, which was ignored in [8]. This resulted in the overestimation of the received flux and significantly hampered the predictions. We attempted to compensate for the effect and provide the realistic limit of solar wind flux. Another contributing factor that makes the measurements less reliable is the saturation effect. The lunar farside receives more solar wind flux compared to the nearside [10]. This means that the farside samples are more likely to get saturated. However, since the returned samples were mostly from the nearside, we cannot comment upon the saturation effect. In the present study, we tried to include samples from the Luna landing site, which are located near the eastern limbs of the Moon and hence, can potentially mitigate the effect. We observed that the Luna samples received about 37% more solar wind flux than the average of all the Apollo samples. Figure A2 shows the frequency distribution of the observed differences between our topographically normalized model and conventional fluence model of [8] at the Vallis Schroteri site, wherein the curve closely followed the Gaussian distribution. This difference was larger than the stochastic variability that could be expected because of the randomness of the local gardening process and thus, is one of the additional indicators controlling the retention outcome. The negative sign in the plot attributes to the changes caused by the local topography in solar wind fluence, thereby leading to the reduced flux in our model and overestimation of the conventional model. In principle, the plasma particles incident on the surface with an effective velocity, which in turn depends on the orientation of the surface facet. The greater the angle of orientation, the lower the chances of particles getting accumulated behind the facet. Hence, the inclusion of the local topographic effect needs to be accounted for, producing realistic retention maps of the 3He at both global and mining scales.
Figure A2. Distribution of the difference in solar wind flux between the proposed topographically normalized model and the conventional model as in [8].
Remotesensing 12 03350 g0a2

References

  1. Kulcinski, G.L.; Schmitt, H.H. The Moon: An abundant source of clean and safe fusion fuel for the 21st century. In Lunar Helium-3 and Fusion Power (NASA Conference Publication 10018); NASA: Washington, DC, USA, 1988; pp. 135–163. [Google Scholar]
  2. Swindle, T.D. Abundance of 3He and other solar wind derived volatiles in lunar soil. In NASA Space Engineering Research Center for Utilization of Local Planetary Resources: Annual Progress Report (APR-92), III; NASA: Tucson, AZ, USA, 1992; pp. 19–26. [Google Scholar]
  3. Santarius, J.F. Lunar 3He and Fusion Power. Fusion Technology. Presented at the IEEE Rock River Valley Section, Rockford, IL, USA, 28 September 2004. [Google Scholar]
  4. Heiken, G.; Vaniman, D.T.; French, B.M. Lunar Sourcebook: A User’s Guide to the Moon, 1st ed.; Cambridge University Press: New York, NY, USA, 1991. [Google Scholar]
  5. Keller, L.P.; Mckay, D.S. The nature and origin of rims on lunar soil grains. Geochim. Cosmochim. Acta 1997, 61, 2311–2341. [Google Scholar] [CrossRef] [Green Version]
  6. van der Meer, F.; Yang, H.; Lang, H. Imaging spectrometry and geological applications. In Imaging Spectrometry: Basic Principles and Prospective Applications, 3rd ed.; van der Meer, F., de Jong, S.M., Eds.; Springer: Dordretch, The Netherlands, 2011; Volume 3, pp. 201–218. [Google Scholar]
  7. Le Mouelic, S.; Langevin, Y.; Erard, S.; Pinet, P.; Chevrel, S.; Daydou, Y. Discrimination between maturity and composition of lunar soils from integrated Clementine UV-visible/near-infrared data: Application to the Aristarchus plateau. J. Geophys. Res. 2000, 105, 9445–9455. [Google Scholar] [CrossRef]
  8. Fa, W.Z.; Jin, Y.Q. Quantitative estimation of Helium-3 spatial distribution in the lunar regolith layer. Icarus 2007, 190, 15–23. [Google Scholar] [CrossRef]
  9. Johnson, J.R.; Swindle, T.D.; Lucey, P.G. Estimated solar wind implanted Helium-3 distribution on the Moon. Geophys. Res. Lett. 1999, 26, 385–388. [Google Scholar] [CrossRef]
  10. Swindle, T.D.; Glass, C.E.; Poulton, M.M. Mining Lunar Soils for 3He; University of Arizona Press: Tucson, AZ, USA, 1990. [Google Scholar]
  11. Slyuta, E.N.; Abdrakhimov, A.M.; Galimov, E.M. The estimation of Helium-3 probable reserves in lunar regolith. In Proceedings of the Lunar and Planetary Science Conference, League City, TX, USA, 12–16 March 2007. [Google Scholar]
  12. Lucey, P.G.; Blewett, D.; Taylor, J.; Hawke, R. Imaging of lunar surface maturity. J. Geophys. Res. Planets 2000, 105, 20377–20386. [Google Scholar] [CrossRef]
  13. Horz, F.; Grieve, R.A.; Heiken, G.; Spudis, P.D.; Binder, A. Lunar Surface Processes. In Lunar Sourcebook: A User’s Guide to the Moon, 1st ed.; Cambridge University Press: New York, NY, USA, 1991; Volume 1, pp. 61–120. [Google Scholar]
  14. Patterson, G.W.; Stickle, A.M.; Turner, F.S.; Jensen, J.R.; Bussey, D.B.; Spudis, P.; Espiritu, R.C.; Schulze, R.C.; Yocky, D.A.; Wahl, D.E.; et al. Bistatic radar observations of the Moon using Mini-RF on LRO and the Arecibo Observatory. Icarus 2017, 283, 2–19. [Google Scholar] [CrossRef]
  15. Wahl, D.E.; Yocky, D.A.; Bussey, B.; Jakowatz, C.V. Generating lunar bistatic SAR images using Arecibo and Mini-RF. In Proceedings of the SPIE Defense, Security, and Sensing: Algorithm for Synthetic Aperture Radar Imagery XIX, Baltimore, MD, USA, 25–26 April 2012. [Google Scholar]
  16. Lucey, P.G.; Hawke, B.R.; Pieters, C.M.; Head, J.W.; McCord, T.B. A Compositional Study of the Aristarchus Region of the Moon Using Near-Infrared Reflectance Spectroscopy. J. Geophys. Res. 1986, 91, D344–D354. [Google Scholar] [CrossRef] [Green Version]
  17. McEwen, A.S.; Robinson, M.S.; Eliason, E.M.; Lucey, P.G.; Duxburg, T.C.; Spudis, P.D. Clementine Observations of the Aristarchus Region of the Moon. Science 1994, 266, 1858–1862. [Google Scholar] [CrossRef]
  18. Campbell, B.A.; Carter, L.M.; Hawke, B.R.; Campbell, D.B.; Ghent, R.R. Volcanic and impact deposits of the Moon’s Aristarchus Plateau: A new view from Earth-based radar images. Geology 2008, 36, 135–138. [Google Scholar] [CrossRef]
  19. Chevrel, S.D.; Pinet, P.C.; Daydou, Y.; Le Mouélic, S.; Langevin, Y.; Costard, F.; Erard, S. The Aristarchus Plateau on the Moon: Mineralogical and structural study from integrated Clementine UV-VIS-NIR spectral data. Icarus 2009, 199, 9–24. [Google Scholar] [CrossRef]
  20. Whitford-Stark, J.L. Factors influencing the morphology of volcanic landforms: An earth-moon comparison. Earth Sci. Rev. 1982, 18, 109–168. [Google Scholar] [CrossRef]
  21. Zisk, S.H.; Hodges, C.A.; Moore, H.J.; Shorthill, R.W.; Thompson, T.W.; Whitaker, E.A.; Wilhelms, D.E. The Aristarchus-Harbinger region of the moon: Surface geology and history from recent remote-sensing observations. Moon 1977, 17, 59–99. [Google Scholar] [CrossRef]
  22. Cameron, W.S. An Interpretation of Schroter’s Valley and Other Lunar Sinuous Rilles. J. Geophys. Res. 1964, 69, 2423–2430. [Google Scholar] [CrossRef]
  23. Pieters, C.M.; Boardman, J.; Buratti, B.; Chatterjee, A.; Clark, R.; Glavich, T.; Green, R.; Head, J., III; Isaacson, P.; Malaret, E.; et al. The Moon Mineralogy Mapper (M3) on Chandrayaan-1. Curr. Sci. 2009, 96, 500–505. [Google Scholar]
  24. Cahill, J.T.S.; Thomson, B.J.; Patterson, G.W.; Bussey, D.B.J.; Neish, C.D.; Lopez, N.R.; Turner, F.S.; Aldridge, T.; McAdam, M.; Meyer, H.M.; et al. The miniature radio frequency instrument’s (Mini-RF) global observations of Earth’s Moon. Icarus 2014, 243, 173–190. [Google Scholar] [CrossRef]
  25. Carter, L.M.; Campbell, B.A.; Hawke, B.R.; Campbell, D.B.; Nolan, M.C. Radar remote sensing of nearside lunar pyroclastic deposits. J. Geophys. Res. 2009, 114, E11004. [Google Scholar] [CrossRef] [Green Version]
  26. Nozette, S.; Spudis, P.; Bussey, B.; Jensen, R.; Raney, K.; Winters, H.; Lichtenberg, C.L.; Marinelli, W.; Crusan, J.; Gates, M.; et al. The Lunar Reconnaissance Orbiter Miniature Radio Frequency (Mini-RF) Technology Demonstration. Space Sci. Rev. 2010, 150, 285–302. [Google Scholar] [CrossRef]
  27. Scholten, F.; Oberst, J.; Matz, K.; Roatsch, T.; Wählisch, M.; Speyerer, E.J.; Robinson, M.S. GLD100: The near-global lunar 100 m raster DTM from LROC WAC stereo image data. J. Geophys. Res. 2012, 117, E00H17. [Google Scholar] [CrossRef] [Green Version]
  28. Wittenberg, L.J.; Cameron, E.N.; Kulcinski, G.L.; Ott, S.H.; Santarius, J.F.; Sviatoslavsky, G.I.; Sviatoslavsky, I.N.; Thompson, H.E. A Review of 3He Resources and Acquisition for Use as Fusion Fuel. J. Fusion Technol. 1992, 21, 2230–2253. [Google Scholar] [CrossRef]
  29. Nettles, J.W.; Staid, M.; Besse, S.; Boardman, J.; Clark, R.N.; Dhingra, D.; Isaacson, P.; Klima, R.; Kramer, G.; Pieters, C.M.; et al. Optical maturity variation in lunar spectra as measured by Moon Mineralogy Mapper data. J. Geophys. Res. 2011, 116, E00G17. [Google Scholar] [CrossRef]
  30. Shkuratov, Y.G.; Kaydash, V.G.; Opanasenko, N.V. Iron and Titanium Abundance and Maturity Degree Distribution on the Lunar Nearside. Icarus 1999, 137, 222–234. [Google Scholar] [CrossRef] [Green Version]
  31. Raney, R.K.; Cahill, J.T.S.; Patterson, G.W.; Bussey, D.B.J. The m-chi decomposition of hybrid dual-polarimetric radar data with application to lunar craters. J. Geophys. Res. 2012, 117, E00H21. [Google Scholar]
  32. Fa, W.Z.; Wieczorek, M.A.; Heggy, E. Modeling polarimetric radar scattering from the lunar surface: Study on the effect of physical properties of the regolith layer. J. Geophys. Res. 2011, 116, E03005. [Google Scholar] [CrossRef]
  33. Fung, A.K.; Li, Z.; Chen, K.S. Backscattering from a Randomly Rough Dielectric Surface. IEEE Trans. Geosci. Remote Sens. 1992, 30, 356–369. [Google Scholar] [CrossRef]
  34. Tzeng, Y.C.; Chen, K.S. A dynamic learning neural network for remote sensing applications. IEEE Trans. Geosci. Remote Sens. 1994, 32, 1096–1102. [Google Scholar] [CrossRef]
  35. Fa, W.Z.; Jin, Y.Q. Simulation of brightness temperature from lunar surface and inversion of regolith-layer thickness. J. Geophys. Res. 2007, 112, E05003. [Google Scholar] [CrossRef] [Green Version]
  36. R Core Team. R: A Language and Environment for Statistical Computing; R Foundation for Statistical Computing: Vienna, Austria, 2013. [Google Scholar]
  37. Shukla, S. Lunar Regolith Characterization for Solar Wind Implanted Helium-3 Using M3 Spectroscopy and Bistatic Miniature Radar. Master’s Thesis, University of Twente Faculty of Geo-information Science and Earth Observation (ITC), Enschede, The Netherlands, 2019. [Google Scholar]
  38. Bhiravarasu, S.S.; Rivera-Valentin, E.G.; Taylor, P.A.; Patterson, G.W.; Neish, C.D.; Thomson, B.J. Radar circular polarization ratio characteristics of lunar terrain as a function of viewing geometry. In Proceedings of the Lunar and Planetary Science Conference, The Woodlands, TX, USA, 12–16 March 2007. [Google Scholar]
  39. Hintenberger, H.; Weber, H.W.; Schultz, L. Solar, spallogenic, and radiogenic rare gases in Apollo 17 soils and breccias. In Proceedings of the Lunar Science Conference, Houston, TX, USA, 18–22 March 1974; pp. 2005–2022. [Google Scholar]
  40. Hintenberger, H.W.; Weber, H.W. Trapped rare gases in lunar fines and breccias. In Proceedings of the Lunar Science Conference, Houston, TX, USA, 21–25 March 1973; pp. 2003–2019. [Google Scholar]
  41. Bogard, D.D.; Hirsch, W.C.; Nyquist, L.E. Nobel gases in Apollo 17 fines: Mass fractionation effects in trapped Xe and Kr. In Proceedings of the Lunar Science Conference, Houston, TX, USA, 18–22 March 1974; pp. 1975–2003. [Google Scholar]
Figure 1. Geological setting of Vallis Schroteri over the Aristarchus Plateau (Base: Apollo 15 Metric Camera Photograph AS15-M-2610). Location is depicted by a white box in the Clementine mosaic of the Moon in the bottom right. The white dotted line denotes the buried crater. North is to the top.
Remotesensing 12 03350 g001
Figure 2. Flow chart of the methodology adopted in the research.
Remotesensing 12 03350 g002
Figure 3. (a) Retained 3He in the Vallis Schroteri region. The solid black lines delineated high modeled 3He abundance regions. (b) Comparison of FTC/IA with laboratory-measured 3He content. The purple fitted regression line represents the averaged sample measurements while the orange line was fitted to all 61 samples. (c) Zoomed version of high abundant pyroclastic regolith. North is to the top.
Remotesensing 12 03350 g003
Figure 4. False color composite of the Vallis Schroteri region. Red: continuum slope, green: albedo, blue: integrated band depth ratio, with green and blue channels inverted. In the image, P is the pyroclastic region and E is the ejecta region. Associated spectra are depicted for the corresponding marked regions. Red circles denote the 2800 nm absorption feature in the spectra. North is to the top.
Remotesensing 12 03350 g004
Figure 5. Spatial variability of the 3He distribution. (a) Empirical variogram representation of the Vallis Schroteri. (b) Incorporation of the directional component in the variogram analysis and interpretation. The cutoff was taken as 3.
Remotesensing 12 03350 g005
Figure 6. (a) Spatial distribution of the modeled 3He abundance per unit area for Vallis Schroteri. (b) Histogram plot of the corresponding areal concentrations. The Default R histogram bin size was used. North is to the top.
Remotesensing 12 03350 g006
Figure 7. (a) m - χ decomposition image of the Vallis Schroteri region using Mini-RF data. db: double bounce scattering in red, vs: volume scattering in green, and bs: surface scattering in blue. (b) CPR image represents the surface roughness. The red circle represents a freshly formed micro-crater in the vicinity of the primary rille. Black arrows depict the regolith with high volume scattering power. The dotted black line denotes the boundary between pyroclastic and mare deposits. North is to the top.
Remotesensing 12 03350 g007
Figure 8. 3D plots representing the simulated radar backscatter as a function of surface roughness and dielectric properties for (a) HH-pol, and (b) VV-Pol. The incidence angle was set at 57.5°.
Remotesensing 12 03350 g008
Figure 9. The dielectric constant of the study site from the MLP NN-based inversion model. The observed standard deviation was 0.17. The red circle represents a freshly formed micro-crater with anomalous dielectric constant values. Black arrows denote high dielectric regions. A black dotted line separates the pyroclastic region and mare deposits as observed in Figure 7a. North is to the top.
Remotesensing 12 03350 g009
Figure 10. Multi-sensor comparison of 3He content for the ejecta cover blanket with (a) CPR, (b) dielectric constant, and (c) scattering power. Note that the linear regression line was fitted for all cases.
Remotesensing 12 03350 g010
Figure 11. Cross-variogram between 3He and the physical properties of the (a) high abundant pyroclastic regolith and (b) low abundant ejecta cover regolith.
Remotesensing 12 03350 g011
Table 1. List of datasets used (https://ode.rsl.wustl.edu/moon/index.aspx). A## represents Apollo landing sites whereas L## represents Luna landing sites. OP is the M3 optical periods.
DatasetProduct IDPurpose
Chandrayaan-1 M3 (Level 2)M3G20090418T174554_V01_RFL, OP2AVallis Schroteri
M3G20090107T130225_V01_RFL (A11), OP1A
M3G20090416T181121_V01_RFL (A12), OP2A
M3G20090416T081001_V01_RFL (A14), OP2A
M3G20090205T111013_V01_RFL (A15), OP1B
M3G20090108T044645_V01_RFL (A16), OP1A
M3G20090203T080104_V01_RFL (A17), OP1B
M3G20090201T085853_V01_RFL (L16 & L20), OP1B
M3G20090728T130752_V01_RFL (L24), OP2C
Validation of the Retention model with Apollo and Luna landing site data.
LRO Mini-RF (Reduced Data Records and Derived Data Records)LST_15317_1S1_XIU_28N309_V2
LST_15317_1S2_XIU_28N309_V2
LST_15317_1S3_XIU_28N309_V2
LST_15317_1S4_XIU_28N309_V2
LST_15317_1CP_XIU_28N309_V2
Bistatic data of Vallis Schroteri
LSZ_00377_2CD_EKU_01N023_V1 (A11)
LSZ_02293_2CD_EKU_04S342_V3 (A14)
LSZ_02609_2CD_EKU_16S016_V1 (A16)
LSZ_06603_2CD_EKU_14S016_V1 (A16)
Validation of Inversion model with available monostatic data of Apollo landing sites
LRO Global DEMGLDEM100Topographic normalization of solar wind fluence model
Apollo Science datafrom [10]Validation of Retention model with laboratory-measured data of 3He
Table 2. Sensitivity range of parameters for IEM and MLP neural network-based inversion model.
ParametersLower RangeUpper RangeStep SizeReference
ε 1.5120.05[13,32]
σ h   cm0.0550.05[13,32]
θ deg0855[13,32]
Table 3. Statistical indicators of retained 3He concentrations at the Apollo and Luna landing sites.
Methods R2RMSE (ppb)MAE (ppb) d i n d e x
61 Samples0.76251.17010.94430.9289
Average0.92950.71810.65220.9814
Table 4. A comparison between inverted and laboratory-measured dielectric constant values.
Landing SiteActualInverted
Apollo 1111.0011.18
Apollo 144.454.19
Apollo 165.645.69
Table 5. Laboratory-based measurements of the Apollo 17 samples.
SamplesDescriptionTiO2 wt% Size   ( μ m)3He ppbReference
72501Light mantle soil1.59<20
20–25
25–35
35–54
54–75
75–120
120–200
200–300
5.6
2.4
1.5
1.0
0.7
0.5
0.3
0.4
[39]
74220Orange soil8.62<20
20–25
25–35.5
35.5–54
54–75
75–120
120–200
200–300
1.1
0.2
0.1
0.1
0.07
0.06
0.03
0.03
[40]
76501Dark mantle soil
(Pyroclastic)
3.18<20
20–30
30–44
44–63
63–125
125–250
250–1000
8.8
4.0
2.8
2.0
1.8
1.1
1.0
[41]
Publisher’s Note: MDPI stays neutral with regard to jurisdictional claims in published maps and institutional affiliations.

