A Holistic Analysis for Landslide Susceptibility Mapping Applying Geographic Object-Based Random Forest: A Comparison between Protected and Non-Protected Forests


Institute for Cartography, Department of Geosciences, Technische Universität Dresden, 01069 Dresden, Germany
Remote Sens. 2020, 12(3), 434; https://doi.org/10.3390/rs12030434
Submission received: 1 December 2019
/
Revised: 20 January 2020
/
Accepted: 27 January 2020
/
Published: 29 January 2020
(This article belongs to the Special Issue Remote Sensing Applications in Monitoring of Protected Areas)
Abstract
:Despite recent progress in landslide susceptibility mapping, a holistic method is still needed to integrate and customize influential factors with the focus on forest regions. This study was accomplished to test the performance of geographic object-based random forest in modeling the susceptibility of protected and non-protected forests to landslides in northeast Iran. Moreover, it investigated the influential conditioning and triggering factors that control the susceptibility of these two forest areas to landslides. After surveying the landslide events, segment objects were generated from the Landsat 8 multispectral images and digital elevation model (DEM) data. The features of conditioning factors were derived from the DEM and available thematic layers. Natural triggering factors were derived from the historical events of rainfall, floods, and earthquake. The object-based image analysis was used for deriving anthropogenic-induced forest loss and fragmentation. The layers of logging and mining were obtained from available historical data. Landslide samples were extracted from field observations, satellite images, and available database. A single database was generated including all conditioning and triggering object features, and landslide samples for modeling the susceptibility of two forest areas to landslides using the random forest algorithm. The optimal performance of random forest was obtained after building 500 trees with the area under the receiver operating characteristics (AUROC) values of 86.3 and 81.8% for the protected and non-protected forests, respectively. The top influential factors were the topographic and hydrologic features for mapping landslide susceptibility in the protected forest. However, the scores were loaded evenly among the topographic, hydrologic, natural, and anthropogenic triggers in the non-protected forest. The topographic features obtained about 60% of the importance values with the domination of the topographic ruggedness index and slope in the protected forest. Although the importance of topographic features was reduced to 36% in the non-protected forest, anthropogenic and natural triggering factors remarkably gained 33.4% of the importance values in this area. This study confirms that some anthropogenic activities such as forest fragmentation and logging significantly intensified the susceptibility of the non-protected forest to landslides.
1. Introduction
Despite the importance of physical-resisting forces of forests to the propensity for landslide occurrence, human and non-human variables can accelerate the spatial probability of landslide occurrence through slope stability in a given area [1]. However, the holistic understanding of the importance of conditioning and triggering factors that control the susceptibility of forest areas to landslides has not been appropriately customized yet. Anthropogenic triggering factors may reduce the resisting forces of forests to landslides by deforestation [2,3,4,5,6,7,8,9,10], logging [4,11,12,13,14,15,16], and mining [17], or may increase the susceptibility of forest areas to landslides by the fragmentation induced by infrastructure development such as road-network expansion [4,5,16,18,19,20,21,22,23] with the consequences of mass movements and slope failures. Likewise, natural triggering factors such as earthquake [24,25,26,27], rainfall [28,29,30,31,32], and flooding [33,34] may increase the propensity for occurring landslides by reducing the resisting forces in forest areas. Meanwhile, a comparison between the importance of conditioning and triggering factors in protected and non-protected forests may reveal the effects of anthropogenic activities on the susceptibility of disturbed forests to landslides.
Various methods have been developed for assessing landslide susceptibility with respect to knowledge-driven approaches, physical and statistical models, and machine learning algorithms [35,36]. Knowledge-driven approaches are subjective, and determines the influence of a variable through an expert’s opinion [37] that may affect the real expectation of landslide susceptibility [38]. Moreover, the physical models are appropriate for assessing the susceptibility of small areas to landslide in the presence of detailed geological, pedological, hydrological, and geomorphological information [39,40]. The statistical models are dependent on the input data characteristics, where any uncertainty in data may lead to a huge error in mapping the landslide susceptibility [40,41]. In contrast, machine learning applies algorithms for modeling through learning data, where their high ability in the estimation of a model has made them more popular for analyzing the landslide susceptibility at a regional scale [42] such as artificial neural networks (ANN) [43], decision trees (DT) [44], Bayesian network (BN) and naïve Bayes [45], support vector machines (SVM) [46], and random forest (RF) [42,47,48,49,50,51,52,53]. RF, as an ensemble machine learning algorithm, is known for its ability in handling both parametric and non-parametric variables, working with big data without any selection, reduction, or preprocessing, handling missing values automatically, avoiding the risk of over-fitting, self-testing using “out of bag” data, and yielding high satisfactory accuracy in modeling [54]. Furthermore, RF has achieved robust performance for the mapping of landslide susceptibility in comparison with the conventional statistical models such as weights-of-evidence [55], logistic regression [41,55,56], and generalized additive models (GAM) [55]; or even other machine learning techniques such as boosted regression trees [42,57], regression tree [58], ANN [56,59], and SVM [55,60]. For example, Vorpahl et al. [57] concluded that RF indicated a higher performance than statistical and other machine learning methods such as GAM, generalized linear models (GLM), the maximum entropy method (MEM), classification tree analysis, multivariate adaptive regression splines, and ANN for analyzing influential variables that control natural landslides in a montane tropical forest, South Ecuador. Likewise, Dou et al. [61] reported that RF performed higher overall efficiency than DT for mapping rainfall-induced landslide susceptibility at a regional scale in Japan.
Recent studies have criticized the current derived landslide susceptibility mapping in terms of applying similar geo-environmental factors over different regions and times [36,62,63], considering fixed effects of a variable [2,63] such as distance to roads [63] and land-use/land-cover derived from the current available images without assessing their dynamic changes [2,62]. However, the current land-cover may not reflect its actual status during the time a landslide occurs in a specific area [2,64], and human-induced triggering factors such as logging and road construction may reduce slope stability over time. For example, Wolter et al. [12] showed that landslide events were observed in forests that had been opened by logging activities or fragmented by road construction in the Chilliwack River Valley, British Columbia, and reported that other geo-environmental variables did not show significant effects on the slope instability.
The Hyrcanian ecoregion has been degraded by different human and natural triggering factors such as forest and rangeland conversion [65,66], forest fires [67,68], flooding [69], landslides [70,71,72], soil erosion [73], and climate hazards [74,75] in northeast (NE) Iran. Several studies have accomplished mapping landslide susceptibility in Hyrcanian forests, but have mostly focused on applying models and using common conditioning factors [51,76,77,78,79] with less attention given to the temporal dynamics of natural and anthropogenic triggering factors.
Less is known about the influence of different conditioning factors such as natural and particularly anthropogenic triggering factors for mapping landslide susceptibility in forest areas. For this purpose, a holistic approach needs to be developed to model the actual importance of conditioning and triggering factors, which control the susceptibility of protected and disturbed forests to landslides. Therefore, this research was designed to evaluate the performance of applying object-based random forest for mapping landslide susceptibility in a protected forest and a non-protected forest in NE Iran. Furthermore, we compared the importance of influential variables that control the susceptibility of these forests to landslides. Specifically, we aimed to find appropriate answers to the following questions: (i) Does object-based random forest show a satisfactory performance for modeling landslide susceptibility in protected and non-protected forests? (ii) Which conditioning and triggering factors are at the top in modeling the susceptibility of these two forest areas to landslides? and (iii) How do natural and anthropogenic triggering factors affect the susceptibility of protected and non-protected forests to landslides?
2. Materials and Methods
2.1. Description of Study Area
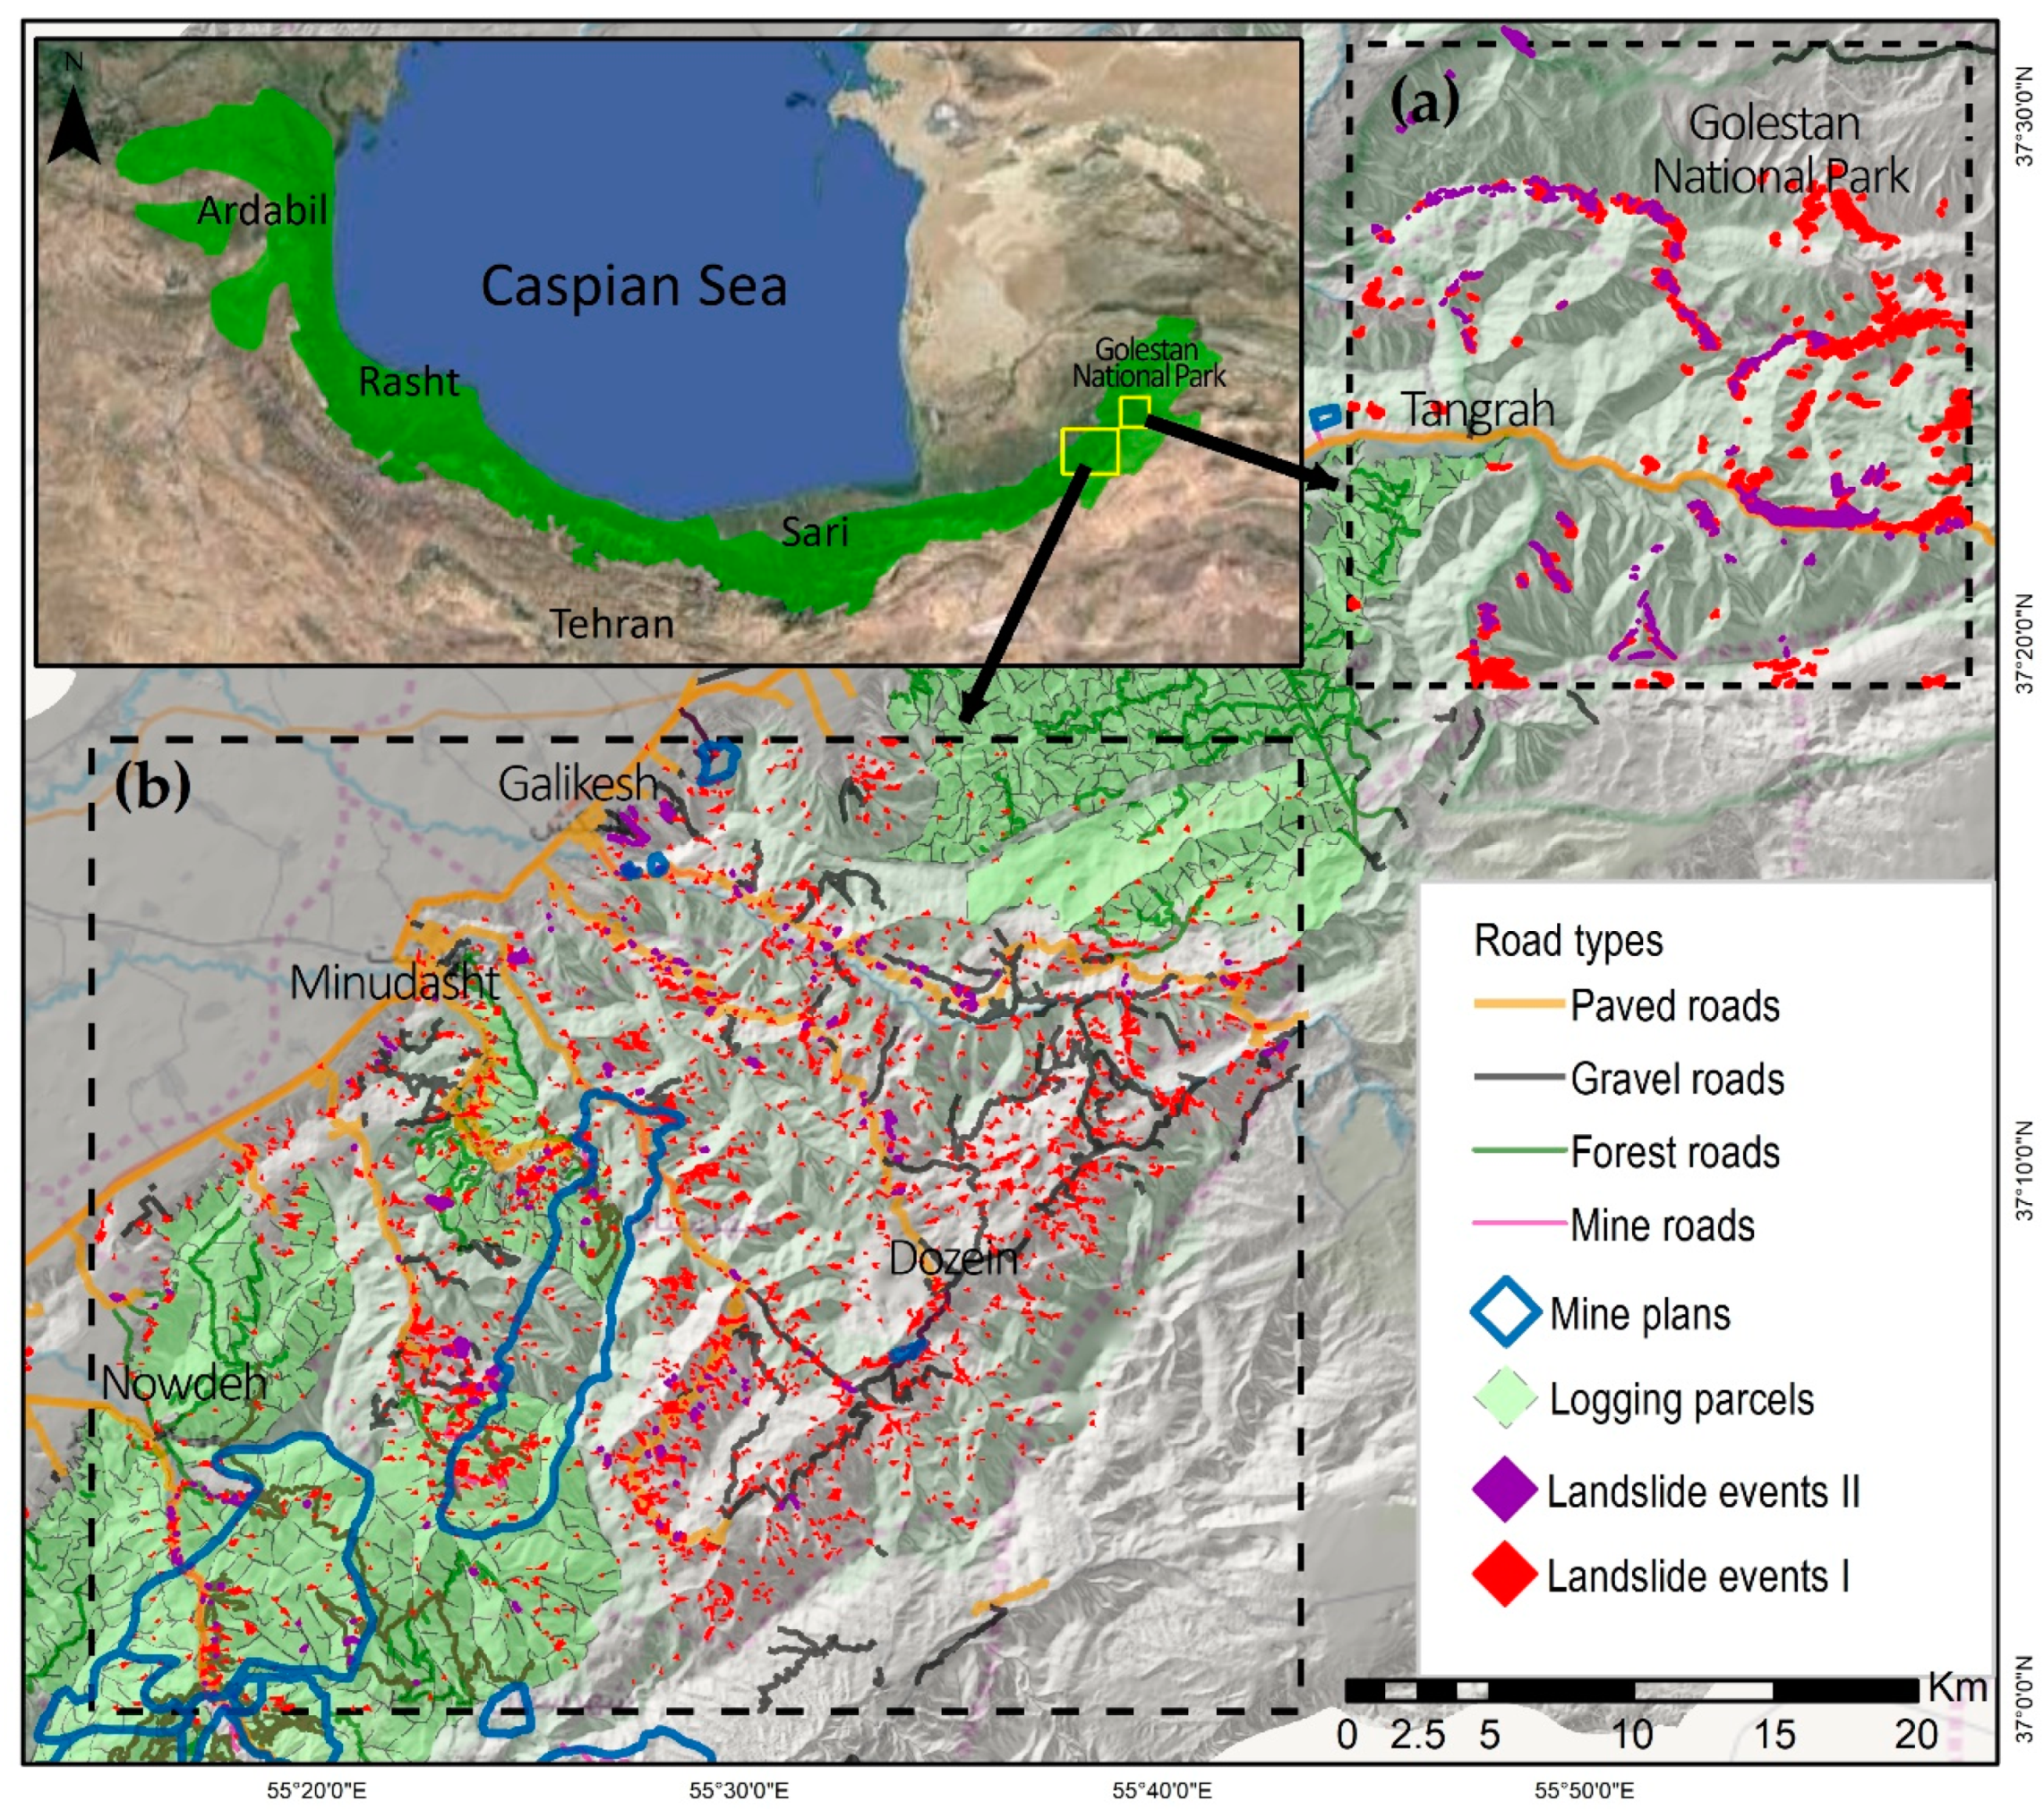
We selected a protected and a non-protected forest for analyzing landslide susceptibility in the eastern part of the Hyrcanian forests, southeast Caspian Sea, Iran. The largest Iranian National Park, Golestan, is assigned as a protected forest (approx. 500 out of 920 km2) (Figure 1a). The protection of this park has taken place since 1957 and was registered by UNESCO as a biosphere reserve in 1976 as it contains fifty percent of the total of Iran’s mammal species and above 1400 plant species registered by UNESCO [80,81]. A non-protected forest was selected in the neighborhood of this protected area (approx. 1500 km2). This area has been affected by a variety of human activities such as deforestation [65], logging, mining, and road construction [82]. The annual rate of deforestation was reported at about 0.85% [65], the number of forest logging parcels increased to 400 (34,000 ha), the number of mines reached 12 plans (12,520 ha), and the length of roads increased from 120 to 1257 km between 1966 and 2016 (Figure 1b). The average elevation, slope, and rainfall of the two studied forests are about 1280 m, 30° and 600 mm, with the predominant forest type of Quercus castaneafolia-Carpinus betulus.
However, dominated lithology types of the protected and non-protected forests are Jl (limestone, oolitic-porous dolomitic limestone; Lar formation; Mesozoic era; Jurassic period) and Js (upper: shale, marl, sandstone, nodular Ls, Ammonite, Belemnite, and lower: shale, sandstone with thin-bedded limestone; Shemshak formation; Mesozoic era; Jurassic period), respectively.
2.2. Landslide Surveying
Landslide events were collected from different sources. The CORONA KH-4B image (Mission ID: 1110-1089Fore) of 1970 (~2 m) (https://corona.cast.uark.edu/atlas) and aerial photos (1:20,000) from 1966 were used to survey old landslides (~230 samples) mostly in the protected forest. The new landslides (~430 samples) were obtained from field observations, the available database [83], and high-resolution images of Google Earth for 2016 (Figure 1). In addition to these samples, about 210 and 1650 polygons of old and new landslides, which were mapped using Sentinel images by Shirvani et al. [72], were used along with the landslide samples for the two study areas (Figure 1). The size of the landslide samples ranged between 0.095 and 239.6 ha in the protected forest and between 0.018 and 60.82 ha in the non-protected forest.
2.3. Image Segmentation for Generating Objects
A group of pixels that have similarity in their spectral and spatial properties is defined as an object [84]. The object-based paradigm has the ability to derive all possible features from the spectral, geometrical, contextual, and textural properties of either satellite images [84] or GIS (Geospatial Information Systems)-based data [85]. To obtain homogeneous objects, multi-resolution segmentation was implemented on the spectral bands of Landsat 8 of 2016 and SRTM (Shuttle Radar Topography Mission)-derived digital elevation model (30 m) [86]. After testing different scales by trial and error, the scale of 150 was selected with a higher weight for the near-infrared band (NIR) and the compactness and shape values of 0.8 and 0.2, respectively. The final segmentation was optimized using some digital elevation model (DEM) derivatives [72] such as slope, hillshade, terrain ruggedness index (TRI), and flow direction river (FDR). These image-segmented objects were assigned to calculate anthropogenic-induced deforestation and forest fragmentation from remote sensing data (Figure 2). Moreover, the summary statistics of conditioning and other triggering factors were calculated within each object segment.
2.4. Conditioning and Triggering Factors
We divided the driving forces of landslide susceptibility into conditioning and triggering factors based on the previous studies in the literature review [51,87] and the landslide characteristics of the study areas. Conditioning factors are cumulative events that show the potential of landslide occurrence, but do not necessarily trigger landslides [88], while triggering factors activate the landslides and increase the probability of occurrence by disturbing the balance between driving and resisting forces [89]. The selected conditioning variables included topographic, hydrologic, geology, soil, and vegetation layers. We generated topographic layers from the DEM; the hydrologic layers from the DEM and digital topographic maps (1:25,000); geological maps (1:100,000) from the Geological Survey and Mineral Explorations of Iran (GSI) and soil maps (1:100,000) from the Agriculture Department of Iran; and forest types were based on the thematic maps of forest management plans (Table 1). Furthermore, triggering factors were classified into natural (i.e., rainfall, earthquake, and flood) and anthropogenic (i.e., forest fragmentation, forest loss, logging, and mining). Rainfall intensity and earthquake magnitude were created by kriging [90] and inverse distance weighted (IDW) interpolation methods [91] from the historical events (Table 2). Flood frequency was calculated based on the frequency of flood occurrence along the main rivers within a specific catchment during the last five decades (Table 2).
We created the forest layer of 1970 from CORONA images and aerial photos using object-based nearest neighbor classification (Figure 2). A multispectral image was created from the original band of the images and two created channels using the sharpening and embossing filters. The segmentation was implemented through the multispectral resolution algorithm on these images. The possible classes were defined and some objects from each class were selected as training samples. Varieties of ancillary spectral and textural features were created to improve the accuracy of the classification. After optimizing the dimensions of the features, the standard nearest neighbor algorithm was applied for classifying the images to the forest and non-forest classes [82]. Moreover, the forest layer of 2016 was mapped from Landsat 8 using the object rule-based classification (Figure 2). After image segmentation as described earlier in Section 2.3, some objects from each class were selected. Then, different spectral, contextual, and textural features were derived from the main spectral bands of Landsat 8. The thresholds of non-forest classes from the forest class were determined by matching their values within the derived object features. The objects that had maximum difference values less than 0.52 were classified as water, residential areas, and grasslands; objects that had green vegetation index (GVI) [92] values that were negative and standard deviations derived from the gray-level co-occurrence matrix (GLCM) less than 21 were classified as dry-farming; the objects that had enhanced vegetation index2 [93] values higher than 0.98 and entropy derived from the GLCM less than 7 were classified as irrigated-farming; and the remaining unclassified objects were classified as forest [82]. The accuracy of the classifications was validated using the provided ground truth samples and confusion matrix [94], as shown in Table A1.
We calculated a number of forest loss and forest fragmentation metrics by comparing these two forest layers such as the rate of forest loss [65], edge density (ED), mean patch size (MPS), mean shape index (MSI), mean patch edge (MPE), mean perimeter-area ratio (MPAR), and number of patches (NumP) within each object [95] (Table 2). These metrics were included as triggering of landslide susceptibility along with the other variables. The total volumes of logging and weights of mining materials were calculated within each object from 1970 to 2016 as indicators of logging and mining intensity in the two studied forests.
2.5. Landslide Susceptibility
The object-based random forest approach was employed to assess the susceptibility of the protected and non-protected forests to landslides by contributing the conditioning and triggering factors as well as historical landslide samples.
Spatially, the landslide samples are joined to the objects of predictor variables. An object where over 50% of its area was affected by landslides was indicated as a landslide-affected object (LAO) and otherwise as a non-affected landslide object (NLAO). Roughly 20% of the LAO and NLAO objects were randomly selected for determining the importance of variables that control landslide susceptibility and modeling the spatial probability of landslide using a classification and regression trees (CART) procedure of RF [96,97].
RF is an ensemble-learning algorithm that builds several decision trees during the process of model formation. The training of each tree was carried out by bootstrap sampling from the generated dataset; about two-thirds of the samples were used for training a decision tree (in bag samples) and the remaining one-third was used to test the accuracy of the formed tree (out of bag (OOB) samples).
Multiple RFs were built to determine the optimal number of variables that needed to be applied for every splitting in each tree of the forest [98] in both study areas (Figure 3a,b). The OOB prediction was computed using the majority vote obtained from the OOB data for each object. The OOB error of an object was computed from the OOB prediction of that object. The results over all of the objects were used to calculate the error rate. The optimal performance of RF was determined with respect to the maximum area under the receiver operating characteristic (AUROC) [99,100] and the evaluating metrics of model performance such as sensitivity (Equation (1)), specificity (Equation (2)), precision (Equation (3)), and F-measure (Equation (4)) that were computed using the status of OOB errors including the objects that were labeled as LAO and also classified as LAO (TP); the objects that were labeled as NLAO and classified as NLAO (TN); the objects that were labeled as LAO but classified as NLAO (FN); and the objects that labeled as NLAO but classified as LAO (FP) [99,100].
RF calculates the importance of each variable in the classification through Gini importance or Permutation importance [101]. The importance of variables was determined depending on the internal Gini method [102] in this study. The probability value of assigning an object to the class LAO—depending on a specific threshold—was indicated as the susceptibility of that object to the landslide. All objects were scored depending on the optimal-trained model for calculating their susceptibility to landslide from zero (very-low probability) to one (very-high probability) in both protected and non-protected forests.
3. Results
3.1. Summary of Model Validation
The evaluation measures indicated that object-based random forest showed good performance in assessing the importance of variables that control the susceptibility of protected and non-protected forests to landslides. The optimal number of variables for every splitting in each tree was obtained as 7 and 11 in the protected and non-protected forests, respectively, depending on the minimum misclassification error (Figure 3a,b). The optimal AUROC values of protected and non-protected forest obtained about 86.31 and 81.77% after the formation of 500 trees. The sensitivity values of 77.54 and 74.56% were obtained from mapping the landslide susceptibility in the protected and non-protected forests, as shown in Table 3.
3.2. The Importance of Variables
The analysis of variable importance indicated that the top variables that controlled landslide susceptibility belonged to the topographic and hydrologic categories in both the protected and non-protected forests. The most influential variables were terrain ruggedness index (TRI) and river density with 19.54 and 6.07% of importance values in the protected and non-protected forests, respectively (Figure 4). The triggering variables had a significant influence on the landslide susceptibility in both regions; however, the score values of natural triggering factors (16.20%) were higher than the values of anthropogenic triggering factors (<1%) in the protected forest. On the other hands, anthropogenic factors (16.89%) such as forest fragmentation, logging, and mining activities recorded slightly higher score values than the natural triggering factors (16.50%) such as rainfall, flood, and earthquake in the non-protected forest (Figure 4). The geological variables recorded higher values in the non-protected forest in comparison to the protected forest. The type of forest variable showed a score value of 2.58% in the protected forest and a trivial importance in the non-protected forest. However, soil variables recorded total values of less than one percent for expressing landslide susceptibility in the two study areas.
3.3. Landslide Susceptibility Mapping
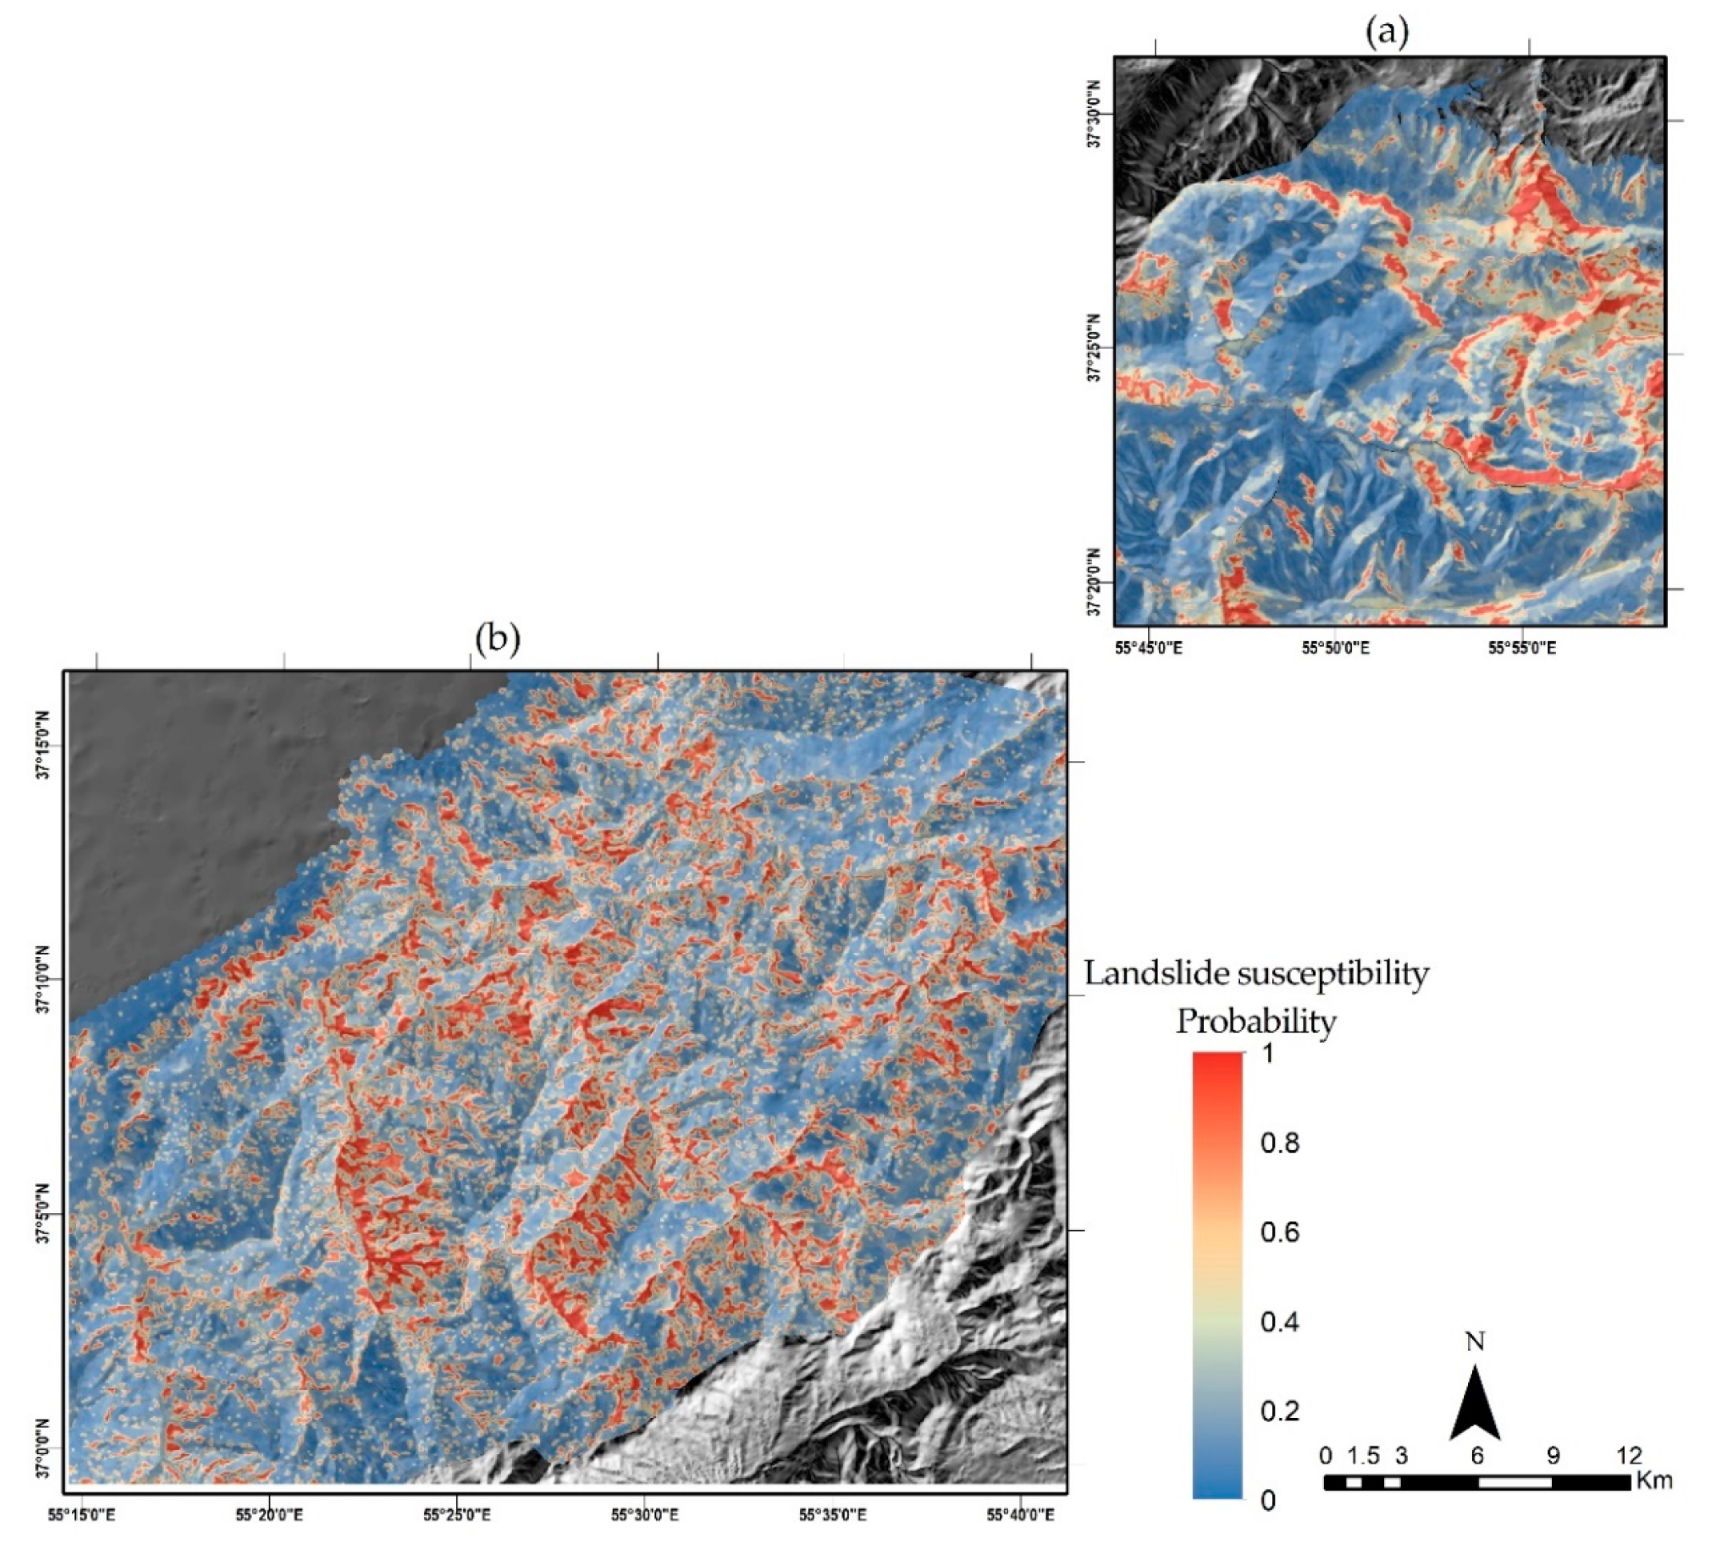
The output maps indicate that the distribution of the landslide susceptibility of non-protected forest (0.51 ± 0.36) was higher than in the protected forest (0.34 ± 0.33) in the study area (Figure 5). The high susceptibility values of landslide were distributed in the east of the protected forest (Figure 5a), which resulted from the extremely rugged and steep surfaces as well as the magnitude of the occurred earthquake and hydrological variables such as topographic wetness index (TWI) and distance to river (Figure 4). Although different parts of non-protected forest were occupied by high values of landslide susceptibility, those forests affected by the interaction of hydrologic and topographic variables with anthropogenic and natural triggering factors received higher values of landslide susceptibility, particularly in the central and southern parts of the non-protected forest (Figure 5b).
4. Discussion
4.1. The Accuracy of Landslide Susceptibility Maps in the Protected and Non-Protected Forests
The results of the model assessment indicated the high accuracy of the obtained landslide susceptibility maps from the RF model with the contribution of influential conditioning and triggering variables for both the protected and non-protected forests. However, the landslide susceptibility map of the protected forest showed a higher AUROC value than the landslide susceptibility map of the non-protected forest (Table 3). The high performance of RF for landslide susceptibility mapping has also been verified in previous studies [41,42,57,58,60]. This study adds that the application of an object-based random forest resulted in a high accuracy of landslide susceptibility mapping, whereas the pixel-based random forest was the model of interest by the aforementioned researchers.
4.2. The Importance of Conditioning Factors for Mapping Landslide Susceptibility in Protected and Non-Protected Forests
Our analysis of comparing the influential variables revealed that the topographic factors obtained the highest scores for mapping landslide susceptibility in the protected forest; however, there was a relative balance between the scores of topographic, hydrologic, and triggering factors in the non-protected forest. The topographic features obtained about 60% of the total importance values in the protected forest; 36% of the values were assigned to the TRI (19.5%) and slope (16.5%) (Figure 4). The majority of landslide events fell in the old type in the protected forest, which are scattered in the steeped slopes and coarse rugged surfaces [72]. Furthermore, our analysis showed that the spatial probability of landslide significantly increased from 0.75 to 1 when the TRI increased from 14 to 27 (Figure 6a) and the slope increased from 25˚ to 51˚ (Figure 6b) in the protected forest. The high importance of the TRI [42,52] and slope [41,48,50,132] for mapping the landslide susceptibility has also been reported in several studies. Nevertheless, some research has addressed the low importance of slope for mapping landslide susceptibility [42,47,58].
Although topographic features gained about 36% of importance in the non-protected forest, their score was lower than the score of the topographic features in the protected forest. Both studied forests showed almost similar topographic characteristics; however, the aspect (Figure 7b) and elevation (Figure 7c) recorded higher scores among the topographic features in the non-protected forest (Figure 4). Likewise, several studies have confirmed the high importance of aspect and elevation for landslide susceptibility mapping [49,50,51,52,53].
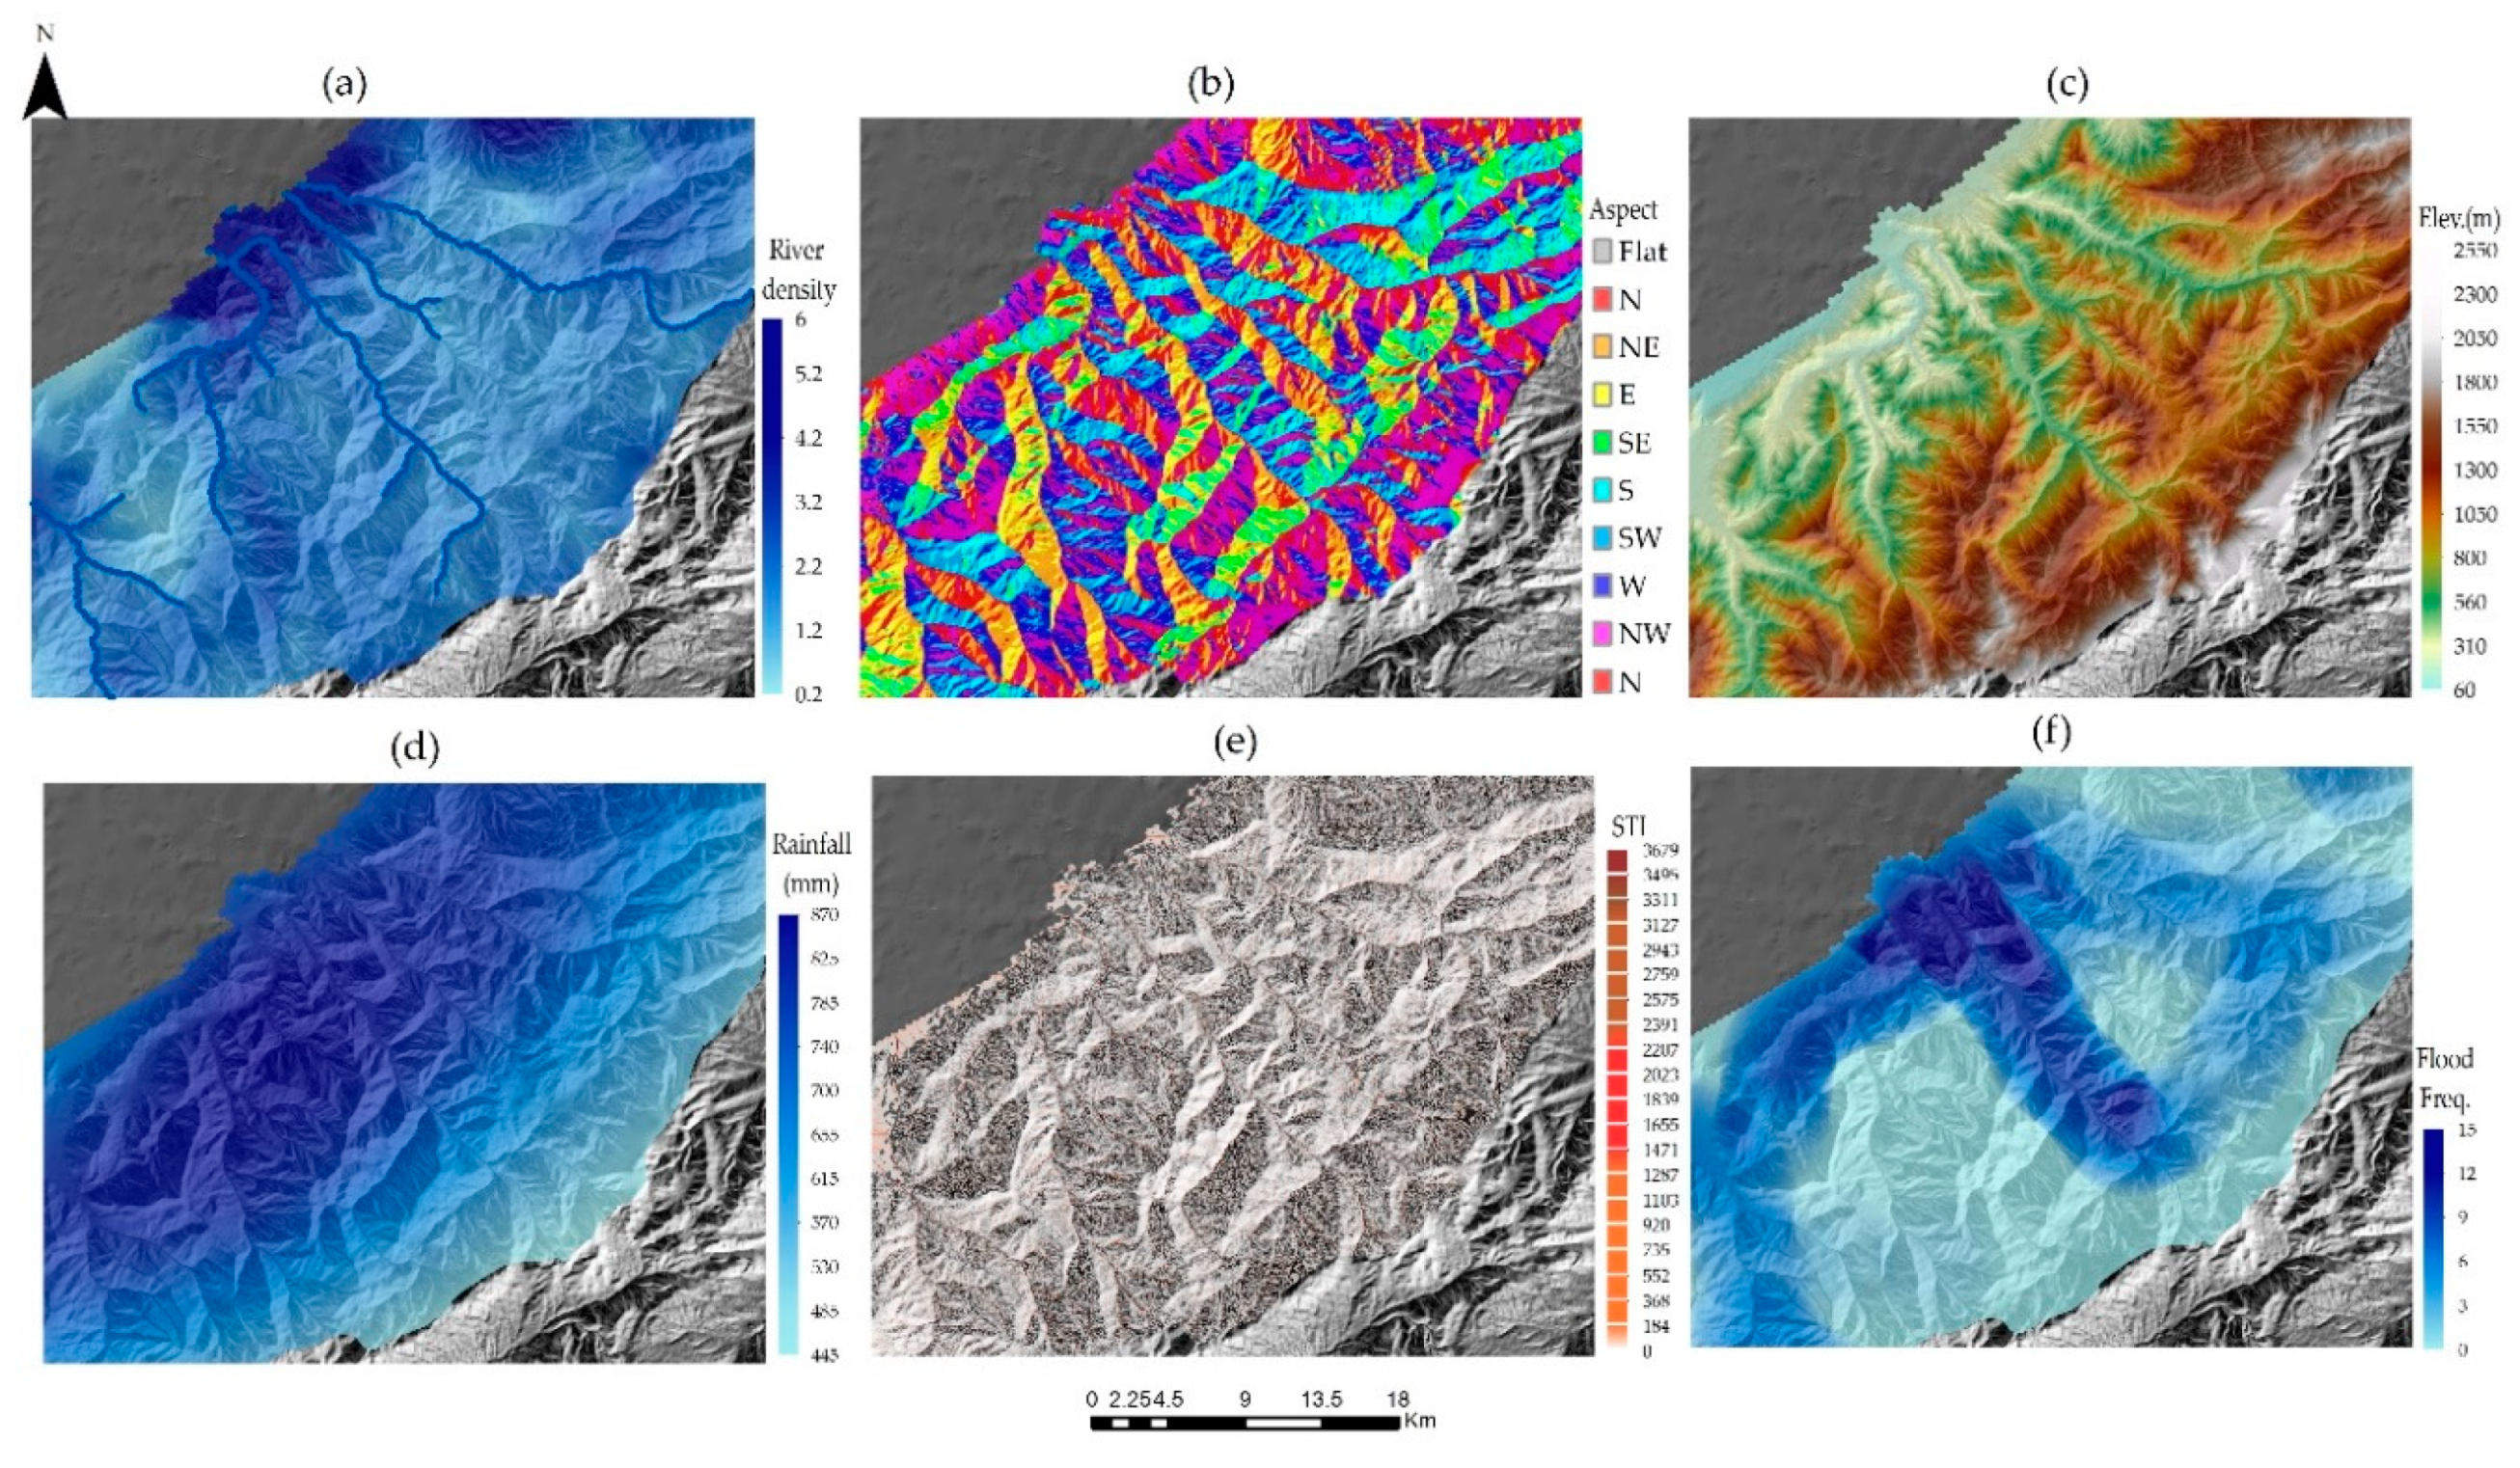
The hydrological features obtained about 18% of scores with the top variables of TWI (7%) and distance to rivers (4.7%) in the protected forest. While in the non-protected forest, the importance of hydrological features increased to 28.5% with the top variables of river density (Figure 7a) and sediment transportation index (STI) (Figure 7e). We can infer from these results that it is likely that increasing human activities such as deforestation may cause changes in the hydrological system and increase the sediment [133,134] through the rivers with the consequences of increasing the susceptibility of landslide [11]. For example, Swanson and Dyrness [16] concluded that clear-cutting-induced landslides has substantially increased transported sediment materials in forest areas. The importance of the TWI [48,53,132] and distance to river [4,50,53] has also been reflected in earlier studies mapping landslide susceptibility.
The importance values of natural triggering factors were relatively equal between the two forests. The top variables of this category were earthquake (9.3%) and rainfall (4.6%) in the protected forest (Figure 4a), while all three variables roughly gained equal values in the non-protected forest (Figure 4b). Although the importance of natural triggering factors such as earthquake [52] and rainfall [49,52,53,78] has been reported for mapping landslide susceptibility, earthquakes trigger landslides by generating primary slips and intensifying liquefaction in the saturated soils [52]. The intensification of natural hazards due to human intervention can increase the landslide susceptibility, as the importance of flood in the mapping of landslide susceptibility increased from 2.3% in the protected forest to 5.6% in the non-protected forest.
Although anthropogenic triggering factors obtained less than one percent of importance in the protected forest, their importance was recorded at roughly 17% in the non-protected forest. The features of forest fragmentation (Figure 8) ranked the highest among the anthropogenic factors, which resulted from forest conversion and road-network expansion for logging, rural usages, and transporting mine materials in the non-protected forest since the 1970s [82]. For example, the length of the rural roads have increased from 113 to 752 km between 1970 and 2016, and about 245 and 155 km of logging and mine roads were built before 2016, respectively. All the fragmentation metrics showed higher values in the non-protected forest in comparison to the protected forest (Figure 4 and Figure 8). Moreover, the importance of logging and mining was 2.6% and 1.5% in the non-protected forest, respectively. The number of parcels for timber harvesting increased from 0 to 404 between 1970 and 2016; the area of mining plans also expanded to 12,520 ha in the non-protected forest prior to 2016.
Most previous studies have frequently pointed to the anthropogenic triggering factors such as distance to roads [51,53,78,105,130], road density [76,105,135], land-use/land-cover types [42,47,49,58,78,106], and land-use changes [3,136,137] for the mapping of landslide susceptibility.
However, the current study explicitly localized and classified the significant anthropogenic triggering factors depending on the human footprint including forest fragmentation, forest conversion, timber harvesting, and mining within the forests. The influences of building forest roads [15,18,21,22,23], logging [4,11,12,13,14,15], deforestation [2,3,4,5,6,7,8], forest fragmentation [5], and mining [17] on the occurrence, frequency, and distribution of landslides have been demonstrated in the forest areas. For example, Guns and Vanacker [7] highlighted that anthropogenic activities such as forest conversion increased the occurrence of small landslides and sediment deposition in tropical forests. Borga et al. [18] concluded that forest roads changed the stream flows and increased the susceptibility of the forest to shallow landslides on steep slopes. Guthrie [13] reported that the frequency and density of landslides have significantly increased, following timber harvesting in the forested watersheds.
Although a number of studies have reported geological features as the main causes of increasing landslide susceptibility [49,51,76,132], our analysis revealed that the importance of these variables was lower than the topographic, hydrologic, and natural triggering factors in both the protected and non-protected forests as well as lower than the importance of anthropogenic triggering factors in the non-protected forest. Distance to faults with a value of 4.6% was the top variable of the geological features in the non-protected forest. In addition, some studies reported the low importance of lithology [41,50,58,78], but the high importance of distance to faults [58] for mapping landslide susceptibility.
Moreover, forest type did not show considerable importance for landslide susceptibility mapping in both forests. With respect to the importance of forest loss and forest fragmentation in the non-protected forest, we can argue that forest dynamics are superior to the forest type in landslide susceptibility mapping. Soil variables showed neutral influence on landslide susceptibility [50] in both forests.
This study indicated that the influential conditioning and triggering factors that control the susceptibility of the protected and non-protected forests to landslides are different. Likewise, some studies have verified the variety of landslide triggering factors for different regions [48,63]. The triggering factors of landslides have regional differences and the types of data in different study areas are not exactly the same.
The integration of random forest and an object-based approach yielded a good performance for mapping the landslide susceptibility in our forest regions. However, the comparison of the integration of other machine learning algorithms with the object-based approach needs to be considered to improve the best method to map the landslide susceptibility in the forest regions. Furthermore, this research used multiple conditioning and triggering factors to assess the susceptibility of forest areas to landslides. However, other factors may trigger landslide hazards such as ground water flow [138] in forest regions that need to be explored in the upcoming studies.
5. Conclusions
This study investigated the performance of a geographic object-based random forest for modeling the susceptibility of protected and non-protected forests to landslides. Various object features of conditioning (topographic, hydrologic, geologic, geology, soil, and vegetation) and triggering factors (rainfall, flood, earthquake, deforestation, forest fragmentation, logging, and mining) were applied as a database for the mapping of landslide susceptibility in the two forest areas using the random forest algorithm.
Although the random forest exhibited good performance for the mapping of landslide susceptibility in both the protected and non-protected forests, its sensitivity in the protected forest was higher than that in the non-protected forest. The influential variables controlling the susceptibility of these two forests to landslides were different. Approximately 88% of the susceptibility of protected forests were explained by the conditioning factors focusing on the topographic (60%) and hydrologic (18%) features. Moreover, triggering factors recorded 22% of importance, focusing on natural triggering factors (16%). The top five variables were TRI, slope, earthquake, elevation, and TCI for the mapping of landslide susceptibility in the protected forest. In contrast, the importance values were distributed among the object features of both the conditioning and triggering factors in the non-protected forests. While the importance of topographic factors has significantly decreased, the importance of triggering factors focusing on anthropogenic features has substantially increased from less than 1% in the protected forest to about 17%—focusing on forest fragmentation and logging—in the non-protected forest. Moreover, the effects of some features of hydrologic and natural triggering factors such as sediment transport index and flood frequency were amongst the top variables that control landslide susceptibility in the non-protected forest. The effects of these features could be caused or intensified by human activities such as deforestation, forest fragmentation, logging, and mining. These results provide managers and decision-makers with information in which to assess the consequences of developing destructive schemes such as road building, logging, and mining before any intervention in forest areas. The importance of geology and soil features was lower than the importance of other variables in the non-protected forest.
This study indicates that different forest areas can be affected by different conditioning and triggering factors that control their susceptibility to landslides. Consequently, there are no uniformly predefined influential variables for mapping landslide susceptibility in forest areas.
Author Contributions
Z.S. contributed to writing all parts of this article including the design of the work, image processing, and object-based classification using eCognition®, modeling of landslide susceptibility in R, and mapping in ArcGIS®. All authors have read and agreed to the published version of the manuscript.
Funding
This research received no external funding.
Acknowledgments
The author expresses her acknowledgment to the three anonymous reviewers whose comments/suggestions helped improve and clarify this manuscript. The author acknowledges support by the German Research Foundation and the Open Access Funding by the Publication Fund of the TU Dresden.
Conflicts of Interest
The author declare no conflicts of interest.
Appendix A

Table A1.
The results of the accuracy assessment of forest and non-forest classification categories using aerial photos and Landsat images in NE, Iran.
Table A1.
The results of the accuracy assessment of forest and non-forest classification categories using aerial photos and Landsat images in NE, Iran.
| Metric | Category | User’s Accuracy | Producer’s Accuracy | ||
|---|---|---|---|---|---|
| Time | 1966 | 2016 | 1966 | 2016 | |
| Method | NN 1 | RB 2 | NN | RB | |
| Category | Forest | 0.8102 | 0.96 | 0.9911 | 0.9320 |
| Non-forest | 0.9841 | 0.93 | 0.7045 | 0.9588 | |
| Observed agreement | 0.865 | 0.945 | — | — | |
| Kappa coefficient | 0.7175 | 0.89 | — | — | |
1 NN: Nearest neighbor classification; 2 RB: rule-based classification using object-based image analysis.
References
- Walker, L.R.; Shiels, A.B. Landslide Ecology; Cambridge University Press: New York, NY, USA, 2013. [Google Scholar]
- Guns, M.; Vanacker, V. Forest cover change trajectories and their impact on landslide occurrence in the tropical Andes. Environ. Earth Sci. 2013, 70, 2941–2952. [Google Scholar] [CrossRef]
- Reichenbach, P.; Busca, C.; Mondini, A.C.; Rossi, M. The influence of land use change on landslide susceptibility zonation: the Briga catchment test site (Messina, Italy). Environ. Manag. 2014, 54, 1372–1384. [Google Scholar] [CrossRef] [PubMed] [Green Version]
- Chang, J.-C.; Slaymaker, O. Frequency and spatial distribution of landslides in a mountainous drainage basin: Western Foothills, Taiwan. Catena 2002, 46, 285–307. [Google Scholar] [CrossRef]
- Yeh, C.-K.; Liaw, S.-C. Application of landscape metrics and a Markov chain model to assess land cover changes within a forested watershed, Taiwan. Hydrol. Process. 2015, 29, 5031–5043. [Google Scholar] [CrossRef]
- Alcántara-Ayala, I.; Esteban-Chávez, O.; Parrot, J. Landsliding related to land-cover change: A diachronic analysis of hillslope instability distribution in the Sierra Norte, Puebla, Mexico. Catena 2006, 65, 152–165. [Google Scholar] [CrossRef]
- Guns, M.; Vanacker, V. Shifts in landslide frequency–area distribution after forest conversion in the tropical Andes. Anthropocene 2014, 6, 75–85. [Google Scholar] [CrossRef]
- Glade, T. Landslide occurrence as a response to land use change: A review of evidence from New Zealand. Catena 2003, 51, 297–314. [Google Scholar] [CrossRef] [Green Version]
- Alcántara-Ayala, I.; Moreno, A.R. Landslide risk perception and communication for disaster risk management in mountain areas of developing countries: A Mexican foretaste. J. Mt. Sci. 2016, 13, 2079–2093. [Google Scholar] [CrossRef]
- Saito, H.; Murakami, W.; Daimaru, H.; Oguchi, T. Effect of forest clear-cutting on landslide occurrences: Analysis of rainfall thresholds at Mt. Ichifusa, Japan. Geomorphology 2017, 276, 1–7. [Google Scholar] [CrossRef]
- Imaizumi, F.; Sidle, R.C.; Kamei, R. Effects of forest harvesting on the occurrence of landslides and debris flows in steep terrain of central Japan. Earth Surf. Process. Landforms 2008, 33, 827–840. [Google Scholar] [CrossRef]
- Wolter, A.; Ward, B.; Millard, T. Instability in eight sub-basins of the Chilliwack River Valley, British Columbia, Canada: A comparison of natural and logging-related landslides. Geomorphology 2010, 120, 123–132. [Google Scholar] [CrossRef]
- Guthrie, R. The effects of logging on frequency and distribution of landslides in three watersheds on Vancouver Island, British Columbia. Geomorphology 2002, 43, 273–292. [Google Scholar] [CrossRef]
- Goetz, J.N.; Guthrie, R.H.; Brenning, A. Forest harvesting is associated with increased landslide activity during an extreme rainstorm on Vancouver Island, Canada. Nat. Hazards Earth Syst. Sci. 2015, 15, 1311–1330. [Google Scholar] [CrossRef] [Green Version]
- Wolfe, M.D.; Williams, J.W. Rates of Landsliding as Impacted by Timber Management Activities in Northwestern California. Environ. Eng. Geosci. 1986, 23, 53–60. [Google Scholar] [CrossRef]
- Swanson, F.J.; Dyrness, C.T. Impact of clear-cutting and road construction on soil erosion by landslides in the western Cascade Range, Oregon. Geology 1975, 3, 393. [Google Scholar]
- Arca, D.; Kutoğlu, H.Ş.; Becek, K. Landslide susceptibility mapping in an area of underground mining using the multicriteria decision analysis method. Environ. Monit. Assess. 2018, 190, 725. [Google Scholar] [CrossRef] [Green Version]
- Borga, M.; Tonelli, F.; Fontana, G.D.; Cazorzi, F. Evaluating the influence of forest roads on shallow landsliding. Ecol. Model. 2005, 187, 85–98. [Google Scholar] [CrossRef]
- Haigh, M.J.; Rawat, J.; Rawat, M.; Bartarya, S.; Rai, S. Interactions between forest and landslide activity along new highways in the Kumaun Himalaya. For. Ecol. Manag. 1995, 78, 173–189. [Google Scholar] [CrossRef]
- Fransen, P.J.B.; Phillips, C.J.; Fahey, B.D. Forest road erosion in New Zealand: Overview. Earth Surf. Process. Landforms 2001, 26, 165–174. [Google Scholar]
- Anderson, M.G. Road-cut slope topography and stability relationships in St Lucia, West Indies. Appl. Geogr. 1983, 3, 105–114. [Google Scholar] [CrossRef]
- Sidle, R.C.; Pearce, A.J.; O’Loughlin, C.L. Hillslope Stability and Land Use; American Geophysical Union (AGU): Washington, DC, USA, 1985. [Google Scholar]
- Douglas, I. Natural and man-made erosion in the humid tropics of Australia, Malaysia and Singapore. Inter. Assoc. Sci. Hydrol. 1967, 75, 17–30. [Google Scholar]
- Keefer, D.K. Landslides caused by earthquakes. Geol. Soc. Am. Bull. 1984, 95, 406–421. [Google Scholar] [CrossRef]
- Dai, F.; Xu, C.; Yao, X.; Xu, L.; Tu, X.; Gong, Q. Spatial distribution of landslides triggered by the 2008 Ms 8.0 Wenchuan earthquake, China. J. Asian Earth Sci. 2011, 40, 883–895. [Google Scholar] [CrossRef]
- Parker, R.N.; Densmore, A.L.; Rosser, N.J.; De Michele, M.; Li, Y.; Huang, R.; Whadcoat, S.; Petley, D.N. Mass wasting triggered by the 2008 Wenchuan earthquake is greater than orogenic growth. Nat. Geosci. 2011, 4, 449–452. [Google Scholar] [CrossRef] [Green Version]
- Zhao, B.; Wang, Y.-S.; Luo, Y.-H.; Li, J.; Zhang, X.; Shen, T. Landslides and dam damage resulting from the Jiuzhaigou earthquake (8 August 2017), Sichuan, China. R. Soc. Open Sci. 2018, 5, 171418. [Google Scholar] [CrossRef] [Green Version]
- Iverson, R.M. Landslide triggering by rain infiltration. Water Resour. Res. 2000, 36, 1897–1910. [Google Scholar] [CrossRef] [Green Version]
- Saito, H.; Nakayama, D.; Matsuyama, H. Relationship between the initiation of a shallow landslide and rainfall intensity—duration thresholds in Japan. Geomorphology 2010, 118, 167–175. [Google Scholar] [CrossRef]
- Hong, Y.; Hiura, H.; Shino, K.; Sassa, K.; Suemine, A.; Fukuoka, H.; Wang, G. The influence of intense rainfall on the activity of large-scale crystalline schist landslides in Shikoku Island, Japan. Landslides 2005, 2, 97–105. [Google Scholar] [CrossRef]
- Ibsen, M.-L.; Casagli, N. Rainfall patterns and related landslide incidence in the Porretta-Vergato region, Italy. Landslides 2004, 1, 143–150. [Google Scholar] [CrossRef]
- Crosta, G.B.; Frattini, P. Rainfall-induced landslides and debris flows. Hydrol. Process. 2008, 22, 473–477. [Google Scholar] [CrossRef]
- Larsen, M.C.; Wieczorek, G.F.; Latrubesse, E. Geomorphic effects of large debris flows and flash floods, northern Venezuela, 1999. Zeitschrift für Geomorphologie Neue Folge, Supplementband 2006, 145, 147–175. [Google Scholar]
- Larsen, I.J.; Montgomery, D.R. Landslide erosion coupled to tectonics and river incision. Nat. Geosci. 2012, 5, 468–473. [Google Scholar] [CrossRef]
- Guzzetti, F.; Carrara, A.; Cardinali, M.; Reichenbach, P. Landslide hazard evaluation: A review of current techniques and their application in a multi-scale study, Central Italy. Geomorphology 1999, 31, 181–216. [Google Scholar] [CrossRef]
- Pourghasemi, H.R.; Yansari, Z.T.; Panagos, P.; Pradhan, B. Analysis and evaluation of landslide susceptibility: a review on articles published during 2005–2016 (periods of 2005–2012 and 2013–2016). Arab. J. Geosci. 2018, 11, 193. [Google Scholar] [CrossRef]
- Dahal, R.K.; Hasegawa, S.; Nonomura, A.; Yamanaka, M.; Masuda, T.; Nishino, K. GIS-based weights-of-evidence modelling of rainfall-induced landslides in small catchments for landslide susceptibility mapping. Environmen. Geol. 2008, 54, 311–324. [Google Scholar] [CrossRef]
- Hjort, J.; Luoto, M. Statistical Methods for Geomorphic Distribution Modeling. In Treatise on Geomorphology: Quantitative Modeling of Geomorphology; Shroder, J., Ed.; Academic Press: Amsterdam, The Netherlands, 2013; pp. 59–73. [Google Scholar]
- Canli, E.; Thiebes, B.; Petschko, H.; Glade, T. Comparing physically-based and statistical landslide susceptibility model outputs-a case study from Lower Austria. In Proceedings of the EGU General Assembly Conference, Vienna, Austria, 12–17 April 2015. [Google Scholar]
- Van Westen, C.J.; Castellanos, E.; Kuriakose, S.L. Spatial data for landslide susceptibility, hazard, and vulnerability assessment: An overview. Eng. Geol. 2008, 102, 112–131. [Google Scholar] [CrossRef]
- Trigila, A.; Iadanza, C.; Esposito, C.; Scarascia-Mugnozza, G. Comparison of Logistic Regression and Random Forests techniques for shallow landslide susceptibility assessment in Giampilieri (NE Sicily, Italy). Geomorphology 2015, 249, 119–136. [Google Scholar] [CrossRef]
- Park, S.; Kim, J. Landslide Susceptibility Mapping Based on Random Forest and Boosted Regression Tree Models, and a Comparison of Their Performance. Appl. Sci. 2019, 9, 942. [Google Scholar] [CrossRef] [Green Version]
- Pradhan, B.; Buchroithner, M.F. Comparison and Validation of Landslide Susceptibility Maps Using an Artificial Neural Network Model for Three Test Areas in Malaysia. Environ. Eng. Geosci. 2010, 16, 107–126. [Google Scholar] [CrossRef]
- Park, I.; Lee, S. Spatial prediction of landslide susceptibility using a decision tree approach: a case study of the Pyeongchang area, Korea. Int. J. Remote. Sens. 2014, 35, 6089–6112. [Google Scholar] [CrossRef]
- Pham, B.T.; Pradhan, B.; Bui, D.T.; Prakash, I.; Dholakia, M. A comparative study of different machine learning methods for landslide susceptibility assessment: A case study of Uttarakhand area (India). Environ. Model. Softw. 2016, 84, 240–250. [Google Scholar] [CrossRef]
- Peng, L.; Niu, R.; Huang, B.; Wu, X.; Zhao, Y.; Ye, R. Landslide susceptibility mapping based on rough set theory and support vector machines: A case of the Three Gorges area, China. Geomorphology 2014, 204, 287–301. [Google Scholar] [CrossRef]
- Catani, F.; Lagomarsino, D.; Segoni, S.; Tofani, V. Landslide susceptibility estimation by random forests technique: sensitivity and scaling issues. Nat. Hazards Earth Syst. Sci. 2013, 13, 2815–2831. [Google Scholar] [CrossRef] [Green Version]
- Lagomarsino, D.; Tofani, V.; Segoni, S.; Catani, F.; Casagli, N. A Tool for Classification and Regression Using Random Forest Methodology: Applications to Landslide Susceptibility Mapping and Soil Thickness Modeling. Environ. Model. Assess. 2017, 22, 201–214. [Google Scholar] [CrossRef]
- Chen, W.; Sun, Z.; Han, J. Landslide Susceptibility Modeling Using Integrated Ensemble Weights of Evidence with Logistic Regression and Random Forest Models. Appl. Sci. 2019, 9, 171. [Google Scholar] [CrossRef] [Green Version]
- Kim, J.-C.; Lee, S.; Jung, H.-S.; Lee, S. Landslide susceptibility mapping using random forest and boosted tree models in Pyeong-Chang, Korea. Geocarto Int. 2018, 33, 1000–1015. [Google Scholar] [CrossRef]
- Pourghasemi, H.R.; Kerle, N. Random forests and evidential belief function-based landslide susceptibility assessment in Western Mazandaran Province, Iran. Environ. Earth Sci. 2016, 75, 23. [Google Scholar] [CrossRef]
- Zhang, K.; Wu, X.; Niu, R.; Yang, K.; Zhao, L. The assessment of landslide susceptibility mapping using random forest and decision tree methods in the Three Gorges Reservoir area, China. Environ. Earth Sci. 2017, 76. [Google Scholar] [CrossRef]
- Taalab, K.; Cheng, T.; Zhang, Y. Mapping landslide susceptibility and types using Random Forest. Big Earth Data 2018, 2, 159–178. [Google Scholar] [CrossRef]
- Salford Systems Ltd. Salford Predictive Modeller: Introduction to Random Forests. Available online: https://www.minitab.com/uploadedFiles/Content/Products/SPM/IntroRF.pdf (accessed on 9 September 2019).
- Goetz, J.; Brenning, A.; Petschko, H.; Leopold, P. Evaluating machine learning and statistical prediction techniques for landslide susceptibility modeling. Comput. Geosci. 2015, 81, 1–11. [Google Scholar] [CrossRef]
- Sevgen, E.; Kocaman, S.; Nefeslioglu, H.A.; Gokceoglu, C. A Novel Performance Assessment Approach using Photogrammetric Techniques for Landslide Susceptibility Mapping with Logistic Regression, ANN and Random Forest. Sensors 2019, 19, 3940. [Google Scholar] [CrossRef] [PubMed] [Green Version]
- Vorpahl, P.; Elsenbeer, H.; Märker, M.; Schröder, B.; Maerker, M. How can statistical models help to determine driving factors of landslides? Ecol. Model. 2012, 239, 27–39. [Google Scholar] [CrossRef]
- Chen, W.; Xie, X.; Wang, J.; Pradhan, B.; Hong, H.; Bui, D.T.; Duan, Z.; Ma, J. A comparative study of logistic model tree, random forest, and classification and regression tree models for spatial prediction of landslide susceptibility. Catena 2017, 151, 147–160. [Google Scholar] [CrossRef] [Green Version]
- Dou, J.; Yamagishi, H.; Pourghasemi, H.R.; Yunus, A.P.; Song, X.; Xu, Y.; Zhu, Z. An integrated artificial neural network model for the landslide susceptibility assessment of Osado Island, Japan. Nat. Hazards 2015, 78, 1749–1776. [Google Scholar] [CrossRef]
- Ada, M.; San, B.T. Comparison of machine-learning techniques for landslide susceptibility mapping using two-level random sampling (2LRS) in Alakir catchment area, Antalya, Turkey. Nat Hazards 2018, 90, 237–263. [Google Scholar] [CrossRef]
- Dou, J.; Yunus, A.P.; Bui, D.T.; Merghadi, A.; Sahana, M.; Zhu, Z.; Chen, C.-W.; Khosravi, K.; Yang, Y.; Pham, B.T. Assessment of advanced random forest and decision tree algorithms for modeling rainfall-induced landslide susceptibility in the Izu-Oshima Volcanic Island, Japan. Sci. Total. Environ. 2019, 662, 332–346. [Google Scholar] [CrossRef]
- Reichenbach, P.; Rossi, M.; Malamud, B.D.; Mihir, M.; Guzzetti, F. A review of statistically-based landslide susceptibility models. Earth-Sci. Rev. 2018, 180, 60–91. [Google Scholar] [CrossRef]
- Xiao, L.; Zhang, Y.; Peng, G. Landslide Susceptibility Assessment Using Integrated Deep Learning Algorithm along the China-Nepal Highway. Sensors 2018, 18, 4436. [Google Scholar] [CrossRef] [Green Version]
- Schmaltz, E.M.; Steger, S.; Glade, T. The influence of forest cover on landslide occurrence explored with spatio-temporal information. Geomorphology 2017, 290, 250–264. [Google Scholar] [CrossRef]
- Shirvani, Z.; Abdi, O.; Buchroithner, M.F.; Pradhan, B. Analysing Spatial and Statistical Dependencies of Deforestation Affected by Residential Growth: Gorganrood Basin, Northeast Iran. Land Degrad. Dev. 2017, 28, 2176–2190. [Google Scholar] [CrossRef]
- Abdi, O.; Shirvani, Z.; Buchroithner, M.F. Visualization and quantification of significant anthropogenic drivers influencing rangeland degradation trends using Landsat imagery and GIS spatial dependence models: A case study in Northeast Iran. J. Geogra. Sci. 2018, 28, 1933–1952. [Google Scholar] [CrossRef]
- Abdi, O.; Kamkar, B.; Shirvani, Z.; Teixeira da Silva, J.A.; Buchroithner, M.F. Spatial-statistical analysis of factors determining forest fires: a case study from Golestan, Northeast Iran. Geomat. Nat. Hazards Risk 2018, 9, 267–280. [Google Scholar] [CrossRef] [Green Version]
- Abdi, O. Climate-Triggered Insect Defoliators and Forest Fires Using Multitemporal Landsat and TerraClimate Data in NE Iran: An Application of GEOBIA TreeNet and Panel Data Analysis. Sensors 2019, 19, 3965. [Google Scholar] [CrossRef] [PubMed] [Green Version]
- Mirzaei, G.; Soltani, A.; Soltani, M.; Darabi, M. An integrated data-mining and multi-criteria decision-making approach for hazard-based object ranking with a focus on landslides and floods. Environ. Earth Sci. 2018, 77, 581. [Google Scholar] [CrossRef]
- Jarjani, A.; Akbari, H.; Hosseini, S.A.; Abdi, O. Investigation of Landslide Ranger Zoning using Analytical Hierarchy Process in GIS Environment (Case Study: Azadshahr Kohmian Forestry Design). J. Watershed Manag. Res. 2018, 10, 197–207. [Google Scholar]
- Kornejady, A.; Ownegh, M.; Rahmati, O.; Bahremand, A. Landslide susceptibility assessment using three bivariate models considering the new topo-hydrological factor: HAND. Geocarto Int. 2018, 33, 1155–1185. [Google Scholar] [CrossRef]
- Shirvani, Z.; Abdi, O.; Buchroithner, M. A Synergetic Analysis of Sentinel-1 and -2 for Mapping Historical Landslides Using Object-Oriented Random Forest in the Hyrcanian Forests. Remote Sens. 2019, 11, 2300. [Google Scholar] [CrossRef] [Green Version]
- Mousavinejad, S.H.; Habashi, H.; Kiani, F.; Shataee, S.; Abdi, O. Evaluation of soil erosion using imagery SPOT5 satellite in Chehel chi catchment of Golestan Province. Wood Forest Sci. Technol. 2017, 24, 73–86. [Google Scholar]
- Abdi, O.; Shirvani, Z.; Buchroithner, M.F. Spatiotemporal drought evaluation of Hyrcanian deciduous forests and semi-steppe rangelands using moderate resolution imaging spectroradiometer time series in Northeast Iran. Land Degrad. Dev. 2018, 29, 2525–2541. [Google Scholar] [CrossRef]
- Abdi, O.; Shirvani, Z.; Buchroithner, M.F. Forest drought-induced diversity of Hyrcanian individual-tree mortality affected by meteorological and hydrological droughts by analyzing moderate resolution imaging spectroradiometer products and spatial autoregressive models over northeast Iran. Agric. For. Meteorol. 2019, 275, 265–276. [Google Scholar] [CrossRef]
- Mohammady, M.; Pourghasemi, H.R.; Pradhan, B. Landslide susceptibility mapping at Golestan Province, Iran: A comparison between frequency ratio, Dempster–Shafer, and weights-of-evidence models. J. Asian Earth Sci. 2012, 61, 221–236. [Google Scholar] [CrossRef]
- Pourghasemi, H.R.; Rossi, M. Landslide susceptibility modeling in a landslide prone area in Mazandarn Province, north of Iran: a comparison between GLM, GAM, MARS, and M-AHP methods. Theor. Appl. Climatol. 2017, 130, 609–633. [Google Scholar] [CrossRef]
- Arabameri, A.; Pradhan, B.; Rezaei, K.; Lee, S.; Sohrabi, M. An ensemble model for landslide susceptibility mapping in a forested area. Geocarto Int. 2019, 77, 1–26. [Google Scholar] [CrossRef]
- Nohani, E.; Moharrami, M.; Sharafi, S.; Khosravi, K.; Pradhan, B.; Pham, B.T.; Lee, S.; M. Melesse, A. Landslide Susceptibility Mapping Using Different GIS-Based Bivariate Models. Water 2019, 11, 1402. [Google Scholar] [CrossRef] [Green Version]
- Akhani, H.; Ziegler, H. Photosynthetic pathways and habitats of grasses in Golestan National Park (NE Iran), with an emphasis on the C4-grass dominated rock communities. Phytocoenologia 2002, 32, 455–501. [Google Scholar] [CrossRef]
- Talebi, K.S.; Sajedi, T.; Pourhashemi, M. Forests of Iran; Springer Science and Business Media LLC: Berlin/Heidelberg, Germany, 2014. [Google Scholar]
- Shirvani, Z.; Abdi, O.; Buchroithner, M.F. A New Analysis Approach for Long-Term Variations of Forest Loss, Fragmentation and Degradation Resulting from Road-Network Expansion Using Landsat Time-Series and OBIA. Land Degrad. Dev. 2019. [Google Scholar] [CrossRef] [Green Version]
- Iranian Landslide Working Party (ILWP). Iranian landslides list; Forest, Rangeland and Watershed Association: Tehran, Iran, 2007. [Google Scholar]
- Navulur, K. Multispectral Image Analysis Using the Object-Oriented Paradigm; CRC Press/Taylor & Francis: Boca Raton, FL, USA, 2007; ISBN 1420043064. [Google Scholar]
- Hay, G.J.; Castilla, G. Geographic Object-Based Image Analysis (GEOBIA): A new name for a new discipline; Springer Science and Business Media LLC: Berlin/Heidelberg, Germany, 2008; pp. 75–89. [Google Scholar]
- Earth Resources Observation and Science (EROS) Center. Shuttle Radar Topography Mission (SRTM) 1 Arc-Second Global. Available online: https://www.usgs.gov/centers/eros (accessed on 18 July 2019).
- Abella, E.A.C.; Van Westen, C.J. Generation of a landslide risk index map for Cuba using spatial multi-criteria evaluation. Landslides 2007, 4, 311–325. [Google Scholar] [CrossRef] [Green Version]
- Dikau, R. Landslide Recognition: Identification, Movement and Causes; Wiley: Chichester, UK, 1996; ISBN 0471964778. [Google Scholar]
- Waltham, A.C. Foundations of Engineering Geology; Blackie Academic & Professional Publishing: Glasgow, UK, 1994. [Google Scholar]
- Oyana, T.J.; Margai, F. Spatial Analysis: Statistics, Visualization, and Computational Methods; CRC Press/Taylor & Francis: Boca Raton, FL, USA, 2015; ISBN 0429069367. [Google Scholar]
- ESRI. How IDW works—Help | ArcGIS for Desktop. Available online: http://desktop.arcgis.com/en/arcmap/10.3/tools/3d-analyst-toolbox/how-idw-works.htm (accessed on 14 August 2019).
- Aguilar, F.J.; Nemmaoui, A.; Aguilar, M.A.; Chourak, M.; Zarhloule, Y.; Lorca, A.G. A Quantitative Assessment of Forest Cover Change in the Moulouya River Watershed (Morocco) by the Integration of a Subpixel-Based and Object-Based Analysis of Landsat Data. Forest 2016, 7, 23. [Google Scholar] [CrossRef]
- Jiang, Z.; Huete, A.R.; Didan, K.; Miura, T. Development of a two-band enhanced vegetation index without a blue band. Remote. Sens. Environ. 2008, 112, 3833–3845. [Google Scholar] [CrossRef]
- Gómez, D.; Biging, G.; Montero, J. Accuracy statistics for judging soft classification. Int. J. Remote Sens. 2008, 29, 693–709. [Google Scholar] [CrossRef]
- McGarigal, K.; Marks, B.J. FRAGSTATS: Spatial Pattern Analysis Program for Quantifying Landscape Structure; USDA Forest Service: WA, USA, 1995; Volume 351, p. 122. [CrossRef]
- Breiman, L. Random forests. Mach. Learn. 2001, 45, 5–32. [Google Scholar] [CrossRef] [Green Version]
- Liaw, A.; Wiener, M. Classification and regression by randomforest. R News 2002, 2, 18–22. [Google Scholar]
- Cutler, A.; Cutler, D.R.; Stevens, J.R. Random Forests. In Ensemble Machine Learning; Zhang, C., Ma, Y., Eds.; Springer US: Boston, MA, USA, 2012; pp. 157–175. ISBN 978-1-4419-9325-0. [Google Scholar]
- Witten, I.H.; Frank, E.; Hall, M.A. Data Mining: Practical Machine Learning Tools and Techniques, 3rd ed.; Morgan Kaufmann: Burlington, MA, USA, 2011; ISBN 978-0-12-374856-0. [Google Scholar]
- Fawcett, T. An introduction to ROC analysis. Pattern Recognit. Lett. 2006, 27, 861–874. [Google Scholar] [CrossRef]
- Louppe, G.; Wehenkel, L.; Sutera, A.; Geurts, P. Understanding variable importances in forests of randomized trees. In Proceedings of the Advances in Neural Information Processing Systems 26. 27th annual conference on neural information processing systems (NIPS 2013), Lake Tahoe, NV, USA, 5–10 December 2013; Burges, C.J.C., Bottou, L., Welling, M., Ghahramani, Z., Weinberger, K.Q., Eds.; 2013; pp. 431–439. [Google Scholar]
- Strobl, C.; Boulesteix, A.-L.; Zeileis, A.; Hothorn, T. Bias in random forest variable importance measures: Illustrations, sources and a solution. BMC Bioinform. 2007, 8, 25. [Google Scholar] [CrossRef] [PubMed] [Green Version]
- Hutchinson, M. A new procedure for gridding elevation and stream line data with automatic removal of spurious pits. J. Hydrol. 1989, 106, 211–232. [Google Scholar] [CrossRef]
- Lee, C.F.; Li, J.; Xu, Z.W.; Dai, F.C. Assessment of landslide susceptibility on the natural terrain of Lantau Island, Hong Kong. Environ. Earth Sci. 2001, 40, 381–391. [Google Scholar] [CrossRef]
- Yesilnacar, E.; Topal, T. Landslide susceptibility mapping: A comparison of logistic regression and neural networks methods in a medium scale study, Hendek region (Turkey). Eng. Geol. 2005, 79, 251–266. [Google Scholar] [CrossRef]
- Pradhan, B.; Oh, H.-J.; Buchroithner, M. Weights-of-evidence model applied to landslide susceptibility mapping in a tropical hilly area. Geomat. Nat. Hazards Risk 2010, 1, 199–223. [Google Scholar] [CrossRef]
- Yeon, Y.-K.; Han, J.-G.; Ryu, K.H. Landslide susceptibility mapping in Injae, Korea, using a decision tree. Eng. Geol. 2010, 116, 274–283. [Google Scholar] [CrossRef]
- Zhu, A.-X.; Wang, R.; Qiao, J.; Qin, C.-Z.; Chen, Y.; Liu, J.; Du, F.; Lin, Y.; Zhu, T. An expert knowledge-based approach to landslide susceptibility mapping using GIS and fuzzy logic. Geomorphology 2014, 214, 128–138. [Google Scholar] [CrossRef]
- Pham, B.T.; Bui, D.T.; Dholakia, M.B.; Prakash, I.; Pham, H.V.; Mehmood, K.; Le, H.Q. A novel ensemble classifier of rotation forest and Naïve Bayer for landslide susceptibility assessment at the Luc Yen district, Yen Bai Province (Viet Nam) using GIS. Geomatics. Nat. Hazards Risk 2017, 8, 649–671. [Google Scholar] [CrossRef] [Green Version]
- Chen, W.; Shirzadi, A.; Shahabi, H.; Bin Ahmad, B.; Zhang, S.; Hong, H.; Zhang, N. A novel hybrid artificial intelligence approach based on the rotation forest ensemble and naïve Bayes tree classifiers for a landslide susceptibility assessment in Langao County, China. Geomat. Nat. Hazards Risk 2017, 8, 1955–1977. [Google Scholar] [CrossRef] [Green Version]
- Chen, W.; Pourghasemi, H.R.; Naghibi, S.A. A comparative study of landslide susceptibility maps produced using support vector machine with different kernel functions and entropy data mining models in China. Bull. Eng. Geol. Environ. 2018, 77, 647–664. [Google Scholar] [CrossRef]
- Zhou, C.; Yin, K.; Cao, Y.; Ahmed, B.; Li, Y.; Catani, F.; Pourghasemi, H.R. Landslide susceptibility modeling applying machine learning methods: A case study from Longju in the Three Gorges Reservoir area, China. Comput. Geosci. 2018, 112, 23–37. [Google Scholar] [CrossRef] [Green Version]
- Nguyen, V.V.; Pham, B.T.; Vu, B.T.; Prakash, I.; Jha, S.; Shahabi, H.; Shirzadi, A.; Ba, D.N.; Kumar, R.; Chatterjee, J.M.; et al. Hybrid Machine Learning Approaches for Landslide Susceptibility Modeling. Forest 2019, 10, 157. [Google Scholar] [CrossRef] [Green Version]
- He, H.; Hu, D.; Sun, Q.; Zhu, L.; Liu, Y. A Landslide Susceptibility Assessment Method Based on GIS Technology and an AHP-Weighted Information Content Method: A Case Study of Southern Anhui, China. ISPRS Int. J. Geo-Inf. 2019, 8, 266. [Google Scholar] [CrossRef] [Green Version]
- Burrough, P.A.; McDonnell, R.A. Principles of Geographical Information Systems; Oxford University Press: Oxford, UK, 1998. [Google Scholar]
- Moore, I.D.; Grayson, R.B.; Ladson, A.R. Digital terrain modelling: A review of hydrological, geomorphological, and biological applications. Hydrol. Process. 1991, 5, 3–30. [Google Scholar] [CrossRef]
- Zevenbergen, L.W.; Thorne, C.R. Quantitative analysis of land surface topography. Earth Surf. Process. Landforms 1987, 12, 47–56. [Google Scholar] [CrossRef]
- Shary, P.A. Land surface in gravity points classification by a complete system of curvatures. Math. Geol. 1995, 27, 373–390. [Google Scholar] [CrossRef]
- Claps, P.; Fiorentino, M.; Oliveto, G. Informational entropy of fractal river networks. J. Hydrol. 1994, 187, 145–156. [Google Scholar] [CrossRef] [Green Version]
- Wilson, J.P.; Gallant, J.C. Terrain Analysis: Principles and Applications; Wiley: New York, NY, USA, 2000; ISBN 0471321885. [Google Scholar]
- Weiss, A. Topographic position and landforms analysis. In Proceedings of the ESRI User Conference 2001, San Diego, CA, USA, 9–13 July 2001; Volume 200. [Google Scholar]
- Riley, S.J.; DeGloria, S.D.; Elliot, R. Index that quantifies topographic heterogeneity. Int. J. Sci. 1999, 5, 23–27. [Google Scholar]
- ESRI. Understanding Euclidean distance analysis—Help | ArcGIS for Desktop. Available online: http://desktop.arcgis.com/en/arcmap/10.3/tools/spatial-analyst-toolbox/understanding-euclidean-distance-analysis.htm (accessed on 20 August 2019).
- ESRI. Kernel Density—Help | ArcGIS for Desktop. Available online: http://desktop.arcgis.com/en/arcmap/10.3/tools/spatial-analyst-toolbox/kernel-density.htm (accessed on 21 August 2019).
- Moore, I.D.; Burch, G.J. Sediment Transport Capacity of Sheet and Rill Flow: Application of Unit Stream Power Theory. Water Resour. Res. 1986, 22, 1350–1360. [Google Scholar] [CrossRef]
- Moore, I.D.; Wilson, J.P. Length-slope factors for the Revised Universal Soil Loss Equation: Simplified method of estimation. J. Soil Water Conserv. 1992, 47, 423–428. [Google Scholar]
- Pham, B.T.; Bui, D.T.; Prakash, I.; Dholakia, M. Hybrid integration of Multilayer Perceptron Neural Networks and machine learning ensembles for landslide susceptibility assessment at Himalayan area (India) using GIS. Catena 2017, 149, 52–63. [Google Scholar] [CrossRef]
- Kadavi, P.R.; Lee, C.-W.; Lee, S. Application of Ensemble-Based Machine Learning Models to Landslide Susceptibility Mapping. Remote Sens. 2018, 10, 1252. [Google Scholar] [CrossRef] [Green Version]
- Pourghasemi, H.R.; Gayen, A.; Park, S.; Lee, C.-W.; Lee, S. Assessment of Landslide-Prone Areas and Their Zonation Using Logistic Regression, LogitBoost, and NaïveBayes Machine-Learning Algorithms. Sustainability 2018, 10, 3697. [Google Scholar] [CrossRef] [Green Version]
- Wang, Q.; Li, W.; Chen, W.; Bai, H. GIS-based assessment of landslide susceptibility using certainty factor and index of entropy models for the Qianyang County of Baoji city, China. J. Earth Syst. Sci. 2015, 124, 1399–1415. [Google Scholar] [CrossRef]
- Saputra, A.; Gomez, C.; Hadmoko, D.S.; Sartohadi, J. Coseismic landslide susceptibility assessment using geographic information system. Geoenviron. Disasters 2016, 3, 77. [Google Scholar] [CrossRef] [Green Version]
- Hong, H.; Liu, J.; Bui, D.T.; Pradhan, B.; Acharya, T.D.; Pham, B.T.; Zhu, A.-X.; Chen, W.; Bin Ahmad, B. Landslide susceptibility mapping using J48 Decision Tree with AdaBoost, Bagging and Rotation Forest ensembles in the Guangchang area (China). Catena 2018, 163, 399–413. [Google Scholar] [CrossRef]
- Gomi, T.; Sidle, R.C. Bed load transport in managed steep-gradient headwater streams of southeastern Alaska. Water Resour. Res. 2003, 39, 77. [Google Scholar] [CrossRef] [Green Version]
- Constantine, J.A.; Pasternack, G.B.; Johnson, M.L. Logging effects on sediment flux observed in a pollen-based record of overbank deposition in a northern California catchment. Earth Surf. Process. Landforms 2005, 30, 813–821. [Google Scholar] [CrossRef]
- Luo, X.; Lin, F.; Zhu, S.; Yu, M.; Zhang, Z.; Meng, L.; Peng, J. Mine landslide susceptibility assessment using IVM, ANN and SVM models considering the contribution of affecting factors. PLoS ONE 2019, 14, e0215134. [Google Scholar] [CrossRef] [PubMed]
- Jamal, M.; Mandal, S. Monitoring forest dynamics and landslide susceptibility in Mechi–Balason interfluves of Darjiling Himalaya, West Bengal using forest canopy density model (FCDM) and Landslide Susceptibility Index model (LSIM). Model. Earth Syst. Environ. 2016, 2, 1–17. [Google Scholar] [CrossRef] [Green Version]
- Meneses, B.M.; Pereira, S.; Reis, E. Effects of different land use and land cover data on the landslide susceptibility zonation of road networks. Nat. Hazards Earth Syst. Sci. 2019, 19, 471–487. [Google Scholar] [CrossRef] [Green Version]
- Gattinoni, P.; Scesi, L. Lanslide hydrogeological susceptibility of Maierato (Vibo Valentia, Southern Italy). Nat. Hazards 2013, 66, 629–648. [Google Scholar] [CrossRef]
Figure 1.
Location of the study areas in the Hyrcanian ecoregion in NE Iran: the Golestan National Park as a “protected forest” (a); and disturbed forests by mining, logging, and road building as a “non-protected forest” (b). Landslide events I were collected from different resources in the current research and the landslide events II were adopted from Shirvani et al. [72].

Figure 2.
The process of discriminating forests from non-forests using object-based nearest neighbor and rule-based classifications by utilizing CORONA images/aerial photos of 1970 and Landsat 8 of 2016 over the protected and non-protected forests in NE, Iran (after Shirvani et al. [82]). Abbreviations: stdDev.: Standard deviation; Max. diff.: Maximum difference; GVI: Green Vegetation Index; EVI2: Enhanced vegetation index2; GLCM: Gray-level co-occurrence matrix.

Figure 3.
The optimal number of trees and the number of variables for splitting in each tree of the random forest based on the minimum misclassification error for mapping landslide susceptibility in the protected forest (a) and non-protected forest (b); the area under the ROC curve obtained from the out-of-bag error for testing the performance of random forest for mapping landslide susceptibility in the protected forest (c) and non-protected forest (d) in NE Iran.

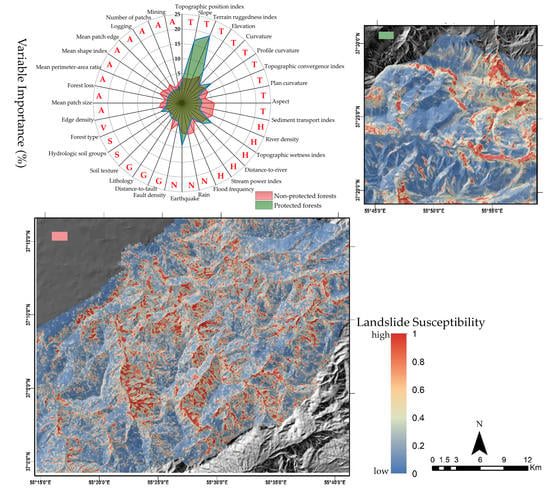
Figure 4.
Comparison of the variable’s importance in controlling the susceptibility of protected forest (a) and non-protected forest (b) to landslides in NE Iran. While topographic, hydrologic, and natural triggering factors were dominant variables in the protected forest, the anthropogenic triggering factors recorded higher importance values than the natural triggering factors with a total value close to the importance of topographic and hydrologic variables in the non-protected forest in NE Iran.

Figure 5.
The landslide susceptibility maps of the protected forest (a) and the non-protected forest (b) in NE Iran. The maps show that the majority of high susceptibility values of landslide were distributed in the eastern parts of the protected forest (a) occupied by highly and extremely rugged or steep surfaces, while the high values of landslide susceptibility were distributed throughout the non-protected forest (b), particularly where anthropogenic and natural triggering factors interacted with the hydrologic and topographic variables.

Figure 6.
The layers of the top influential factors that control landslide susceptibility in the protected forest in NE Iran: terrain ruggedness index (TRI) (a); slope (b); earthquake (EQ) (c); elevation (Elev.) (d); topographic wetness index (TWI) (e); and profile curvature (Profile Curv.) (f).
Figure 6.
The layers of the top influential factors that control landslide susceptibility in the protected forest in NE Iran: terrain ruggedness index (TRI) (a); slope (b); earthquake (EQ) (c); elevation (Elev.) (d); topographic wetness index (TWI) (e); and profile curvature (Profile Curv.) (f).

Figure 7.
The layers of the top influential factors that control landslide susceptibility in the non-protected forest in NE Iran: river density (a); aspect (b); elevation (Elev.) (c); rainfall (d); sediment transport index (STI) (e); and flood (f).
Figure 7.
The layers of the top influential factors that control landslide susceptibility in the non-protected forest in NE Iran: river density (a); aspect (b); elevation (Elev.) (c); rainfall (d); sediment transport index (STI) (e); and flood (f).

Figure 8.
The top influential anthropogenic triggering factors for mapping landslide susceptibility in the non-protected forest, NE Iran: the edge density and mean shape index indicating the forest fragmentation induced by road-network expansion and forest conversion (a,c); and the aggregation of logging volumes (b) from 1970 to 2016.

Table 1.
Conditioning factors for mapping landslide susceptibility used in NE Iran.
| Category | Variables | Description | Sources |
|---|---|---|---|
| Conditioning factors of landslide | |||
| Topographic | Elevation | The average of elevation (m) [103] in an object. | [42,47,50,52,57,58,104,105,106,107,108,109,110,111,112,113,114] |
| Slope (°) | The average of maximum changes in elevation value [115] within each object. | ||
| Aspect | The average of the slope direction [115] within each object. | ||
| Curvature | The average rate of changing in slope or aspect [116] within an object. | ||
| Plan curvature | The average values of the position of the curvature surface to the direction of slope perpendicularly within each object. The convex position indicates by positive values and concave position by negative values [117]. | ||
| Profile curvature | The average of the amount of the curvature surface in the direction of maximum slope within each object. The convex surface indicates by negative values and concave surface by positive values [118]. | ||
| Terrain convergence index (TCI) | TCI measures the intensity of the divergence or convergence within an object. Divergent surface indicates by positive values while convergent surface indicates by negative values [119]. θ: average degree between the direction of adjacent cells and the direction to the central cell. | ||
| Topographic position index (TPI) | TPI measures the difference between the elevation of the central point () against the average elevation () in a specific radius (R) [120,121]. Positive values: higher position of the central points Negative values: lower position of the central points | ||
| Terrain ruggedness index (TRI) | TRI measures the heterogeneity in the landscape [122]. max: maximum values of elevation within a 3 × 3 cell window min: minimum values of elevation within a 3 × 3 cell window. | ||
| Hydrologic | Distance to river | Nearest distance to river based on Euclidean distance [123]. | [42,50,52,61,76,104,105,106,108,109,110,111,112,113,114] |
| River density | Magnitude of river (m) per hectare [124] | ||
| Topographic wetness index (TWI) | TWI measures topographic dimension of hydrological processes [116]. Catchment area : Slope gradient (degree) [116,120]. | ||
| Stream power index (SPI) | SPI measures the erosive severity of a stream [116]. : The area of a catchment : Slope gradient (degree) | ||
| Sediment transport index (STI) | STI measures the erodability of a stream [125]. : The area of a catchment : Slope gradient (degree) [126]. | ||
| Geology | Lithology | Lithology units | [41,43,50,51,52,76,105,106,113,127] |
| Distance to faults | Nearest distance to the fault lines based on Euclidean distance [123]. | ||
| Fault density | Magnitude of fault (m) per hectare [124]. | ||
| Soil | Soil texture | Soil textures | [50,76,106,107] |
| Soil hydro group | Soil drainage | ||
| Vegetation | Forest type | Dominant tree species [50] within an object. | [42,50,107,128,129] |
Table 2.
Triggering factors for mapping landslide susceptibility used in NE Iran.
| Category | Variables | Description | Sources | |
|---|---|---|---|---|
| Triggering factors of landslide | ||||
| Natural triggering factors | Rainfall | Long-term regional average annual raining data (mm/y) for 30 years interpolated by kriging [74,90]. | [52,60,69,76,106,109,127,130] | |
| Earthquake | Long-term regional average of the magnitude of earthquakes (1970 to 2016) mapped by inverse distance weighting (IDW) interpolation method [91,131] | |||
| Flood frequency (FF) | FF measures the frequency of flood occurrence along the main rivers during last five decades within a specific catchment. : Length of a specific river (i) : The frequency of flood for the long-term : The area of the catchment | Current study | ||
| Anthropogenic triggering factors | Forest fragmentation | Patch density and size metrics [95] | Number of patches within an object () | Current study |
| Mean patch size within an object () Number of patches within an object : Total area of patches in an object | ||||
| Edge metrics [95] | Edge density within an object (ED) : Total edge of patches within an object : Total area of patches in an object | |||
| Mean patch edge within an object (MPE) Number of patches within an object : Total edge of patches within an object | ||||
| Shape metrics [95] | Mean shape index (MSI) within an object : Total edge of patches within an object : Total area of patches in an object | |||
| Mean perimeter-area ratio (MPAR) within an object ED: Edge density within an object Number of patches within an object | ||||
| Forest loss (FL) | : The time duration of each period and : The forest area at the beginning and end of each period [65]. | Current study | ||
| Logging | Total volume of logging (1966–2016) within an object | Current study | ||
| Mining | Total weight of mining (1966–2016) within an object | Current study | ||
Table 3.
The results of the accuracy assessment of landslide susceptibility mapping based on the influential variables that control the occurrence of the landslide in the protected and non-protected forests.
Table 3.
The results of the accuracy assessment of landslide susceptibility mapping based on the influential variables that control the occurrence of the landslide in the protected and non-protected forests.
| Metrics | Specificity (%) | Sensitivity (%) | Precision (%) | F1 Statistic (%) | Misclassification Rate (%) | AUROC 1 (%) | |
|---|---|---|---|---|---|---|---|
| Landslide susceptibility | PF 2 | 77.85 | 77.54 | 92.62 | 84.41 | 23.38 | 86.31 |
| NPF 3 | 73.02 | 74.56 | 73.37 | 73.96 | 26.21 | 81.77 |
1 AUROC: Area under the receiver operating characteristics; 2 PF: Protected forest; 3 NPF: Non-protected forest.
© 2020 by the author. Licensee MDPI, Basel, Switzerland. This article is an open access article distributed under the terms and conditions of the Creative Commons Attribution (CC BY) license (http://creativecommons.org/licenses/by/4.0/).
Share and Cite
MDPI and ACS Style
Shirvani, Z. A Holistic Analysis for Landslide Susceptibility Mapping Applying Geographic Object-Based Random Forest: A Comparison between Protected and Non-Protected Forests. Remote Sens. 2020, 12, 434. https://doi.org/10.3390/rs12030434
AMA Style
Shirvani Z. A Holistic Analysis for Landslide Susceptibility Mapping Applying Geographic Object-Based Random Forest: A Comparison between Protected and Non-Protected Forests. Remote Sensing. 2020; 12(3):434. https://doi.org/10.3390/rs12030434
Chicago/Turabian StyleShirvani, Zeinab. 2020. "A Holistic Analysis for Landslide Susceptibility Mapping Applying Geographic Object-Based Random Forest: A Comparison between Protected and Non-Protected Forests" Remote Sensing 12, no. 3: 434. https://doi.org/10.3390/rs12030434
Note that from the first issue of 2016, this journal uses article numbers instead of page numbers. See further details here.