Article

Arm Motion Classification Using Time-Series Analysis of the Spectrogram Frequency Envelopes

1
School of Information and Electronics, Beijing Institute of Technology, Beijing 100081, China
2
Center for Advanced Communications, Villanova University, Villanova, PA 19085, USA
*
Author to whom correspondence should be addressed.
Remote Sens. 2020, 12(3), 454; https://doi.org/10.3390/rs12030454
Submission received: 15 December 2019 / Revised: 20 January 2020 / Accepted: 23 January 2020 / Published: 1 February 2020
(This article belongs to the Special Issue Radar Remote Sensing on Life Activities)

Abstract

:
Hand and arm gesture recognition using radio frequency (RF) sensing modality proves valuable in man–machine interfaces and smart environments. In this paper, we use the time-series analysis method to accurately measure the similarity of the micro-Doppler (MD) signatures between the training and test data, thus providing improved gesture classification. We characterize the MD signatures by the maximum instantaneous Doppler frequencies depicted in the spectrograms. In particular, we apply two machine learning (ML) techniques, namely, the dynamic time warping (DTW) method and the long short-term memory (LSTM) network. Both methods take into account the values as well as the temporal evolution and characteristics of the time-series data. It is shown that the DTW method achieves high gesture classification rates and is robust to time misalignment.

Graphical Abstract

1. Introduction

Propelled by successes in discriminating between different human activities, radar has recently been employed for automatic hand gesture recognition for interactive intelligent devices [1,2,3,4,5,6]. This recognition proves important in contactless close-range hand-held or arm-worn devices, such as cell phones and watches. The most recent project on hand gesture recognition, Soli, by Google, monitors contactless interactions with radar embedded in a wrist band and is a good example of this emerging technology [3]. In general, automatic hand or arm gesture recognition, through the use of radio frequency (RF) sensors, is important for the smart environment. It is poised to make homes more user friendly and most efficient by identifying different motions for controlling instruments and household appliances. The same technology can greatly benefit the physically challenged, who might be wheelchair confined or bed-ridden. The goal is to enable these individuals to function independently.
Arm motions assume different kinematics than those of hands, especially in terms of speed and time duration. Compared to hand gestures, arm gesture recognition can be more suitable for contactless man–machine interactions with a longer range, e.g., in the case of commanding appliances, like a TV, from a distant couch. The large radar cross-sections of the arms, vis-a-vis hands, permit more remote interactive positions in an indoor setting. Further, the ability of using hand gestures for device control can sometimes be hindered by cognitive impairments such the Parkinson disease which induces strong hand tremors.
The nature and mechanism of arm motions are dictated by their elongated bone structure defined by the humerus, which extends from the shoulders to the elbows, and the radius and ulna that extend from the elbows to hands. Because of such structures, arm motions, excluding hands, can be accurately simulated by two connected rods. In this respect, the instantaneous Doppler frequencies corresponding to different points on the upper arm are closely related. The same can be said for the forearm. This is different from hand motions which involve different and flexible motions of the palm and the fingers, and it is certainly distinct from body motions which yield intricate micro-Doppler (MD) signatures [7,8,9,10,11,12,13,14,15].
Recent work in automatic arm motion recognition using the maximum instantaneous Doppler frequencies, i.e., the frequency envelope of the MD signature of the data spectrogram, as features followed by the nearest neighbor (NN) classifier provided classification rates reaching close to 97% [16]. It was shown that the feature vector consisting of the augmented positive frequency and negative frequency envelopes outperforms data driven automatic feature extraction, such as principal component analysis (PCA), and provides similar results to convolutional neural network (CNN). Since the NN classifier applies distance metrics to measure closeness of the test data to the training data, shuffling the envelope values of all test and training data in the same manner will not change the metric or the classification results. In this respect, the frequency envelope values, rather than the actual shape of the envelope, decide the classification performance.
In this paper, with a focus on improving the results in [17], we employ features that capture the MD signature envelope behavior as well as the evolution characteristics. The envelope represents the maximum instantaneous Doppler frequencies, and thus, can be considered as a time series. Time-series analysis appears in many application domains, including speech recognition, handwriting recognition, weather readings, and financial recordings [18,19,20]. We consider two common time-series recognition methods, namely, the NN-dynamic time warping (DTW) (NN classifier with the DTW distance) [21,22,23,24] method and the long short-term memory (LSTM) method [25,26,27,28]. The former is a conventional machine learning (ML) technique that utilizes the DTW distance which is a sum-measure over a parametrization. It has nonlinear warping capability to find an optimal alignment between two time series and, therefore, can determine the similarity between the two time series [29,30,31,32,33,34]. The latter method is a deep learning tool which is more appropriate for time series than CNN. It establishes a memory of the data temporal evolution information during the training process [35,36,37,38]. The DTW-based NN classifier was shown to outperform those based on the L1 distance norm and the LSTM method, and achieves an average classification rate of above 99%. Both time-series analysis methods are robust to time misalignment. Similar to [17], our feature vector includes the augmented positive and negative frequency envelopes. However, we also augment these two envelopes with a vector of their differences which properly captures the time synchronization nature of the two envelopes. It is noted that no repetitive motions are considered, and gesture classification is applied to only a single arm motion cycle [39].
The main novelty of our work is that, to the best of our knowledge, this is the first time where time-series recognition methods are employed to classify arm motions by the maximum instantaneous Doppler frequency features. Commonly applied methods for classification are more suitable for image-like data, such as handcrafted feature-based methods and low-dimension representation techniques based on PCA and CNN [2,4,5,40]. The principal motivation of using time-series recognition methods is to exploit the time relations between the different envelope values for improved classification.
The remainder of this paper is organized as follows. In Section 2, we describe a method to extract the MD signature envelopes, and discuss two time-series analysis methods, namely, the dynamic time warping and the long short-term memory. Section 3 describes the arm motion experiments, and presents the gesture recognition accuracy of the two time-series analysis methods. Section 4 discusses the robustness of the proposed methods to time misalignment and time consumption. The paper is concluded in Section 5.

2. Materials and Methods

2.1. Radar MD Signature Representation

2.1.1. Time-Frequency Representations

The radar back-scattering signal from arms in motion can be analyzed by its MD signature. The MD signature is a time-frequency representation (TFR) which reveals the received signal local frequency behavior. A number of TFR methods could be used to represent the MD signature. The spectrogram is a commonly employed TFR which predicates using linear time-frequency analysis. For a discrete-time signal s ( n ) of length N, the spectrogram can be obtained by taking the short-time Fourier transform (STFT) of the data and computing the magnitude square,
S n , k = m = 0 L 1 s ( n + m ) h ( m ) e j 2 π m k N 2 ,
where n = 1 , , N is the time index, k = 1 , K is the discrete frequency index, and L is the length of the window function h ( · ) . An example of the spectrogram, scaled to 0 d B , is illustrated in Figure 1. The sliding window h ( · ) is rectangular with length L = 2048 (0.16 s), and K is set to 4096. We consider the MD signal as a deterministic signal rather than a stochastic process, and do not assume an underlying frequency modulated signal model that calls for optimum parameter estimation [41,42,43].

2.1.2. Power Burst Curve (PBC)

In real-time processing, the received signal is typically a long time sequence signal that may contain multiple and consecutive arm motions. Finding the onset and offset times of arm motion becomes necessary to determine the individual motion boundaries and time span. These times can be obtained from the PBC [44,45], which measures the signal energy in the spectrogram within specific frequency bands. In particular, we compute
S ( n ) = k 1 = K N 1 K N 2 S ( n , k 1 ) 2 + k 1 = K P 1 K P 2 S ( n , k 1 ) 2 .
In the problem considered, the negative frequency indices K N 1 and K N 2 are set to 500 Hz to 20 Hz, whereas the indices for positive frequencies are set to K P 1 = 20 Hz and K P 2 = 500 Hz. The frequency band around the zero Doppler bin between 20 Hz and 20 Hz affects the accuracy of the result and, therefore, is not considered. The resulting PBC is indicated by the blue curve in Figure 2 for the example spectrogram in Figure 1.
In order to avoid false breach of the motion signature, the original PBC curve is smoothed by a moving average filter of length P. The filtered PBC, S f ( n ) , is represented by
S f ( n ) = 1 P j = 0 P 1 S ( n j ) ,
and is shown in Figure 2 by the red curve. The threshold, T, determines the beginning and the end of each motion, and is computed by
T = S f min + α · S f max S f min ,
where α depends on the noise floor and is empirically chosen from the range [ 0.01 , 0.2 ] . S f min and S f max , respectively, represent the minimum and maximum values of S f ( n ) . In this paper, α is set to 0.1, which means 10% over the minima. The threshold is indicated by a a yellow line shown in Figure 2. The onset time of each motion is determined as the time index at which the filtered PBC exceeds the threshold, whereas the offset time corresponds to the time index at which the filtered PBC falls below the threshold.

2.2. Extraction of the Maximum Instantaneous Doppler Frequency Signature

The arm has a bone structure which makes it more rigid than the hands. For example, the motion of any point on the upper arm, which is the part from the shoulder to the elbow, can be discerned from any other point in the same part. This property motivates us to use the maximum instantaneous Doppler frequencies as principal features. These features represent the positive and negative frequency envelopes in the spectrograms and attempt to capture, among other things, the maximum Doppler frequencies, the time-duration of the arm motion event and its bandwidth, and the relative portion of the motion towards and away from the radar. In this respect, the envelopes can accurately characterize different arm motions. An energy-based thresholding algorithm discussed in [17,44] can be applied to extract the envelopes. First, the maximum positive and negative Doppler frequencies are determined by computing the effective bandwidth of each motion from the spectrogram. Second, the positive frequency and negative frequency parts of a spectrogram are used to generate the positive envelope and negative envelope, respectively. The corresponding energies of the two parts, denoted as E U ( n ) and E L ( n ) , are computed separately as
E U n = k = 1 K 2 S n , k 2 , E L n = k = K 2 + 1 K S n , k 2 .
Figure 3 shows the resulting positive energy and negative energy of the example considered. These energies are then scaled to define the respective thresholds, T U and T L ,
T U ( n ) = E U ( n ) · σ U , T L ( n ) = E L ( n ) · σ L ,
where σ U and σ L represent the scale factors; both are less than 1. These scalars can be chosen empirically, but an effective way for their selection is to maintain the ratio of the energy to the threshold values constant over all time samples. This constant ratio can be found by time locating the maximum positive Doppler frequency and computing the corresponding energy at this location. In this example, t i = 2.54 s , f j = 340 Hz and A ( t i , f j ) = 320 , where ( t i , f j ) and A ( t i , f j ) represent the location of the maximum positive Doppler frequency and its strength, respectively. The corresponding scale factor can be found by σ U = A ( t i , f j ) / E U ( t i ) . Once the threshold is computed, the positive frequency envelope is then provided by locating the Doppler frequency at each time instant for which the spectrogram assumes the first higher or equal value to the threshold. This frequency, in essence, represents the effective maximum instantaneous Doppler frequency. A similar procedure can be followed for the negative frequency envelope. The positive frequency envelope, e U ( n ) , and negative frequency envelope, e L ( n ) , are concatenated to form the feature vector e = [ e U , e L ] . The extracted frequency envelopes of the example considered are plotted in Figure 4.

2.3. Time-Series Analysis Methods

The extracted maximum instantaneous Doppler frequencies are considered as a time series. To measure the similarity between two time series, the traditional L1 and L2 distance methods do not take into account the temporal or evolutionary behavior of the series. We seek a similarity measure that accounts for these properties and is robust to time shift and scaling. To fully exploit the characteristics of the maximum instantaneous Doppler frequencies, two time-series analysis methods are presented, namely, the DTW method and the LSTM method. The DTW method is a well-established distance measure which permits time and scale misalignments. A NN classifier can be applied in conjunction with the DTW [32,46]. On the other hand, the unique design structure of the LSTM allows the network to exhibit temporal dynamic behavior and as such, is cognizant of past input samples. It has already achieved a great success in handwriting recognition and speech recognition [47,48].

2.3.1. Dynamic Time Warping Method

The NN classifier is applied to the MD signature feature vector to discriminate among six arm motions. The DTW distance is one of the principal methods used to calculate the similarity between two motion time series which may vary in time or speed. For instance, similarities in walking patterns could be detected using DTW, even if one person walks faster than the other, or if there are accelerations and decelerations during the course of an observation.
Suppose X = ( x 1 , x 2 , , x i , , x n ) and Y = ( y 1 , y 2 , , y j , , y n ) are two time series representing the maximum instantaneous Doppler frequencies, an n-by-n distance matrix D is then formed, where the ( i , j ) matrix element represents the distance D ( x i , y j ) between x i X and y j Y (the distance D ( x i , y j ) is typically computed by the L1 or L2 norm). Each element also corresponds to an alignment between x i X and y j Y . A warping path, W, finds a path in the distance matrix D [21,29,49],
W = w 1 , w 2 , , w l , , w L , n L 2 n 1 ,
where each w l corresponds to an element ( i , j ) l . The warping path is typically restricted by the following three constraints [21,29,49]:
  • Boundary conditions: the beginning and end of the path are w 1 = ( 1 , 1 ) and w L = ( n , n ) , respectively;
  • Monotonicity: given w l 1 = ( a , b ) and w l 2 = ( c , d ) where a c , we have b d ;
  • Continuity: given w l = ( a , b ) and w l + 1 = ( c , d ) , we have c a 1 , d b 1 .
When the distance matrix D is computed by the L2 norm, the diagonal line in the Figure 5 represents the Euclidean path, which is just one case of all possible paths. The DTW is the path that satisfies the above restrictions, and also has the minimum warping cost, as illustrated in Figure 5 and given by,
D DTW ( X , Y ) = min l = 1 L w l .
The applied NN classifier is among the most commonly used classifiers in pattern recognition. It is a simple ML classification algorithm, where for each test sample, the algorithm calculates the distance to all training samples. The DTW distance is chosen as the distance metric due to its superior performance in time-series analysis compared with conventional L1 and L2 distances. The classification is performed by assigning the label of the closest training sample based on the resulting DTW distance.

2.3.2. Long Short-Term Memory

The CNN and recurrent neural network (RNN) are two common deep learning tools. The former performs well in spatial-distributed data processing, which is mainly used for image classification with the predefined size data. On the other hand, RNN can recognize the time information, and it is more commonly used in speech recognition and natural language processing. Since we cast the feature as time series, we opt to use the RNN to analyze the temporal information embedded in the data. However, the conventional RNN suffers from long-term memory. The LSTM is an alternative RNN architecture which can overcome this shortcoming. A detailed explanation of LSTM can be found in [25,26,27,28].
The diagram in Figure 6 illustrates the architecture of the employed LSTM network. The input layer inputs the time-series data into the network, and the LSTM layer learns temporal information from the input. The fully connected layer combines all the features learned by LSTM layers for classification. Therefore, the output size is equal to the number of classes. The softmax layer normalizes the output of the former layer to be used as the classification probabilities.
At any given time, the input data X i n p u t is two dimensional. Along each dimension, a time series of length N, representing the maximum positive and negative instantaneous Doppler frequencies, is considered. That is,
X i n p u t = X 1 X 2 X t X N = e U 1 e U 2 e U t e U N e L 1 e L 2 e L t e L N ,
where X t is the two-dimensional input vector containing the maximum positive and negative Doppler frequencies at time t. Figure 7 shows the details of the LSTM layer. Each LSTM block contains three gates to control the flow of the information, namely, the forget gate, the input gate, and the output gate. The hidden state h t and the cell state c t of the LSTM layer at time t can be obtained by following equations [25]:
f t = σ ( W f x t + R f h t 1 + b f ) i t = σ ( W i x t + R i h t 1 + b i ) g t = t a n h ( W g x t + R g h t 1 + b g ) o t = σ ( W o x t + R o h t 1 + b o ) c t = f t c t 1 + i t g t h t = o t t a n h ( c t ) ,
where f t is the forget gate, i t is the input gate, g t is the cell candidate, o t is the output gate. The W, R, and b are the input weights, recurrent weights and bias, respectively, with the subscripts corresponding to different gates. The W f , R f , and b f are the parameters of the forget gate, the W i , R i , and b i are the parameters of the input gate, the W g , R g , and b g are the parameters of the cell candidate, and the W o , R o , and b o are the parameters of the output gate. The σ and t a n h ( · ) represent the sigmoid activation function and hyperbolic tangent activation function, respectively. The ⊙ denotes the Hadamard product.
The difference between the conventional RNN and the LSTM network is that the LSTM has three gates to regulate the flow of the information, which also leads to its long-term memory. The forget gate f t can learn what information is relevant in the time sequence, and decide to keep or forget accordingly. The previous hidden state h t 1 and the current input x t are passed through a sigmoid function, and the smaller the output value, the more information from the previous cell state c t 1 is forgotten. The candidate g t is the output by a t a n h function to compress the inputs, and the input gate i t is applied to control how much information of the candidate is added in the updated cell state. The cell state c t itself can be updated by the previous cell state c t 1 , the forget gate f t , the input gate i t , and candidate g t . The output gates o t decide how much information to output. The hidden state h t can be obtained by the update cell state c t and output gate o t , which is also the output of the LSTM block at time t.

3. Results

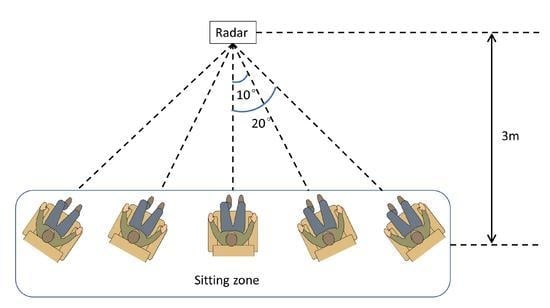
3.1. Arm Motion Experiments

The system in the experiments utilizes one K-band portable radar sensor from the Ancortek company with one transmitter and one receiver. It generates a continuous wave (CW) with the carrier frequency 25 GHz and the sampling rate is 12.8 kHz.
The data analyzed in this paper were collected in the Radar Imaging Lab at the Center for Advanced Communications, Villanova University. The radar was fixed at the edge of a table. The vertical distance between radar and the participant was approximately three meters. During the experiments, the participants were in a sitting position, and the body remained fixed as much as possible. In order to mimic typical behavior, the arms always rested down at table or chair arm level at the initiation and conclusion of each arm motion. Different orientation angles and speeds of arm motion were also considered. As shown in Figure 8, five different orientation angles, 0 , ± 10 , ± 20 , were chosen, and the participant was always facing the radar at different angles. Since the speed of the arm motion varies from person to person and is also influenced by age, we took into account both normal speed and slow speed arm motions. The normal speed motion is more natural and relatively fast, whereas the slow speed arm motion is about 30% slower than the normal.
The six arm motions were conducted as depicted in Figure 9, i.e., (a) pushing arms and pulling back; (b) crossing arms and opening; (c) crossing arms; (d) rolling arms; (e) stop sign; and (f) pushing arms and opening. In “pushing," both arms moved towards the radar, whereas the “pulling" was an opposite motion in which the arms moved away from the radar. The “pushing" was followed by “pulling" immediately with a very short pause or almost no pause between them. The motion of “crossing arms" describes crossing the arms from a wide stretch. Six people were invited to participate in the experiment, including four men and two women. Each arm motion was recorded over 40 seconds to generate one data segment. The normal arm motion and slow arm motion were both recorded twice at each angle. Each segment contained the same 12 or 13 individual arm motion, and the PBC was applied to determine the onset and offset times of each individual motion. A 5 second time window was utilized to extract every individual motion from the long time sequence. As such, repetitive motions and the associated duty cycles were not considered as features and were not part of the classifications. In total, we generated 1913 samples for six arm motions.
Among the six arm motions, we chose the most discriminative arm motion as an “attention” motion for signaling the radar to begin as well as to end. Without the “attention” motion, the radar remained passive with no interactions with the human. Among all arm motions, “pushing arms and pulling back” and “pushing and open arms” assumed the highest accuracy. However, the former motion can be confused with common arm motions such as reaching for a cup or glasses on table. Thus, “pushing and open arms” was chosen as the “attention” motion.
The spectrograms for six arm motions at a normal speed and at zero angle were obtained by performing the STFT, and are shown in Figure 10. Through the envelope extraction method, the corresponding envelopes are also plotted in Figure 11. The yellow curves and the red curves in the figure are the maximum positive and negative envelopes, respectively. It is clear that the envelopes can well enclose the local power distributions. It is also evident that the MD characteristics of the spectrograms are in agreement and consistent with each arm motion kinematics [16]. For example, in “pushing arms and pulling back,” the arms push forward directly which generates positive frequencies, whereas the “pulling” phase has negative frequencies. At the initiation of the arm motion, “crossing arms and opening,” the two arms move back slightly, resting on a table or chair arms, in the ready position. This causes negative frequency at the beginning. The motion itself can be decomposed into two phases. In the “crossing” phase, the arms move closer to the radar at the beginning which causes positive frequencies, then move away from the radar which induces negative frequencies. The “open” phase is the opposite motion of the “crossing” phase, which also produces positive frequencies first and then negative frequencies. At the conclusion of the arm motion, the arms rest down causing positive frequencies at the end of the spectrogram. The motion “crossing arms” only contains the first phase of the motion “crossing arms and opening,” and has the same respective MD signature. The two arms of “rolling arms” perform exactly the opposite movements, as one arm moves forward along a circular trajectory, while the other moves backwards. Therefore, the MD has simultaneously positive and negative frequencies. In one motion cycle, the right arm experiences three phases, moving forward, moving backward, and moving forward again. The left arm always performs the opposite motion to the right arm. For the motion, “stop sign,” the arm moves backwards which only causes negative frequencies. The last arm motion, “pushing arms and opening ” includes the pushing, which has positive frequencies, and the opening, which has negative frequencies.
Figure 12 is an example of the “attention” motion with different velocities at 0 . The time period of the normal motion is shorter than that of the slow motion, and the speed is faster which causes higher Doppler frequencies. The main characteristics and behaviors, however, remain unchanged. Figure 13 shows the “attention” motion at the normal speed and at different orientation angles. As the angle increases, the energy becomes lower owing to the d B drop in the antenna beam.

3.2. Classification Results

In the previous sections, we discussed the extraction of the maximum instantaneous Doppler frequency signatures and two different time-series analysis methods. In this section, the extracted features are regarded as a sequence that is input to both methods. The classification accuracy is used to evaluate the performance of the two ML methods, and all the classification results are obtained through 500 Monte Carlo trials. In each trial, we randomly selected 70% of the data segments for training and 30% for testing. All experiments were performed on Intel(R) Core(TM) i7-3770 CPU with 16 GB of memory.

3.2.1. Classification Accuracy of the LSTM Method

The structure of the LSTM method, described in Section 4.2, is applied. The input data were the maximum instantaneous Doppler frequencies. The output of the LSTM layer was the last sequence, and its size was determined by trial and error. During the training process, the batch number was set to 10, and the maximum epochs was 200. An epoch is an iteration over the entire training samples. The optimization solver was the stochastic gradient descent with momentum optimizer, and the learning rate was the constant value 0.001. The training accuracy and the loss of the training during the training process is plotted in Figure 14 and Figure 15. The arm motion recognition results with different output sizes are shown in Figure 16. The highest accuracy of 96.67% was achieved with the output size 400. The confusion matrix is given in Table 1.

3.2.2. Classification Accuracy of the DTW Method

The DTW distance is robust to time misalignments and time scaling. Figure 17 shows two envelopes of the same motion class, but with a large misalignment in time. Although similar in shape, the L2 distance, which only accounts for the corresponding samples in the two time series, yields a high error norm. By applying the DTW distance, the two time series can be aligned well and the effect of the misalignments is significantly reduced. Similarly, two time series with different time scalings can also be aligned in value. Figure 18 shows the alignment of the envelopes of two members of the same motion class but with different speeds. In essence, by applying the DTW method, the two time series which belong to the same motion class assume small distance and high similarity, which reduces the probability of misclassification.
In our previous work [16,17], each of the original extracted envelope features contained 2000 samples for both positive and negative Doppler frequencies, and were directly input into the NN classifier with the L1 distance measure, achieving an overall accuracy 97.17% [16]. Considering the real-time processing and to avoid high computational burden of DTW dealing with long time series, we downsampled the envelopes to 200 samples. Figure 19 shows one example of the frequency envelope before and after downsampling. It is evident that the main characteristics of the envelope are maintained when downsampled. To further examine the impact of downsampling on the NN classifier, the downsampled features were put into the NN classifier with the L1 distance. This resulted in a classification accuracy of 97.13% [16], which is nearly the same as when using the entire sequence. The corresponding confusion matrix is given in Table 2.
Since the arm motion recognition accuracy based on the original and the downsampled envelopes is unchanged, we opted to use the downsampled envelope features as the input to the NN-DTW classifier. The result is an overall accuracy of 98.20%, with the confusion matrix shown in Table 3. It took about 0.2 s to classify each test sample with the downsampled data, using the DTW distance which makes it suitable for real-time processing. By comparing these two confusion matrices, the accuracy of motions (b), (c), (d), and (e) improved by 1% to 3%, whereas motion (a) dropped by 2%. There was a 1% overall improvement.
Since we concatenated the positive and negative envelopes to form a long vector, the relation between the time occurrences of the corresponding samples was not captured in the concatenated vector and was not considered by the DTW method. Thus, we decided to also include the vector of the two envelope differences as a feature. The new feature vector is e n e w = [ e U , e L , e U e L ] , and includes the differences between the positive and negative envelopes. A remarkably higher average classification rate of 99.12% was achieved. The confusion matrix is shown in Table 4. All motions are classified with an accuracy of over 98.50%, and in particular, the motions in (c), (d), and (e) have an accuracy higher than 99%.

4. Discussion

4.1. Analysis of the Classification Accuracy with Time Misalignment

The NN classifier with the L1 distance only considers the frequency envelope values individually, whereas the DTW distance takes into account the temporal information. Thus, it is expected that the NN classier with the DTW distance can achieve a better performance. The onset and offset times of each motion are obtained by the PBC, and used to center the individual motion in the middle of the spectrograms. Since the time span and speed of each motion may vary, misalignments can occur within the same class. To validate the DTW method robustness to time misalignment, each test envelope feature was shifted to the left or right within [ 0 , T s h i f t ] , where T s h i f t is the maximum time shift. This time shift process is not included in the training data, which means the classifier had no knowledge about the time shift during the training. The recognition accuracy based on the NN-L1 and NN-DTW classifiers with different maximum time shifts is plotted in Figure 20. With the maximum time shift of 0.5 s, the accuracy based on the NN-L1 classifier dropped by 15.06 %, whereas the NN-DTW-based method only dropped by 0.33%. We also consider the affect of the time misalignment on the LSTM method. From Figure 20, it is clear that the recognition accuracy is maintained and is unchanged with different time shifts. This demonstrated that both the NN-DTW method and the LSTM method are robust to time misalignment.

4.2. Analysis of the Time Consumption

In real-time arm motion classification, the execution time of the two time-series recognition methods considered is an important factor. The operation software is MATLAB 2018b with a Windows 10 computer. For both recognition methods, the input of each arm motion is 200 downsampled envelopes. The time for training and testing is obtained from 1343 training samples and 570 test samples with 100 trials, and is presented in Table 5. The training process of the LSTM is computationally expensive, since the classification of LSTM requires a large number of memory cells, output size, and epochs, which demand a long training time [50]. Once the LSTM network has been trained, the execution time for each test sample is only about 2.95 ms. The NN classifier has no training process, which means it does not require any training time [51,52]. The classification time of the NN-DTW method for each test sample is about 0.2 s, which is much longer than the LSTM network, but remains suitable for real-time processing, while maintaining a higher classification accuracy compared with the LSTM network. It is noted that the computational complexity of the NN classifier is O ( N d ) , where N is the number of the samples and d is the dimension of the features. The test time of the NN-DTW increases linearly as the number of samples increases. Fast NN methods [51,53] and DTW methods [30,54] can be applied to achieve fast implementation.

5. Conclusions

In this paper, we considered a time-series analysis method for effective automatic arm motion recognition based on radar MD signature envelopes. No range or angle information was incorporated into the classifications. Taking advantage of the Doppler continuity of the arm motion, the PBC was used to determine the individual motion boundaries from long time series. The positive and negative frequency envelopes of the data spectrogram were then extracted by an energy-based thresholding algorithm. The feature vector was the augmented positive and negative frequency envelopes, and their differences. The augmented feature vector was provided to the NN classifier based on the DTW distance, which is more suitable to describe the similarity between time series in lieu of the L1 and L2 distance measures. The LSTM, a time-series analysis method commonly used in ML, was also presented for comparison. The experimental results showed that the NN classifier based on the DTW distance achieves close to a 99% classification rate, which is superior to both existing classifiers based on the L1 distance and the LSTM method by an overall 2% improvement. It was also shown that the DTW and LSTM methods are robust to the time shift of the signal.
Future work may consider more diverse arm motions, arm speeds, arm angle orientations, and distances between the radar and the person moving his/her arms. It will be of interest to evaluate the robustness of the arm classification results while the person is in the state of standing or walking.

Author Contributions

Conceptualization, Z.Z., M.G.A.; Formal analysis, Z.Z.; Methodology, Z.Z., M.G.A.; Validation, Z.Z.; Writing—original draft, Z.Z., M.G.A.; Writing—review & editing, M.G.A., T.S. All authors have read and agreed to the published version of the manuscript.

Funding

This research received no external funding.

Acknowledgments

The work of Z.Z. was performed while he was a Visiting Scholar at the Center for Advanced Communications, Villanova University.

Conflicts of Interest

The authors declare no conflict of interest.

Abbreviations

The following abbreviations are used in this manuscript:
RFRadio frequency
MDMicro-Doppler
DTWDynamic time warping
LSTMLong short-term memory
PCAPrinicipal component analysis
TFRTime-frequency representation
STFTShort-time Fourier transform
PBCPower burst curve
NNNearest neighbour
NN-DTWNN classifier with the DTW distance)
STFTShort-time Fourier transform
PBCPower burst curve
CWContinuous wave
MLMachine learning
CNNConvolutional neural network
RNNRecurrent neural network

References

  1. Li, G.; Zhang, R.; Ritchie, M.; Griffiths, H. Sparsity-driven micro-Doppler feature extraction for dynamic hand gesture recognition. IEEE Trans. Aerosp. Electron. Syst. 2018, 54, 655–665. [Google Scholar] [CrossRef]
  2. Kim, Y.; Toomajian, B. Hand gesture recognition using micro-Doppler signatures with convolutional neural network. IEEE Access 2016, 4, 7125–7130. [Google Scholar] [CrossRef]
  3. Wang, S.; Song, J.; Lien, J.; Poupyrev, I.; Hilliges, O. Interacting with Soli: Exploring fine-grained dynamic gesture recognition in the radio-frequency spectrum. In Proceedings of the 29th Annual Symposium on User Interface Software and Technology, Tokyo, Japan, 16–19 October 2016. [Google Scholar]
  4. Skaria, S.; Al-Hourani, A.; Lech, M.; Evans, R.J. Hand-gesture recognition using two-Antenna Doppler radar with deep convolutional neural networks. IEEE Sensors J. 2019, 19, 3041–3048. [Google Scholar] [CrossRef]
  5. Zhang, S.; Li, G.; Ritchie, M.; Fioranelli, F.; Griffiths, H. Dynamic hand gesture classification based on radar micro-Doppler signatures. In Proceedings of the 2016 CIE International Conference on Radar (RADAR), Guangzhou, China, 10–13 October 2016. [Google Scholar]
  6. Amin, M.G.; Zeng, Z.; Shan, T. Hand gesture recognition based on radar micro-Doppler signature envelopes. In Proceedings of the 2019 IEEE Radar Conference, Boston, MA, USA, 22–26 April 2019. [Google Scholar]
  7. Amin, M. Radar for Indoor Monitoring: Detection, Classification, and Assessment; CRC Press: Boca Raton, FL, USA, 2017. [Google Scholar]
  8. Amin, M.G.; Zhang, Y.D.; Ahmad, F.; Ho, K.D. Radar signal processing for elderly fall detection: The future for in-home monitoring. IEEE Signal Process. Mag. 2016, 33, 71–80. [Google Scholar] [CrossRef]
  9. Seifert, A.K.; Zoubir, A.M.; Amin, M.G. Detection of gait asymmetry using indoor Doppler radar. In Proceedings of the 2019 IEEE Radar Conference, Boston, MA, USA, 22–26 April 2019. [Google Scholar]
  10. Van Dorp, P.; Groen, F. Feature-based human motion parameter estimation with radar. IET Radar, Sonar Navig. 2008, 2, 135–145. [Google Scholar] [CrossRef]
  11. Kim, Y.; Ha, S.; Kwon, J. Human detection using Doppler radar based on physical characteristics of targets. IEEE Geosci. Remote. Sens. Lett. 2015, 12, 289–293. [Google Scholar]
  12. Mobasseri, B.G.; Amin, M.G. A time-frequency classifier for human gait recognition. Proc. SPIE 2009, 7306, 730628. [Google Scholar]
  13. Gurbuz, S.Z.; Clemente, C.; Balleri, A.; Soraghan, J.J. Micro-Doppler-based in-home aided and unaided walking recognition with multiple radar and sonar systems. IET Radar Sonar Navig. 2016, 11, 107–115. [Google Scholar] [CrossRef] [Green Version]
  14. Jokanović, B.; Amin, M. Fall detection using deep learning in range-Doppler radars. IEEE Trans. Aerosp. Electron. Syst. 2018, 54, 180–189. [Google Scholar] [CrossRef]
  15. Gurbuz, S.Z.; Amin, M.G. Radar-Based Human-Motion Recognition With Deep Learning: Promising applications for indoor monitoring. IEEE Signal Process. Mag. 2019, 36, 16–28. [Google Scholar] [CrossRef]
  16. Zeng, Z.; Amin, M.; Shan, T. Automatic arm motion recognition based on radar micro-Doppler signature envelopes. arXiv 2019, arXiv:1910.11176. [Google Scholar]
  17. Amin, M.; Zeng, Z.; Shan, T. Automatic arm motion recognition using radar for smart home technologies. In Proceedings of the 2019 International Radar Conference (RADAR), Toulon, France, 23–27 September 2019. [Google Scholar]
  18. Cui, Y.; Shi, J.; Wang, Z. Complex rotation quantum dynamic neural networks (CRQDNN) using Complex Quantum Neuron (CQN): Applications to time series prediction. Neural Netw. 2015, 71, 11–26. [Google Scholar] [CrossRef] [PubMed]
  19. Kadous, M.W. Temporal Classification: Extending the Classification Paradigm to Multivariate Time Series. Ph.D. Thesis, University of New South Wales Kensington, Sydney, Australia, 2002. [Google Scholar]
  20. Sharabiani, A.; Darabi, H.; Rezaei, A.; Harford, S.; Johnson, H.; Karim, F. Efficient classification of long time series by 3-d dynamic time warping. IEEE Trans. Syst. Man Cybern. Syst. 2017, 47, 2688–2703. [Google Scholar] [CrossRef]
  21. Efrat, A.; Fan, Q.; Venkatasubramanian, S. Curve Matching, Time Warping, and Light Fields: New Algorithms for Computing Similarity between Curves. J. Math. Imaging Vis. 2007, 27, 203–216. [Google Scholar] [CrossRef] [Green Version]
  22. Buchin, K.; Buchin, M.; Wenk, C. Computing the Fréchet distance between simple polygons in polynomial time. In Proceedings of the Symposium on Computational Geometry, Sedona, AZ, USA, 5–7 June 2006. [Google Scholar]
  23. Alt, H.; Godau, M. Computing the Fréchet distance between two polygonal curves. Int. J. Comput. Geom. Appl. 1995, 5, 75–91. [Google Scholar] [CrossRef]
  24. Munich, M.E.; Perona, P. Continuous dynamic time warping for translation-invariant curve alignment with applications to signature verification. In Proceedings of the Seventh IEEE International Conference on Computer Vision, Kerkyra, Greece, 20–25 September 1999. [Google Scholar]
  25. Hochreiter, S.; Schmidhuber, J. Long short-term memory. Neural Comput. 1997, 9, 1735–1780. [Google Scholar] [CrossRef]
  26. Welhenge, A.M.; Taparugssanagorn, A. Human activity classification using long short-term memory network. Signal Image Video Process. 2019, 13, 651–656. [Google Scholar] [CrossRef]
  27. Loukas, C.; Fioranelli, F.; Le Kernec, J.; Yang, S. Activity classification using raw range and I & Q radar data with long short term memory layers. In Proceedings of the 2018 IEEE 16th International Conference on Dependable, Autonomic and Secure Computing, 16th International Conference on Pervasive Intelligence and Computing, 4th International Conference on Big Data Intelligence and Computing and Cyber Science and Technology Congress (DASC/PiCom/DataCom/CyberSciTech), Athens, Greece, 12–15 August 2018. [Google Scholar]
  28. Klarenbeek, G.; Harmanny, R.; Cifola, L. Multi-target human gait classification using LSTM recurrent neural networks applied to micro-Doppler. In Proceedings of the 2017 European Radar Conference (EURAD), Nuremberg, Germany, 11–13 October 2017. [Google Scholar]
  29. Bemdt, D.J.; Clifford, J. Using dynamic time warping to find patterns in time series. In Proceedings of the AAAI-94 workshop on knowledge discovery in databases, Seattle, WA, USA, 31 July–1 August 1994. [Google Scholar]
  30. Salvador, S.; Chan, P. Toward accurate dynamic time warping in linear time and space. Intell. Data Anal. 2007, 11, 561–580. [Google Scholar] [CrossRef] [Green Version]
  31. Senin, P. Dynamic Time Warping Algorithm Review; Technical Report; Information and Computer Science Department, University of Hawaii at Manoa Honolulu: Honolulu, HI, USA, 2009. [Google Scholar]
  32. Gudmundsson, S.; Runarsson, T.P.; Sigurdsson, S. Support vector machines and dynamic time warping for time series. In Proceedings of the 2008 IEEE International Joint Conference on Neural Networks (IEEE World Congress on Computational Intelligence), Hong Kong, China, 1–8 June 2008. [Google Scholar]
  33. Niennattrakul, V.; Ratanamahatana, C.A. On clustering multimedia time series data using k-means and dynamic time warping. In Proceedings of the 2007 International Conference on Multimedia and Ubiquitous Engineering (MUE’07), Seoul, Korea, 26–28 April 2007. [Google Scholar]
  34. Yu, F.; Dong, K.; Chen, F.; Jiang, Y.; Zeng, W. Clustering time series with granular dynamic time warping method. In Proceedings of the 2007 IEEE International Conference on Granular Computing (GRC 2007), Fremont, CA, USA, 2–4 November 2007. [Google Scholar]
  35. Czech, D.; Mishra, A.; Inggs, M. A CNN and LSTM-based approach to classifying transient radio frequency interference. Astron. Comput. 2018, 25, 52–57. [Google Scholar] [CrossRef] [Green Version]
  36. Zhao, Z.; Chen, W.; Wu, X.; Chen, P.C.; Liu, J. LSTM network: A deep learning approach for short-term traffic forecast. IET Intell. Transp. Syst. 2017, 11, 68–75. [Google Scholar] [CrossRef] [Green Version]
  37. Munir, K.; Elahi, H.; Ayub, A.; Frezza, F.; Rizzi, A. Cancer diagnosis using deep learning: A bibliographic review. Cancers 2019, 11, 1235. [Google Scholar] [CrossRef] [PubMed] [Green Version]
  38. Siddhartha; Lee, Y.H.; Moss, D.J.; Faraone, J.; Blackmore, P.; Salmond, D.; Boland, D.; Leong, P.H. Long short-term memory for radio frequency spectral prediction and its real-time FPGA implementation. In Proceedings of the MILCOM 2018-2018 IEEE Military Communications Conference (MILCOM), Los Angeles, CA, USA, 29–31 October 2008. [Google Scholar]
  39. Tan, B.; Woodbridge, K.; Chetty, K. A real-time high resolution passive WiFi Doppler-radar and its applications. In Proceedings of the 2014 International Radar Conference, Lille, France, 13–17 October 2014. [Google Scholar]
  40. Seifert, A.K.; Schäfer, L.; Amin, M.G.; Zoubir, A.M. Subspace Classification of Human Gait Using Radar Micro-Doppler Signatures. In Proceedings of the 26th European Signal Processing Conference (EUSIPCO), Rome, Italy, 3–7 September 2018. [Google Scholar]
  41. Amin, M.G. Time-Frequency Spectrum Analysis and Estimation for Nonstationary Random-Processes; Longman Cheshire (AUS): Melbourne, Australia, 1992. [Google Scholar]
  42. Cirillo, L.; Zoubir, A.; Amin, M. Parameter estimation for locally linear FM signals using a time-frequency Hough transform. IEEE Trans. Signal Process. 2008, 56, 4162–4175. [Google Scholar] [CrossRef]
  43. Setlur, P.; Amin, M.; Ahmad, F. Analysis of micro-Doppler signals using linear FM basis decomposition. In Radar Sensor Technology X; SPIE: Bellingham, WA, USA, 2006; p. 62100M. [Google Scholar]
  44. Erol, B.; Amin, M.G.; Boashash, B. Range-Doppler radar sensor fusion for fall detection. In Proceedings of the Radar Conference (RadarConf), Seattle, WA, USA, 9–12 May 2017. [Google Scholar]
  45. Amin, M.G.; Ravisankar, A.; Guendel, R.G. RF sensing for continuous monitoring of human activities for home consumer applications. In Proceedings of the SPIE Defense + Commercial Sensing, Baltimore, MD, USA, 13 May 2019. [Google Scholar]
  46. Ding, H.; Trajcevski, G.; Scheuermann, P.; Wang, X.; Keogh, E. Querying and mining of time series data: experimental comparison of representations and distance measures. Proc. Vldb Endow. 2008, 1, 1542–1552. [Google Scholar] [CrossRef] [Green Version]
  47. Graves, A.; Liwicki, M.; Fernández, S.; Bertolami, R.; Bunke, H.; Schmidhuber, J. A novel connectionist system for unconstrained handwriting recognition. IEEE Trans. Pattern Anal. Mach. Intell. 2008, 31, 855–868. [Google Scholar] [CrossRef] [PubMed] [Green Version]
  48. Graves, A.; Mohamed, A.r.; Hinton, G. Speech recognition with deep recurrent neural networks. In Proceedings of the 2013 IEEE International Conference on Acoustics, Speech and Signal Processing, Vancouver, BC, Canada, 26–31 May 2013. [Google Scholar]
  49. Müller, M. Dynamic Time Warping. In Information Retrieval for Music and Motion; Springer: Berlin/Heidelberg, Germany, 2007; pp. 69–84. [Google Scholar] [CrossRef]
  50. Sak, H.; Senior, A.; Beaufays, F. Long short-term memory recurrent neural network architectures for large scale acoustic modeling. In Proceedings of the Fifteenth Annual Conference of the International Speech Communication Association, Singapore, 14–18 September 2014. [Google Scholar]
  51. Deng, Z.; Zhu, X.; Cheng, D.; Zong, M.; Zhang, S. Efficient kNN classification algorithm for big data. Neurocomputing 2016, 195, 143–148. [Google Scholar] [CrossRef]
  52. Makkar, T.; Kumar, Y.; Dubey, A.K.; Rocha, Á.; Goyal, A. Analogizing time complexity of KNN and CNN in recognizing handwritten digits. In Proceedings of the 2017 Fourth International Conference on Image Information Processing (ICIIP), Shimla, India, 21–23 December 2017. [Google Scholar]
  53. Garcia, V.; Debreuve, E.; Nielsen, F.; Barlaud, M. K-nearest neighbor search: Fast GPU-based implementations and application to high-dimensional feature matching. In Proceedings of the 2010 IEEE International Conference on Image Processing, Hong Kong, China, 26–29 September 2010. [Google Scholar]
  54. Sakurai, Y.; Yoshikawa, M.; Faloutsos, C. FTW: fast similarity search under the time warping distance. In Proceedings of the twenty-fourth ACM SIGMOD-SIGACT-SIGART symposium on Principles of database systems, New York, NY, USA, 13–15 June 2005. [Google Scholar]
Figure 1. An example of a spectrogram.
Remotesensing 12 00454 g001
Figure 2. An example of the power burst curve (PBC) method.
Remotesensing 12 00454 g002
Figure 3. The energy of the positive and negative spectrogram.
Remotesensing 12 00454 g003
Figure 4. The extracted envelopes from the spectrogram.
Remotesensing 12 00454 g004
Figure 5. An example of dynamic time warping path.
Remotesensing 12 00454 g005
Figure 6. Diagram of the long short-term memory (LSTM) network.
Remotesensing 12 00454 g006
Figure 7. Details of the LSTM layer.
Remotesensing 12 00454 g007
Figure 8. Illustration of experimental setup.
Remotesensing 12 00454 g008
Figure 9. Illustrations of six different arm motions. (a) Pushing arms and pulling back; (b) crossing arms and opening; (c) crossing arms; (d) rolling arms; (e) stop sign; (f) pushing arms and opening.
Remotesensing 12 00454 g009
Figure 10. Spectrograms of six different arm motions. (a) Pushing arms and pulling back; (b) crossing arms and opening; (c) crossing arms; (d) rolling arms; (e) stop sign; (f) pushing arms and opening.
Remotesensing 12 00454 g010
Figure 11. Spectrograms and corresponding envelopes. (a) Pushing arms and pulling back; (b) crossing arms and opening; (c) crossing arms; (d) rolling arms; (e) stop sign; (f) pushing arms and opening.
Remotesensing 12 00454 g011
Figure 12. The “attention” motion with different velocities at 0 . (a) Slow motion; (b) normal motion.
Remotesensing 12 00454 g012
Figure 13. The “attention” motion at normal speed and at different orientation angles. (a) The “attention” motion at 0° (b) the “attention” motion at 10° (c) the “attention” motion at 20°.
Remotesensing 12 00454 g013
Figure 14. The training accuracy of the LSTM network.
Remotesensing 12 00454 g014
Figure 15. The training loss of the LSTM network.
Remotesensing 12 00454 g015
Figure 16. Accuracy of the LSTM method with a different output size.
Remotesensing 12 00454 g016
Figure 17. Alignment by dynamic time warping (DTW) with time shift.
Remotesensing 12 00454 g017
Figure 18. Alignment by DTW with different speeds.
Remotesensing 12 00454 g018
Figure 19. An example of the envelope feature before and after downsampling.
Remotesensing 12 00454 g019
Figure 20. Recognition accuracy with time shift.
Remotesensing 12 00454 g020
Table 1. Confusion matrix yielded by the LSTM method.
abcdef
a95.77%00.59%1.73%1.49%0.42%
b098.38%0.40%001.22%
c0.89%2.02%93.22%1.37%2.02%0.48%
d2.02%0.06%0.84%96.97%0.11%0
e1.31%01.94%0.44%96.12%0.19%
f0.25%0.63%0.13%0098.99%
Table 2. Confusion matrix yielded by the nearest neighbor (NN)-L1 classifier.
abcdef
a98.92%00.02%0.01%1.04%0.01%
b0.03%95.28%2.62%0.03%0.45%1.59%
c1.12%0.24%95.74%0.14%2.28%0.48%
d2.82%00.59%95.78%0.81%0
e2.58%00.82%096.60%0
f0.60%0.01%0.05%00.56%98.78%
Table 3. Confusion matrix yielded by the NN-DTW classifier.
abcdef
a96.96%00.02%02.79%0.23%
b0.03%98.70%0.71%0.07%00.45%
c0.28%0.38%97.87%01.39%0.08%
d1.02%01.42%96.82%0.59%0.15%
e0.17%00.48%099.09%0.26%
f0.13%00.04%00.69%98.14%
Table 4. Confusion matrix yielded by NN-DTW classifier with the new feature vector.
abcdef
a98.50%00.01%01.45%0.04%
b0.11%98.80%0.55%0.01%00.53%
c0.26%0.29%99.10%00.31%0.04%
d0.66%00.15%99.15%0.03%0
e0.01%01.01%098.97%0.01%
f0.02%00.01%00.32%99.65%
Table 5. Time consumption of two time-series recognition methods.
MethodsExecution Time for TrainingExecution Time for Test
LSTM2003.18 s1.68 s
NN-DTW0 s114.11 s

