Non-Contact Speech Recovery Technology Using a 24 GHz Portable Auditory Radar and Webcam
by
 ,
,
Yue Ma
1, 
Hong Hong
1,*, 
Hui Li
1,
Heng Zhao
2,
Yusheng Li
1,
Li Sun
1,
Chen Gu
1 and
Xiaohua Zhu
1 1
School of Electronic and Optical Engineering, Nanjing University of Science and Technology, Nanjing 210094, China
2
Department of Electrical and Computer Engineering, University of California, Davis, Davis, CA 95616, USA
*
Author to whom correspondence should be addressed.
Remote Sens. 2020, 12(4), 653; https://doi.org/10.3390/rs12040653
Submission received: 18 December 2019
/
Revised: 11 February 2020
/
Accepted: 13 February 2020
/
Published: 17 February 2020
(This article belongs to the Special Issue Radar Remote Sensing on Life Activities)
Abstract
:Language has been one of the most effective ways of human communication and information exchange. To solve the problem of non-contact robust speech recognition, recovery, and surveillance, this paper presents a speech recovery technology based on a 24 GHz portable auditory radar and webcam. The continuous-wave auditory radar is utilized to extract the vocal vibration signal, and the webcam is used to obtain the fitted formant frequency. The traditional formant speech synthesizer is selected to synthesize and recover speech, using the vocal vibration signal as the sound source excitation and the fitted formant frequency as the vocal tract resonance characteristics. Experiments on reading single English characters and words are carried out. Using microphone records as a reference, the effectiveness of the proposed speech recovery technology is verified. Mean opinion scores show a relatively high consistency between the synthesized speech and original acoustic speech.
1. Introduction
The speech signal, which plays a significant role in daily communication and information exchange, is one of the most vital physiological signals of the human body. Therefore, numerous attempts have been made to investigate speech signal detection technology. The microphone, recognized as one of the most widely used air conduction speech signal detection technologies, has greatly improved the efficiency of human communication [1]. This device can be used in places where speech acquisition is required and has been widely used in social life. The principle of a traditional microphone is to convert the varying pressure on the vibrating diaphragm caused by the acoustic wave into a detectable electrical signal. However, the microphone is easily interfered by various background noises and has a short detection range, which limits the development of air conduction speech detection technology to a certain extent [2].
Different from the traditional microphone, the throat microphone is a contact speech detector that can record clean speech even in the presence of strong background noise [3]. It is a transducer applied to the skin surrounding the larynx to pick up speech signals transmitted through the skin, and hence, it is relatively unaffected by environmental distortions. Another representative non-air conduction detector is a bone conduction microphone [4]. This device obtains the speech signal by picking up the vibration of the vocal cords that is transmitted to the skull. Although these devices can obtain high quality speech signals, they need to be in close contact with the skin of the human subject, which restricts the activities of the user and may even cause discomfort or skin irritation. In the research of non-contact speech signal detection, laser Doppler speech detection technology was proposed [5]. This optical speech detection technology has a good performance in long-distance speech detection [6]. Nevertheless, it is susceptible to environmental influences such as temperature. The respective shortcomings of the above speech detection technologies limits their applications for human speech detection.
In recent years, a new non-contact vital sign detection technology, biomedical radar, has gradually gained attention in fields such as medical monitoring and military applications [7,8,9]. The biomedical radar uses electromagnetic waves as the detection medium. When the electromagnetic waves reach the human body, their phase and frequency are modulated by the tiny movements on the body surface caused by the physiological activity of the human body. Human physiological signals can be obtained after demodulation. In 1971, Caro used continuous wave radar to monitor human respiration for the first time [10], and since then, researchers have begun to apply it to the monitoring of human vital signs. Therefore, the use of radar for speech signal detection has attracted the attention of many researchers.
In [11], a millimeter-wave (MMW) Doppler radar with grating structures was first proposed to detect speech signals. The operating principle was investigated based on the wave propagation theory and equations of the electromagnetic wave. An electromagnetic wave (EMW) radar sensor was developed in 1994 [12]. It was then named glottal electromagnetic microwave sensor (GEMS) and used to measure the motions of the vocal organs during speech such as vocal cords, trachea, and throat [13,14,15]. In [14], the speech phonation mechanism was discussed and a vocal tract excitation model was presented. In 2005, Holzrichter verified through a special set of experiments that the vibration source of the vocal organs detected by the EM radar sensor is mainly the vocal fold [16]. However, the GEMS also needs to be placed close to the mouth or the throat.
In 2010, a 925 MHz speech radar system with a coherent homodyne demodulator was presented for extracting speech information from the vocal vibration signal of a human subject [17]. The results showed that the measured speech radar signals had excellent consistency with the acoustic signals, which validated the speech detection capability of the proposed radar system. In [18], a novel 35.5 GHz millimeter-wave radar sensor with a superheterodyne receiver and high operating frequency was presented to detect speech signals. Based on this radar, this group enhanced the radar speech signals with the proposed Wiener filter method based on the wavelet entropy and bispectrum algorithm by accurately estimating and updating the noise spectrum in terms of whole signal segments [19,20]. Moreover, they proposed a 94 GHz MMW radar system to detect human speech in free space [21,22] and utilized it to detect the vibration signal from human vocal folds [23]. However, the experiments just demonstrated the similarity of the vocal fold vibration frequency detected by the radar, microphone, and vibration measurement sensor. In our previous work, we extracted the time-varying vocal fold vibration frequency of tonal and non-tonal languages. The low relative errors showed a high consistency between the radar-detected time-varying vocal fold vibration and acoustic fundamental frequency [24]. The variational mode decomposition (VMD) was used to obtain the time-varying vocal fold vibration [25]. However, the recovery of speech from vocal fold vibration frequency detected by radar needs to be further explored.
In this paper, a non-contact speech recovery technology based on a 24 GHz portable auditory radar and webcam is proposed: a formant speech synthesizer model is selected to recover speech, using the vocal fold vibration signal obtained by the continuous-wave auditory radar as the sound source excitation and the fitted formant frequency obtained from a webcam as the vocal tract resonance characteristics. We propose a method of extracting the formant frequency from visual kinetic features of lips in pronunciation utilizing the least squares support vector machine (LSSVM). The basic detection, speech synthesis theory, and overall system description are presented in Section 2, followed by the introduction of the radar system and experimental setup in Section 3. The results and discussion are demonstrated in Section 4. Finally, the conclusion is drawn in Section 5.
2. Theory
2.1. Overview
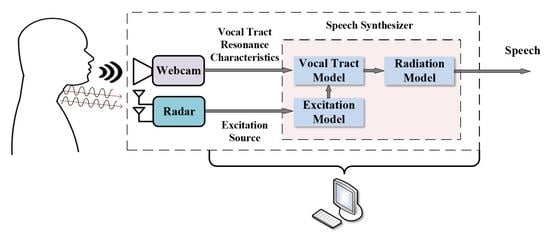
The technology proposed combines a continuous wave auditory radar and webcam system and then realizes speech recovery through the speech synthesis system. The system framework is illustrated in Figure 1.
The system consists of a continuous wave auditory radar system that acquires the vibration of the vocal folds, a webcam that obtains lip motion information, and a speech synthesis system based on the formant speech synthesizer model. The continuous wave radar system emits a continuous wave of 24 GHz, which is reflected by the human throat and received by the receiver. After a series of digital signal processing, the frequency of the time-varying vocal fold vibration is extracted, which is consistent with the acoustic fundamental frequency of speech [24]. The lip motion is obtained by the webcam. There is a mapping relationship between the formant frequency and the motion characteristics of the mouth shape of the speaker [26]. The motion characteristics of the lips of the speaker obtained by the webcam and the formants extracted by the speech recorded by the microphone are used as the input and output training samples in the LSSVM fitting model [27]. The rest of the lip motion characteristics are used as the input testing samples in LSSVM, and the output can be used as the fitted formant frequency, so that the formant of the speech can be obtained without the microphone. Finally, based on the formant speech synthesizer model, speech synthesis is performed based on the vocal fold vibration frequency and formant parameters to achieve speech.
2.2. Radar Detection Theory
During speech, the vibration of vocal folds is a cyclical movement and can be detected by the auditory radar. The detection principle of the auditory radar is phase estimation based on the received signal modulated by the vibration of vocal folds. The fundamental mechanism of auditory radar detection is shown in Figure 2.
The auditory radar sends a normalized single-tone signal as follows:
where f is the carrier frequency and is the phase noise. The echo signal captured by the continuous wave auditory radar can be written as [28]:
where is the distance between the radar and the subject, is the vibration of the vocal folds, and is the wavelength. Since the vibration of the vocal folds is much smaller than the detection distance , the above formula can be approximated as:
The signal received is mixed with the local oscillator to obtain the fundamental frequency signal, and the fundamental frequency signal is orthogonally decomposed to obtain [29]:
where is the constant phase determined by the distance and is the total residual phase noise.
2.3. Formant Fitting Theory
The resonance frequency of a vocal tract is called a formant. The human vocal tract is a resonant cavity, which can be described by a distributed parameter system. The movements of tongue and lips during pronunciation affect the shape and size of the vocal tract, thus changing the resonance frequency. Therefore, it is suggested that kinetic features of lips have a mapping relationship with formants.
Generally speaking, five identifiable formants can be extracted from voiced sounds, but the first three formants are the most important to distinguish speech, which are called the first, second, and third formants in order from low to high, respectively. Formants, different for different sounds, refer to the position of the formant frequency and the bandwidth. The first formant is related to the height of the tongue position and the roundness of the contour of the lips, while the second formant is related to the position of the tongue and the roundness of the contour of the lips. The third formant is not significantly affected by the position of the tongue, but has a greater relationship with the movement of the tip of the tongue [26].
A simple lip model is selected to obtain visual kinetic features of lips from video images. As illustrated in Figure 3, the lip model is described by the periphery height (h) and width (w) of lip. Four kinetic features of lips in pronunciation are taken into account as follows: normalized lip height , normalized lip width , normalized change rate of lip height , and normalized change rate of lip width , with the maximum value of lip width as the normalization factor. These four features are arranged with the time of the image frames of the video to form a set of feature sequences and can be obtained by extracting the contour of lips using image processing algorithms.
Since the uncertainty of the relationship between the formant frequency and the lip motion characteristics is assumed to be nonlinear, we utilized the least squares support vector machine (LSSVM). Support vector machine (SVM) is a machine learning method with a high fitting accuracy and thus more suitable for data processing with small samples. The standard SVM training samples need to solve the quadratic programming problem, making the training speed slower. Suykens J.A.K. proposed LSSVM, using a least squares linear system as the loss function to replace the quadratic programming method used by traditional SVMs [27], which greatly reduced the computational complexity. Furthermore, the model parameters of the LSSVM using the radial basis kernel function were one less than that of a standard SVM using the same kernel function, and the operation speed was significantly faster.
N training samples are given, where are the p-dimensional input training samples and are the output training samples, with . In feature space, the SVM model is [32]:
The objective function of LSSVM is:
where is the error and is the regularization parameter. The constraint condition is:
where is the kernel function.
The Lagrangian optimization method can be used to transform the above optimization problem into:
where is the Lagrange multiplier. It can be obtained through finding the stagnation point of the function that: , , , . By eliminating w and e, the optimization problem is transformed into solving linear equations:
where , and . and b can be obtained by solving the linear equations and the LSSVM model used for function estimation is given as follows:
where is the kernel function.
The radial basis kernel function (RBF) is used as the kernel function in this paper, and its expression is presented as follows:
where represents the width of the kernel parameter.
2.4. Speech Synthesis Theory
The discrete time-domain model of speech signal generation is given in Figure 4. This model, based on a digital signal processing method, is a short-term model because the vocal organs change over time during pronunciation. From the pronunciation mechanism and analysis of the pronunciation organ, we can know that the system of speech generation is divided into three parts, including the excitation system, the vocal tract system, and the radiation system [26]. The excitation system is below the vocal fold and responsible for generating a periodic vibration excitation source, which is also called the glottis subsystem. The vocal tract system is the vocal tract, which is the breathing passage from glottis to lips, and the radiation system is outside lips because speech radiates from lips.
As illustrated in Figure 4, a mathematical model of speech pronunciation is first established. The excitation source can simulate glottis, which is a periodic pulse during the pronunciation of voiced sounds and random noise during the pronunciation of unvoiced sounds, respectively. The acoustic principle shows that the resonance characteristics of the vocal tract model are completely dependent on the shape of the vocal tract. Changing the shape of the oral cavity and the vocal tract is equivalent to changing the parameters of the filter, which represent the resonance characteristics of the vocal tract. The accent and pitch of the synthesis can be changed by adjusting the intensity or period of the excitation source pulse. Therefore, by changing the excitation source and filter parameters, a suitable speech can be synthesized.
In this work, we select the formant model as the vocal tract model, which utilizes the formant parameters as the vocal tract parameters to describe the vocal tract. Within one frame, the excitation signal generated by the excitation source is modulated by several formant filters, which simulate the resonance characteristics of the vocal tract and are transmitted by the radiation model. The filters formed by these parameters can simulate the resonance characteristics. There are three practical models for the theory based on formants. In the cascade formant synthesis model, the formant filters are connected end-to-end. In the parallel model, the input signal is first adjusted by amplitude and then added to each formant filter and the output of each channel is superimposed. Based on these two models, people combined them and proposed a hybrid formant model. Here, we choose a cascade-parallel hybrid formant model with a relatively good synthesis effect, which converts the model into a series-parallel connection of several second-order digital filters. Second-order digital filters not only can accurately describe the characteristics of a single formant, but also have faster and more efficient calculation with the same spectral accuracy. The framework of the hybrid formant synthesizer system is shown in Figure 5.
Two main parameters of the formant are formant frequency F and formant bandwidth . The formant frequency F refers to the area where the energy of the speech is relatively concentrated in the frequency spectrum, that is the resonance frequency of the vocal tract. During the pronunciation of voice sounds, the original resonance amplitude of the sound spectrum is partially enhanced and partially weakened by the modulation of the vocal cavity, forming a new undulating envelope. The positions of the new envelope peaks are the formants, which determine the sound quality. Therefore, the formant frequency is consistent with the resonance frequency of the vocal tract. The formant bandwidth refers to the 3 dB bandwidth of the formant peak position, which is the half-power bandwidth. The tone of speech is different because different formant modes determine different formant parameters. Each set of parameters determines a formant filter so that combining multiple formant filters can simulate the resonance characteristics of the vocal tract. In fact, the formant filter and combination method are fixed, but the parameters of the filter vary for every frame. For any set of formants, the transfer function of the second-order bandpass formant synthesis filter is shown as:
where and describe the poles of the denominator of the filter transfer function, is the frequency, is the bandwidth, and is the gain coefficient that makes the filter response one at the center frequency (). is given as follows:
Therefore, for any set of formants, when the frequency and the bandwidth are known, a second-order bandpass formant synthesis filter can be calculated. By connecting several such second-order digital filters, the resonance characteristics of the vocal tract can be simulated
3. Experimental Setup
The photographs of the 24 GHz auditory radar from the front side and the right-hand side are illustrated in Figure 6. Figure 6a shows a pair of 4 × 4 antenna arrays designed to enhance directivity with an antenna directivity of 19.8 dBi. The antenna arrays included an RF front-end fabricated and integrated on a Rogers RT/duroid 5880 microwave substrate, thereby reducing the overall size of the device to 11.9 cm × 4.4 cm. The baseband board was integrated into the substrate, which supported the RF board as given in Figure 6b. A power interface was placed in the microcontroller unit (MCU) board, which cascaded the baseband board to power the entire probe.
In order to ensure the high sensitivity of the vocal fold frequency detection of this system, this system used a continuous wave of 24 GHz as the transmitted signal waveform, which had a µm-scale motion detection sensitivity [33]. The key parameters of the auditory radar are shown in Table 1. The radio frequency signal was transmitted through the transmitting antenna and acted as a local oscillator (LO) for the mixer of the signal receiving chain, as well. At the receiver, the received echo signal was first amplified by two-stage low-noise amplifiers (LNAs). Compared with existing 24 GHz integrated mixer chips, a cost-effective six port structure was used here. The output of the six port down-converter was a differential quadrature signal, which was amplified by two differential amplifiers to produce a baseband I/Q signal. The received RF gain and baseband gain were 34 dB and 26 dB, respectively. The baseband signal was fed to a 3.5 mm audio jack, which could be easily connected to the audio interface of a laptop or smartphone to process the signal in real time.
Ten volunteers including 4 females and 6 males (from 22 to 28 years old) without any phonation disorders were selected as experimental volunteers. The details of those volunteers are given in Table 2. The experimental setup is demonstrated in Figure 7. The volunteer was asked to sit on a chair, and the antennas of the 24 GHz auditory radar faced the throat of the volunteer at a distance of 50 cm. The radar data, sampled at a frequency of 44,100 Hz, were then transmitted over a wired link to a laptop and stored on it. At the same time, a cellphone (iPhone 6s) with webcam and microphone embedded was placed 80 cm away from the volunteer to capture videos of lips and the acoustic signal for comparison with the auditory radar.
To guarantee high quality signals, the volunteer was required to remain seated and read specified characters or words in a quiet indoor laboratory environment during the experiment. In this paper, 8 English letters including “A”, “B”, “C”, “D”, “E”, “I”, “O”, and “U” and two words “boy” and “hello” were selected, and each of the words was recorded 10 times by both the radar and webcam. The experimental data were processed within MATLAB and Praat: doing phonetics by computer. Praat is a cross-platform multi-functional phonetics professional software for analyzing, labeling, processing, and synthesizing digital voice signals and generating various languages and text reports.
4. Results and Discussion
4.1. Vocal Fold Vibration Extraction
First, the auditory radar was used to detect the vibration frequency of vocal folds, which was verified as the fundamental frequency of the speech signals [24]. The radar-detected time-domain signal was decomposed by the VMD after filtering and segmentation as in our previous work [24]. Praat was used to extract the microphone-detected fundamental frequency for comparison, which is known as one of the most accurate methods in speech signal processing. Figure 8a presents the comparison between auditory radar-detected time-varying vocal fold vibration and the acoustic fundamental frequency values of the character “A”. It was illustrated that the vocal cord vibration frequency detected by the radar was about 180 Hz, and the trend of the envelope was consistent with the acoustic fundamental frequency values. The comparative result of the word “boy” is shown in Figure 8b. Similarly, the radar-detected frequency closely matched the microphone-detected one. The observed fluctuation of instantaneous frequencies indicated the frequency deviation of the diphthong in this word. Here, we define the deviation degree of the acoustic fundamental frequency values as relative error:
where means the radar-detected vibration frequency and is the acoustic fundamental frequency at the moment , . The relative errors of the fundamental frequency are shown in Table 3. From this table, we find that the relative errors of the characters and words tested were below 10%. Compared with our previous work in [24], the number of participants in the experiments increased from two to 10, and the results were similar. The low relative errors showed a high consistency between the radar-detected vibration and acoustic fundamental frequency. In addition, the duration of these English characters and words are given in the table to illustrate the difference between characters and words.
4.2. Formant Frequency Fitting
Videos recorded of 10 subjects reading characters and words were segmented by the silent segments and the voiced segments of the audio signal. There is a simple relationship between three components of red-green-blue (RGB) color space to separate lip region from skin region [34]. We could perform a set of operations on the three components of RGB. The R (red) component and the B (blue) component were subtracted from the G (green) component and then added as:
where , , and are the R, G, and B components in the RGB image, and as a result, f had a good performance in distinguishing lip and skin.
Then, lip movement images obtained from voiced segments of videos were binarized, and miscellaneous points were wiped off to extract the contour of the outer lip. Video image processing can obtain visual information such as color, brightness, and outline from the image of each frame. In addition to visual information, motion information can also be extracted from the difference between continuous frames. Four sets of lip motion features (, , , ) during phonation were arranged with the time of the frames of the video to form a set of feature sequences. The set of feature sequence packets preserved the chronological relationship of the frames, as well as the global motion relationship of the video frames. Sixty percent of these features were used as the input samples, and the corresponding four microphone-detected formants were used as the output samples in LSSVM training. The remaining 40% of these lip movements features were used as the input testing samples, and the output was the fitted formants.
The performance and convergence of LSSVM model seriously depended on the input and parameters. When establishing the LSSVM prediction model, the regularization parameter and kernel parameter had a great influence on the performance of the model. If the value of the regularization parameter was small, the penalty on the sample data was small, which made larger training errors and strengthened the generalization ability of the algorithm. If the value of was large, the corresponding weight was small, and the generalization ability of the algorithm was poorer. When using a Gaussian kernel function, a small value of would cause over-learning of sample data, and a too large value would cause under-learning of sample data. In this paper, the determination of these two parameters was based on cross-validation and experience: and .
Four sets of formants fitted by LSSVM were compared with acoustic formants extracted by speech signal processing software Praat, and the results of the word “a” and “boy” are presented in Figure 9. Figure 9 indicates that although some fitted values were not very close to the acoustic ones, the trend of fitted formants was consistent with the trend of the formant frequency of the original speech when the word was pronounced. Figure 9a shows the fitted formants of “a”, and since it was a monophthong without any changes of tone and pitch, the fitter effect was slightly better than that of the word “boy” illustrated in Figure 9b. The acoustic formants of “boy” extracted by Praat had some discontinuities, and the LSSVM fitting results could not fit the drastic transition of them.
There are various reasons for the disagreement appearing in the comparisons of Figure 9. Although Praat is a classic and widely used tool to extract the formant frequencies in speech signal processing, there are inherent errors. As presented in Figure 9, the acoustic formants extracted by Praat had some discontinuities, and the formants in higher orders may have been mistaken as formants in lower orders, which showed the inaccuracy in extracting formants. Hence, the trained model may have had large errors locally when fitting the formants of the testing data. However, for a specific sound, the fitted formant frequencies were within a reasonable range. These errors would not have much effect on the final speech synthesis and the recognition of the synthesized sound. Furthermore, since the formant was not completely determined by the shape of lip, the formant fitting was relatively inaccurate due to the lack of information. The effect of fitting needed to be judged by the effect of speech synthesis.
It can be seen from Table 4 that there was a certain error between the frequency of the fitted formant and the frequency of the formant extracted from the original speech. The error of the first formant of “E” in the table is significantly larger than the others because when the tester was pronouncing the English letter “E”, the first formant frequency was about 200–300 Hz, which was much lower than the first formant frequency of other letters. Compared with other letters, the denominator was smaller when calculating the relative error, and therefore, the first formant of “E” was relatively larger than the others. The formant frequency was within a reasonable range, and the fitting effects needed to be evaluated by the speech synthesis results.
4.3. Speech Synthesis
Since the speech recovery technology introduced in this paper was based on the time-varying vocal fold vibration frequency obtained by auditory radar as the excitation source of speech synthesis, we chose the extracted time-varying vocal fold vibration period as the pitch period excitation, white noise as the consonant excitation, and the fitted formant frequency extracted by the webcam as the vocal tract resonance characteristics to synthesize speech [26]. Rabiner proposed to add a high-frequency peak as compensation when using the formant parameters for speech synthesis [35]. Here, the fourth formant was selected as a fixed value with a center frequency of 3500 Hz and a bandwidth of 100 Hz. For the bandwidths of the other three formants, we took fixed values Hz, Hz, Hz. From the resonance frequency and bandwidth, the second-order filter coefficients could be calculated. In order to make the synthesized sound more natural, we calculated the energy of each frame of speech to adjust the amplitude of the synthesized speech and make the energy of each frame of synthesized speech the same as the frame energy of the original speech. In the overlapping part between frames, a linear proportional overlap addition method was used. Several audio files of the synthesized speech are presented in the Supplementary Materials.
Figure 10 shows the detection results of the microphone system and the radar system for the English character “A”, which were compared with the synthesized speech. Figure 10a–c presents the time-domain waveform of the microphone, the time-domain waveform of the radar after filtering and segmentation, and the time-domain waveform of the synthesized speech, respectively. Figure 10d–f depicts the spectrogram of the signals detected by the microphone, radar, and synthesized speech, respectively. As shown in Figure 10a–c, compared to the microphone-detected and radar-detected signals, the synthesized speech signals lost a part of the high-frequency components, which could also be seen in Figure 10d–f. The fundamental frequency in Figure 10d–f is similar, while the high-frequency components and energy distributions are different. As illustrated, there are multiple frequencies in both Figure 10d,f, and the energy was mainly distributed at about 200–400 Hz, 2000–2200 Hz, and 3000–3800 Hz. A similar distribution of the energy in Figure 10d,f showed the effect of the fitted formants. Unlike Figure 10d,e only has a few low-frequency components, which made the radar-detected signals unable to be distinguished. Although the synthesized speech could be recognized successfully as English letters, the change of the timbre of the synthesized speech was not obvious, and the speech was a little unnatural from the perspective of hearing, which may be ascribed to the difference between the high-frequency components of the microphone-detected result in Figure 10d and synthesized speech in Figure 10f.
Figure 11 depicts the detection results of the microphone system and the radar system for the English word “boy”, which were compared with the synthesized speech. Like Figure 10, Figure 11a–c shows the loss of high-frequency components in the time-domain synthesized speech waveform. Figure 11d–f illustrates that in the spectrograms, microphone-detected, radar-detected, and synthesized speech were consistent in their distribution patterns. The similar distribution change of the energy in Figure 11d,f showed a high consistency between acoustic and fitted formants. The increase and decrease of frequencies presented by distribution patterns indicated the frequency deviation of the diphthong in this word. Furthermore, there were differences between Figure 11d,f in high frequencies.
The mean opinion score (MOS) is a subjective measurement and probably the most widely adopted and the simplest procedure in evaluating speech quality [36]. In this paper, MOS tests were conducted such that the 10 volunteers were asked to assess and compare the results of the synthesized speech and the original speech. The full score was five points according to the following criteria: 1: unqualified; 2: qualified; 3: medium; 4: good; 5: excellent. The assessor was required to listen to the synthesized speech every five minutes to avoid psychological cues caused by continuous testing. The evaluation results are shown in Figure 12, and the effect of the synthesized speech obtained by the speech restoration system of this paper was satisfactory.
5. Conclusions
In our former work, the vibration of vocal folds was extracted by the continuous-wave radar based on VMD, which was consistent with the fundamental frequency of the original speech. However, little has been done to recognize and recover the original speech directly using the vibration of vocal folds. Therefore, in this article, we proposed a non-contact speech recovery technology based on a 24 GHz portable auditory radar and webcam, using the vocal fold vibration signal obtained by the continuous-wave auditory radar as the sound source excitation and the fitted formant frequency obtained by the webcam as the vocal tract resonance characteristics to recover speech through the formant speech synthesizer model. The LSSVM fitting model was utilized based on the mapping relationship between mouth shape motion characteristics and formant frequency when the speaker pronounces, with the motion characteristics of lip during pronunciation as the input training and testing samples and the first four formants as the output training and testing samples, respectively. The output results were compared with the formant frequencies of the speech, and they were similar and feasible within a certain range. Then, the speech synthesis was conducted based on the formant speech synthesizer. Experiments and results were presented using the radar, webcam, and microphone. The MOS evaluation results of the proposed technology showed a relatively high consistency between acoustic and synthesized speech, which enables potential applications in robust speech recognition, restoration, and surveillance.
Supplementary Materials
The following are available at https://www.mdpi.com/2072-4292/12/4/653/s1.
Author Contributions
Conceptualization, Y.M. and H.H.; methodology, Y.M., H.H., and H.Z.; software, Y.M., H.L., and H.Z.; validation, Y.M., H.L., and H.Z.; data curation, Y.M., Y.L., and L.S.; writing, original draft preparation, Y.M.; writing, review and editing, Y.M., H.H., and C.G.; funding acquisition, H.H. and X.Z. All authors have read and agreed to the published version of the manuscript.
Funding
This work was supported in part by the National Natural Science Foundation of China under Grants 61871224 and 81601568, in part by the Key Research and Development Plan of Jiangsu Province under Grant BE2018729, and in part by the Fundamental Research Funds for the Central Universities under Grant 30917011316.
Conflicts of Interest
The authors declare no conflict of interest.
References
- Wente, E.C. A Condenser Transmitter as a Uniformly Sensitive Instrument for the Absolute Measurement of Sound Intensity. Phys. Rev. 1917, 10, 39–63. [Google Scholar] [CrossRef] [Green Version]
- Scheeper, P.R.; Donk, A.G.H.V.D.; Olthuis, W.; Bergveld, P. A review of silicon microphones. Sens. Actuators A (Phys.) 1994, 44, 1–11. [Google Scholar] [CrossRef] [Green Version]
- Shahina, A.; Yegnanarayana, B. Language identification in noisy environments using throat microphone signals. In Proceedings of the 2005 International Conference on Intelligent Sensing & Information Processing, Chennai, India, 4–7 January 2005; pp. 400–403. [Google Scholar]
- Tran, P.; Letowski, T.; McBride, M. Bone conduction microphone: Head sensitivity mapping for speech intelligibility and sound quality. In Proceedings of the 2008 International Conference on Audio, Language and Image Processing, Shanghai, China, 7–9 July 2008; pp. 107–111. [Google Scholar]
- Li, W.; Liu, M.; Zhu, Z.; Huang, T.S. LDV Remote Voice Acquisition and Enhancement. In Proceedings of the 18th International Conference on Pattern Recognition, Hong Kong, China, 20–24 August 2006; pp. 262–265. [Google Scholar]
- Shang, J.; He, Y.; Liu, D.; Zang, H.; Chen, W. Laser Doppler vibrometer for real-time speech-signal acquirement. Chin. Opt. Lett. 2009, 7, 732–733. [Google Scholar] [CrossRef]
- Chen, K.; Huang, Y.; Zhang, J.; Norman, A. Microwave life-detection systems for searching human subjects under earthquake rubble or behind barrier. IEEE Trans. Biomed. Eng. 2000, 47, 105–114. [Google Scholar] [CrossRef] [PubMed]
- Mikhelson, I.V.; Lee, P.; Bakhtiari, S.; Elmer, T.W.; Katsaggelos, A.K.; Sahakian, A.V. Noncontact Millimeter-Wave Real-Time Detection and Tracking of Heart Rate on an Ambulatory Subject. IEEE Trans. Inf. Technol. Biomed. 2012, 16, 927–934. [Google Scholar] [CrossRef] [PubMed]
- Zhao, H.; Hong, H.; Sun, L.; Xi, F.; Li, C.; Zhu, X. Accurate DC offset calibration of Doppler radar via non-convex optimisation. Electron. Lett. 2015, 51, 1282–1284. [Google Scholar] [CrossRef]
- Caro, C.G.; Bloice, J.A. Contactless apnoea detector based on radar. Lancet 1971, 298, 959–961. [Google Scholar] [CrossRef]
- Li, Z. Millimeter Wave Radar for detecting the speech signal applications. Int. J. Infrared Millim. Waves 1996, 17, 2175–2183. [Google Scholar] [CrossRef]
- McEwan, T.E. Ultra-Wideband Radar Motion Sensor; Google Patents: Washington, DC, USA, 1994. [Google Scholar]
- Holzrichter, J.F. Speech articulator measurements using low power EM-wave sensors. J. Acoust. Soc. Am. 1998, 103, 622. [Google Scholar] [CrossRef]
- Burnett, G.C.; Holzrichter, J.F.; Ng, L.C.; Gable, T.J. The use of glottal electromagnetic micropower sensors (GEMS) in determining a voiced excitation function. J. Acoust. Soc. Am. 1999, 106, 2183–2184. [Google Scholar] [CrossRef]
- Ng, L.C.; Burnett, G.C.; Holzrichter, J.F.; Gable, T.J. Denoising of human speech using combined acoustic and EM sensor signal processing. In Proceedings of the 2000 IEEE International Conference on Acoustics, Speech, and Signal Processing, Istanbul, Turkey, 5–9 June 2000; pp. 229–232. [Google Scholar]
- Holzrichter, J.F.; Ng, L.C.; Burke, G.J.; Champagne, N.J.; Kallman, J.S.; Sharpe, R.M. Measurements of glottal structure dynamics. J. Acoust. Soc. Am. 2005, 117, 1373–1385. [Google Scholar] [CrossRef] [PubMed]
- Lin, C.; Chang, S.; Chang, C.; Lin, C.C. Microwave Human Vocal Vibration Signal Detection Based on Doppler Radar Technology. IEEE Trans. Microw. Theory Tech. 2010, 58, 2299–2306. [Google Scholar] [CrossRef]
- Jiao, M.; Lu, G.; Jing, X.; Li, S.; Li, Y.; Wang, J. A Novel Radar Sensor for the Non-Contact Detection of Speech Signals. Sensors 2010, 10, 4622–4633. [Google Scholar] [CrossRef] [PubMed] [Green Version]
- Jiao, M.; Lou, L.; Hu, J.; Geng, X.; Zhang, W.; Zhang, P. A new speech enhancement algorithm for millimeter-wave radar speech sensor. Microw. Opt. Technol. Lett. 2014, 56, 1184–1189. [Google Scholar] [CrossRef]
- Tian, Y.; Li, S.; Lv, H.; Wang, J.; Jing, X. Smart radar sensor for speech detection and enhancement. Sens. Actuators A Phys. 2013, 191, 99–104. [Google Scholar] [CrossRef]
- Chen, F.; Li, C.; An, Q.; Liang, F.; Qi, F.; Li, S.; Wang, J. Noise Suppression in 94 GHz Radar-Detected Speech Based on Perceptual Wavelet Packet. Entropy 2016, 18, 265. [Google Scholar] [CrossRef] [Green Version]
- Chen, F.; Li, S.; An, Q.; Zhang, Z.; Wang, J. Advancements in Bio-radar Speech Signal Detection Technology. J. Radars 2016, 5, 477–486. [Google Scholar]
- Chen, F.; Li, S.; Zhang, Y.; Wang, J. Detection of the Vibration Signal from Human Vocal Folds Using a 94-GHz Millimeter-Wave Radar. Sensors 2017, 17, 543. [Google Scholar] [CrossRef] [Green Version]
- Hong, H.; Zhao, H.; Peng, Z.; Li, H.; Gu, C.; Li, C.; Zhu, X. Time-Varying Vocal Folds Vibration Detection Using a 24 GHz Portable Auditory Radar. Sensors 2016, 16, 1181. [Google Scholar] [CrossRef] [Green Version]
- Dragomiretskiy, K.; Zosso, D. Variational Mode Decomposition. IEEE Trans. Signal Process. 2014, 62, 531–544. [Google Scholar] [CrossRef]
- Zhao, L. Speech Signal Processing; Mechanical Industry Press of China: Beijing, China, 2009; Volume 3, pp. 56–62. [Google Scholar]
- Suykens, J.A.K.; Validewalle, J. Least Squares Support Vector Machine Classifiers. Neural Process. Lett. 1999, 9, 293–300. [Google Scholar] [CrossRef]
- Droitcour, A.D.; Boric-Lubecke, O.; Lubecke, V.M.; Lin, J.; Kovacs, G.T.A. Range correlation and I/Q performance benefits in single-chip silicon Doppler radars for noncontact cardiopulmonary monitoring. IEEE Trans. Microw. Theory Tech. 2004, 52, 838–848. [Google Scholar] [CrossRef]
- Gu, C.; Li, C. Assessment of Human Respiration Patterns via Noncontact Sensing Using Doppler Multi-Radar System. Sensors 2015, 15, 6383–6398. [Google Scholar] [CrossRef] [PubMed] [Green Version]
- Li, C.; Lubecke, V.M.; Boric-Lubecke, O.; Lin, J. A Review on Recent Advances in Doppler Radar Sensors for Noncontact Healthcare Monitoring. IEEE Trans. Microw. Theory Tech. 2013, 61, 2046–2060. [Google Scholar] [CrossRef]
- Costanzo, S. Software-Defined Doppler Radar Sensor for Human Breathing Detection. Sensors 2019, 19, 3085. [Google Scholar] [CrossRef] [Green Version]
- Suykens, J.A.K.; Validewalle, J. Recurrent least squares support vector machines. IEEE Trans. Circuits Syst. I Fundam. Theory Appl. 2000, 47, 1109–1114. [Google Scholar] [CrossRef]
- Gu, C.; Inoue, T.; Li, C. Analysis and Experiment on the Modulation Sensitivity of Doppler Radar Vibration Measurement. IEEE Microw. Wirel. Compon. Lett. 2013, 23, 566–568. [Google Scholar] [CrossRef]
- Ghaleh, V.E.C.; Behrad, A. Lip contour extraction using RGB color space and fuzzy c-means clustering. In Proceedings of the 2010 IEEE 9th International Conference on Cyberntic Intelligent Systems, Reading, UK, 1–2 September 2010. [Google Scholar]
- Ackroyd, M.H. Digital Processing of Speech Signals. Electron. Power 1978, 25, 290. [Google Scholar] [CrossRef]
- Salza, P.L.; Foti, E.; Nebbia, L.; Oreglia, M. MOS and Pair Comparison Combined Methods for Quality Evaluation of Text-to-Speech Systems. Acta Acust. United Acust. 1996, 82, 650–656. [Google Scholar]
Figure 1.
System framework of the technology.

Figure 2.
Mechanism of auditory radar detection.

Figure 3.
Lip model diagram.

Figure 4.
Discrete time-domain model of speech signal generation.

Figure 5.
Hybrid formant synthesizer system.

Figure 6.
Photographs of the 24 GHz auditory radar from (a) front side and (b) right-hand side.

Figure 7.
Experimental setup.

Figure 8.
The auditory radar-detected time-varying vocal fold vibration frequency of the English letter and word (a) “a” and (b) “boy”, respectively. The “×” symbols represent the acoustic fundamental frequency values.
Figure 8.
The auditory radar-detected time-varying vocal fold vibration frequency of the English letter and word (a) “a” and (b) “boy”, respectively. The “×” symbols represent the acoustic fundamental frequency values.

Figure 9.
Comparison between the original acoustic formant and the synthesized formant frequency of the English letter and word (a) “a” and (b) “boy”, respectively. The green, red, blue, and orange “*” symbols represent the first, second, third, and fourth original formant frequency, respectively. The green, red, blue, and orange lines represent the first, second, third, and fourth fitted formant frequency, respectively.

Figure 10.
Speech recovery results for the English letter “A”. (a) Waveform of the original speech signal; (b) waveform of the radar signal; (c) waveform of the synthesized speech signal; (d) spectrogram of the original speech signal; (e) spectrogram of the radar signal; (f) spectrogram of the synthesized speech signal.

Figure 11.
Speech recovery results for the English word “boy”. (a) Waveform of the original speech signal; (b) waveform of the radar signal; (c) waveform of the synthesized speech signal; (d) spectrogram of the original speech signal; (e) spectrogram of the radar signal; (f) spectrogram of the synthesized speech signal.

Figure 12.
mean opinion score (MOS) results of synthesized speech.


Table 1.
Key parameters of the radar.
| Transmit Power | Receive RF Gain | Baseband Gain | Antenna Directivity | DC Power |
|---|---|---|---|---|
| 8 dBm | 34 dB | 26 dB | 19.8 dbi | 1.1 W |
Table 2.
Human subject volunteers in the experiment.
| Subject | Gender | Age | Height (m) | Weight (kg) | BMI (kg/m2) |
|---|---|---|---|---|---|
| N1 | female | 25 | 1.65 | 56 | 20.6 |
| N2 | female | 24 | 1.62 | 53 | 20.2 |
| N3 | female | 26 | 1.68 | 64 | 22.7 |
| N4 | female | 23 | 1.58 | 48 | 19.2 |
| N5 | male | 23 | 1.70 | 60 | 20.8 |
| N6 | male | 24 | 1.82 | 67 | 20.2 |
| N7 | male | 22 | 1.72 | 75 | 25.3 |
| N8 | male | 26 | 1.72 | 75 | 25.3 |
| N9 | male | 28 | 1.73 | 72 | 24.0 |
| N10 | male | 24 | 1.76 | 70 | 22.6 |
Table 3.
The relative errors of fundamental frequency of the tested English characters and words.
| Character/Word | A | B | C | D | E | I | O | U | Boy | Hello |
|---|---|---|---|---|---|---|---|---|---|---|
| Duration (s) | 0.52 | 0.76 | 0.51 | 0.66 | 0.51 | 0.56 | 0.49 | 0.38 | 0.66 | 0.78 |
| Relative error | 3.42% | 4.75% | 2.37% | 4.16% | 4.45% | 3.74% | 2.67% | 4.28% | 6.46% | 9.58% |
Table 4.
Relative errors of the formant frequency for the tested English letters and words.
| Character/Word | A | B | C | D | E | I | O | U | Boy | Hello |
|---|---|---|---|---|---|---|---|---|---|---|
| Duration (s) | 0.44 | 0.76 | 0.41 | 0.66 | 0.51 | 0.56 | 0.29 | 0.38 | 0.66 | 0.78 |
| First formant | 10.83% | 6.87% | 7.63% | 13.44% | 49.23% | 8.42% | 5.43% | 4.65% | 17.33% | 15.18% |
| Second formant | 13.92% | 10.35% | 10.50% | 15.19% | 14.63% | 9.71% | 18.25% | 7.79% | 19.43% | 19.33% |
| Third formant | 2.24% | 5.92% | 4.42% | 7.47% | 10.53% | 6.75% | 4.33% | 5.66% | 15.78% | 14.82% |
| Fourth formant | 5.54% | 7.83% | 7.41% | 9.50% | 12.47% | 7.92% | 6.67% | 9.73% | 12.51% | 14.26% |
© 2020 by the authors. Licensee MDPI, Basel, Switzerland. This article is an open access article distributed under the terms and conditions of the Creative Commons Attribution (CC BY) license (http://creativecommons.org/licenses/by/4.0/).
Share and Cite
MDPI and ACS Style
Ma, Y.; Hong, H.; Li, H.; Zhao, H.; Li, Y.; Sun, L.; Gu, C.; Zhu, X. Non-Contact Speech Recovery Technology Using a 24 GHz Portable Auditory Radar and Webcam. Remote Sens. 2020, 12, 653. https://doi.org/10.3390/rs12040653
AMA Style
Ma Y, Hong H, Li H, Zhao H, Li Y, Sun L, Gu C, Zhu X. Non-Contact Speech Recovery Technology Using a 24 GHz Portable Auditory Radar and Webcam. Remote Sensing. 2020; 12(4):653. https://doi.org/10.3390/rs12040653
Chicago/Turabian StyleMa, Yue, Hong Hong, Hui Li, Heng Zhao, Yusheng Li, Li Sun, Chen Gu, and Xiaohua Zhu. 2020. "Non-Contact Speech Recovery Technology Using a 24 GHz Portable Auditory Radar and Webcam" Remote Sensing 12, no. 4: 653. https://doi.org/10.3390/rs12040653
Note that from the first issue of 2016, this journal uses article numbers instead of page numbers. See further details here.