Remote Sensing Applications in Monitoring of Protected Areas: A Bibliometric Analysis

1
School of Business, Ludong University, Yantai 264025, China
2
Department of Natural Resources Science, University of Rhode Island, Kingston, RI 02881, USA
3
Institute of Marine Development, Ocean University of China, Qingdao 266100, China
*
Authors to whom correspondence should be addressed.
Remote Sens. 2020, 12(5), 772; https://doi.org/10.3390/rs12050772
Submission received: 22 December 2019
/
Revised: 20 February 2020
/
Accepted: 24 February 2020
/
Published: 28 February 2020
(This article belongs to the Special Issue Remote Sensing Applications in Monitoring of Protected Areas)
Abstract
:The development of remote sensing platforms and sensors and improvement in science and technology provide crucial support for the monitoring and management of protected areas. This paper presents an analysis of research publications, from a bibliometric perspective, on the remote sensing of protected areas. This analysis is focused on the period from 1991 to 2018. For data, a total of 4546 academic publications were retrieved from the Web of Science database. The VOSviewer software was adopted to evaluate the co-authorships among countries and institutions, as well as the co-occurrences of author keywords. The results indicate an increasing trend of annual publications in the remote sensing of protected areas. This analysis reveals the major topical subjects, leading countries, and most influential institutions around the world that have conducted relevant research in scientific publications; this study also reveals the journals that include the most publications, and the collaborative patterns related to the remote sensing of protected areas. Landsat, MODIS, and LiDAR are among the most commonly used satellites and sensors. Research topics related to protected area monitoring are mainly concentrated on change detection, biodiversity conservation, and climate change impact. This analysis can help researchers and scholars better understand the intellectual structure of the field and identify the future research directions.
1. Introduction
In accordance with the International Union for Conversation of Nature (IUCN) [1,2], a protected area (PA) is defined as “a clearly defined geographical space, recognized, dedicated, and managed, through legal or other effective means, to achieve the long-term conservation of nature with associated ecosystem services and cultural values”. In general, PAs are considered to be areas of land or sea, including national parks, national forests, natural reserves, conservation areas, wilderness areas, marine protected areas (MPAs), and wildlife refuges and sanctuaries, that are designated for the conservation of native biological diversity and natural and cultural heritage and significance [3]. Over the past century, the amount and coverage of both terrestrial and marine PAs have markedly increased [4]. As reported by the World Database on Protected Areas [5], as of July 2018, there were 238,563 designated PAs, covering about 14.9% and 7.3% of the Earth’s land and ocean surface areas, respectively. PAs are central to nature conservation efforts with key environmental, social, cultural and economic functions throughout the world [3,6]. In addition, PAs play an important role in biodiversity conservation and ecosystem integrity [7,8,9,10].
Remote sensing refers to the art, science, and technology used for Earth system data acquisition through nonphysical contact sensors or sensor systems mounted on space-borne, airborne, and other types of platforms, data processing and interpretation from automated and visual analysis, information generation using computerized and conventional mapping facilities, and applications of the generated data and information to benefit society and meet its needs. Remote sensing can provide comprehensive geospatial information to map and study PAs at different spatial scales, e.g., high spatial resolution and large area coverage, different temporal frequencies (e.g., daily, weekly, monthly, or annual observations), different spectral properties (e.g., visible, near infrared, or microwave), and spatial contexts (e.g., the immediately adjacent areas of PAs vs. a broader background of land and water bases). Remote sensing is considered to be a cost-effective method to support the monitoring efforts of PAs and has played a vital role in protecting natural resources, ecosystems, and biodiversity [11,12].
In terms of the large-scale observation ability of remote sensing, the technology is becoming a common practice for monitoring the characteristics and change of land surface properties of PAs [13]. For example, remote sensing has been applied to the assessment of night-time lighting within and surrounding global terrestrial PAs and wilderness areas [14], continuous monitoring of the landscape dynamics of national parks by Landsat-based approaches [15,16,17,18,19], the evaluation of forest dynamics within and around the Olympic National Park using time-series Landsat observations [20], and monitoring the wildlife habitat changes in Kejimkujik National Park and the National Historic Site in southern Nova Scotia of the Canadian Atlantic Coastal Uplands Natural Region [21]. One particular advantage that remote sensing can provide for the inventory and monitoring of protected areas is information to better understand the past and current status, the changes that occurred under different impacting factors and management practices, the trends of changes in comparison with those in the adjacent areas, and the implications of changes on ecosystem functions [22,23,24]. Remote sensing has unique advantages in monitoring frontier lands, which are always in remote and difficult-to-reach locations and huge in their area coverage. Different types of remote sensing data have been applied in the study of frontier lands—for example, using hyperspectral and radar data to monitor forests in the Amazon [25,26,27,28,29,30], in Africa [31], and in Siberia [32,33,34,35], and for hydrologic change detection in the lake-rich Arctic region [36,37], along the coastal zones [38,39,40,41], and in MPAs [42].
There have also been several reviews on PA monitoring using remote sensing. For example, Nagendra et al. [43] provided a review of remote sensing for conservation monitoring by assessing PAs, habitat extent, habitat condition, species diversity, and threats. Kachelriess et al. [44] reviewed the application of remote sensing for MPAs management. Gillespie et al. [45] reviewed advances in the spaceborne remote sensing of terrestrial PAs. Willis [11] provided a review of the remote sensing change detection methods employed for the ecological monitoring of United States PAs. The existing reviews have mainly been focused on a certain type of PAs or the monitoring method. There have been no bibliometric analyses of remote sensing applications in the monitoring of PAs.
Bibliometric analysis, introduced by Pritchard (1969), is a mathematical and statistical approach to analyze pertinent literature and understand the global research trends in a specific area [46,47]. Bibliometric analysis methods are frequently used to provide quantitative analyses of academic literature [48], and have been applied to environmental engineering and science, soil science, ecology, food safety, new energy utilization, and other areas. A bibliometric analysis helps identify research gaps and directions in one certain area [49]. In recent years, studies have applied this method to evaluate the research trends of remote sensing and its application in different scientific fields [50,51,52]. For instance, Zhang et al. [53] combined the new index (geographical impact factor) and traditional bibliometric methods to study the global research trends in remote sensing studies. Viana et al. [54] performed a bibliometric analysis to appraise the publication, research trends, and characteristics regarding the application of remote sensing data in human health. Wang et al. used the bibliometric method to study the research status and trends in the remote sensing of crop growth monitoring in China [55]. However, no attempt has been made to evaluate the inventory and monitoring of PAs in the literature using bibliometric analysis methods. In recent years, the number of publications on the remote sensing monitoring of PAs has been increasing. Hence, it is necessary to summarize the current status and development trend in this field. With the help of bibliometric methods, researchers can better understand the current number of publications, what journals these documents are published in, what the influential countries and institutions in this field are, how the research direction of this discipline is developing, etc.
Using a bibliometric approach, this article analyzes the relevant literature specialized in remote sensing applications in PAs. The aims of this work are to (1) summarize the variation in the characteristics of document types, total publication output, subject categories, and source journals; (2) analyze the publication output and international collaboration by countries, institutions, and authors; and (3) reveal the common research topics of PA monitoring research based on a keyword analysis. This research can help us understand the progress in this field and identify the relevant research and application directions.
2. Methodology and Data Collection
The bibliometric indicators analyzed in this research include a number of publications, subject categories, source journals, countries, and institutions, which were all obtained directly from the Web of Science. The Web of Science database can offer various statistics on retrieved papers, including the author, series name, conference name, country/region, document type, editor, fund funding institution, authorization number, group author, language, institution, publication year, research direction, source publication name, and the Web of Science category. Another function of web of science is to “Create a Citation Report”, which can directly generate the total quoted frequency of the retrieved documents, the total quoted frequency of the removed self-cited documents, the quoted documents, the quoted documents of the removed self-cited documents, the average times a document has been cited, and the H-index of each item.
Co-authorship among countries and institutions was also analyzed in this research. Co-authorship mainly analyzes the co-signature of authors in the published paper. If the authors sign their names together in the paper, they are considered to have a cooperative relationship. At present, co-authorship analysis not only focuses on an analysis of researchers, but also includes an analysis of the cooperation between countries and institutions. In the case of the co-authorship analysis, the link strength between countries and institutions indicates the number of publications that two affiliated countries and institutions have co-authored, whereas the total link strength indicates the total strength of the co-authorship links of a given country or institution with other countries and institutions. Similarly, in the case of the co-occurrence analysis, the link strength between the author keywords indicates the number of publications in which two keywords occur together. In order to investigate the development of remote sensing in the field of protection area monitoring, we determined the keywords related to satellite, sensor and remote sensing monitoring method from the results of the co-occurrence keywords.
In this study, the VOSviewer software was utilized to visualize the co-authorship collaboration networks of countries and institutions and produce a keywords co-occurrence analysis. Invented by Van Eck and Waltman (Leiden University) in the Netherlands, VOSviewer is freely available -text mining software for generating bibliometric maps and analyzing trends in the scientific literature [56]. The outstanding feature of VOSviewer is its strong graphic display ability, which is especially suitable for analyzing large-scale sample data. This visualization effect is better than that of other similar analysis software, and the analysis function is more comprehensive. VOSviewer is a robust tool that uses clustering algorithms and functionalities based on the strength of the connections among items to facilitate the analyses of the network. [57]. The VOSviewer software uses a circle and label to represent an element, in which the circle size represents the importance, and circles with the same color belong to the same cluster.
Bibliometric maps are created by VOSviewer. These maps include items such as countries, institutions, and author keywords in the present study. The connection or relation between two items is named a link. The strength of a link indicates the number of publications that two countries or institutions have co-authored in the case of co-authorship links, or the number of publications in which two author keywords occur together in the case of co-occurrence links [46,58]. In the VOSviewer, there are two methods used to calculate link strength: full counting and fractional counting. Full counting means that a co-authored publication is counted with a full weight of one for each co-author, which implies that the overall weight of a publication is equal to the number of authors of the publication. Fractional counting means that a co-authored publication is assigned fractionally to each of the coauthors, with the overall weight of the publication being equal to one. As analyzed by Perianes-Rodriguez et al. (2016), a fractional counting approach is preferable to full counting [59]. Therefore, we chose fractional counting to calculate the link strength.
VOSviewer uses a clustering algorithm to cluster the literature network, which is similar to the network clustering method of Modularity, specifically the maximization formula:
where ci is the cluster of element I, and γ is the resolution of clustering. By adjusting its size, different resolution clustering can be obtained. The larger γ is, the more clustering will be obtained, and the finer the classification will be.
In VOSviewer, the number of clusters is determined by the option “choose threshold”. In the case of a co-authorship analysis, the threshold is the minimum number of documents of a country or an institution. In the case of co-occurrence analysis, the threshold is the minimum number of occurrences of a keyword. We can choose the threshold according to our own needs.
The VOSviewer software has been widely used in bibliometric analyses in many fields. For example, Santos et al. used VOSviewer to map knowledge networks on female entrepreneurship [60]. Sainaghi et al. mapped the co-citation network of journals and authors on the foundations of hospitality performance measurement research using VOSviewer [61]. Sweileh et al. used VOSviewer to visualize map-based bibliometric indicators for the global research output on antimicrobial resistance among uropathogens [62].
The relevant documents were retrieved from the Science Citation Index Expanded (SCI-Expanded) and Social Science Citation Index (SSCI) of the Web of Science database, which is a multidisciplinary database of Thomson Reuters [63]. The following keywords were used to search all archived documents: TS (Topic) = “protected area*” or “natural reserve*” or “conservation area*” or “national park*” or “national forest*” or “marine protected area*” or “wilderness area*” or “frontier land*” or “natural monument*” or “biodiversity conservation” and “remote sensing”. The publications that contained any of those keywords or variants (with*) in their titles, abstracts, and keyword lists were included [48]. The information on title, authors, institution, abstract, keywords, and cited references was downloaded. We set the starting time of this study as 1991, considering that the number of publications under the subject of remote sensing applications in PAs and relevant studies increased significantly after 1991 in professional journals and publications. This is illustrated in Figure 1. The data collection was conducted on 16 November 2019. Until 2018, a total of 4546 records were retrieved as the data for this analysis. Among these records, 3994 papers were focused on the remote sensing monitoring of terrestrial PAs, while the other 552 papers were on MPAs.
3. Results
3.1. General Characteristics and Trends of Publication Outputs
The trend for publications from 1991 to 2018 is illustrated in Figure 1. In general, the number of publications has shown an increasing trend over the years, with small fluctuations between individual years. According to the dates, the evolution of the published article output can be divided into three stages. The first stage extends from 1991 to 2003, with a relatively slow growth period. The second stage features a steady growth period from 2004 to 2011. The third stage is a fast growth period from 2012 to 2018.
The sample documents covered a total of 108 subject categories. The research domain covered a wide variety of themes and disciplines. The top 10 subject categories with more than 200 documents are displayed in Figure 2. The results indicate that environmental sciences ranked first with 1524 publications, followed by remote sensing with 1062 publications, ecology with 946 publications, and imaging science and photographic technology with 652 publications. Multidisciplinary geosciences, physical geography, forestry, biodiversity conservation, water resources, and meteorological and atmospheric sciences were also relevant subject categories.
For the source journals, 739 different journals published papers related to remote sensing for PA monitoring. Table 1 shows the top 20 journals in terms of total relevant publications. Remote Sensing of Environment ranked first, with 256 articles covering 5.63% of the total publications. Remote Sensing ranked second, with 174 articles accounting for 3.83%, while the International Journal of Remote Sensing ranked third, with 153 articles accounting for 3.37%. The ISPRS Journal of Photogrammetry and Remote Sensing, Forest Ecology and Management, and the International Journal of Applied Earth Observation and Geoinformation (ranked 4th, 5th, and 6th places) accounted for 2.38%, 2.11%, and 2.02%, respectively.
3.2. Countries, Institutions, and International Collaboration
According to the retrieved results, the papers covered a total of 153 different countries (or territories, hereafter referred to as “countries” for simplification). The geographical distribution of the top 20 productive countries for the overall study period is shown in Figure 3. The USA ranked first with a dominant output of 1655 papers or a share of 36.41%. China had 619 papers (13.62%) and UK had 479 (10.54%), ranking second and third, respectively. Other top ranked countries are Germany (7.92%), India (7.90%), Australia (7.11%), Canada (6.64%), and Italy (5.65%).
The co-authorship analysis studied a network of the main countries, which is plotted in Figure 4. These countries published more than 60 papers. There were four main clusters formed in the network (Table 2). The USA showed 62,644 citations and a link strength of 634, the UK showed 14,335 citations with a link strength of 241, and China showed 12,906 citations with a link strength of 265, which surpassed all the other clusters. The strongest link strength was evidenced by the USA and China, with a 151.93 link strength, followed by the USA and Canada with a 64.89 link strength, the USA and the UK with a 58.69 link strength, the USA and Germany with a 49.93 link strength, the USA and Australia with a 46.48 link strength, and the USA and Brazil with a 43.59 link strength.
According to the results, 4451 institutions contributed to the analyzed publications. The top 15 research institutions with the largest number of documents are listed in Table 3. By far the most productive institution was the Chinese Academy of Sciences in China, with 296 publications. The University of Maryland was in second place with 118 publications. The Chinese Academy of Sciences also ranked first in number of citations, followed by NASA, University of Maryland, and the U.S. Forest Service.
An institutional cooperation network based on the VOSviewer software for the construction of scientific maps is presented in Figure 5. This figure presents the four clusters of collaboration among the prolific institutions with 35 or more publications. The largest cluster (red) contains nine institutions. All the institutions in the red cluster belong to the USA. The green and blue clusters both contain five institutions. Two of the institutions in the green cluster belong to the Netherlands, and the remaining three are from Australia, the UK and the USA. The blue cluster is composed of three Chinese institutions and two American institutions. The fourth cluster (yellow) includes three institutions from Canada. It can be seen that the cooperation between institutions is mainly focused within the same country or neighboring countries.
3.3. Common Interests in Research Topics
Keywords, a core element of papers, offer a highly summarized form of a paper’s contents. In order to understand the focus areas and development trends of one field, it is necessary to systematically analyze the selection of keywords in relevant studies [64]. Table 4 shows the 20 most frequently used author keywords from 1991 to 2018, including “remote sensing”, “GIS”, “Landsat”, “deforestation”, “LiDAR”, “conservation”, and “biodiversity”, for research on PA monitoring that is concentrated on deforestation and biodiversity conservation.
A statistical analysis of the changes in the author keywords between different stages is beneficial for a comparative analysis of the changes in common research subjects and the development process of PA monitoring studies [19,65,66]. Table 4 separates the development of PA monitoring research into three stages, namely 1991–2003, 2004–2011, and 2012–2018. “Remote sensing“ and “Landsat“ were the most frequently used author keywords and appeared in the top 20 in all three periods. The “MODIS” and “LiDAR” keywords increased in frequency of appearance from 1991 to 2011 and increased further in 2012–2018, which indicates that the platform played a significant important role in PA monitoring. Comparing the three different stages, the keywords rankings changed considerably. The keyword “climate change” began to appear in the top 10 during 2012–2018, which suggests that more attention was being given to climate change on PA research. The research focus of each stage is as follows. The early stage of research focuses on landscape ecological change and human disturbance. The middle stage focuses on the change detection of land cover and land use caused by deforestation. The late stage focuses on the impact of climate change on PAs.
In order to trace the trend of the remote sensing data used in PAs research, the most frequently selected keywords related to satellites and sensors were counted. The top ten are Landsat, MODIS, LiDAR, SPOT, AVHRR, ASTER, IKONOS, PALSAR, Sentinel (Sentinel-1 and Sentinel-2), and WorldView, with low, moderate, or high-resolution sensors. The annual publications of the top ten satellites and sensors are shown in Figure 6. In terms of quantity, Landsat was the most frequently used satellites and sensors type, with 1078 papers, followed by MODIS with 439 papers and LiDAR, with 370 papers. In addition, with the continuous development of remote sensing technology, some new platforms and satellites have emerged and have been applied to monitor PAs in recent years. For example, there were 35 papers on the UAV monitoring of PA, and 26 papers on small satellites from 2001 to 2008.
Based on the co-occurrence analysis, the remote sensing monitoring methods are also counted in Table 5. The remote sensing monitoring methods mainly include classification, time-series analysis, model methods, object-oriented method, visual analysis, direct comparisons, and hybrid methods [67,68]. The classification method holds the first position with 526 papers and 11.57% of the total publications, followed by time-series analysis (288, 6.34%) and model method (159, 3.50%).
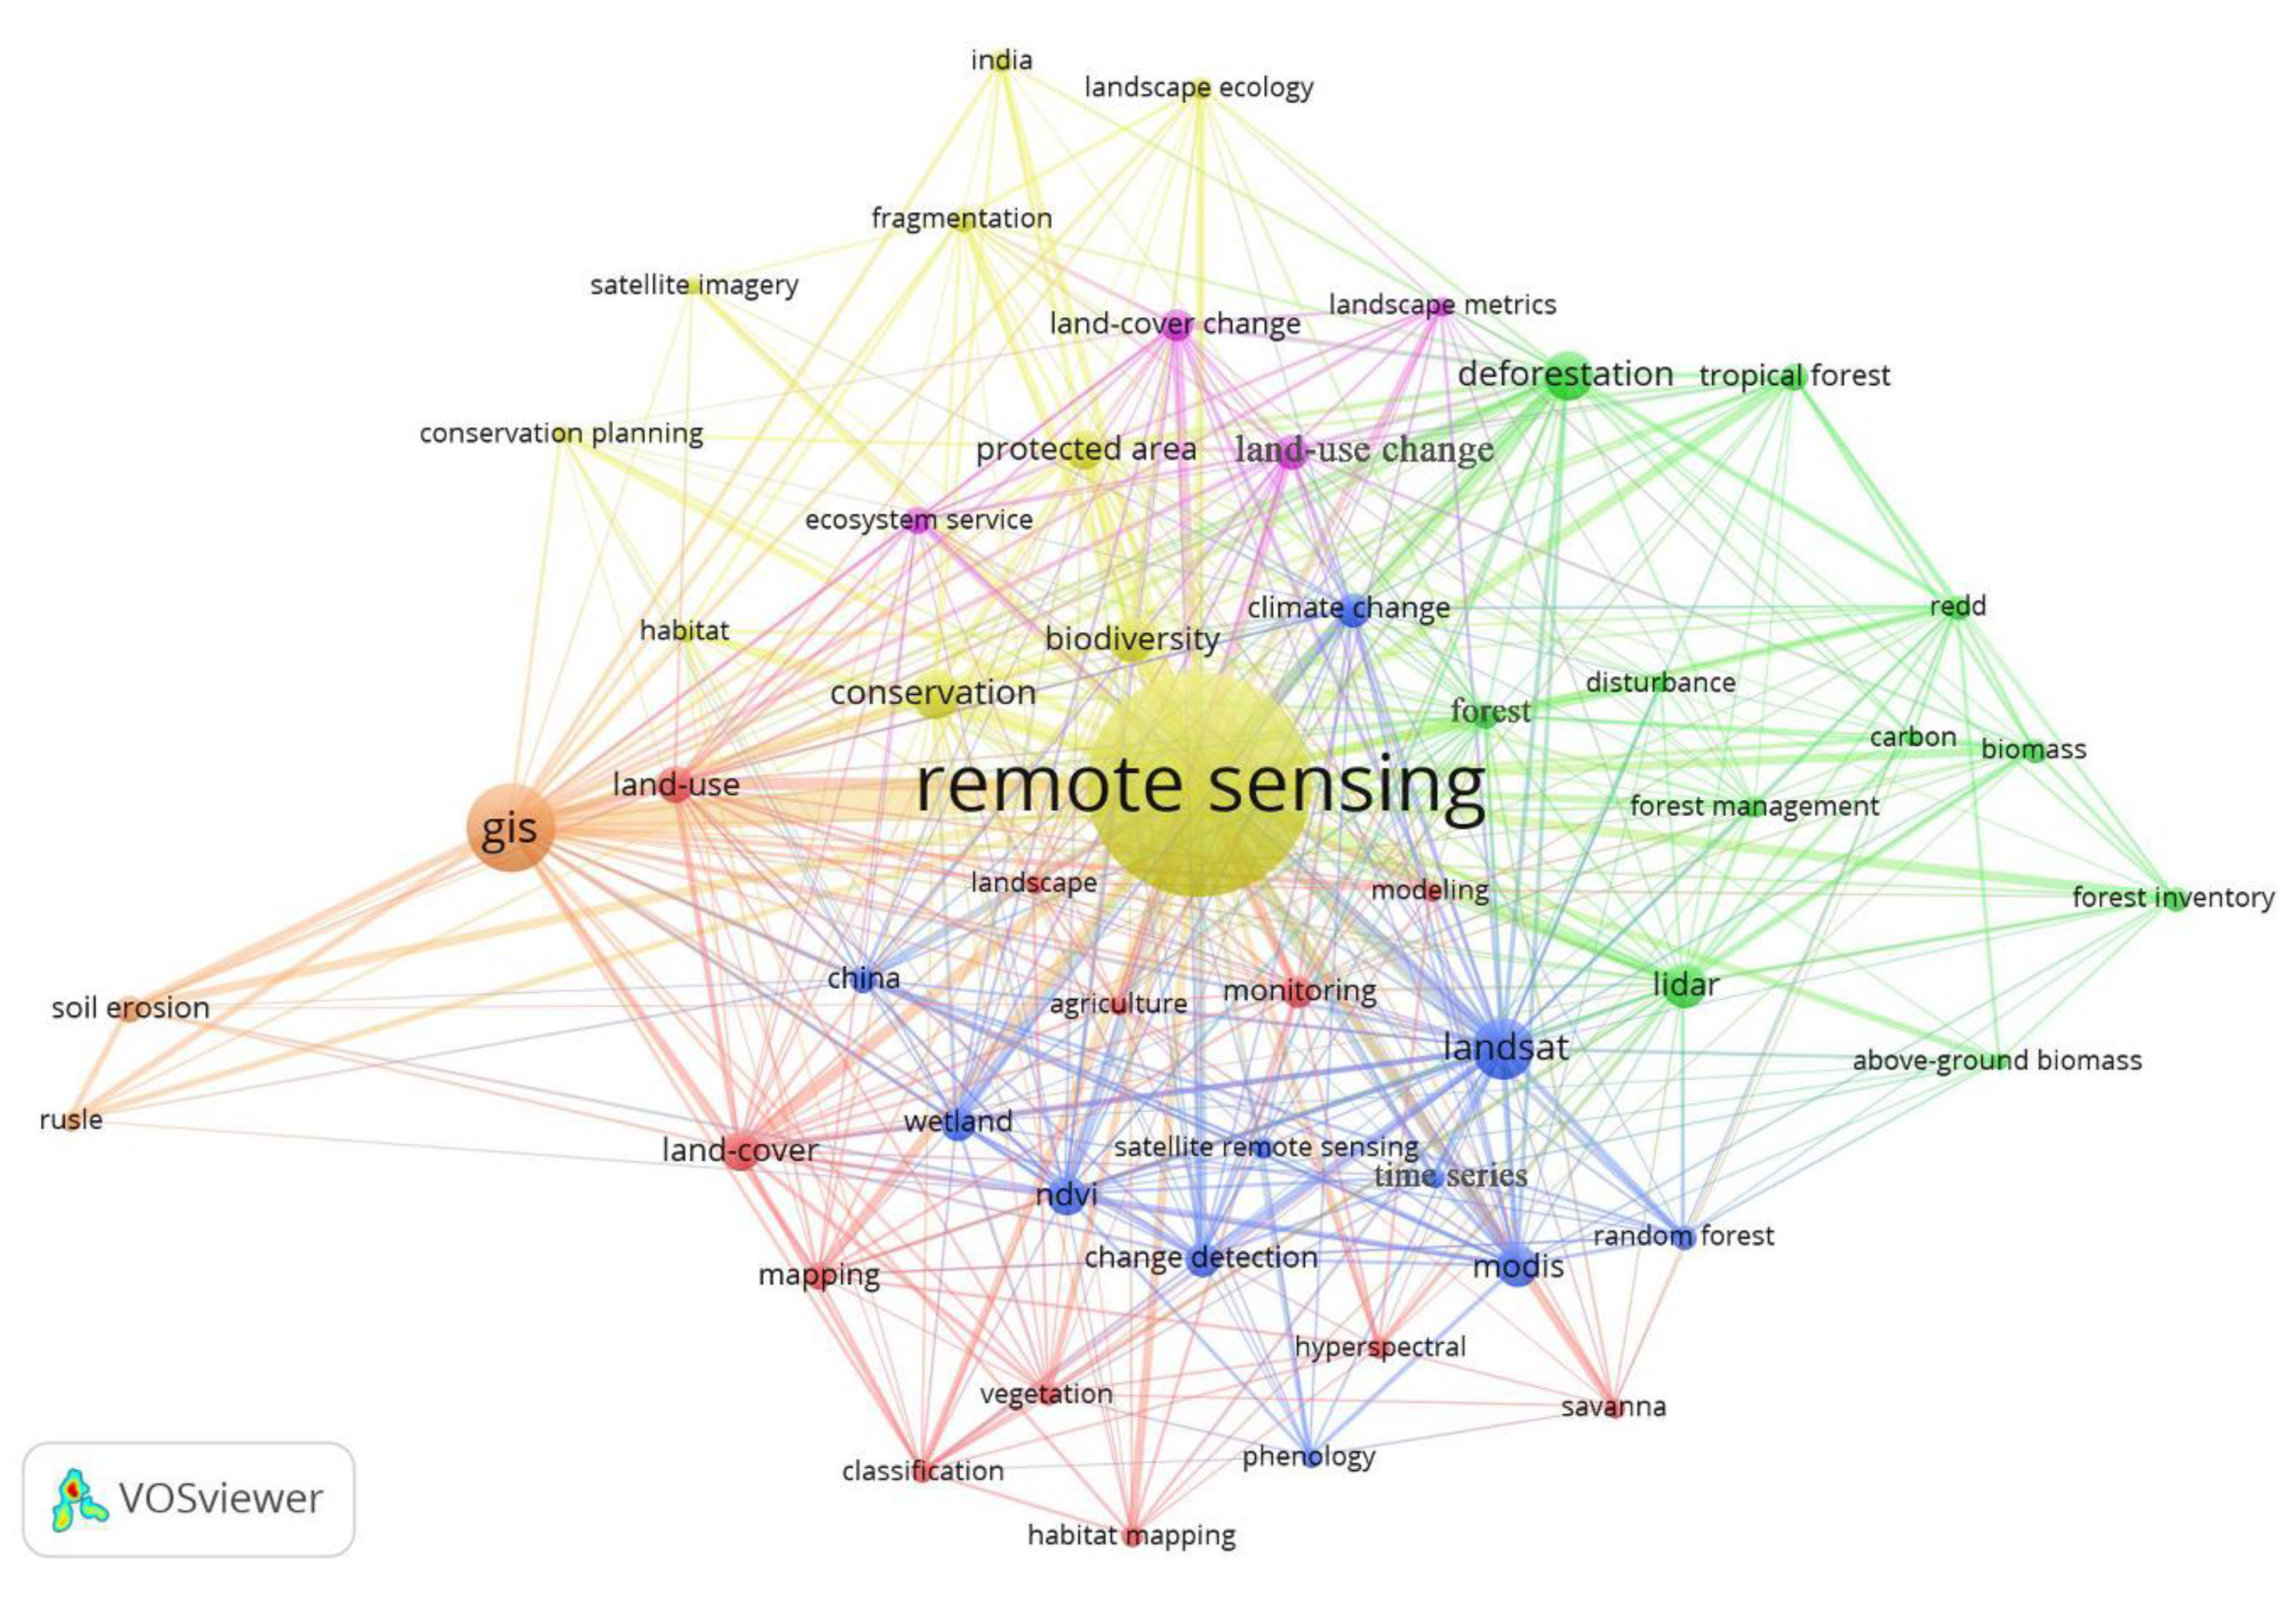
Figure 7 shows a co-occurrence network analysis of the keywords, which can be used to identify the research front in terms of topical trends for PA monitoring. In this analysis, the minimum number of occurrences of a keyword is 30 times for titles and abstracts in all publications. The research theme of PA monitoring has been categorized into six colored clusters, which were analyzed as follows. The red cluster with the highest number of keywords (12) is led by “land cover”; In addition, “land use”, “monitoring”, “mapping”, “hyperspectral”, and “classification” are also the main keywords of this cluster. Most keywords in this cluster are associated with studies on land use and land cover classification using hyperspectral remote sensing data. The blue cluster, with 11 keywords, has “Landsat”, “MODIS”, “NDVI”, “climate change”, “change detection”, and “wetland” as its main related keywords, which appear in the relevant research on the habitat mapping and change detection of PAs, as well as the impact of climate change. The green cluster (11 keywords) focuses on the keywords: “deforestation”, “LiDAR”, “REDD”, “biomass”, “forest inventory”, “tropical forest”, “forest management”, and “carbon”. The keywords of this cluster are closely related to estimating forest biomass and carbon storage in PAs using LiDAR data. The yellow cluster has 10 keywords; the most frequently used is “remote sensing” followed by “conservation”, while “biodiversity”, “protected areas”, and “fragmentation” are ranked 3rd–5th, respectively. Most keywords in this cluster relate to the use of remote sensing to support biodiversity conservation in PAs. The number of keywords in the purple cluster is four, including “land-use change”, “land-cover change”, “ecosystem service”, and “landscape metrics”. This cluster is related to the analysis of land-use/land-cover change and ecosystem service evaluation by remote sensing and landscape metrics. The orange cluster includes only three keywords. The keyword “GIS” appears most frequently, with a total of 387 occurrences. The other two keywords are “soil erosion” and “RUSLE (The Revised Soil Loss Equation)”. This cluster has connections with keywords related to the study of soil erosion and its spatial distribution in PAs using the GIS analysis method.
4. Discussion
In this paper, by retrieving the relevant literature on remote sensing monitoring protected areas, we revealed hidden knowledge underlying this significant body of research. The number of publications shows a trend of continuous growth, demonstrating that more and more scholars have paid attention to this research field. From the perspective of subject categories, environmental sciences ranked first, followed by remote sensing and ecology, which shows that the remote sensing monitoring of PAs is a field closely related to environmental science, remote sensing, and ecology. The top three journals are all well-known journals in the field of remote sensing, include Remote Sensing of Environment, the International Journal of Remote Sensing, and the ISPRS Journal of Photogrammetry and Remote Sensing.
For country of origin, the USA is in the leading position. Moreover, the top 20 countries are mostly European countries. When considering institutions, the Chinese Academy of Sciences published the largest number of papers. The United States has the largest number of research institutions in the top 15, accounting for more than half of them. Through the co-authorship analysis of countries and institutions, this study determined that the USA was at the center of international cooperation, and the cooperation among national research institutions was relatively close, while its international cooperation was relatively less prevalent, which is not conducive to the long-term development of remote sensing monitoring for PAs. Countries and institutions should strengthen their knowledge exchanges and cooperation to more effectively discuss research trends and research status in the research field by holding relevant academic forums and conferences.
The analysis results showed that studies have mainly concentrated on terrestrial PAs, while literature on MPA monitoring is relatively less common. Future research should make full use of new monitoring technology and methods to establish a long-term, scientific, and systematic monitoring system and thereby provide a data-based foundation for evaluating the effectiveness of MPAs. Based on the changes in keywords, it can be seen that remote sensing monitoring of PAs mainly focused on vegetation classification, landscape pattern analysis, biodiversity protection, and the monitoring of changes in PAs. Future research trends will focus on the impact of climate change on PAs.
Considering temporal variation, the use of Landsat, MODIS, and LiDAR show a clear fluctuating and increasing trend. LiDAR and SAR have been increasingly used to monitor and evaluate the landscape in recent years. Different satellites and sensors are now applied in different fields and at different scales of PAs. For example, Landsat products include the Thematic Mapper (TM), Enhanced Thematic Mapper Plus (ETM+), and Operational Land Imager (OLI), which can be used to monitor vegetation dynamics and assess land-cover/land-use change. However, MODIS sensors are more appropriate for vegetation phenology and forest fire monitoring and can provide high temporal resolution time series data at the landscape, regional, and global spatial scales. LiDAR makes it possible to estimate tree height, biomass, and leaf area index in large areas of the world [69,70]. SAR facilitates the estimation of forest biomass and tree height at small and medium scale [71]. Furthermore, SPOT or QuickBird may be used for species or specific vegetation change monitoring [72,73,74]. AVHRR sensors are mainly used to analyze the impact of climate change on vegetation coverage in PAs. The high spatial resolution of ASTER can also be used to study land- cover/land-use change in PAs [75]. Other high-resolution satellites, such as IKONOS and WorldView, focus on mapping vegetation types or habitat associated with endangered fauna [76,77].
In recent years, with the rapid development of satellites, sensors, and techniques, the applications of remote sensing have been broadly employed in the monitoring and management of PAs. The relevant research results for improving the level of monitoring in PAs, formulating differentiated regional protection policies, and guiding sustainable development play an important role. According to this bibliometric analysis, research on the remote sensing monitoring of PAs has mainly focused on the inventory and classification of vegetation, change detection, habitat degradation, the impact of climate change, and biodiversity conservation. Among the various methods, classification, time series analysis, and model methods were the most frequently used types for PA monitoring. In the foreseeable future, there will be more new methods to monitor PAs. For example, big data approaches are being adopted to process large amounts of remote sensing data [78,79,80].
There are still some limitations to this study. Firstly, the single database that we used does not index all scientific journals and theme books, which could exclude some relevant articles. For example, some gray literature on this topic from government agencies, nature conservancies and other non-profits might have been excluded. Expanding the search across multiple databases, such as Scopus and Google Scholar, will help reduce omissions in the analysis. Secondly, setting 1991 as the starting time may omit some earlier studies. However, most articles relevant to remote sensing applications in PAs were published in professional journals from 1991 onwards. Therefore, we believe that using 1991 as the starting point is still representative and appropriate. Thirdly, the VOSviewer software has some functional restrictions. Another consideration is that other bibliometric analysis tools, such as Citespace, could be applied in combination with VOSviewer in the future to more extensively cover the published research on the remote sensing of PAs. In the meantime, we acknowledge that it is almost impossible to include all remote sensing applications for PAs by limiting the search to include “remote sensing” alone. Other terms and descriptions, such as “land-cover monitoring”, “landscape configuration and composition”, “habitat analysis”, “biodiversity conservation”, and “bathymetry assessment”, among other examples, could be very relevant to studies in protected areas with remote sensing applications, but could be missed in the analysis. This is particularly true for monitoring changing terrestrial and marine environments under impacts from the natural and anthropogenic disturbances of protected areas. This challenge might be resolved when searches for bibliometric analysis are able to include into the full contents of published articles through the use of improved technologies, such as big data and artificial intelligence, instead of using limited and selected combination of keywords.
5. Conclusions
This paper evaluated the global research and publication trends in the remote sensing of PAs monitoring from 1991 to 2018. This analysis comprised eight main aspects: document types, publication output, subject categories, source journals, countries, organizations, and keywords. The results showed that since 2004, the number of publications increased rapidly and steadily. Environmental Sciences was the largest subject category. The highest number of papers was published in the two journals on Remote Sensing of Environment and Remote Sensing. The USA published the most in application of remote sensing technology in PA monitoring. Institutions affiliated to the USA have a massive number of publications and strong international collaboration in such type of explorations. Landsat, MODIS, and LiDAR are the most commonly used satellites and sensors. Most of the research was focused on classification, time-series analysis, and model methods. Keywords selections indicate that “Landsat”, “deforestation”, “LiDAR”, “conservation”, and “biodiversity” are among the most common subjects in the remote sensing of PAs. Studies on PA monitoring using remote sensing are mainly focused on change detection, biodiversity conservation, and the impact of climate change. In the future, we should continue to pay attention to the development trends and hot spots for the remote sensing monitoring of PAs. Researchers from all countries should strengthen the international exchanges of ideas and actively promote international research cooperation.
Author Contributions
P.D. designed the research, collected the data, analyzed the results, and wrote the first draft. Y.W. conceived the research and reviewed the manuscript. P.Y. processed and visualized the data. All authors have read and agreed to the published version of the manuscript.
Funding
This work was funded by the Humanity and Social Science Foundation of the Ministry of Education (19YJCZH229) and the China Postdoctoral Science Foundation (2018M632719).
Acknowledgments
We appreciate the insightful and constructive comments and suggestions from the anonymous reviewers that helped improve the quality and presentation of the manuscript.
Conflicts of Interest
The authors declare no conflict of interest.
References
- UNEP-WCMC. State of the World’s Protected Areas: An Annual Review of Global Conservation Progress; UNEP-WCMC: Cambridge, UK, 2008. [Google Scholar]
- Dudley, N. Guidelines for Applying Protected Area Management Categories; IUCN: Gland, Switzerland, 2008. [Google Scholar]
- Wang, Y. Remote Sensing of Protected Lands; CRC Press: Boca Raton, FL, USA, 2011; ISBN 978-1-4398-4187-7. [Google Scholar]
- Watson, J.E.M.; Dudley, N.; Segan, D.B.; Hockings, M. The performance and potential of protected areas. Nature 2014, 515, 67–73. [Google Scholar] [CrossRef]
- UNEP-WCMC; IUCN; NGS. Protected Planet Report 2018; UNEP-WCMC: Cambridge, UK; IUCN: Gland, Switzerland; NGS: Washington, DC, USA, 2018; ISBN 978-92-807-3721-9. Available online: https://www.iucn.org/theme/protectedareas/publications/protected-planet-report (accessed on 21 September 2019).
- Erol, S.Y.; Kuvan, Y.; Yildirim, H.T. The general characteristics and main problems of national parks in Turkey. Afr. J. Agr. Res. 2011, 6, 5377–5385. [Google Scholar]
- Bruner, A.G.; Gullison, R.E.; Rice, R.E.; Da Fonseca, G.A.B. Effectiveness of Parks in Protecting Tropical Biodiversity. Science 2001, 291, 125–128. [Google Scholar] [CrossRef] [PubMed] [Green Version]
- Adhikari, S.; Southworth, J. Simulating Forest Cover Changes of Bannerghatta National Park Based on a CA-Markov Model: A Remote Sensing Approach. Remote Sens. 2012, 4, 3215–3243. [Google Scholar] [CrossRef] [Green Version]
- Watson, J.E.M.; Venter, O.; Lee, J.; Jones, K.R.; Robinson, J.G.; Possingham, H.P.; Allan, J.R. Protect the last of the wild. Nature 2018, 563, 27–30. [Google Scholar] [CrossRef] [PubMed]
- Leverington, F.; Costa, K.L.; Pavese, H.; Lisle, A.; Hockings, M. A Global Analysis of Protected Area Management Effectiveness. Environ. Manag. 2010, 46, 685–698. [Google Scholar] [CrossRef] [PubMed]
- Willis, K.S. Remote sensing change detection for ecological monitoring in United States protected areas. Biol. Conserv. 2015, 182, 233–242. [Google Scholar] [CrossRef]
- Wiens, J.; Sutter, R.; Anderson, M.; Blanchard, J.; Barnett, A.; Aguilar-Amuchastegui, N.; Avery, C.; Laine, S. Selecting and conserving lands for biodiversity: The role of remote sensing. Remote Sens. Environ. 2009, 113, 1370–1381. [Google Scholar] [CrossRef] [Green Version]
- Lu, X.; Zhou, Y.; Liu, Y.; Yannick, L.P. The role of protected areas in land use/land cover change and the carbon cycle in the conterminous United States. Glob. Chang. Biol. 2017, 24, 617–630. [Google Scholar] [CrossRef]
- Fan, L.; Zhao, J.; Wang, Y.; Ren, Z.; Zhang, H.; Guo, X. Assessment of Night-Time Lighting for Global Terrestrial Protected and Wilderness Areas. Remote Sens. 2019, 11, 2699. [Google Scholar] [CrossRef] [Green Version]
- Wang, Y.; Mitchell, B.R.; Nugranad-Marzilli, J.; Bonynge, G.; Zhou, Y.; Shriver, G. Remote sensing of land-cover change and landscape context of the National Parks: A case study of the Northeast Temperate Network. Remote Sens. Environ. 2009, 113, 1453–1461. [Google Scholar] [CrossRef]
- Gross, J.E.; Goetz, S.J.; Cihlar, J. Application of remote sensing to parks and protected area monitoring: Introduction to the special issue. Remote Sens. Environ. 2009, 113, 1343–1345. [Google Scholar] [CrossRef]
- Jones, D.A.; Hansen, A.J.; Bly, K.; Doherty, K.; Verschuyl, J.; Paugh, J.I.; Carle, R.; Story, S.J. Monitoring land use and cover around parks: A conceptual approach. Remote Sens. Environ. 2009, 113, 1346–1356. [Google Scholar] [CrossRef]
- Kennedy, R.E.; Yang, Z.; Cohen, W.B. Detecting trends in forest disturbance and recovery using yearly Landsat time series: 1. LandTrendr—Temporal segmentation algorithms. Remote Sens. Environ. 2010, 114, 2897–2910. [Google Scholar] [CrossRef]
- Szantoi, Z.; Brink, A.; Buchanan, G.; Bastin, L.; Lupi, A.; Simonetti, D.; Mayaux, P.; Peedell, S.; Davy, J. A simple remote sensing based information system for monitoring sites of conservation importance. Remote Sens. Ecol. Conserv. 2016, 2, 16–24. [Google Scholar] [CrossRef]
- Huang, C.; Schleerweis, K.; Thomas, N.; Goward, S.N. Forest Dynamics within and around Olympic National Park Assessed Using Time Series Landsat Observations (Chapter 4). In Remote Sensing of Protected Lands; CRC Press: Boca Raton, FL, USA, 2012; pp. 75–94. [Google Scholar]
- Zorn, P.; Ure, D.; Sharma, R.; O’Grady, S. Using earth observation to monitor species-specific habitat change in the Greater Kejimkujik National Park Region of Canada. In Remote Sensing of Protected Lands; CRC Press: Boca Raton, FL, USA, 2012; pp. 95–110. [Google Scholar]
- Hansen, A.J.; DeFries, R. Land use change around nature reserves: Implications for sustaining biodiversity. Ecol. Appl. 2007, 17, 972–973. [Google Scholar] [CrossRef] [PubMed]
- Hansen, A.J.; DeFries, R. Ecological mechanisms linking protected areas to surrounding lands. Ecol. Appl. 2007, 17, 974–988. [Google Scholar] [CrossRef]
- Clark, J.; Wang, Y.; August, P.V. Assessing current and projected suitable habitats for tree-of-heaven along the Appalachian Trail. Philos. Trans. Roy. Soc. B 2014, 369, 20130192. [Google Scholar] [CrossRef] [Green Version]
- Sheng, Y.; Alsdorf, D. Automated ortho-rectification of Amazon basin-wide SAR mosaics using SRTM DEM data. IEEE Trans. Geosci. Remote Sens. 2005, 43, 1929–1940. [Google Scholar] [CrossRef]
- Arima, E.Y.; Walker, R.T.; Sales, M.H.R.; Souza, C.M.; Perz, S.G. The fragmentation of space in the Amazon basin: Emergent road networks. Photogram. Eng. Remote Sens. 2008, 74, 699–709. [Google Scholar] [CrossRef]
- Walsh, S.J.; Messina, J.P.; Brown, D.G. Mapping & modeling land use/land cover dynamics in frontier settings. Photogram. Eng. Remote Sens. 2008, 74, 677–679. [Google Scholar]
- Mena, C.F. Trajectories of land-use and land-cover in the northern Ecuadorian Amazon: Temporal composition, spatial configuration, and probability of change. Photogram. Eng. Remote Sens. 2008, 74, 737–751. [Google Scholar] [CrossRef]
- Wang, C.; Qi, J.; Cochrane, M. Assessment of tropical forest degradation with canopy fractional cover from Landsat ETM+ and IKONOS imagery. Earth Interact. 2005, 9, 1–18. [Google Scholar] [CrossRef]
- Wang, C.; Qi, J. Biophysical estimation in tropical forests using JERS-1 SAR and VNIR Imagery: II-aboveground woody biomass. Int. J. Remote Sens. 2008, 29, 6827–6849. [Google Scholar] [CrossRef]
- Ayebare, S.; Moyer, D.; Plumptre, A.J.; Wang, Y. Remote Sensing for Biodiversity Conservation of the Albertine Rift in Eastern Africa. In Remote Sensing of Protected Lands; CRC Press: Boca Raton, FL, USA, 2012; pp. 183–201. [Google Scholar]
- Sun, G.; Ranson, K.J.; Kharuk, V.I. Radiometric slope correction for forest biomass estimation from SAR data in Western Sayani mountains, Siberia. Remote Sens. Environ. 2002, 79, 279–287. [Google Scholar] [CrossRef]
- Bergen, K.M.; Zhao, T.; Kharuk, V.; Blam, Y.; Brown, D.G.; Peterson, L.K.; Miller, N. Changing regimes: Forested land cover dynamics in central Siberia 1974–2001. Photogram. Eng. Remote Sens. 2008, 74, 787–798. [Google Scholar] [CrossRef]
- Kharuk, V.I.; Ranson, K.J.; Im, S.T. Siberian silkmoth outbreak pattern analysis based on SPOT VEGETATION data. Int. J. Remote Sens. 2009, 30, 2377–2388. [Google Scholar] [CrossRef]
- Sherman, N.J.; Loboda, T.V.; Sun, G.; Shugart, H.H. Remote sensing and modeling for assessment of complex Amur (Siberian) Tiger and Amur (Far Eastern) Leopard Habitats in the Russian Far East. In Remote Sensing of Protected Lands; CRC Press: Boca Raton, FL, USA, 2012; pp. 379–407. [Google Scholar]
- Stow, D.A.; Hope, A.; McGuire, D.; Verbyla, D.; Gamon, J.; Huemmrich, F.; Houston, S.; Racine, C.; Sturm, M.; Tape, K.; et al. Remote sensing of vegetation and land-cover change in Arctic tundra ecosystems. Remote Sens. Environ. 2004, 89, 281–308. [Google Scholar] [CrossRef] [Green Version]
- Sheng, Y.; Shah, C.A.; Smith, L.C. Automated image registration for hydrologic change detection in the lake-rich arctic. IEEE Geosci. Remote Sens. Lett. 2008, 5, 414–418. [Google Scholar] [CrossRef]
- Lu, Z.; Kwoun, O. RADARSAT-1 and ERS interferometric analysis over southeastern coastal Louisiana: Implication for mapping water-level changes beneath swamp forests. IEEE Trans. Geosci. Remote Sens. 2008, 46, 2167–2184. [Google Scholar] [CrossRef]
- Lu, Z.; Dzurisin, D.; Jung, H.S. Monitoring Natural Hazards in Protected Lands Using Interferometric Synthetic Aperture Radar (InSAR). In Remote Sensing of Protected Lands; CRC Press: Boca Raton, FL, USA, 2012; pp. 439–471. [Google Scholar]
- Campbell, A.; Wang, Y. Examining the Influence of Tidal Stage on Salt Marsh Mapping using High Spatial Resolution Satellite Remote Sensing and Topobathymetric LiDAR. IEEE Trans. Geosci. Remote Sens. 2018, 56, 5169–5176. [Google Scholar] [CrossRef]
- Campbell, A.; Wang, Y. High spatial resolution remote sensing for salt marsh mapping and change analysis at Fire Island National Seashore. Remote Sens. 2019, 11, 1107. [Google Scholar] [CrossRef] [Green Version]
- Friedlander, A.M.; Wedding, L.M.; Caselle, J.E.; Costa, B.M. Integration of Remote Sensing and in situ Ecology for the Design and Evaluation of Marine Protected Areas: Examples from Tropical and Temperate Ecosystems. In Remote Sensing of Protected Lands; CRC Press: Boca Raton, FL, USA, 2012; pp. 245–279. [Google Scholar]
- Nagendra, H.; Lucas, R.; Honrado, J.P.; Jongman, R.H.G.; Tarantino, C.; Adamo, M.; Mairota, P. Remote sensing for conservation monitoring: Assessing protected areas, habitat extent, habitat condition, species diversity, and threats. Ecol. Indic. 2013, 33, 45–59. [Google Scholar] [CrossRef]
- Kachelriess, D.; Wegmann, M.; Gollock, M.; Pettorelli, N. The application of remote sensing for marine protected area management. Ecol. Indic. 2014, 36, 169–177. [Google Scholar] [CrossRef]
- Gillespie, T.W.; Willis, K.S.; Ostermann-Kelm, S. Spaceborne remote sensing of world’s protected areas. Prog. Phys. Geogr. 2015, 39, 388–404. [Google Scholar] [CrossRef]
- Khudzari, J.M.; Kurian, J.; Tartakovsky, B.; Raghavan, G.S.V. Bibliometric analysis of global research trends on microbial fuel cells using Scopus database. Biochem. Eng. J. 2018, 136, 51–60. [Google Scholar] [CrossRef]
- Zou, X.; Yue, W.L.; Vu, H.L. Visualization and analysis of mapping knowledge domain of road safety studies. Accid. Anal. Prev. 2018, 118, 131–145. [Google Scholar] [CrossRef]
- Chen, D.; Liu, Z.H.; Luo, Z.H.; Webber, M.; Chen, J. Bibliometric and visualized analysis of emergy research. Ecol. Eng. 2016, 90, 285–293. [Google Scholar] [CrossRef]
- Geng, Y.; Chen, W.; Liu, Z.; Chui, A.S.F.; Han, W.; Liu, Z.; Zhong, S.; Qian, Y.; You, W.; Cui, X. A bibliometric review: Energy consumption and greenhouse gas emission in the residential sector. J. Clean. Prod. 2017, 159, 301–316. [Google Scholar] [CrossRef]
- Hu, K.; Qi, K.; Guan, Q.; Wu, C.; Yu, J.; Qing, Y.; Zheng, J.; Wu, H.; Li, X. A Scientometric Visualization Analysis for Night-Time Light Remote Sensing Research from 1991 to 2016. Remote Sens. 2017, 9, 802. [Google Scholar] [CrossRef] [Green Version]
- Zhang, Y.; Giardino, C.; Li, L. Water Optics and Water Colour Remote Sensing. Remote Sens. 2017, 9, 818. [Google Scholar] [CrossRef] [Green Version]
- Cui, X.; Guo, X.; Wang, Y.; Wang, X.; Zhu, W.; Shie, J.; Lin, C.; Gao, X. Application of remote sensing to water environmental processes under a changing climate. J. Hydrol. 2019, 574, 892–902. [Google Scholar] [CrossRef]
- Zhuang, Y.; Liu, X.; Nguyen, T.; He, Q.; Hong, S. Global remote sensing research trends during 1991–2010: A bibliometric analysis. Scientometrics 2013, 96, 203–219. [Google Scholar] [CrossRef]
- Viana, J.; Santos, J.V.; Neiva, R.M.; Souza, J.; Duarte, L.; Teodoro, A.C.; Freitas, A. Remote Sensing in Human Health: A 10-Year Bibliometric Analysis. Remote Sens. 2017, 9, 1225. [Google Scholar] [CrossRef] [Green Version]
- Wang, L.; Zhang, G.; Wang, Z.; Liu, J.; Shang, J.; Liang, L. Bibliometric Analysis of Remote Sensing Research Trend in Crop Growth Monitoring: A Case Study in China. Remote Sens. 2019, 11, 809. [Google Scholar] [CrossRef] [Green Version]
- Van, E.N.J.; Waltman, L. Software survey: VOSviewer, a computer program for bibliometric mapping. Scientometrics 2010, 84, 523–538. [Google Scholar] [CrossRef] [Green Version]
- Romanelli, J.P.; Fujimoto, J.T.; Ferreira, M.D.; Milanez, D.H. Assessing ecological restoration as a research topic using bibliometric indicators. Ecol. Eng. 2018, 120, 311–320. [Google Scholar] [CrossRef]
- Van, E.N.J.; Waltman, L. Manual for VOSviewer Version 1.6.10; Universiteit Leiden: Leiden, The Nertherland, 2019. [Google Scholar]
- Perianes-Rodriguez, A.; Waltman, L.; Van Eck, N.J. Constructing bibliometric networks: A comparison between full and fractional counting. J. Informetr. 2016, 10, 1178–1195. [Google Scholar] [CrossRef] [Green Version]
- Santos, G.; Marques, C.S.; Ferreira, J.J. A look back over the past 40 years of female entrepreneurship: Mapping knowledge networks. Scientometrics 2018, 115, 953–987. [Google Scholar] [CrossRef] [Green Version]
- Sainaghi, R.; Köseoglu, M.A.; d’Angella, F.; Tetteh, I.L. Foundations of hospitality performance measurement research: A co-citation approach. Int. J. Hosp. Manag. 2019, 79, 21–40. [Google Scholar] [CrossRef]
- Sweileh, W.M.; Al-Jabi, S.W.; Zyoud, S.H.; Sawalha, A.F.; Abu-Taha, A.F. Global research output in antimicrobial resistance among uropathogens: A bibliometric analysis (2002–2016). J. Glob. Antimicrob. Resist. 2018, 13, 104–114. [Google Scholar] [CrossRef] [PubMed]
- Birch, T.; Reyes, E. Forty years of coastal zone management (1975–2014): Evolving theory, policy and practice as reflected in scientific research publications. Ocean Coast. Manag. 2018, 153, 1–11. [Google Scholar] [CrossRef]
- Liu, F.; Lin, A.; Wang, H.; Peng, Y.; Hong, S. Global research trends of geographical information system from 1961 to 2010: A bibliometric analysis. Scientometrics 2016, 106, 751–768. [Google Scholar] [CrossRef]
- He, M.; Zhang, Y.; Gong, L.H.; Zhou, Y.; Song, X.F.; Zhu, W.P.; Zhang, M.M.; Zhang, Z. Bibliometrical analysis of hydrogen storage. Int. J. Hydrog. Energy 2019, 44, 28206–28226. [Google Scholar] [CrossRef]
- Zhang, Y.; Zhang, Y.; Shi, K.; Yao, X. Research development, current hotspots, and future directions of water research based on MODIS images: A critical review with a bibliometric analysis. Environ. Sci. Pollut. Res. 2017, 24, 1–14. [Google Scholar] [CrossRef]
- Zhang, H.; Huang, M.; Qing, X.; Li, G.; Tian, C. Bibliometric analysis of global remote sensing research during 2010–2015. ISPRS Int. J. Geo Inf. 2017, 6, 332. [Google Scholar] [CrossRef] [Green Version]
- Gong, J.; Shi, H.; Ma, G.; Zhou, Q. A review of multi-temporal remote sensing data change detection algorithms. Int. Arch. Photogramm. Remote Sens. Spat. Inf. Sci. 2008, 37, 757–762. [Google Scholar]
- Chen, B.; Pang, Y.; Li, Z.; North, P.; Rosette, J.; Sun, G.; Suárez, J.; Bye, I.; Lu, H. Potential of Forest Parameter Estimation Using Metrics from Photon Counting LiDAR Data in Howland Research Forest. Remote Sens. 2019, 11, 856. [Google Scholar] [CrossRef] [Green Version]
- Saukkola, A.; Melkas, T.; Riekki, K.; Sirparanta, S.; Peuhkurinen, J.; Holopainen, M.; Hyyppä, J.; Vastaranta, M. Predicting Forest Inventory Attributes Using Airborne Laser Scanning, Aerial Imagery, and Harvester Data. Remote Sens. 2019, 11, 797. [Google Scholar] [CrossRef] [Green Version]
- Austin, J.M.; Mackey, B.G.; Niel, K.P.V. Estimating forest biomass using satellite radar: An exploratory study in a temperate Australian Eucalyptus forest. For. Ecol. Manag. 2003, 176, 575–583. [Google Scholar] [CrossRef]
- Wolter, P.T.; Townsend, P.A.; Sturtevant, B.R. Estimation of forest structural parameters using 5 and 10 meter SPOT-5 satellite data. Remote Sens. Environ. 2009, 113, 2019–2036. [Google Scholar] [CrossRef]
- Langner, A.; Hirata, Y.; Saito, H.; Sokh, H.; Leng, C.; Pak, C.; Rašic, R. Spectral normalization of SPOT 4 data to adjust for changing leaf phenology within seasonal forests in Cambodia. Remote Sens. Environ. 2014, 143, 122–130. [Google Scholar] [CrossRef]
- Viedma, O.; Torres, I.; Pérez, B.; Moreno, J.M. Modeling plant species richness using reflectance and texture data derived from QuickBird in a recently burned area of Central Spain. Remote Sens. Environ. 2012, 119, 208–221. [Google Scholar] [CrossRef]
- Scharsich, V.; Mtata, K.; Hauhs, M.; Lange, H.; Bogner, C. Analysing land cover and land use change in the Matobo National Park and surroundings in Zimbabwe. Remote Sens. Environ. 2017, 194, 278–286. [Google Scholar] [CrossRef] [Green Version]
- Navarrete, J.; Ramírez, M.I.; Pérez-Salicrup, D.R. Logging within protected areas: Spatial evaluation of the monarch butterfly biosphere reserve, Mexico. For. Ecol. Manag. 2011, 262, 646–654. [Google Scholar] [CrossRef]
- Reshitnyk, L.; Costa, M.; Robinson, C.; Dearden, P. Evaluation of WorldView-2 and acoustic remote sensing for mapping benthic habitats in temperate coastal Pacific waters. Remote Sens. Environ. 2014, 153, 7–23. [Google Scholar] [CrossRef]
- Tsai, Y.H.; Stow, D.; Chen, H.L.; Lewison, R.; An, L.; Shi, L. Mapping Vegetation and Land Use Types in Fanjingshan National Nature Reserve Using Google Earth Engine. Remote Sens. 2018, 10, 927. [Google Scholar] [CrossRef] [Green Version]
- Lee, J.; Cardille, J.A.; Coe, M.T. BULC-U: Sharpening Resolution and Improving Accuracy of Land-Use/Land-Cover Classifications in Google Earth Engine. Remote Sens. 2018, 10, 1455. [Google Scholar] [CrossRef] [Green Version]
- Mahdianpari, M.; Salehi, B.; Mohammadimanesh, F.; Homayouni, S.; Gill, E. The First Wetland Inventory Map of Newfoundland at a Spatial Resolution of 10 m Using Sentinel-1 and Sentinel-2 Data on the Google Earth Engine Cloud Computing Platform. Remote Sens. 2019, 11, 43. [Google Scholar] [CrossRef] [Green Version]
Figure 1.
Annual publication and cumulative number, 1991–2018.

Figure 2.
Top 10 subject categories in the field of the remote sensing monitoring of protected areas (PAs).
Figure 2.
Top 10 subject categories in the field of the remote sensing monitoring of protected areas (PAs).
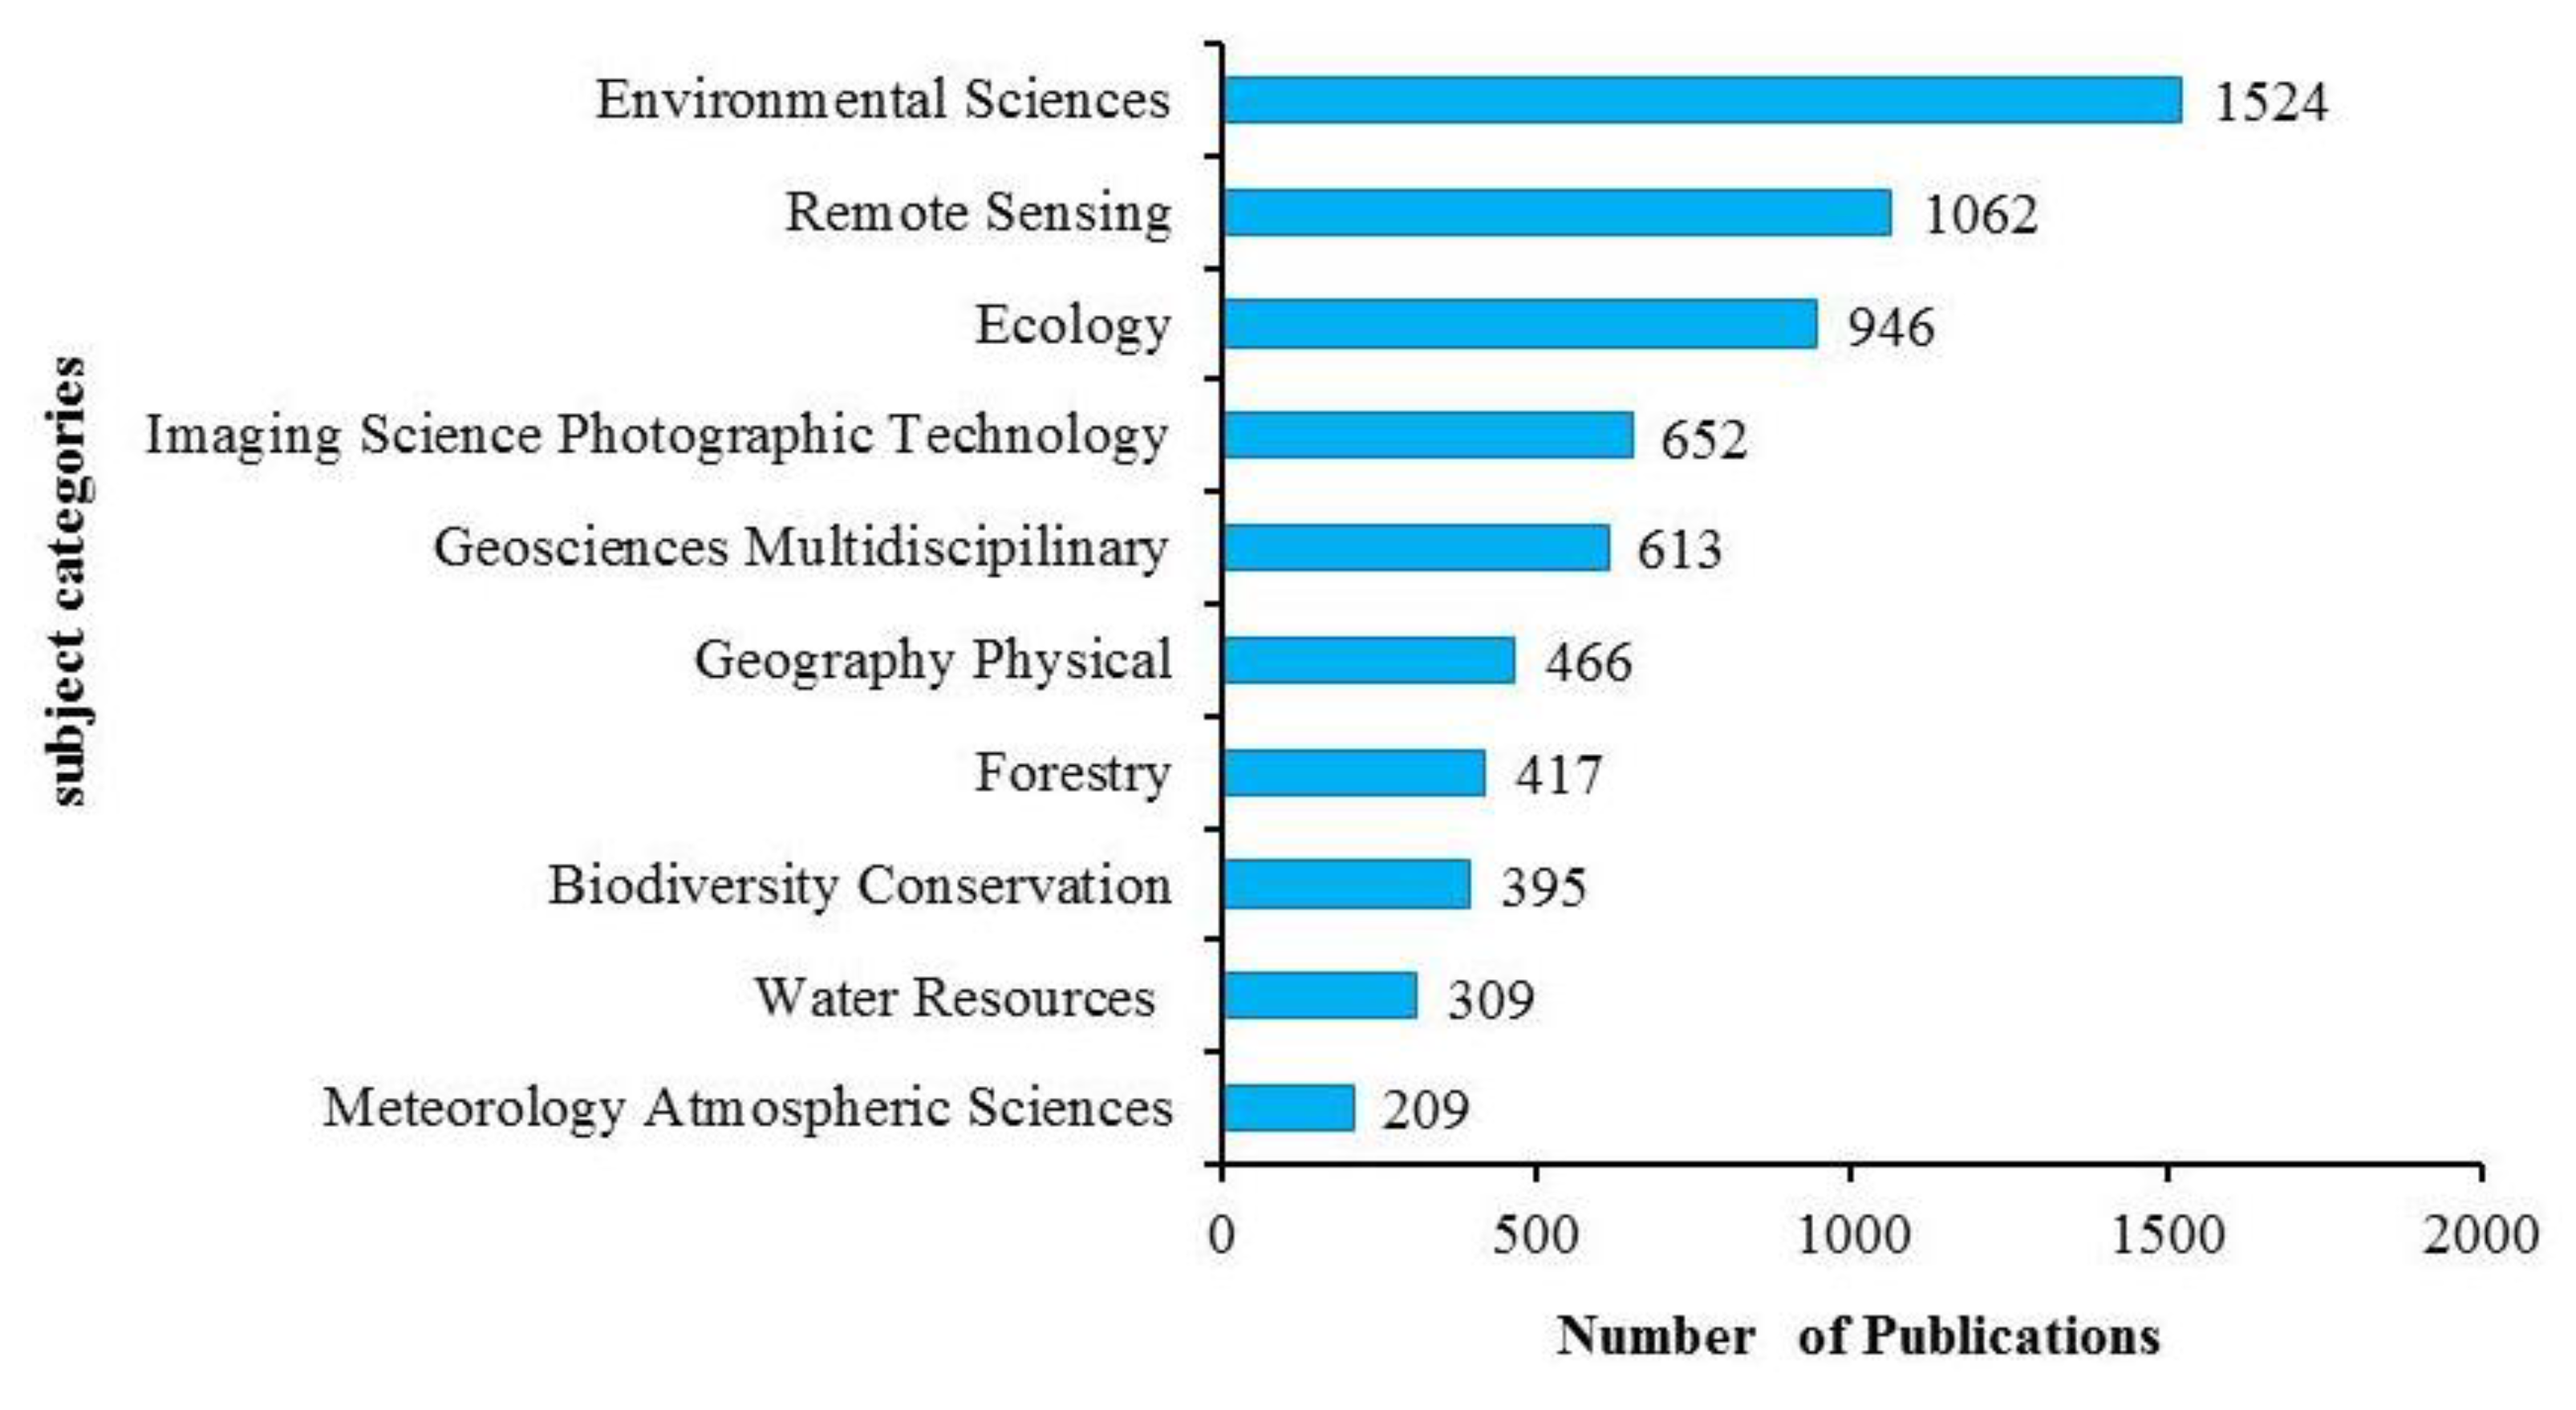
Figure 3.
The geographic distribution of the top 20 productive countries.
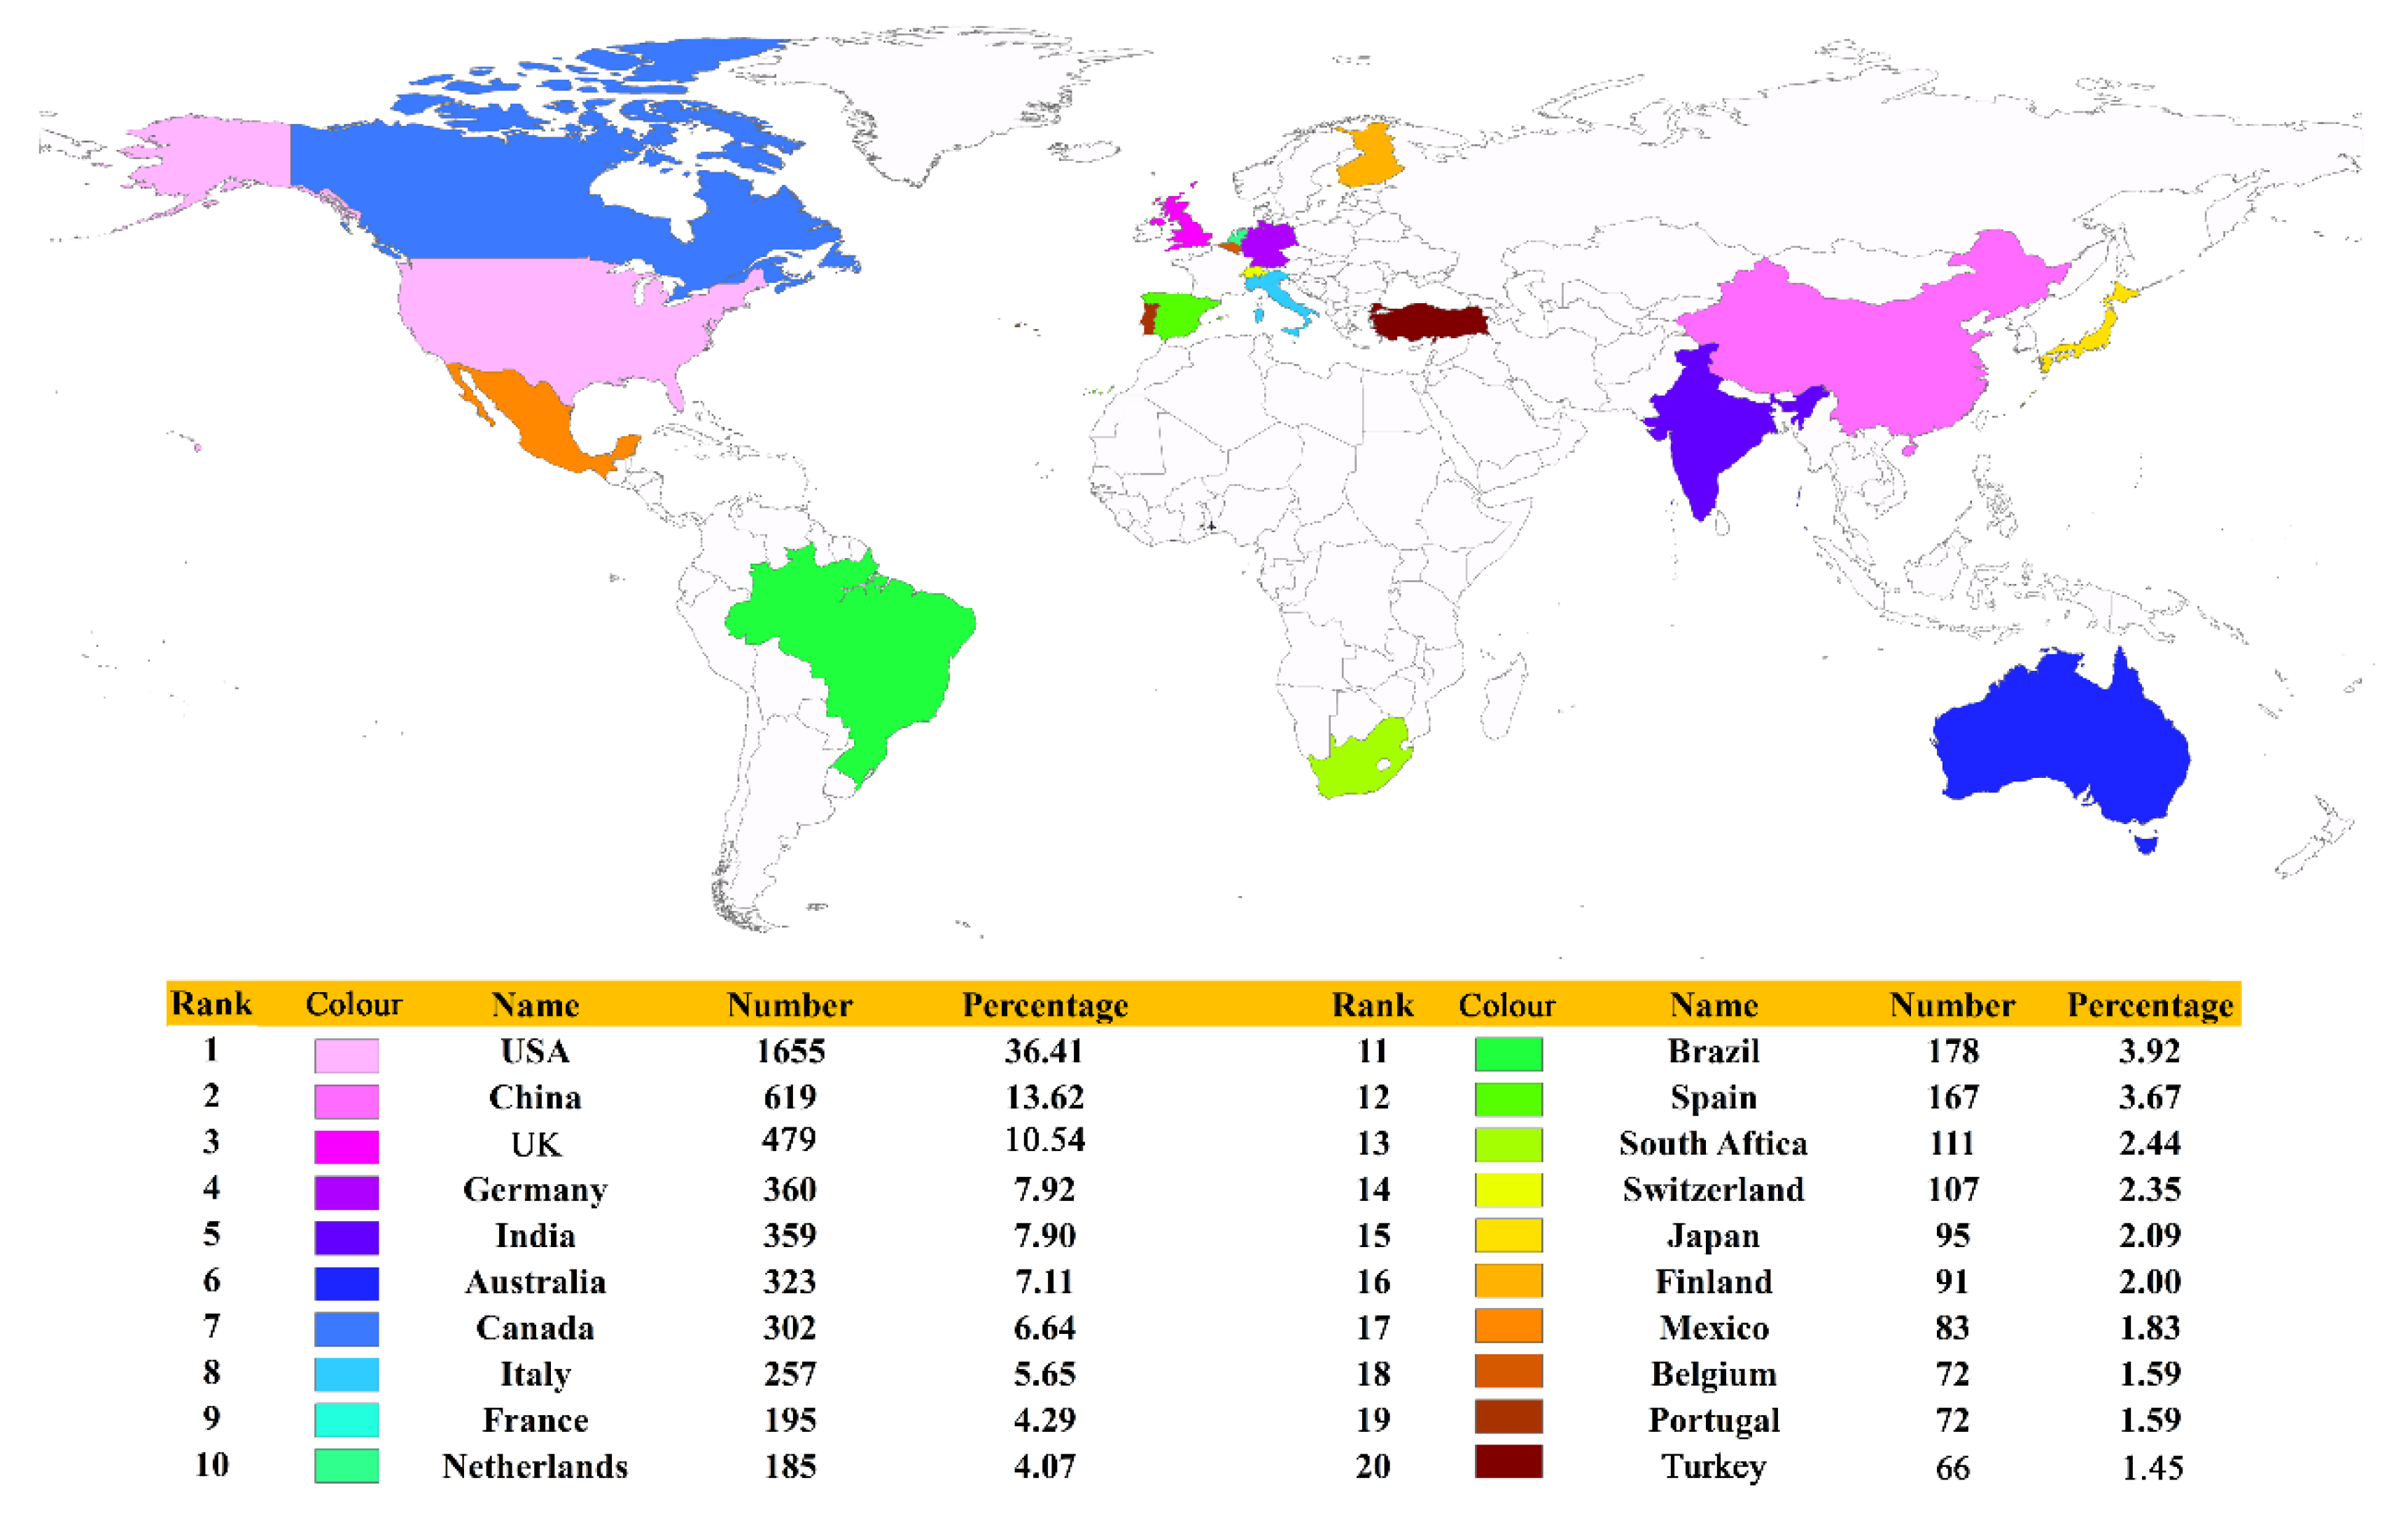
Figure 4.
Co-authorship cooperation between productive countries. Each node represents a country. The size of the nodes reveals the citations of the countries, while the thickness of the lines between them shows the strength of collaboration.
Figure 4.
Co-authorship cooperation between productive countries. Each node represents a country. The size of the nodes reveals the citations of the countries, while the thickness of the lines between them shows the strength of collaboration.
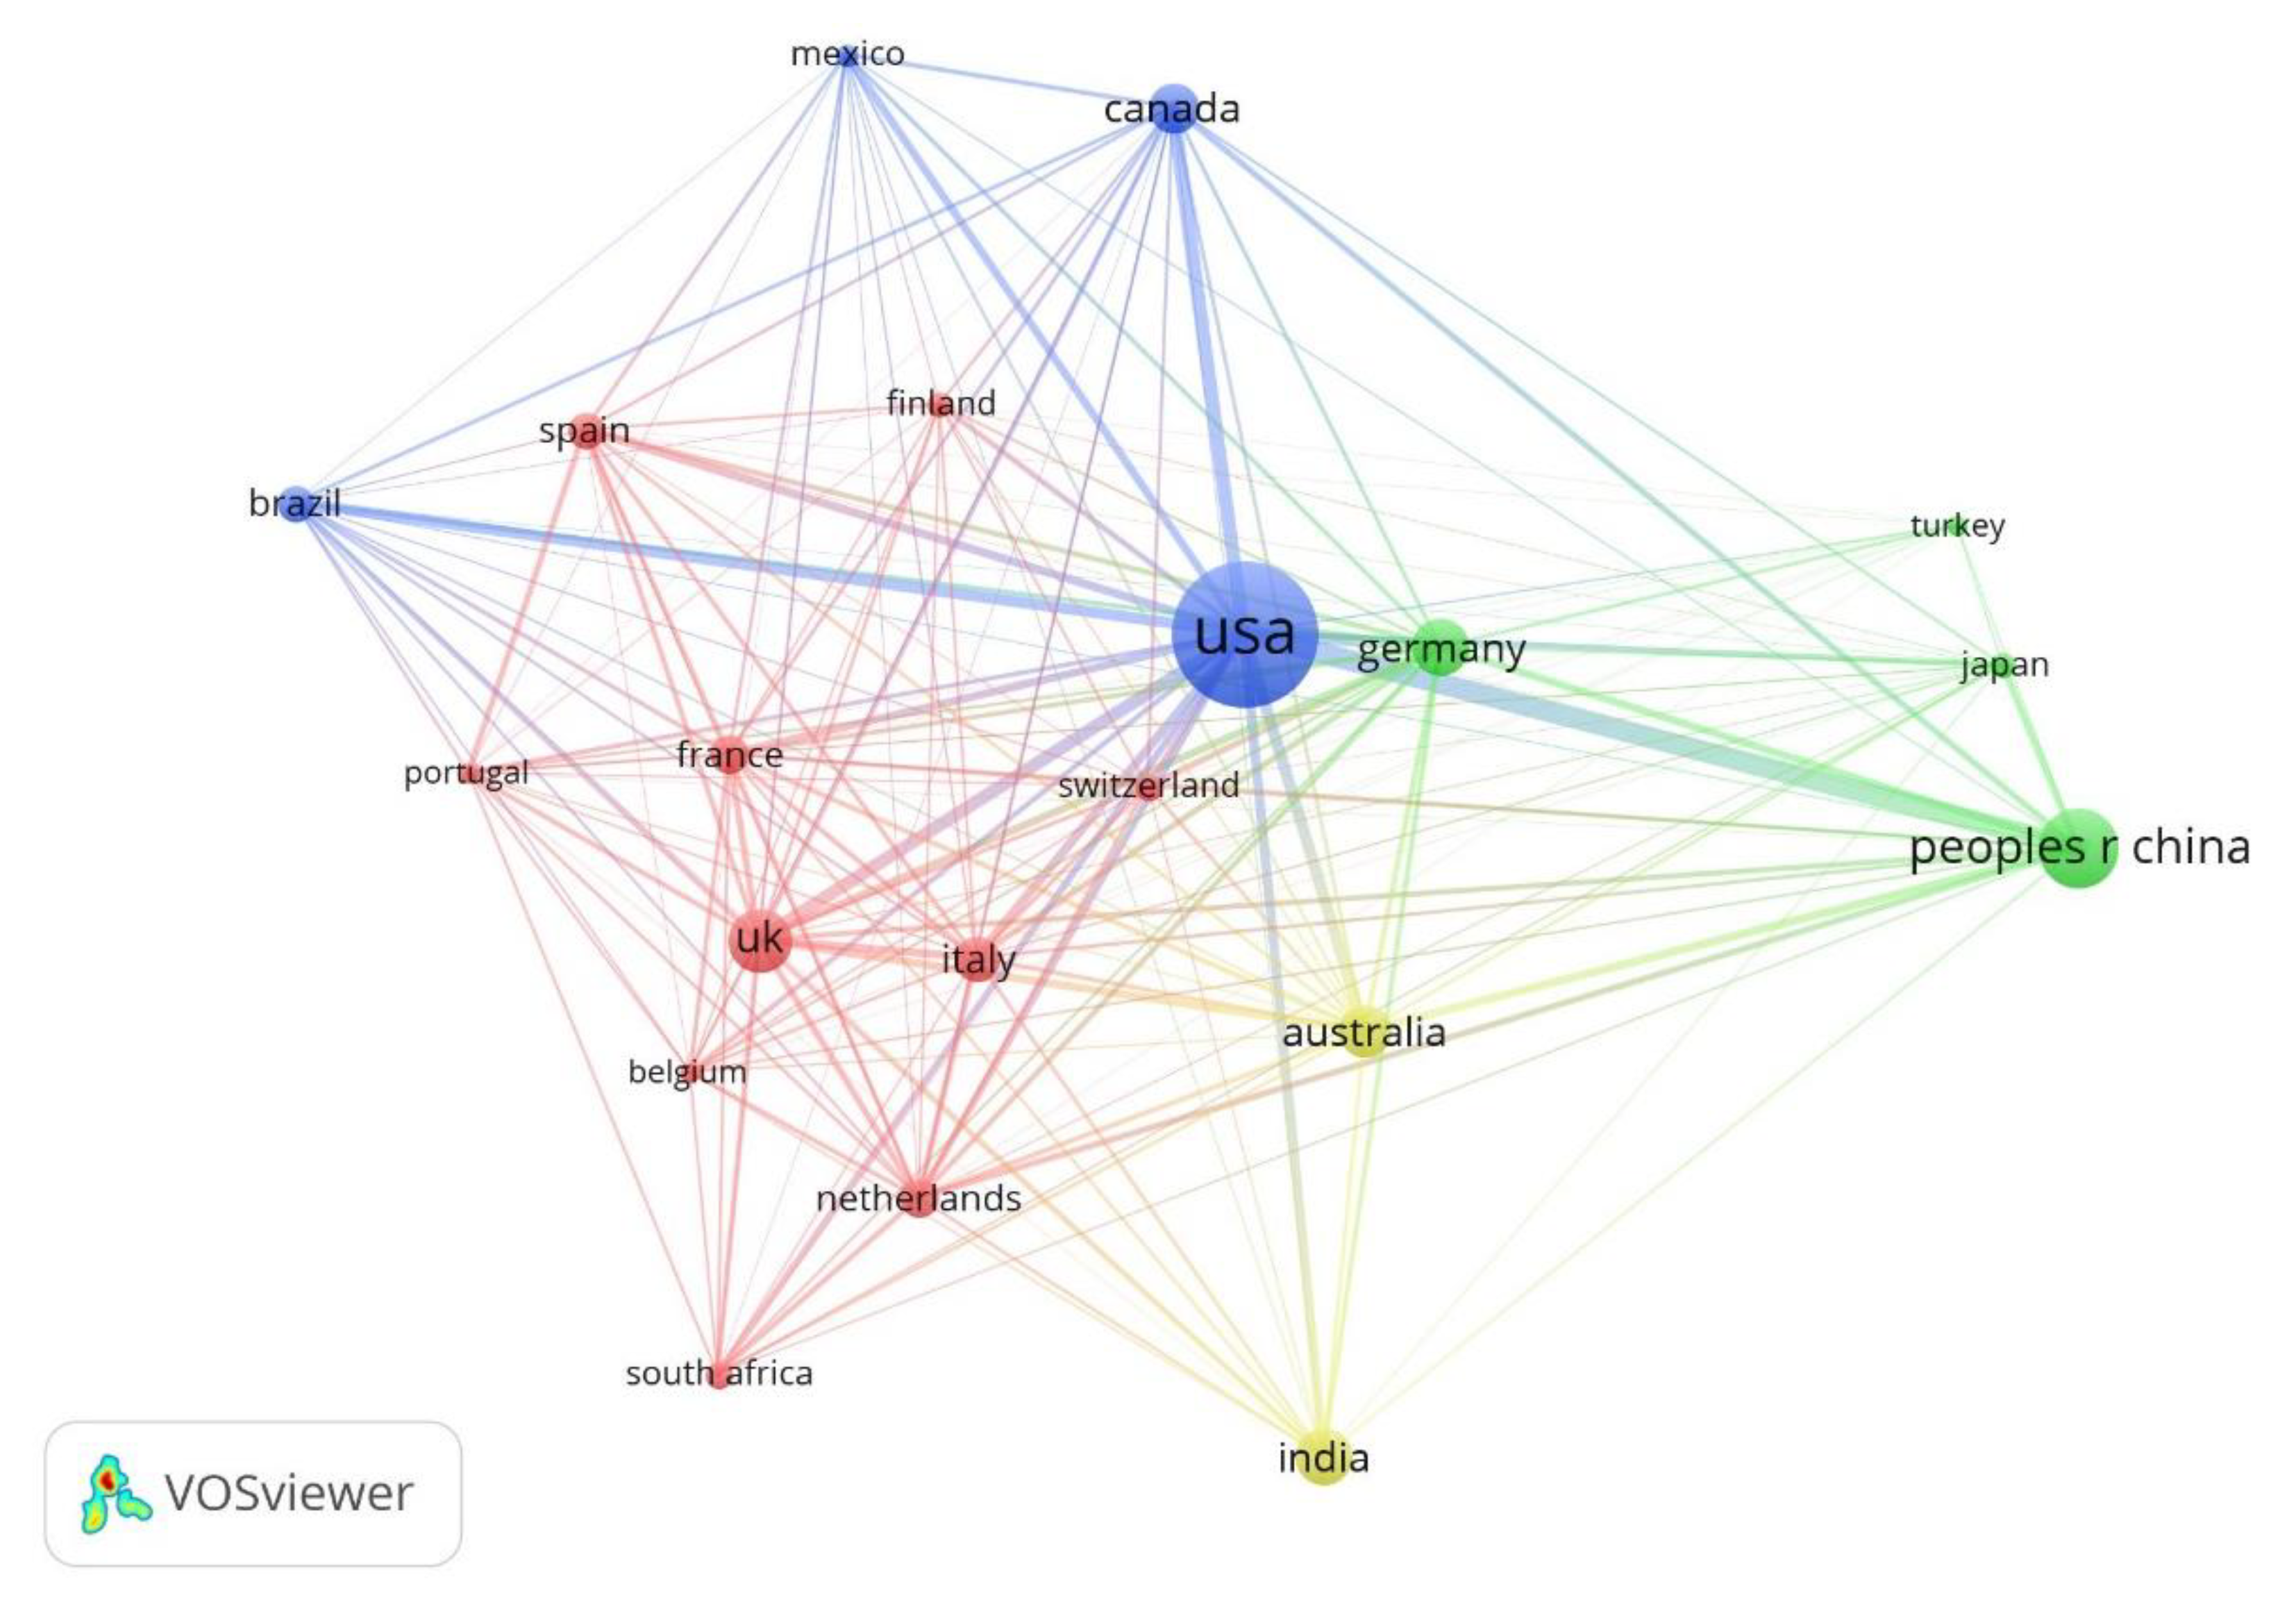
Figure 5.
Co-authorship cooperation between productive institutions. The colors represent clusters of institutions, the size of frames represents the number of articles published by these institutions, and the lines represent the strength of cooperation among institutions.
Figure 5.
Co-authorship cooperation between productive institutions. The colors represent clusters of institutions, the size of frames represents the number of articles published by these institutions, and the lines represent the strength of cooperation among institutions.

Figure 6.
Annual publications of the main satellites and sensors in the research field.

Figure 7.
Keywords co-occurrence network. Each node represents a keyword, the size of the node indicates the number of occurrences of the keyword, and the line thickness of the two nodes represents the degree of connection.
Figure 7.
Keywords co-occurrence network. Each node represents a keyword, the size of the node indicates the number of occurrences of the keyword, and the line thickness of the two nodes represents the degree of connection.

Table 1.
Top 20 main source journals in the research field.
| Rank | Name | Country | Number | Percentage% |
|---|---|---|---|---|
| 1 | Remote Sensing of Environment | USA | 256 | 5.63 |
| 2 | Remote Sensing | Switzerland | 174 | 3.83 |
| 3 | International Journal of Remote Sensing | UK | 153 | 3.37 |
| 4 | ISPRS Journal of Photogrammetry and Remote Sensing | Netherlands | 108 | 2.38 |
| 5 | Forest Ecology and Management | Netherlands | 96 | 2.11 |
| 6 | International Journal of Applied Earth Observation and Geoinformation | Netherlands | 92 | 2.02 |
| 7 | Ecological Indicators | Netherlands | 78 | 1.72 |
| 8 | Environmental Monitoring and Assessment | Netherlands | 70 | 1.54 |
| 9 | Biological Conservation | UK | 69 | 1.52 |
| 10 | Applied Geography | UK | 62 | 1.36 |
| 11 | PLOS One | USA | 58 | 1.28 |
| 12 | Ecological Applications | USA | 53 | 1.17 |
| 13 | Journal of the Indian Society of Remote Sensing | USA | 47 | 1.03 |
| 14 | International Journal of Wildland Fire | Australia | 44 | 0.97 |
| 15 | Current Science | India | 43 | 0.95 |
| 16 | Environmental Management | USA | 43 | 0.95 |
| 17 | Environmental Research Letters | UK | 43 | 0.95 |
| 18 | Journal of Environmental Management | UK | 42 | 0.92 |
| 19 | Landscape Ecology | Netherlands | 42 | 0.92 |
| 20 | Biodiversity and Conservation | Netherlands | 39 | 0.86 |
Table 2.
5 main clusters for country collaboration.
| Cluster | Country | Citations | Link Strength |
|---|---|---|---|
| 1 | UK | 14,335 | 241 |
| Italy | 8924 | 133 | |
| Netherlands | 7298 | 128 | |
| France | 6838 | 124 | |
| Spain | 4732 | 96 | |
| Switzerland | 4361 | 70 | |
| South Africa | 2715 | 59 | |
| Finland | 2596 | 40 | |
| Belgium | 1980 | 50 | |
| Portugal | 1288 | 54 | |
| 2 | USA | 62,644 | 634 |
| Canada | 11,665 | 140 | |
| Brazil | 4926 | 94 | |
| Mexico | 2026 | 58 | |
| 3 | China | 12,906 | 265 |
| Germany | 11,147 | 200 | |
| Japan | 2562 | 45 | |
| Turkey | 513 | 8 | |
| 4 | Australia | 10031 | 164 |
| India | 6772 | 73 |
Table 3.
Top 15 institutions based on total publications.
| Rank | Organization | Country | Number | Percentage % | Citations |
|---|---|---|---|---|---|
| 1 | Chinese Academy of Sciences | China | 296 | 6.51 | 7279 |
| 2 | University of Maryland | USA | 118 | 2.60 | 5683 |
| 3 | U.S. Forest Service | USA | 110 | 2.42 | 5376 |
| 4 | NASA | USA | 108 | 2.38 | 6668 |
| 5 | U.S. Geological Survey | USA | 84 | 1.85 | 2842 |
| 6 | University of Chinese Academy of Sciences | China | 63 | 1.39 | 1222 |
| 7 | Beijing Normal University | China | 61 | 1.34 | 1703 |
| 8 | University of Queensland | Australia | 59 | 1.30 | 2347 |
| 9 | University of Wisconsin | USA | 56 | 1.23 | 3535 |
| 10 | Oregon State University | USA | 54 | 1.19 | 2367 |
| 11 | University of Florida | USA | 53 | 1.17 | 1529 |
| 12 | Caltech | USA | 51 | 1.12 | 2086 |
| 13 | University of British Columbia | Canada | 51 | 1.12 | 2765 |
| 14 | University of Oxford | UK | 48 | 1.06 | 1381 |
| 15 | Natural Resources Canada | Canada | 47 | 1.03 | 1636 |
Table 4.
Top 20 author keywords in different stages, 1991–2018,1991–2003, 2004–2011, and 2012–2018. F(%)—frequency of author keywords and their percentage of total publications in the corresponding stage. The total publications numbered 4546 in 1991–2018, 393 in 1991–2003, 1405 in 2004–2011, and 2748 in 2012–2018.
| Rank | 1991–2018 | 1991–2003 | 2004–2011 | 2012–2018 | ||||
|---|---|---|---|---|---|---|---|---|
| Keywords | F (%) | Keywords | F (%) | Keywords | F (%) | Keywords | F (%) | |
| 1 | remote sensing | 1933 (42.52) | remote sensing | 135 (34.35) | remote sensing | 659 (46.90) | remote sensing | 1139 (41.45) |
| 2 | Landsat | 1078 (23.71) | Landsat | 112 (28.50) | Landsat | 353 (25.12) | Landsat | 613 (22.31) |
| 3 | MODIS | 439 (9.66) | GIS | 48 (12.21) | GIS | 159 (11.32) | MODIS | 310 (11.28) |
| 4 | GIS | 425 (9.35) | landscape ecology | 12 (3.05) | MODIS | 118 (8.40) | LiDAR | 293 (10.66) |
| 5 | LiDAR | 370 (8.14) | MODIS | 11 (2.80) | LiDAR | 72 (5.12) | GIS | 218 (7.93) |
| 6 | deforestation | 161 (3.54) | conservation | 11 (2.80) | biodiversity | 49 (3.49) | deforestation | 115 (4.18) |
| 7 | conservation | 146 (3.21) | biodiversity | 9 (2.29) | NDVI | 42 (2.99) | conservation | 97 (3.53) |
| 8 | biodiversity | 136 (2.99) | modeling | 8 (2.04) | deforestation | 39 (2.78) | biodiversity | 78 (2.84) |
| 9 | NDVI | 124 (2.73) | land-cover | 8 (2.04) | conservation | 38 (2.70) | climate change | 78 (2.84) |
| 10 | protected area | 106 (2.33) | deforestation | 7 (1.78) | protected area | 36 (2.56) | NDVI | 78 (2.84) |
| 11 | land-use | 105 (2.31) | fragmentation | 7 (1.78) | land-cover | 34 (2.42) | protected area | 68 (2.47) |
| 12 | land-cover | 104 (2.29) | land-use | 7 (1.78) | land-use | 32 (2.28) | land-use | 66 (2.40) |
| 13 | climate change | 99 (2.18) | disturbance | 6 (1.53) | wetland | 32 (2.28) | land-cover | 62 (2.26) |
| 14 | change detection | 95 (2.09) | mapping | 6 (1.53) | change detection | 31 (2.21) | change detection | 60 (2.18) |
| 15 | wetland | 87 (1.91) | forest | 6 (1.53) | tropical forest | 29 (2.06) | land-use change | 59 (2.15) |
| 16 | land-use change | 83 (1.83) | LiDAR | 5 (1.27) | land-cover change | 29 (2.06) | wetland | 54 (1.97) |
| 17 | monitoring | 82 (1.80) | habitat fragmentation | 5 (1.27) | monitoring | 28 (1.99) | random forest | 52 (1.89) |
| 18 | land-cover change | 77 (1.69) | fire | 5 (1.27) | land-use change | 23 (1.64) | ecosystem service | 52 (1.89) |
| 19 | forest | 68 (1.50) | classification | 5 (1.27) | forest | 22 (1.57) | monitoring | 51 (1.86) |
| 20 | soil erosion | 62 (1.36) | satellite remote sensing | 5 (1.27) | hyperspectral | 22 (1.57) | REDD | 44 (1.60) |
Table 5.
The main remote sensing monitoring methods used for protected areas (PAs).
| Rank | Methods | Number | Percentage % |
|---|---|---|---|
| 1 | classification | 526 | 11.57 |
| 2 | time-series analysis | 288 | 6.34 |
| 3 | model method | 159 | 3.50 |
| 4 | object-oriented method | 131 | 2.88 |
| 5 | visual analysis | 95 | 2.09 |
| 6 | direct comparison | 72 | 1.58 |
| 7 | hybrid methods | 57 | 1.25 |
© 2020 by the authors. Licensee MDPI, Basel, Switzerland. This article is an open access article distributed under the terms and conditions of the Creative Commons Attribution (CC BY) license (http://creativecommons.org/licenses/by/4.0/).
Share and Cite
MDPI and ACS Style
Duan, P.; Wang, Y.; Yin, P. Remote Sensing Applications in Monitoring of Protected Areas: A Bibliometric Analysis. Remote Sens. 2020, 12, 772. https://doi.org/10.3390/rs12050772
AMA Style
Duan P, Wang Y, Yin P. Remote Sensing Applications in Monitoring of Protected Areas: A Bibliometric Analysis. Remote Sensing. 2020; 12(5):772. https://doi.org/10.3390/rs12050772
Chicago/Turabian StyleDuan, Peili, Yeqiao Wang, and Peng Yin. 2020. "Remote Sensing Applications in Monitoring of Protected Areas: A Bibliometric Analysis" Remote Sensing 12, no. 5: 772. https://doi.org/10.3390/rs12050772
Note that from the first issue of 2016, this journal uses article numbers instead of page numbers. See further details here.