Plant Traits Help Explain the Tight Relationship between Vegetation Indices and Gross Primary Production


Department of Earth System Science, University of California, Irvine, CA 92697-3100, USA
*
Author to whom correspondence should be addressed.
Remote Sens. 2020, 12(9), 1405; https://doi.org/10.3390/rs12091405
Submission received: 7 April 2020
/
Revised: 25 April 2020
/
Accepted: 27 April 2020
/
Published: 29 April 2020
(This article belongs to the Special Issue Remote Sensing of Carbon Fluxes and Stocks)
Abstract
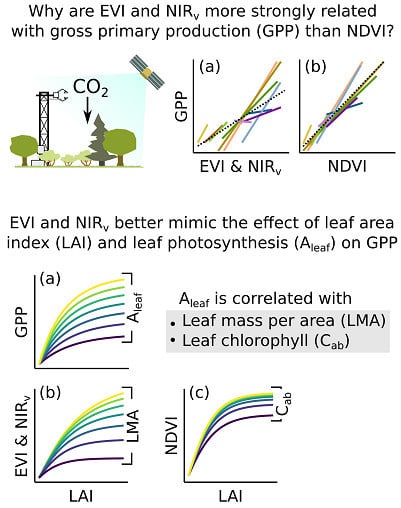
:Remotely-sensed Vegetation Indices (VIs) are often tightly correlated with terrestrial ecosystem CO2 uptake (Gross Primary Production or GPP). These correlations have been exploited to infer GPP at local to global scales and over half-hour to decadal periods, though the underlying mechanisms remain incompletely understood. We used satellite remote sensing and eddy covariance observations at 10 sites across a California climate gradient to explore the relationships between GPP, the Enhanced Vegetation Index (EVI), the Normalized Difference Vegetation Index (NDVI), and the Near InfraRed Vegetation (NIRv) index. EVI and NIRv were linearly correlated with GPP across both space and time, whereas the relationship between NDVI and GPP was less general. We explored these interactions using radiative transfer and GPP models forced with in-situ plant trait and soil reflectance observations. GPP ultimately reflects the product of Leaf Area Index (LAI) and leaf level CO2 uptake (Aleaf); a VI that is sensitive mainly to LAI will lack generality across ecosystems that differ in Aleaf. EVI and NIRv showed a strong, multiplicative sensitivity to LAI and Leaf Mass per Area (LMA). LMA was correlated with Aleaf, and EVI and NIRv consequently mimic GPP’s multiplicative sensitivity to LAI and Aleaf, as mediated by LMA. NDVI was most sensitive to LAI, and was relatively insensitive to leaf properties over realistic conditions; NDVI lacked EVI and NIRv’s sensitivity to both LAI and Aleaf. These findings carry implications for understanding the limitations of current VIs for predicting GPP, and also for devising strategies to improve predictions of GPP.
1. Introduction
Accurate estimates of Gross Primary Production (GPP, i.e., an ecosystem’s ground-area based photosynthetic rate) are needed to better assess ecosystem function and stress, as well as the role of terrestrial ecosystems in the global carbon cycle [1]. The eddy covariance technique provides a relatively direct measure of GPP at scales of a few hundred meters, but the cost and time required to operate eddy covariance sites precludes the deployment of the large network of homogenously-instrumented towers needed to accurately sample global GPP.
Remote sensing provides a cost-effective strategy to extrapolate the GPP observations from eddy covariance towers to larger spatial and longer temporal scales. Remote sensing approaches for GPP extrapolation range from simple empirical relationships to complex models [2,3]. Recent developments using Solar-Induced Fluorescence (SIF) provide a promising approach for extrapolating GPP [4], but the satellite records required for SIF retrieval are brief and/or at coarse spatial resolution (a few years at 10 km or larger; longer at coarser resolution). Vegetation Indices (VIs) provide an alternative, simple approach to extrapolate GPP, which often performs as well as comparatively complex strategies [5,6,7,8,9]. Time series of satellite-based VI observations extend back to at least the mid-1980s, and are available at high spatial (30 m) and temporal resolution (bi-weekly to daily), providing a useful tool for exploring GPP.
Previous analyses have shown strong correlations between selected VIs and GPP, and the resulting empirical relationships are frequently used to extrapolate GPP [5,6,8,10]. Vegetation Indices have been shown to respond to ecosystem attributes such as Leaf Area Index (LAI), fractional vegetation cover and light interception, chlorophyll density and leaf morphology [11,12], which are also related to GPP [13,14,15], but current understanding is mostly qualitative and often links VIs to poorly defined concepts such as “greening” [16,17]. The quantitative, mechanistic linkages between VIs and GPP remain inadequately understood and publications that trace the causal chain from VIs to spectral reflectance to ecosystem biophysical properties to ecosystem metabolism are surprisingly sparse. Moreover, hundreds of alternative VIs have been proposed over the last decades (https://www.indexdatabase.de/), raising questions about whether the current knowledge is sufficient to fully understand the advantages and disadvantages of various VIs, and underscoring the need for more detailed efforts to explore and compare the links between VIs, ecosystem biophysical properties and GPP.
Several key issues remain unresolved, especially related to the mechanisms that link VIs and GPP, and the implications of these mechanisms for the interpretation, generality, advantages, and limitations of specific VIs. We explored these issues for three commonly used VIs: the Normalized Difference Vegetation Index (NDVI), the Enhanced Vegetation Index (EVI), and the Near Infrared Vegetation (NIRv) index:
where Blue, Red, and NIR refer to the reflectance in the blue, red, and Near InfraRed (NIR) wavelengths. Currently, there is no consensus on which of these VIs provides the most universal predictions of GPP, with some studies showing stronger relationships with EVI and NIRv [5,6,7,18] while others suggest that no single vegetation index performs best in all cases and that relationships are site-specific [8,10]. Likewise, understanding of the causal links between these VIs and GPP remains incomplete, and tends to emphasize the importance of LAI, with less attention to a VI’s sensitivity to biophysical attributes related to leaf level metabolism.
NDVI was one of the firsts VIs developed and remains widely used. Previous studies have identified the main plant traits driving VIs using observational data or Global Sensitivity Analyses (GSA) of radiative transfer models. Both data-based and GSA studies have shown that NDVI is particularly sensitive to LAI and chlorophyll density; NDVI saturates at high LAI and is also influenced by soil reflectance [19,20]. Given these sensitivities, some degree of correlation between NDVI and GPP is expected because LAI and leaf chlorophyll largely determine the absorption of photosynthetically active radiation (PAR) radiation in canopies, and also because leaf chlorophyll is a driver of leaf-level photosynthesis [21]. Despite these potentially strong physiological linkages to GPP, NDVI has proven to be a poor predictor of GPP in some cases [10,11]. While some studies assume this issue may be related to NDVI’s saturation to LAI or undesired influence of environmental conditions [18], it is unclear whether this could be related to traits not captured by NDVI.
EVI and NIRv were subsequently developed with the goals of decreasing saturation in dense canopies and reducing cross sensitivity to soil and atmospheric conditions [6,12,22]. EVI and NIRv share NDVI’s sensitivity to LAI, while adding sensitivity to differences in reflectance in the NIR [6,12,20,23]. Prior GSA studies have produced ambiguous relationships between plant traits, EVI and NIRv, suggesting a strong sensitivity to either mean canopy leaf angle or to chlorophyll and leaf mass per area [20,24]. NIR reflectance is related to scattering at air-water interfaces within leaves [25], and studies have shown that NIR reflectance is correlated with LAI and a suite of leaf traits including leaf mass per area, nitrogen content, water content, and canopy traits such as mean leaf inclination angle and canopy shape [26,27,28,29,30]. Some of these leaf traits are correlated with each other, as well as leaf photosynthetic rate [27,29,31,32]. However, we are unaware of previous studies that have quantitatively assessed which of these plant traits are the main drivers of EVI and NIRv across a broader set of biomes, and how these traits mediate or affect the relationship between these VIs and GPP.
We explored the temporal and spatial relationships between NDVI, EVI, NIRv, and GPP across 10 homogenously-instrumented eddy covariance sites in California that spanned a range of climatic conditions. These sites varied markedly in vegetation density and type, and sampled the local analogues of six major terrestrial biomes (grassland, subtropical desert, shrubland, woodland/savanna, temperate forest, and boreal/subalpine forest). We then explored these relationships using radiative transfer and GPP models forced with in-situ plant trait and soil reflectance observations. We focused on two questions: Which Vegetation Index or Indices are most generally correlated with GPP across temporal and spatial scales? What biophysical property or properties mediate the relationships between VIs and GPP?
2. Materials and Methods
2.1. Study Sites
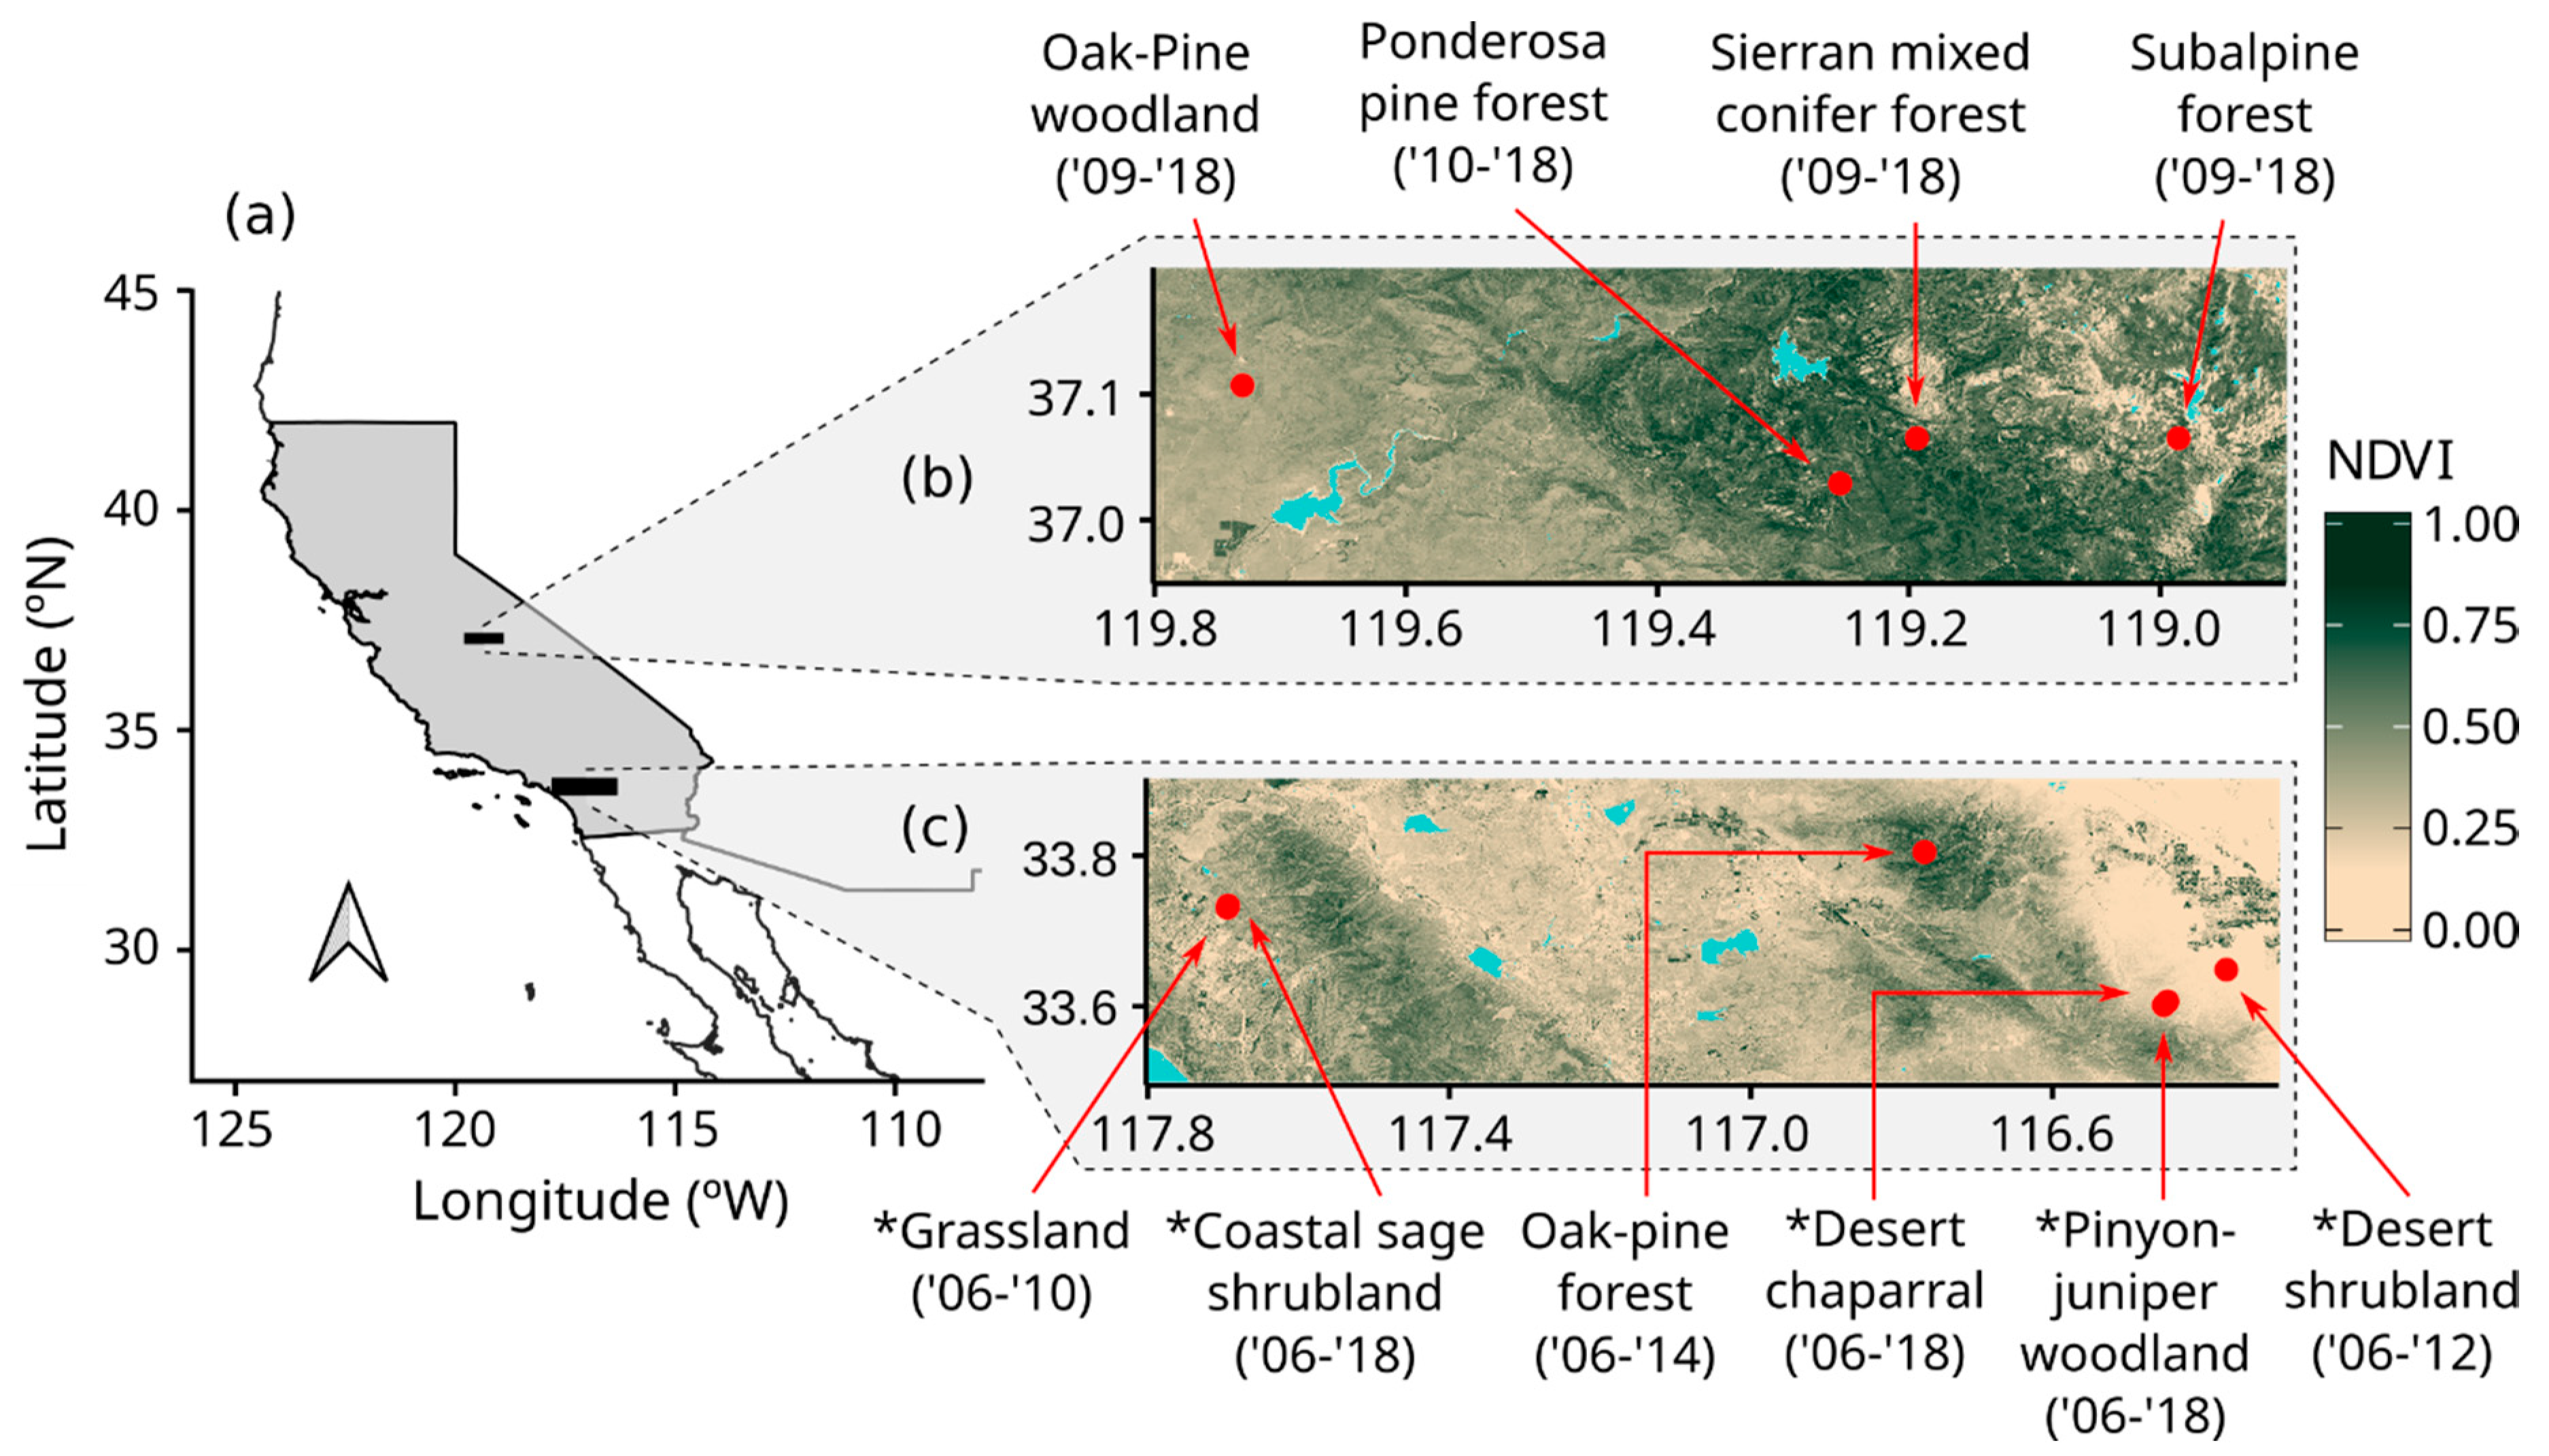
The study focused on existing and new observations at 10 eddy covariance sites across a climate gradient in California (Figure 1). All sites use matched instrumentation and data processing and had existing 5-to-10 year-long eddy covariance records. The sites were located along a broad topographic and climatic gradient ranging from 275 m to 2700 m above sea level, a mean annual precipitation from 129 mm yr−1 to 1078 mm yr−1 and a mean annual temperature from 4.2 °C to 20.9 °C [33]. The sites sample 6 of the 10 major biomes of the world (according to [34]): grassland, subtropical desert, shrubland, woodland/savanna, temperate forest, and boreal/subalpine forest.
2.2. Eddy Covariance and Satellite Observations
Eddy covariance data from these sites has been used to explore the patterns and trends in carbon dioxide and evapotranspiration in California and the Southwestern US [33,35]. The ten sites share the same instrumentation, data processing, and maintenance [36]. The eddy covariance systems consist of a closed-path infrared gas analyzer (LI-7000, LiCor Biosciences) and a 3D sonic anemometer (CSAT-3, Campbell Scientific). Data processing includes corrections for sensor lag, mean wind rotation, and energy budget closure. The net CO2 fluxes were partitioned into respiration and gross uptake (half-hour GPP) by extrapolating light-response curves to darkness. Our analysis focused on the gross uptake during sunny, midday (11:00 to 13:00 local time) periods and we removed observations during cloudy periods or with high vapor pressure deficits (>2 KPa). We focused on midday observations to avoid the confounding effects of seasonal changes in sunlight duration, and the effects of meteorological constraints on photosynthesis, such as low light or high evaporative demand.
We used surface reflectance data for the sites from the MODerate resolution Imaging Spectrometer (MODIS) MCD43A4.006 product (downloaded from AppEEARS; https://lpdaacsvc.cr.usgs.gov/). This product provides daily coverage of surface reflectance (atmospherically corrected) at 500 m spatial resolution adjusted to a nadir view angle and local noon. For most sites, we extracted the time series of the pixel containing the tower location and VIs were estimated from bands 1 (Red), 2 (NIR), and 3 (Blue) according to Equations (1)–(3). Some sites in Southern California have relatively small areas of homogeneous vegetation around the towers relative to the MODIS pixel, and for these sites we used observations for nearby larger patches of well-matched vegetation [33] (Supplementary Material 1). We selected the nearby pixels as the closest ones showing the most similar VIs values to the area around the towers using Landsat imagery, and the similarity in vegetation type and composition at the pixel area was confirmed by visual inspection. MODIS data were filtered for clouds, high aerosols, and conditions leading to poor corrections of sensor view and sun angles according to the quality bands in the MCD43A4.006 product, and for patchy snow based on the Normalized Difference Snow Index (NDSI).
The time spans of eddy covariance and satellite observations used are shown on Figure 1, and ranges from 5 to 10 years of observations for each site, including all seasons of the year and all stages of canopy development.
2.3. Plant Traits and Soil Reflectance at the Study Sites
We sampled plant species cover, LAI, leaf traits, and soil reflectance at five of the study sites around their peak growing season between April and July 2019 (Figure 1, see Supplementary Material 2 for specific sampling dates at each site). In-situ sampling focused on a 90 m by 90 m block in the immediate mean upwind direction from each tower. Plant species cover was measured by intercept along three 90m line-transects in the block. LAI was measured at 5 m intervals along each transect with a LI-COR LAI-2000 (LI-COR Biosciences, Lincoln, NE, USA). LAI measurements were made with a 90o field of view restrictor and around sunrise or sunset to avoid direct sunlight.
Leaf samples were collected and leaf gas exchange measurements were made on five or six of the most abundant species at each site (according to species cover data). Five mature plants were sampled for each species, and five or six leaves (or approximately 0.2 g of leaves for small leaved species) were collected. Fresh leaf area and weight and dry weight were measured and used to calculate the leaf mass per area (LMA) and leaf water content (Wc) [37]. The light-saturated leaf photosynthesis rate per leaf area (Aleaf) was measured on one sun-exposed leaf of each plant using a LI-COR LI-6400 (LI-COR Biosciences) with a blue-red LED light. Gas exchange was measured at near ambient temperature and humidity, 2000 µmol m−2 s−2 photosynthetically active radiation and 400 µmol mol−1 CO2. The community weighted trait means were calculated for each site by weighting traits by species cover [38]. The bare soil spectral reflectance was measured at five locations using an ASD FieldSpec HandHeld 2 (ASD Inc, Boulder CO) at midday. Each measurement was the average of five readings taken with a 34 ms integration time, corrected by dark current and calibrated with a Spectralon panel. The median of the five measurements per site was used for further analysis.
2.4. Radiative Transfer and Gross Primary Production (GPP) Models
A simple canopy photosynthesis model [50] (Thornley’s model) was used to explore the links between plant traits and GPP. This model integrates a non-rectangular hyperbola leaf photosynthetic light response curve through the canopy. Its main inputs are incident photosynthetically active radiation (PAR), leaf light response parameters, leaf transmittance, light saturated leaf photosynthetic rate (Aleaf), leaf area index (LAI), and canopy light extinction coefficient.
The PROSAIL radiative transfer model was used to explore the links between plant traits and spectral reflectance. PROSAIL couples leaf (PROSPECT 5) and canopy (4SAIL) radiative transfer models to simulate the effects of plant traits, soil reflectance, and view and sun geometry on land surface reflectance [51]. PROSAIL inputs include leaf chlorophyll per area (Cab), Leaf Mass per Area (LMA), leaf structure (number of air-cell wall interfaces), carotenoid and brown pigment content, water content per leaf area (Wc), and Leaf Area Index (LAI).
We applied variance-based global sensitivity analyses [52,53] to the Thornley and PROSAIL models to identify the plant traits and other inputs that drive GPP and the VIs. The analysis of the Thornley model was run using the R sensitivity package v1.18.0. The analysis on PROSAIL was run using the Global Sensitivity Analysis module v.1.08 of the ARTMO toolbox v.3.25 [54]. Previous sensitivity analysis on VIs have emphasized crop species, and parameter ranges has been either tailored for such ecosystems or arbitrarily selected [20,24]. The results of global sensitivity analyses depend heavily on the range of inputs specified, and we selected ranges that represent the variation across our study sites or from literature datasets that covered a diverse array of species and biomes (see Appendix A for details). The global sensitivity analyses of both models used 2000 samples per input parameter following a Sobol sampling scheme.
Once the drivers and factors driving GPP and VIs were identified, we compared the results of Thornley and PROSAIL models forced with in-situ information from these main drivers to further explore how plant traits link VIs to GPP (see Appendix B for details).
3. Results
3.1. Correlations between Vegetation Indices (Vis) and GPP
We analyzed the relationships between satellite VIs and midday GPP within individual sites to assess the effects of temporal variation within sites (separate regression lines for each site in Figure 2), and across all sites to assess the between-ecosystem type generality (dashed lines in Figure 2). The within site relationships between GPP and both EVI and NIRv were tighter than those for NDVI (Supplementary Material 3). The within site relationships were weakest in the three sites that were dominated by evergreens (oak-pine, sierra mixed conifer, and subalpine forests), especially for NDVI. Comparatively weak temporal relationships at evergreen sites could be expected given the low seasonal variation in canopy biophysical properties [11]. The temporal relationships between GPP and both EVI and NIRv had more consistent intercepts and slopes between sites than did those with NDVI (Figure 2, Table S3). This resulted in stronger across-site relationships for EVI and NIRv than for NDVI.
3.2. Plant Traits Influencing GPP
Our global sensitivity analysis of Thornley’s GPP model showed that LAI (m2 leaves m−2 ground) and leaf CO2 uptake (Aleaf; the CO2 uptake m−2 leaf) are the main determinants of short-term GPP (CO2 uptake m−2 ground) during well-illuminated, unstressed conditions (Figure 3a). Both aspects have a similar contribution to GPP (LAI accounts for 48%, and Aleaf accounts for 42%, of overall GPP variation). All of the other attributes, including mean leaf angle, have a relatively minor contribution. GPP modeled with these two traits closely matched the observed variation of GPP among sites (Supplementary Material 4).
We further explored how LAI and Aleaf influence GPP (Figure 3b). GPP increases with increasing LAI and the fraction of light intercepted by leaves before saturating and reaching 80% of its maximum response around 2.5–3 m2 m−2. Conversely, increasing Aleaf caused a comparatively steady increase in GPP, with only minor saturation. LAI and Aleaf have a multiplicative effect over GPP, such that the sensitivity of GPP to Aleaf increases with LAI.
Our analysis of leaf traits at the study sites showed that light-saturated leaf photosynthesis (Aleaf) was negatively correlated to LMA (log-log relationship, r2 = 0.32, p = 0.002), with relatively thick, high LMA leaves showing a lower Aleaf. A similar pattern occurred across sites, where community weighted Aleaf decreased with increasing LMA (Figure 4). Previous analyses have also reported a correlation between LMA and Aleaf [56,57]. The relationship between LMA and leaf photosynthesis reflects a series of tradeoffs and convergent evolutionary strategies along the leaf economics spectrum: thicker leaves are longer lived, with lower nutrient content and slower rates of photosynthesis [31,32].
3.3. Plant Traits Influencing VIs and Their Linkage to GPP
Global sensitivity analyses with PROSAIL were used to investigate the importance of ecosystem properties on spectral reflectance (Figure 5a) and Vegetation Indices (Figure 5b). Red reflectance is strongly driven by LAI and chlorophyll concentration (Cab), while NIR reflectance is influenced by LMA and to a lesser extent LAI. NDVI is particularly sensitive to LAI and Cab (driving 65 and 23% of overall NDVI variation, respectively), and mirroring the importance of these properties in driving red reflectance. NDVI is largely insensitive to LMA, apparently because the calculation of NDVI under typical conditions deemphasizes changes in NIR reflectance. EVI and NIRv were sensitive to LAI and LMA, with both properties showing a similar importance. These two VIs showed increased sensitivity to NIR reflectance relative to NDVI, a pattern that has been discussed previously [6,12]. Other parameters, including sun and sensor view angles and leaf angle, have a smaller effect on these VIs. The VIs predicted using PROSAIL driven with site-specific data captured the observed variation of MODIS VI at the study sites (Supplementary Material 4).
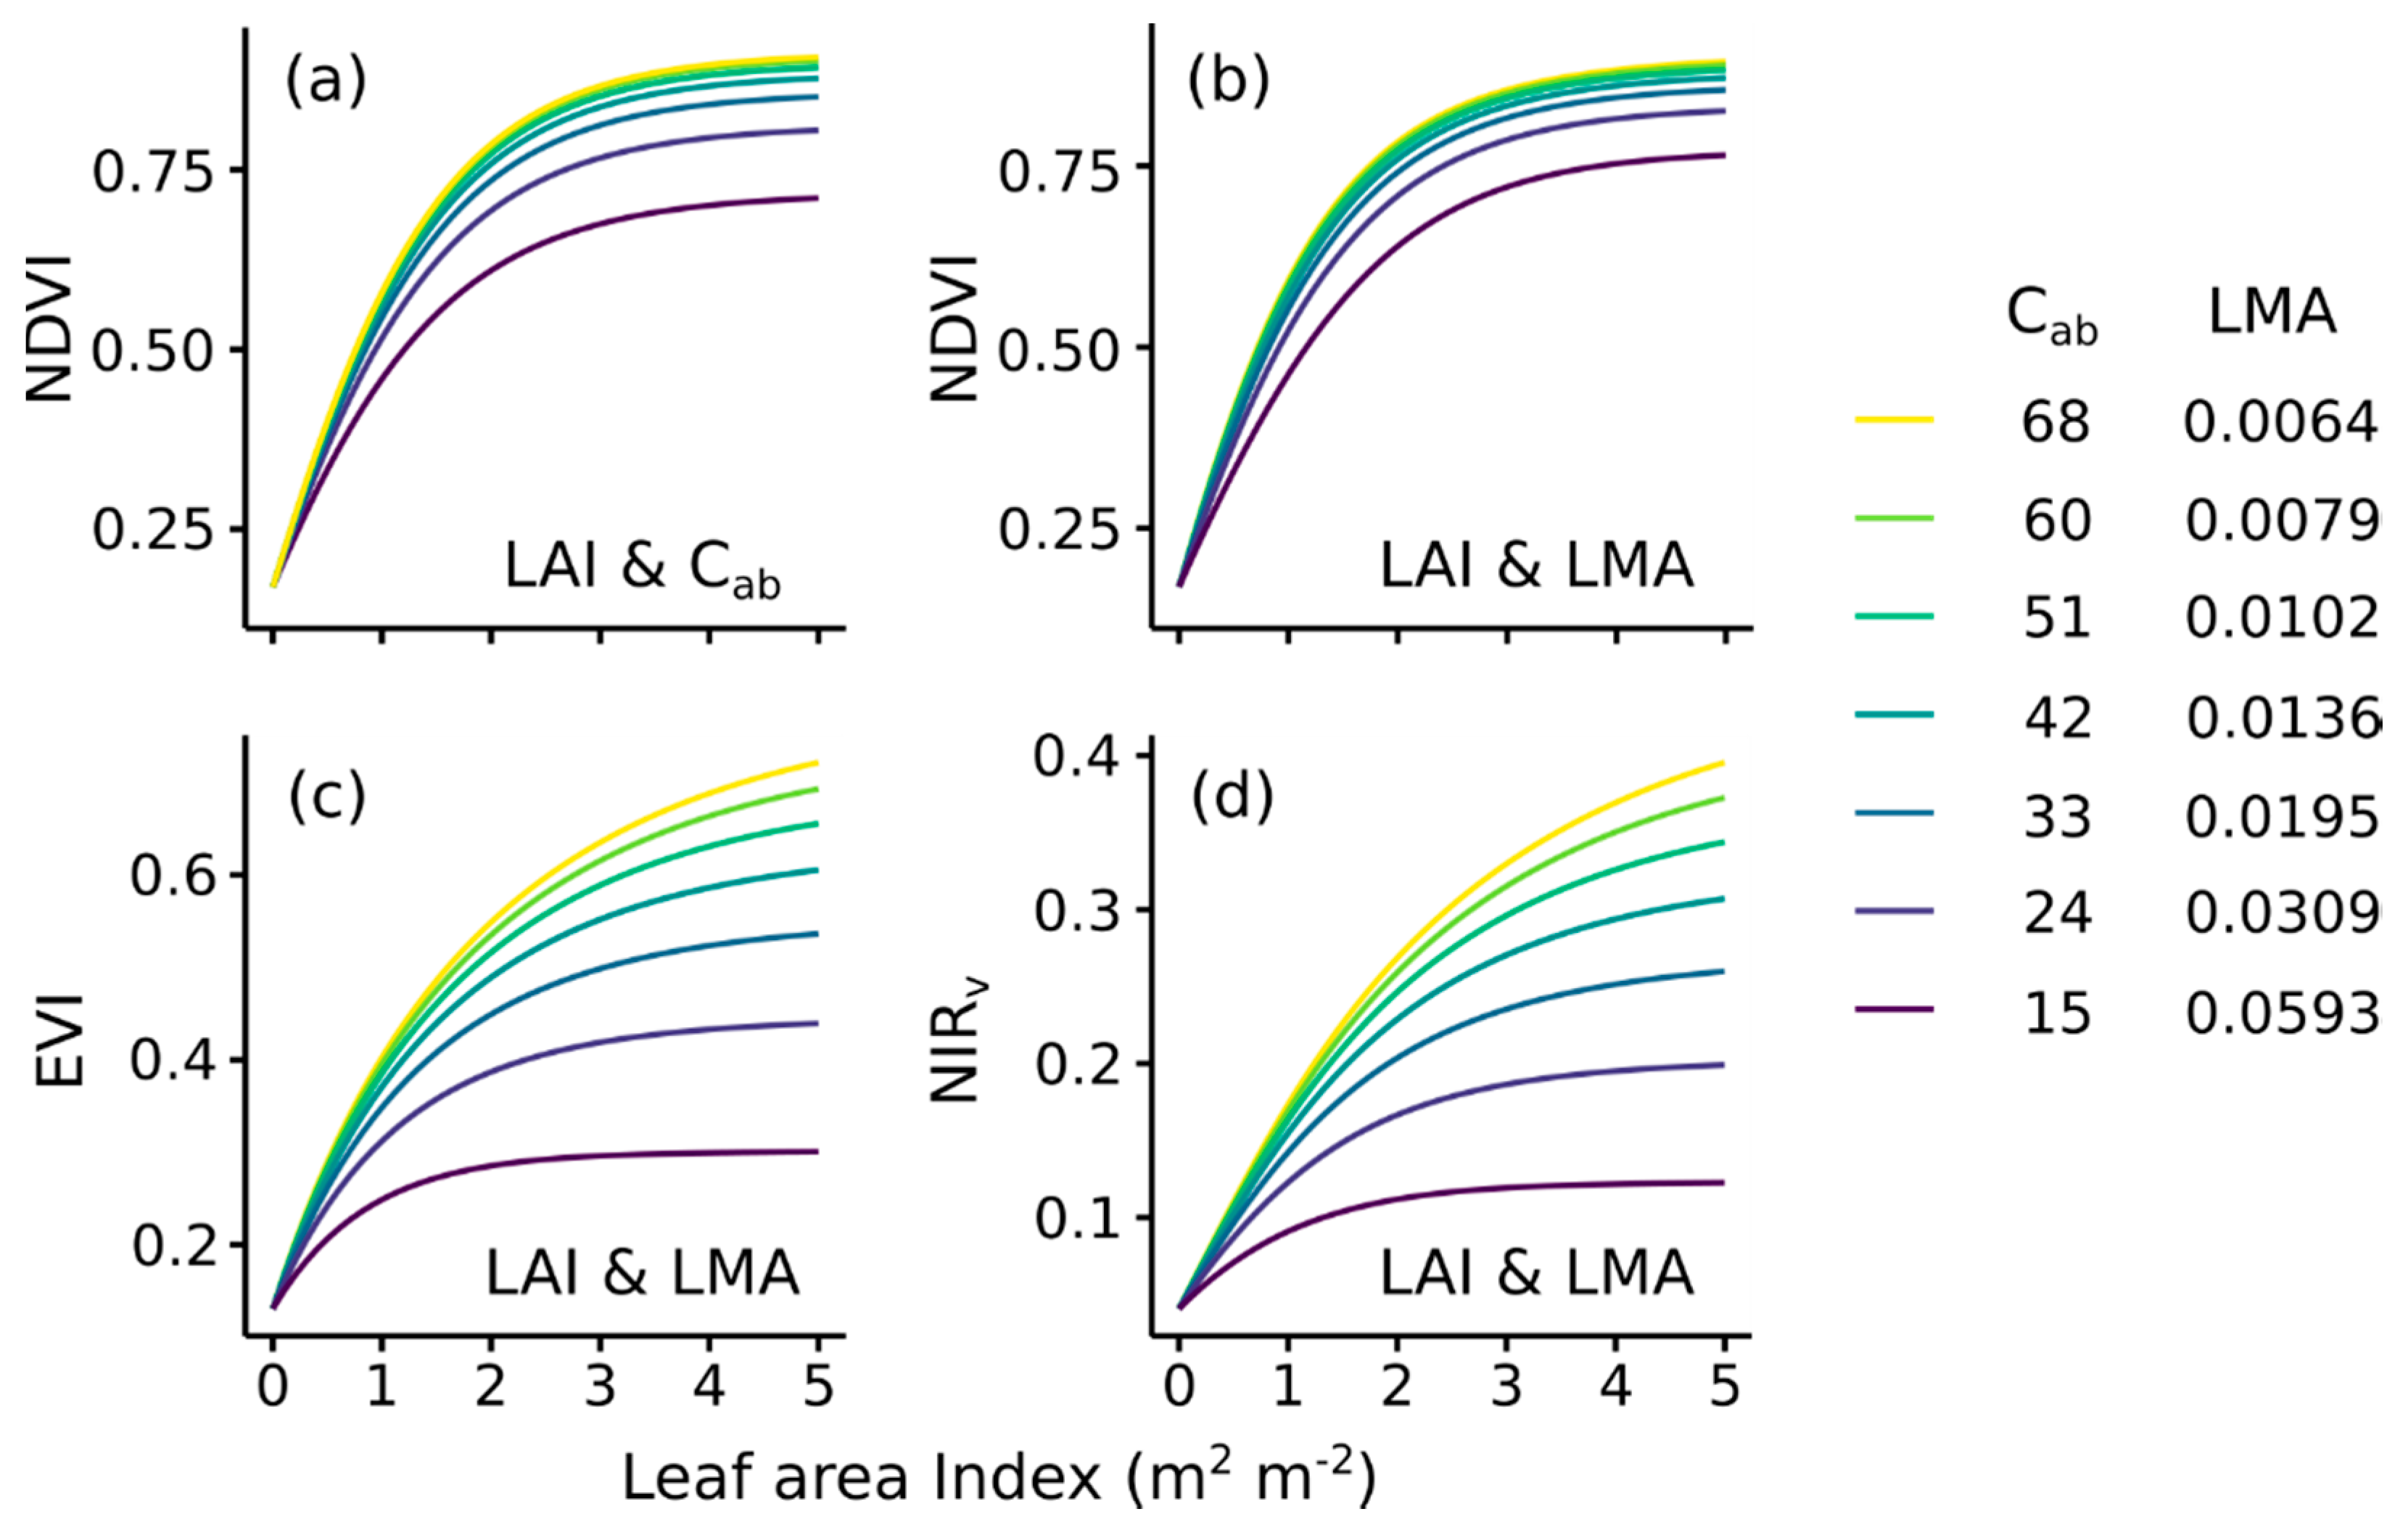
We further explored how LAI, Cab, and LMA and their interactions control the value of VIs (Figure 6). NDVI showed the sharpest saturation to LAI, reaching 80% of maximum LAI response at ~1.7 m2 m−2. NDVI also showed a sharp saturation to Cab, reaching 80% of maximum response at a Cab of ~17 µg cm−2, which is within the lower range of values observed at the sites (Supplementary Material 5). NDVI’s sharp saturation at low Cab and its low sensitivity to LMA prevents NDVI from fully capturing an optical signal of a leaf trait that is related to Aleaf (Figure 6a,b).
EVI and NIRv had a comparatively less sharp saturation to LAI than NDVI, with its saturation to LAI varying with LMA up to 3 m2 m−2. Furthermore, the value of EVI and NIRv saturated modestly with increasing LMA across the range of values observed at the sites. This implies that decreasing LMA from the lowest value (similar to that of the Pinyon-juniper woodland) to the highest value (similar to that of the grassland), causes a relatively large increase in EVI and NIRv. EVI and NIRv’s balanced sensitivity to LAI and LMA, low saturation to the signal of a leaf trait related to Aleaf, and multiplicative sensitivity to LMA and LAI, allowed both VIs to largely mimic the response of GPP to LAI and Aleaf (Figure 3b and Figure 6c,d).
3.4. Relationships among VIs
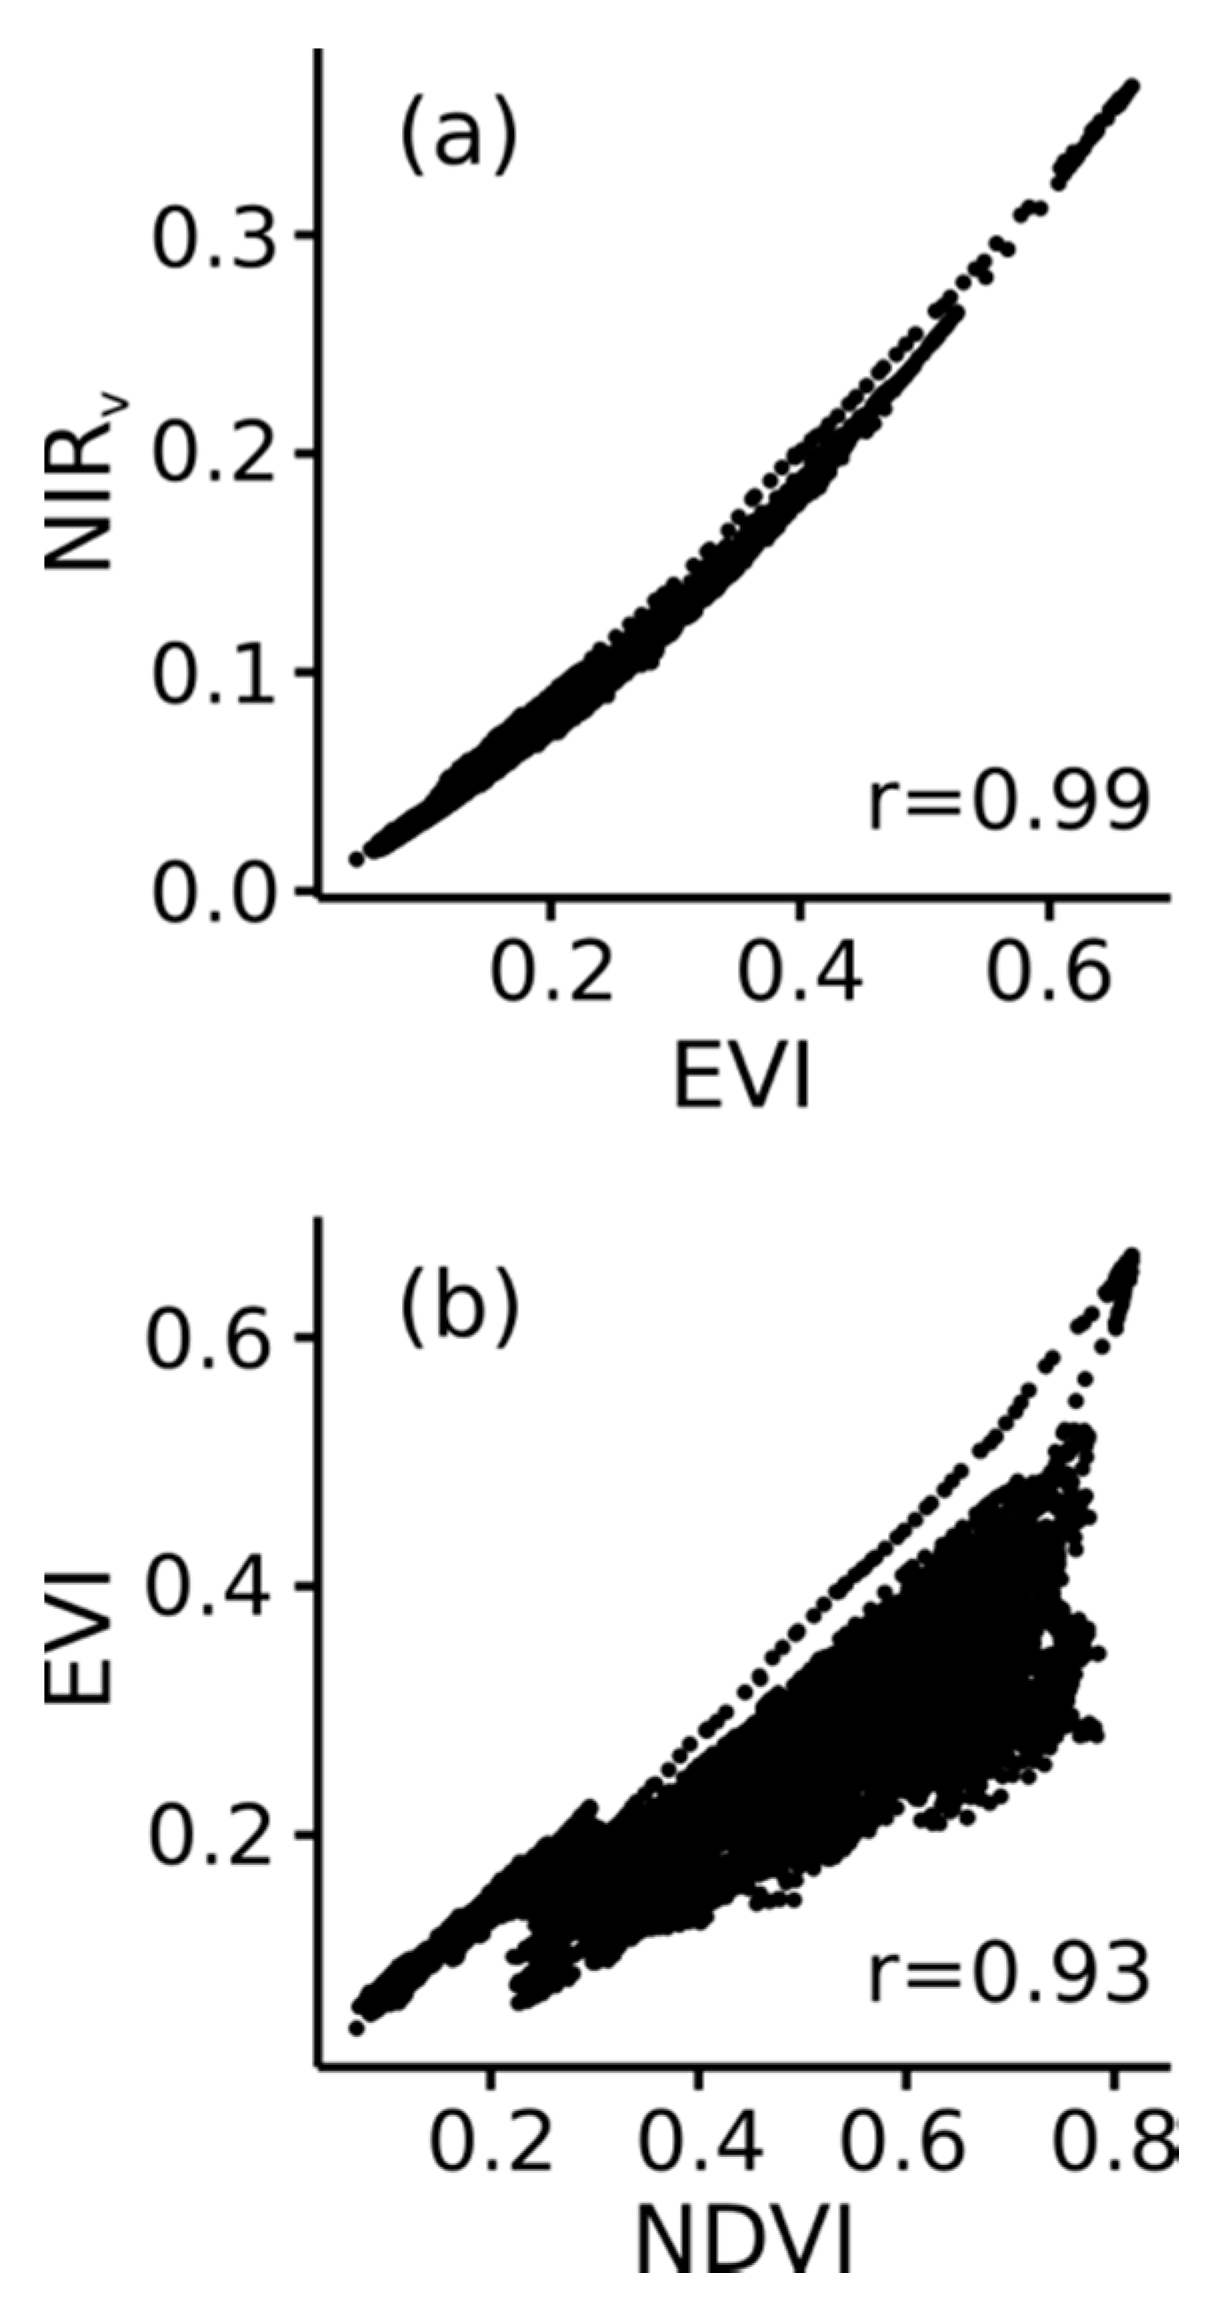
EVI and NIRv showed similar patterns throughout the analyses (Figure 2b,c, Figure 5b, Figure 6c,d), leading us to wonder how tightly correlated these VIs are across typical conditions and whether they provide complementary or redundant information. A further exploration of the MODIS observations revealed a tight correlation between EVI and NIRv, and relatively weak relationships between both of these VIs and NDVI (Figure 7). We found similar relationships in the PROSAIL simulations, suggesting that a tight correlation is a basic characteristic of EVI and NIRv (Supplementary Material 6).
4. Discussion
4.1. Vegetation Indices as General Predictors of GPP
Previous studies have found that no single VI provides a universal predictor of GPP and that the relationships between GPP and VIs are often site- or biome-specific [8,10,18]. We found that the within-site relationships between NDVI and GPP varied between ecosystem types and differed from that observed in the across-site comparison (Figure 2). EVI and NIRv, on the other hand, provided more general predictions of GPP, with temporal relationships that were comparatively consistent across sites. Even at evergreen forests, where all VIs were weaker predictors in our study and others [7,8,11,18], the GPP relationships with EVI and NIRv fall within the range of other sites/biomes. These more universal relationships underscore the utility of EVI and NIRv for extrapolating GPP in the absence of further site- or biome-specific information.
Our analyses revealed strong similarities between EVI and NIRv, and subsequent comparisons showed a tight correlation between EVI and NIRv (Figure 7 and Supplementary Material 6). Previous studies have also pointed to a similar performance between EVI and NIRv [10]. This correlation was unexpected given the mathematical differences between the two VIs. EVI was designed to reduce cross sensitivity to soil and atmospheric conditions, while reducing saturation in dense canopies [22]; previous studies have shown EVI has enhanced sensitivity to variation in NIR reflectance [23]. In a similar way, the design and derivation of NIRv arose from an attempt to isolate the NIR reflectance of the vegetation from that of the soil [6,58]. Our analyses confirm the strong similarity between EVI and NIRv is a consequence of the shared sensitivity to traits influencing NIR, and the reduced influence from Red reflectance and soil reflectance. We conclude that the information provided by EVI and NIRv is largely redundant, and that both are similarly useful for inferring GPP, phenology, and other ecosystem properties [5,6,58,59].
4.2. Explaining the Differential Performance of Vegetation Indices
The PROSAIL analyses showed that NDVI is particularly sensitive to LAI and Cab (Figure 5; [11,19]), while EVI and NIRv are sensitive to LAI and LMA. EVI and NIRv’s increased sensitivity to LMA is the main characteristic that separates these VIs from NDVI, and that we believe leads to their more general relationships with GPP. The relationships between LMA and EVI and NIRv are apparently driven by a decrease in NIR reflectance with progressively thicker leaves. LMA is not a dominant controller of leaf-level NIR reflectance [60], but becomes important at the canopy level due to the absorption of light by lignin and cellulose [61]. Thicker, higher LMA leaves with more lignin and cellulose absorb more NIR for a given LAI, leading to increased light absorption, and reduced canopy-level NIR reflectance, and consequently reduced EVI and NIRv [51].
LMA is one of several leaf traits that co-vary along the leaf economic spectrum [32]. Thicker leaves with a higher LMA are globally correlated with longer leaf life spans, lower leaf nitrogen concentrations, and lower rates of leaf photosynthesis. The leaf economic relationships are strongest when compared on a mass vs mass basis, whereas our LMA vs Aleaf relationship is presumably mediated by leaf biochemistry and should be thought of as a mass vs area comparison [31,32,56,57]. Nonetheless, previous studies have found that leaf nitrogen content per mass combined with LAI largely explains GPP variation across sites and biomes [15,28,62].
LMA may be thought of as a proxy for leaf nitrogen content and photosynthetic rate, and VIs that are influenced by both LAI and LMA will provide more general predictions of GPP than ones that are influenced mainly by LAI. Hence, seasonal or interannual GPP shifts associated with the initial flushing of young, lower LMA, rapidly photosynthesizing leaves, and the gradual aging to thicker leaves with lower photosynthetic rates [39,63,64,65,66] may be effectively explored with VIs such as EVI and NIRv. Likewise, the GPP effects of seasonal, interannual, or successional shifts from herbaceous to evergreen leaf importance may be detected using VIs such as EVI and NIRv.
We have argued that EVI and NIRv are particularly well correlated with GPP because they are influenced by both LAI and LMA. However, we have also shown that NDVI is sensitive to Cab content (Figure 5b), which is also correlated with leaf level CO2 uptake [21], raising the question of the apparent insensitivity of NDVI to the leaf-level component of GPP. Previous studies have assumed that a weaker relationship between NDVI and GPP is caused by saturation at high LAI or environmental influences that are not related to plant physiology [18]. Here we have shown that NDVI saturates at relatively low values of Cab (Figure 6a) due to strong chlorophyll absorption at red wavelengths (Figure 5a). Hence, NDVI is relatively insensitive to Cab over the typical conditions observed for upper-canopy leaves, and NDVI lacks strong sensitivity to a leaf trait that is well correlated with Aleaf. In contrast, the effect of LMA on EVI and NIRv shows minor saturation across a realistic range of leaf thicknesses (Figure 5c,d).
4.3. Implications and Opportunities
A site’s GPP ultimately reflects the combination of LAI and Aleaf (Figure 3). The ideal VI should show sensitivity to LAI and a similarly strong, multiplicative sensitivity to some aspect of the land surface that is closely related to Aleaf (Figure 4, [50]). EVI and NIRv do a better job of mimicking this sensitivity than NDVI does (Figure 6c,d vs Figure 3b), and as a result provide tighter relationships with GPP (Figure 2). Nonetheless, there is no reason to believe that EVI or NIRv represent the optimal solution to this problem and alternative VIs may do even better jobs of predicting GPP.
Recent advances in remote sensing and plant physiology may further improve predictions of GPP. Studies are exploring the relationships between plant traits and GPP across ecosystem types [14,15,28,62]. Plant trait complexes have relatively strong spectral signals over visible and near infrared broad-bands [67], and advances in simulating canopy radiation transfer should allow further explorations of the links between GPP and surface reflectance [68]. Alternative VIs that better mimic the relative importance of LAI and Aleaf in controlling GPP, or that more correctly account for the rate that the LAI and Aleaf controls on GPP saturate (Figure 3, Figure 6), may provide even more general predictions of GPP. Likewise, alternative VIs or retrieval approaches that combine sensitivity to LAI with a proxy that is better correlated with Aleaf than is LMA (Figure 4; [21,31,32]) may provide improved predictions of GPP.
5. Conclusions
We explored the relationships and underlying linkages between Gross Primary Production (GPP) and three commonly used Vegetation Indices: NDVI, EVI, and NIRv. We analyzed data from 10 eddy covariance sites located in the California analogues of six major terrestrial biomes, and found that GPP, EVI and NIRv have strong and convergent within- and between-site relationships, whereas NDVI and GPP showed weaker and more site-specific relationships.
Our analyses showed that GPP is driven by the multiplicative interaction between leaf area index (LAI) and leaf-level CO2 uptake (Aleaf), with the importance of Aleaf increasing with LAI. This analysis led us to conclude that a VI that is sensitive to the interacting effect of LAI and Aleaf should provide better predictions of GPP than a VI that is sensitive to just one of these properties. Moreover, we found that leaf mass per area (LMA) provides a proxy for Aleaf, with thicker leaves showing lower rates of Aleaf. Finally, we found that EVI and NIRv are strongly sensitive to LMA and LAI, whereas NDVI is most strongly controlled by LAI over a range of realistic conditions. Hence, we conclude that the comparatively tight relationships between GPP, EVI, and NIRv are driven by the multiplicative sensitivity of these two VIs to LAI and LMA, which largely mimics the response of GPP to LAI and Aleaf. NDVI is comparatively less sensitive to a leaf trait that is tied to leaf photosynthesis, which explains its weaker correlation with GPP.
Our analysis provides a roadmap for more mechanistically linking VIs, ecosystem biophysical properties, and GPP, and implies that VIs that better mimic GPP’s sensitivity to LAI and Aleaf may provide more general predictions of canopy photosynthesis.
Supplementary Materials
The following are available online at https://www.mdpi.com/2072-4292/12/9/1405/s1, Supplementary Material 1: Location of MODIS pixels used for each site; Supplementary Material 2: Plant traits at the study sites; Supplementary Material 3: Details about the relationships between vegetation indices and gross primary production; Supplementary Material 4: Analysis with Thornley (2002) and PROSAIL models; Supplementary Material 5: Leaf chlorophyll data from plant species from Southern California and Sierra Nevada; Supplementary Material 6: Correlations between vegetation indices: results from PROSAIL; Supplementary Material 7: Compilation of field measurements of mean canopy leaf angles.
Author Contributions
Conceptualization, C.H.-H. and M.L.G.; Formal analysis, C.H.-H. and M.L.G.; Investigation, C.H.-H.; Methodology, C.H.-H. and M.L.G.; Resources, M.L.G.; Supervision, M.L.G.; Validation, C.H.-H.; Visualization, C.H.-H.; Writing—original draft, C.H.-H. and M.L.G.; Writing—review & editing, C.H.-H. and M.L.G. All authors have read and agreed to the published version of the manuscript.
Funding
The research was funded by a UC MEXUS-CONACYT Postdoctoral Fellowship to CHH and NASA grant NNX15AU16A to MLG.
Acknowledgments
This manuscript was improved by inputs from three anonymous reviewers. We thank Christopher Ward, Carl Norlen, Laura V. Arvizu-Valenzuela, Melissa Thayer and Amos Zerah for helping with the field and laboratory measurements. The fieldwork was conducted at the University of California Natural Reserve System’s Boyd Deep Canyon Desert Research Center and James San Jacinto Mountain Reserve; at the Southern Sierra Critical Zone Observatory sites in the Sierra National Forest, and at field sites managed by the Irvine Ranch Conservancy. We made use of data from the TRY initiative on plant traits (http://www.try-db.org). The TRY initiative and database is hosted, developed and maintained by J. Kattge and G. Bönisch (Max Planck Institute for Biogeochemistry, Jena, Germany). TRY is currently supported by DIVERSITAS/Future Earth and the German Centre for Integrative Biodiversity Research (iDiv) Halle-Jena-Leipzig.
Conflicts of Interest
The authors declare no conflict of interest.
Appendix A. Parametrization of the Global Sensitivity Analyses
The global sensitivity analysis for the Thornley GPP model was ran over the following ranges: 5.8–19.4 µmol CO2 m−2 s−1 for Aleaf, 4.58 × 10⁻⁹–1.411 × 10⁻⁸ kg CO2 J−1 PAR for the quantum yield (based on ranges for C3 species from [69]), 0.5–0.95 for the curvature coefficient of the leaf light response [50], 0.005–0.283 for leaf transmittance, 0–1 for proportion of direct radiation, and 14–65° for sun zenith angle. The range used for Aleaf reflects the community weighted means found at our study sites. The range of leaf transmittance was the minimum and maximum transmittance (averaged over 400–700 nm) obtained from PROSPECT runs varying leaf parameters over the same ranges as those used in the global sensitivity analyses of PROSAIL. The ranges for LAI and canopy mean leaf angle matched those used in the PROSAIL global sensitivity analysis (see below). Beam irradiance was fixed at 435 W PAR m−2, which approximates 2000 µmol photons m−2 s−1 (a typical value for full direct sunbeam), and the effect of varying irradiance was taken into account by varying sun zenith angle.
The original Thornley model does not explicitly include sun zenith angle or mean canopy leaf angle. The sun zenith angle influences the irradiance at the canopy, and both leaf angle and sun angle influence the extinction coefficient of the canopy. Following Lambert’s cosine law, the sun zenith angle influences the irradiance I over a horizontal surface is
where I0 is the beam irradiance and θsz is the sun zenith angle. Following Ross [70] and Fuchs et al. [71], the sun zenith angle and the canopy mean leaf angle θl influence the canopy extinction coefficient K according to
Our sensitivity analysis of GPP did not explicitly incorporate the effect of other potentially important variables such as air or leaves temperature. However, previous studies have shown that the important controlling effect of plant traits over GPP holds regardless of variation in these meteorological conditions [15,62].
We ran the global sensitivity analysis of the PROSAIL model over the following ranges: 9–58 µg cm−2 for leaf chlorophyll content (see Supplementary Material 5, [72]); 1–4 for the leaf structure parameter [73]; 0.0064–0.0526 g cm−2 for LMA; 0.0146–0.0771 g cm−2 for Wc, and 0.1–5 m2 m−2 LAI. The ranges of LMA and Wc were determined by the variation in community weighted mean traits observed at the sites. The range of LAI exceeded the actual ranges observed at the sites (observed range 0.2–3.0 m2 m−2 at 5 sites). Ranges for other parameters were 25–63° for mean leaf angle (based on a review of published values [74], see Supplementary Material 7), 0.0001–0.01 for hotspot (approximate range for the sites according to leaf width divided by canopy height), 0–1 for the soil parameter, 0–1 for proportion of diffuse to direct radiation, 14–65o for solar zenith angle, 0–60° for view zenith angle of the sensor, and 0–180o for the relative azimuth angle between the sun and sensor. The ranges for solar and view angles are based on exploratory analyses of MODIS imagery and MODIS specifications. We ignored variation in carotenoid and brown pigments, given the paucity of field observations and lack of a major effect on reflectance [75].
Previous global sensitivity analyses have used the maximum possible range for mean canopy leaf angles (i.e., 0–90°), and have shown that leaf inclination exerts a strong control over NIR and vegetation indices such as EVI [20,54]. Our review of published measurements of mean leaf angles shows a comparatively narrower range of leaf inclination angles (Supplementary Material 7), and suggests that some previous analyses may have overestimated the importance of leaf inclination in NIR reflectance.
Appendix B. Analysis with Thornley (2002) and PROSAIL Models
We used the model of Thornley [50] to predict gross primary production (GPP) in Figure 3b. This model integrates a non-rectangular hyperbola leaf light response curve through the canopy, accounting for leaf acclimation to sun and shade conditions. It models GPP from incident photosynthetically active radiation (PAR), the leaf light response parameters of light saturated photosynthetic rate sunlit leaves (Aleaf), maximum quantum yield, and a light response curvature parameter. Canopy inputs are leaf area index (LAI), light extinction coefficient, and leaf transmission coefficient. For Figure 3b, we set the quantum yield to 9.118121 × 10⁻⁹ Kg CO2 J−1 (the average value for C3 species from [69]), a curvature parameter of 0.9 [50], a proportion of direct radiation of 0.9, an extinction coefficient of 0.5 (spherical leaf angle distributions, [76]), leaf transmission coefficient of 0.1 (see Appendix A, [50]), and a PAR of 435 W PAR m−2 (equivalent to about 2000 μmol m−2 s−1). We varied LAI from 0–5 m2 m−2 and Aleaf 5–20 µmol m−2 s−1, approximating the range of community weighted means found at our sites (5.8–19.4 µmol m−2 s−1).
The PROSAIL model predictions in Figure 6 were calculated with the following inputs: 1.5 for leaf structure parameter (typical value for healthy leaves, [73]), 0 for leaf carotenoid and brown pigment content per area (see Appendix A), the average leaf water observed at the field sites (0.0384 g cm−2), a spherical leaf angle distribution, hot spot value of 0.01, 10% fraction of diffuse to direct radiation, and a fixed soil reflectance; 0° for view angle (from nadir), 0° view-sun angle azimuth difference, and sun zenith angle of 22° (average value at midday during spring at our sites). LAI was varied from 0 to 5 m2 m−2, and leaf chlorophyll content (Cab) or leaf mass per area (LMA) were varied or fixed as specified in the figure panel (Figure 6); fixed values were 30 µg cm−2 for Cab (see Supplementary Material 5) and 0.024 g cm−2 for LMA (the average at our sites). The levels of Cab or LMA used in Figure 6 correspond to the leaf photosynthetic rates shown in Figure 3b (see Figure 6 legend), and approximate the ranges at the field sites (Figure 4, Supplementary Material 5). The quantitative crosswalk between LMA in Figure 6 and leaf photosynthetic rate (Figure 5 legend) was based on Figure 4. The crosswalk between Cab and leaf photosynthetic rate (Figure 6 legend) was based on [21], which related Cab to the leaf maximum carboxylation and electron transport capacities, and then extrapolated to Aleaf following [77] implemented in plantecophys R package [78]. The leaf photosynthesis model assumed a leaf temperature of 25°C and an intercellular CO2 concentration of 256 µmol mol−1 (the average values in our field measurements).
References
- Ryu, Y.; Berry, J.A.; Baldocchi, D.D. What is global photosynthesis? History, uncertainties and opportunities. Remote Sens. Environ. 2019, 223, 95–114. [Google Scholar] [CrossRef]
- Song, C.; Dannenberg, M.P.; Hwang, T. Optical remote sensing of terrestrial ecosystem primary productivity. Prog. Phys. Geogr. 2013, 37, 834–854. [Google Scholar] [CrossRef]
- Xiao, J.; Chevallier, F.; Gomez, C.; Guanter, L.; Hicke, J.A.; Huete, A.R.; Ichii, K.; Ni, W.; Pang, Y.; Rahman, A.F.; et al. Remote sensing of the terrestrial carbon cycle: A review of advances over 50 years. Remote Sens. Environ. 2019, 233, 111383. [Google Scholar] [CrossRef]
- Xiao, J.; Li, X.; He, B.; Arain, M.A.; Beringer, J.; Desai, A.R.; Emmel, C.; Hollinger, D.Y.; Krasnova, A.; Mammarella, I.; et al. Solar-induced chlorophyll fluorescence exhibits a universal relationship with gross primary productivity across a wide variety of biomes. Glob. Chang. Biol. 2019, 25, e4–e6. [Google Scholar] [CrossRef] [PubMed] [Green Version]
- Badgley, G.; Anderegg, L.D.L.; Berry, J.A.; Field, C.B. Terrestrial gross primary production: Using NIRv to scale from site to globe. Glob. Chang. Biol. 2019, 3731–3740. [Google Scholar] [CrossRef] [PubMed]
- Badgley, G.; Field, C.B.; Berry, J.A. Canopy near-infrared reflectance and terrestrial photosynthesis. Sci. Adv. 2017, 3, 1–5. [Google Scholar] [CrossRef] [PubMed] [Green Version]
- Sims, D.A.; Rahman, A.F.; Cordova, V.D.; El-Masri, B.Z.; Baldocchi, D.D.; Flanagan, L.B.; Goldstein, A.H.; Hollinger, D.Y.; Misson, L.; Monson, R.K.; et al. On the use of MODIS EVI to assess gross primary productivity of North American ecosystems. J. Geophys. Res. Biogeosciences 2006, 111, 1–16. [Google Scholar] [CrossRef] [Green Version]
- Shi, H.; Li, L.; Eamus, D.; Huete, A.; Cleverly, J.; Tian, X.; Yu, Q.; Wang, S.; Montagnani, L.; Magliulo, V.; et al. Assessing the ability of MODIS EVI to estimate terrestrial ecosystem gross primary production of multiple land cover types. Ecol. Indic. 2017, 72, 153–164. [Google Scholar] [CrossRef] [Green Version]
- Verma, M.; Friedl, M.A.; Richardson, A.D.; Kiely, G.; Cescatti, A.; Law, B.E.; Wohlfahrt, G.; Gielen, B.; Roupsard, O.; Moors, E.J.; et al. Remote sensing of annual terrestrial gross primary productivity from MODIS: An assessment using the FLUXNET la Thuile data set. Biogeosciences 2014, 11, 2185–2200. [Google Scholar] [CrossRef] [Green Version]
- Huang, X.; Xiao, J.; Ma, M. Evaluating the Performance of Satellite-Derived Vegetation Indices for Estimating Gross Primary Productivity Using FLUXNET Observations across the Globe. Remote Sens. 2019, 11, 1823. [Google Scholar] [CrossRef] [Green Version]
- Gamon, J.A.; Field, C.B.; Goulden, M.L. Relationships between NDVI, canopy structure, and photosynthesis in three Californian vegetation types. Ecol. Appl. 1995, 5, 28–41. [Google Scholar] [CrossRef] [Green Version]
- Glenn, E.; Huete, A.; Nagler, P.; Nelson, S. Relationship Between Remotely-sensed Vegetation Indices, Canopy Attributes and Plant Physiological Processes: What Vegetation Indices Can and Cannot Tell Us About the Landscape. Sensors 2008, 8, 2136–2160. [Google Scholar] [CrossRef] [PubMed] [Green Version]
- Sellers, P.J.; Berry, J.A.; Collatz, G.J.; Field, C.B.; Hall, F.G. Canopy reflectance, photosynthesis, and transpiration. III. A reanalysis using improved leaf models and a new canopy integration scheme. Remote Sens. Environ. 1992, 42, 187–216. [Google Scholar] [CrossRef]
- Croft, H.; Chen, J.M.; Froelich, N.J.; Chen, B.; Staebler, R.M. Seasonal controls of canopy chlorophyll content on forest carbon uptake: Implications for GPP modeling. J. Geophys. Res. Biogeosciences 2015, 120, 1576–1586. [Google Scholar] [CrossRef] [Green Version]
- Reich, P.B. Key canopy traits drive forest productivity. Proc. R. Soc. B Biol. Sci. 2012, 279, 2128–2134. [Google Scholar] [CrossRef] [Green Version]
- Morton, D.C.; Nagol, J.; Carabajal, C.C.; Rosette, J.; Palace, M.; Cook, B.D.; Vermote, E.F.; Harding, D.J.; North, P.R.J. Amazon forests maintain consistent canopy structure and greenness during the dry season. Nature 2014, 506, 221–224. [Google Scholar] [CrossRef]
- Saleska, S.R.; Wu, J.; Guan, K.; Araujo, A.C.; Huete, A.; Nobre, A.D.; Restrepo-Coupe, N. Dry-season greening of Amazon forests. Nature 2016, 531, E4–E5. [Google Scholar] [CrossRef]
- Hashimoto, H.; Wang, W.; Milesi, C.; White, M.A.; Ganguly, S.; Gamo, M.; Hirata, R.; Myneni, R.B.; Nemani, R.R. Exploring simple algorithms for estimating gross primary production in forested areas from satellite data. Remote Sens. 2012, 4, 303–326. [Google Scholar] [CrossRef] [Green Version]
- Huete, A.R.; Jackson, R.D.; Post, D.F. Spectral response of a plant canopy with different soil backgrounds. Remote Sens. Environ. 1985, 17, 37–53. [Google Scholar] [CrossRef]
- Morcillo-Pallarés, P.; Rivera-Caicedo, J.P.; Belda, S.; De Grave, C.; Burriel, H.; Moreno, J.; Verrelst, J. Quantifying the Robustness of Vegetation Indices through Global Sensitivity Analysis of Homogeneous and Forest Leaf-Canopy Radiative Transfer Models. Remote Sens. 2019, 11, 2418. [Google Scholar] [CrossRef] [Green Version]
- Croft, H.; Chen, J.M.; Luo, X.; Bartlett, P.; Chen, B.; Staebler, R.M. Leaf chlorophyll content as a proxy for leaf photosynthetic capacity. Glob. Chang. Biol. 2017, 23, 3513–3524. [Google Scholar] [CrossRef] [PubMed]
- Huete, A.; Didan, K.; Miura, T.; Rodriguez, E.P.; Gao, X.; Ferreira, L.G. Overview of the radiometric and biophysical performance of the MODIS vegetation indices. Remote Sens. Environ. 2002, 83, 195–213. [Google Scholar] [CrossRef]
- Huete, A.R.; Liu, H.Q.; Batchily, K.; van Leeuwen, W. A comparison of vegetation indices over a global set of TM images for EOS-MODIS. Remote Sens. Environ. 1997, 59, 440–451. [Google Scholar] [CrossRef]
- Wang, S.; Yang, D.; Li, Z.; Liu, L.; Huang, C.; Zhang, L. A Global Sensitivity Analysis of Commonly Used Satellite-Derived Vegetation Indices for Homogeneous Canopies Based on Model Simulation and Random Forest Learning. Remote Sens. 2019, 11, 2547. [Google Scholar] [CrossRef] [Green Version]
- Knipling, E.B. Physical and physiological basis for the reflectance of visible and near infrared radiation from vegetation. Remote Sens. Environ. 1970, 1, 155–159. [Google Scholar] [CrossRef]
- Asner, G.P. Biophysical and biochemical sources of variability in canopy reflectance. Remote Sens. Environ. 1998, 64, 234–253. [Google Scholar] [CrossRef]
- Ollinger, S.V. Sources of variability in canopy reflectance and the convergent properties of plants. New Phytol. 2011, 189, 375–394. [Google Scholar] [CrossRef]
- Ollinger, S.V.; Richardson, A.D.; Martin, M.E.; Hollinger, D.Y.; Frolking, S.E.; Reich, P.B.; Plourde, L.C.; Katul, G.G.; Munger, J.W.; Oren, R.; et al. Canopy nitrogen, carbon assimilation, and albedo in temperate and boreal forests: Functional relations and potential climate feedbacks. Proc. Natl. Acad. Sci. USA 2008, 105, 19336–19341. [Google Scholar] [CrossRef] [Green Version]
- Sullivan, F.B.; Ollinger, S.V.; Martin, M.E.; Ducey, M.J.; Lepine, L.C.; Wicklein, H.F. Foliar nitrogen in relation to plant traits and reflectance properties of New Hampshire forests. Can. J. For. Res. Can. Rech. For. 2013, 43, 18–27. [Google Scholar] [CrossRef]
- Yu, Q. Investigation into the role of canopy structure traits and plant functional types in modulating the correlation between canopy nitrogen and reflectance in a temperate forest in northeast China. J. Appl. Remote Sens. 2017, 11, 1. [Google Scholar] [CrossRef]
- Field, C.B.; Mooney, H.A. The photosynthesis-nitrogen relationships in wild plants. In On the Economy of Plant Form and Function; Givinish, T.J., Ed.; Cambridge University Press: Cambridge, UK, 1986; pp. 25–55. [Google Scholar]
- Wright, I.J.; Reich, P.B.; Westoby, M.; Ackerly, D.D.; Baruch, Z.; Bongers, F.; Cavender-Bares, J.; Chapin, T.; Cornelissen, J.H.C.; Diemer, M.; et al. The worldwide leaf economics spectrum. Nature 2004, 428, 821–827. [Google Scholar] [CrossRef] [PubMed]
- Goulden, M.L.; Anderson, R.G.; Bales, R.C.; Kelly, A.E.; Meadows, M.; Winston, G.C. Evapotranspiration along an elevation gradient in California’s Sierra Nevada. J. Geophys. Res. Biogeosciences 2012, 117, 1–13. [Google Scholar] [CrossRef] [Green Version]
- Whittaker, R.H. Communities and Ecosystems; Macmillan: New York, NY, USA, 1970; pp. 1465–1476. [Google Scholar]
- Biederman, J.A.; Scott, R.L.; Bell, T.W.; Bowling, D.R.; Dore, S.; Garatuza-Payán, J.; Kolb, T.E.; Krishnan, P.; Krofcheck, D.J.; Litvak, M.E.; et al. CO2 exchange and evapotranspiration across dryland ecosystems of southwestern North America. Glob. Chang. Biol. 2017, 23, 4204–4221. [Google Scholar] [CrossRef] [PubMed]
- Goulden, M.L.; Winston, G.C.; Mcmillan, A.M.S.; Litvak, M.E.; Read, E.L.; Rocha, A.V.; Rob Elliot, J. An eddy covariance mesonet to measure the effect of forest age on land-atmosphere exchange. Glob. Chang. Biol. 2006, 12, 2146–2162. [Google Scholar] [CrossRef] [Green Version]
- Pérez-Harguindeguy, N.; Díaz, S.; Lavorel, S.; Poorter, H.; Jaureguiberry, P.; Bret-Harte, M.S.; Cornwell, W.K.; Craine, J.M.; Gurvich, D.E.; Urcelay, C.; et al. New Handbook for standardised measurment of plant functional traits worldwide. Aust. J. Bot. 2013, 23, 167–234. [Google Scholar] [CrossRef]
- Lavorel, S.; Grigulis, K.; McIntyre, S.; Williams, N.S.G.; Garden, D.; Dorrough, J.; Berman, S.; Quetier, F.; Thebault, A.; Bonis, A. Assessing functional diversity in the field—Methodology matters! Funct. Ecol. 2008, 22, 134–147. [Google Scholar] [CrossRef]
- Kattge, J.; Díaz, S.; Lavorel, S.; Prentice, I.C.; Leadley, P.; Bönisch, G.; Garnier, E.; Westoby, M.; Reich, P.B.; Wright, I.J.; et al. TRY—A global database of plant traits. Glob. Chang. Biol. 2011, 17, 2905–2935. [Google Scholar] [CrossRef]
- Adler, P.B.; Salguero-Gómez, R.; Compagnoni, A.; Hsu, J.S.; Ray-Mukherjee, J.; Mbeau-Ache, C.; Franco, M. Functional traits explain variation in plant life history strategies. Proc. Natl. Acad. Sci. USA 2014, 111, 740–745. [Google Scholar] [CrossRef] [Green Version]
- Choat, B.; Jansen, S.; Brodribb, T.J.; Cochard, H.; Delzon, S.; Bhaskar, R.; Bucci, S.J.; Feild, T.S.; Gleason, S.M.; Hacke, U.G.; et al. Global convergence in the vulnerability of forests to drought. Nature 2012, 491, 752–755. [Google Scholar] [CrossRef] [Green Version]
- Kattge, J.; Knorr, W.; Raddatz, T.; Wirth, C. Quantifying photosynthetic capacity and its relationship to leaf nitrogen content for global-scale terrestrial biosphere models. Glob. Chang. Biol. 2009, 15, 976–991. [Google Scholar] [CrossRef]
- Kleyer, M.; Bekker, R.M.; Knevel, I.C.; Bakker, J.P.; Thompson, K.; Sonnenschein, M.; Poschlod, P.; Van Groenendael, J.M.; Klimeš, L.; Klimešová, J.; et al. The LEDA Traitbase: A database of life-history traits of the Northwest European flora. J. Ecol. 2008, 96, 1266–1274. [Google Scholar] [CrossRef]
- Laughlin, D.C.; Fulé, P.Z.; Huffman, D.W.; Crouse, J.; Laliberté, E. Climatic constraints on trait-based forest assembly. J. Ecol. 2011, 99, 1489–1499. [Google Scholar] [CrossRef]
- Laughlin, D.C.; Leppert, J.J.; Moore, M.M.; Sieg, C.H. A multi-trait test of the leaf-height-seed plant strategy scheme with 133 species from a pine forest flora. Funct. Ecol. 2010, 24, 493–501. [Google Scholar] [CrossRef]
- Maire, V.; Wright, I.J.; Prentice, I.C.; Batjes, N.H.; Bhaskar, R.; van Bodegom, P.M.; Cornwell, W.K.; Ellsworth, D.; Niinemets, Ü.; Ordonez, A.; et al. Global effects of soil and climate on leaf photosynthetic traits and rates. Glob. Ecol. Biogeogr. 2015, 24, 706–717. [Google Scholar] [CrossRef]
- Price, C.A.; Enquist, B.J. Scaling mass and morphology in leaves: An extension of the WBE model. Ecology 2007, 88, 1132–1141. [Google Scholar] [CrossRef]
- Shipley, B. Trade-offs between net assimilation rate and specific leaf area in determining relative growth rate: Relationship with daily irradiance. Funct. Ecol. 2002, 16, 682–689. [Google Scholar] [CrossRef]
- Wirth, C.; Lichstein, J.W. The imprint of species turnover on old-growth forest carbon balances—Insights from a trait-based model of forest dynamics. In Old-Growth Forests: Function, Fate and Value; Wirth, C., Gleixner, G., Heimann, M., Eds.; Springer Berlin Heidelberg: Berlin/Heidelberg, Germany, 2009; pp. 81–113. [Google Scholar]
- Thornley, J.H.M. Instantaneous canopy photosynthesis: Analytical expressions for sun and shade leaves based on exponential light decay down the canopy and an acclimated non-rectangular hyperbola for leaf photosynthesis. Ann. Bot. 2002, 89, 451–458. [Google Scholar] [CrossRef] [PubMed] [Green Version]
- Jacquemoud, S.; Verhoef, W.; Baret, F.; Bacour, C.; Zarco-Tejada, P.J.; Asner, G.P.; François, C.; Ustin, S.L. PROSPECT + SAIL models: A review of use for vegetation characterization. Remote Sens. Environ. 2009, 113, S56–S66. [Google Scholar] [CrossRef]
- Saltelli, A.; Annoni, P.; Azzini, I.; Campolongo, F.; Ratto, M.; Tarantola, S. Variance based sensitivity analysis of model output. Design and estimator for the total sensitivity index. Comput. Phys. Commun. 2010, 181, 259–270. [Google Scholar] [CrossRef]
- Saltelli, A.; Tarantola, S.; Chan, K.P.-S. A Quantitative Model-Independent Method for Global Sensitivity Analysis of Model Output. Technometrics 1999, 41, 39–56. [Google Scholar] [CrossRef]
- Verrelst, J.; Rivera, J.P.; van der Tol, C.; Magnani, F.; Mohammed, G.; Moreno, J. Global sensitivity analysis of the SCOPE model: What drives simulated canopy-leaving sun-induced fluorescence? Remote Sens. Environ. 2015, 166, 8–21. [Google Scholar] [CrossRef]
- Lehnert, L.W.; Meyer, H.; Obermeier, W.A.; Silva, B.; Regeling, B.; Bendix, J. Hyperspectral Data Analysis in R: The hsdar Package. J. Stat. Softw. 2019, 89, 1–23. [Google Scholar] [CrossRef] [Green Version]
- Niinemets, Ü. Components of leaf dry mass per area—Thickness and density—Alter leaf photosynthetic capacity in reverse directions in woody plants. New Phytol. 1999, 144, 35–47. [Google Scholar] [CrossRef]
- Reich, P.B.; Ellsworth, D.S.; Walters, M.B.; Vose, J.M.; Gresham, C.; Volin, J.C.; Bowman, W.D. Generality of leaf trait relationships: A test across six biomes. Ecology 1999, 80, 1955–1969. [Google Scholar] [CrossRef]
- Zeng, Y.; Badgley, G.; Dechant, B.; Ryu, Y.; Chen, M.; Berry, J.A. A practical approach for estimating the escape ratio of near-infrared solar-induced chlorophyll fluorescence. Remote Sens. Environ. 2019, 232, 111209. [Google Scholar] [CrossRef] [Green Version]
- Luo, Y.; El-Madany, T.S.; Filippa, G.; Ma, X.; Ahrens, B.; Carrara, A.; Gonzalez-Cascon, R.; Cremonese, E.; Galvagno, M.; Hammer, T.W.; et al. Using near-infrared-enabled digital repeat photography to track structural and physiological phenology in Mediterranean tree-grass ecosystems. Remote Sens. 2018, 10, 1293. [Google Scholar] [CrossRef] [Green Version]
- Slaton, M.R.; Hunt, E.R.; Smith, W.K. Estimating near-infrared leaf reflectance from leaf structural characteristics. Am. J. Bot. 2001, 88, 278–284. [Google Scholar] [CrossRef]
- Fourty, T.; Baret, F.; Jacquemoud, S.; Schmuck, G.; Verdebout, J. Leaf optical properties with explicit description of its biochemical composition: Direct and inverse problems. Remote Sens. Environ. 1996, 56, 104–117. [Google Scholar] [CrossRef]
- Musavi, T.; Migliavacca, M.; van de Weg, M.J.; Kattge, J.; Wohlfahrt, G.; van Bodegom, P.M.; Reichstein, M.; Bahn, M.; Carrara, A.; Domingues, T.F.; et al. Potential and limitations of inferring ecosystem photosynthetic capacity from leaf functional traits. Ecol. Evol. 2016, 6, 7352–7366. [Google Scholar] [CrossRef]
- Ethier, G.J.; Livingston, N.J.; Harrison, D.L.; Black, T.A.; Moran, J.A. Low stomatal and internal conductance to CO2 versus Rubisco deactivation as determinants of the photosynthetic decline of ageing evergreen leaves. Plant. Cell Environ. 2006, 29, 2168–2184. [Google Scholar] [CrossRef]
- Hinojo-Hinojo, C.; Castellanos, A.E.; Llano-Sotelo, J.M. Wide ranges of functional traits in the flora from the central region of Sonora: A diversity to be explored. In Proceedings of the Proceedings RMRS-P-67. Merging science and management in a rapidly changing world: Biodiversity and management of the Madrean Archipielago III and 7th Conference on Research and Resource Management in the Southwestern Deserts, Tucson, AZ, USA, 1–5 May 2012; Gottfried, G.J., Ffolliott, P.F., Gebow, B.S., Eskew, L.G., Collins, L.C., Eds.; United States Department of Agriculture, Forest Service, Rocky Mountain Research Station: Forth Collins, CO, USA, 2013; pp. 212–217. [Google Scholar]
- Misson, L.; Baldocchi, D.D.; Black, T.A.; Blanken, P.D.; Brunet, Y.; Curiel Yuste, J.; Dorsey, J.R.; Falk, M.; Granier, A.; Irvine, M.R.; et al. Partitioning forest carbon fluxes with overstory and understory eddy-covariance measurements: A synthesis based on FLUXNET data. Agric. For. Meteorol. 2007, 144, 14–31. [Google Scholar] [CrossRef] [Green Version]
- Wu, J.; Albert, L.P.; Lopes, A.P.; Restrepo-Coupe, N.; Hayek, M.; Wiedemann, K.T.; Guan, K.; Stark, S.C.; Christoffersen, B.; Prohaska, N.; et al. Leaf development and demography explain photosynthetic seasonality in Amazon evergreen forests. Science 2016, 351, 972–977. [Google Scholar] [CrossRef] [PubMed] [Green Version]
- Kattenborn, T.; Schmidtlein, S. Radiative transfer modelling reveals why canopy reflectance follows function. Sci. Rep. 2019, 9, 1–10. [Google Scholar]
- Wang, Z.; Skidmore, A.K.; Darvishzadeh, R.; Wang, T. Mapping forest canopy nitrogen content by inversion of coupled leaf-canopy radiative transfer models from airborne hyperspectral imagery. Agric. For. Meteorol. 2018, 253, 247–260. [Google Scholar] [CrossRef]
- Singsaas, E.L.; Ort, D.R.; DeLucia, E.H. Variation in measured values of photosynthetic quantum yield in ecophysiological studies. Oecologia 2001, 128, 15–23. [Google Scholar] [CrossRef]
- Ross, J. The Radiation Regime and Architecture of Plant Stands; Springer Netherlands: Dordrecht, The Netherlands, 1981; ISBN 978-94-009-8649-7. [Google Scholar]
- Fuchs, M.; Asrar, G.; Kanemasu, E.T.; Hipps, L.E. Leaf area estimates from measurements of photosynthetically active radiation in wheat canopies. Agric. For. Meteorol. 1984, 32, 13–22. [Google Scholar] [CrossRef]
- Gitelson, A.; Solovchenko, A. Generic Algorithms for Estimating Foliar Pigment Content. Geophys. Res. Lett. 2017, 44, 9293–9298. [Google Scholar] [CrossRef]
- Jacquemoud, S.; Baret, F. PROSPECT: A model of leaf optical properties spectra. Remote Sens. Environ. 1990, 34, 75–91. [Google Scholar] [CrossRef]
- Hinojo-Hinojo, C.; Goulden, M.L. A dataset of published measurements of canopy leaf inclination angles, UC Irvine, Dataset. 2020. Available online: https://doi.org/10.7280/D1T97H (accessed on 24 April 2020).
- Féret, J.B.; Gitelson, A.A.; Noble, S.D.; Jacquemoud, S. PROSPECT-D: Towards modeling leaf optical properties through a complete lifecycle. Remote Sens. Environ. 2017, 193, 204–215. [Google Scholar] [CrossRef] [Green Version]
- Jones, H.G. Plants and Microclimate: A Quantitative Aproach to Environmental Plant Physiology, 3rd ed.; Cambridge University Press: Cambridge, UK, 2014; ISBN 9780521279598. [Google Scholar]
- Farquhar, G.D.; Caemmerer, S.; Berry, J.A. A biochemical model of photosynthetic CO2 assimilation in leaves of C3 species. Planta 1980, 149, 78–90. [Google Scholar] [CrossRef] [Green Version]
- Duursma, R.A. Plantecophys—An R package for analysing and modelling leaf gas exchange data. PLoS ONE 2015, 10, e0143346. [Google Scholar]
Figure 1.
(a) Location of the study regions within California. (b) Location of Sierra Nevada and (c) Southern California sites. The color gradient in each region indicates the mean Normalized Difference Vegetation Index (NDVI) during 2018. Asterisks indicate the sites where we conducted field sampling for leaf traits, photosynthesis, and soil reflectance. The numbers in parenthesis indicate the time span of eddy covariance and satellite observations. California is highlighted in gray in (a), and water bodies are indicated by light blue in (b) and (c).

Figure 2.
Relationship between vegetation indices and gross primary production (GPP) across the 10 study sites based on eddy covariance and Moderate resolution Imaging Spectrometer (MODIS) MCD43A4.006 observations. Subplots show the relationship of GPP with (a) NDVI, (b) EVI and (c) NIRv. Colored lines indicate linear regressions for each site (temporal or within-site relationships), the dashed line represents the linear regression across all sites. The dots are a representative sample of individual observations at the coastal sage shrubland site.

Figure 3.
(a) Global sensitivity analyses of Thornley’s model for Gross Primary Production (GPP) and (b) modeling analysis of the effect of Leaf Area Index (LAI) and light-saturated leaf photosynthesis rate (Aleaf) on GPP. We ran the Thornley GPP model varying LAI from 0–5 m2 m−2 and Aleaf across the range found at the field sites (see Figure 4) at an irradiance of 2000 µmol m−2 s−1 of photosynthetically active radiation (a typical midday illumination).
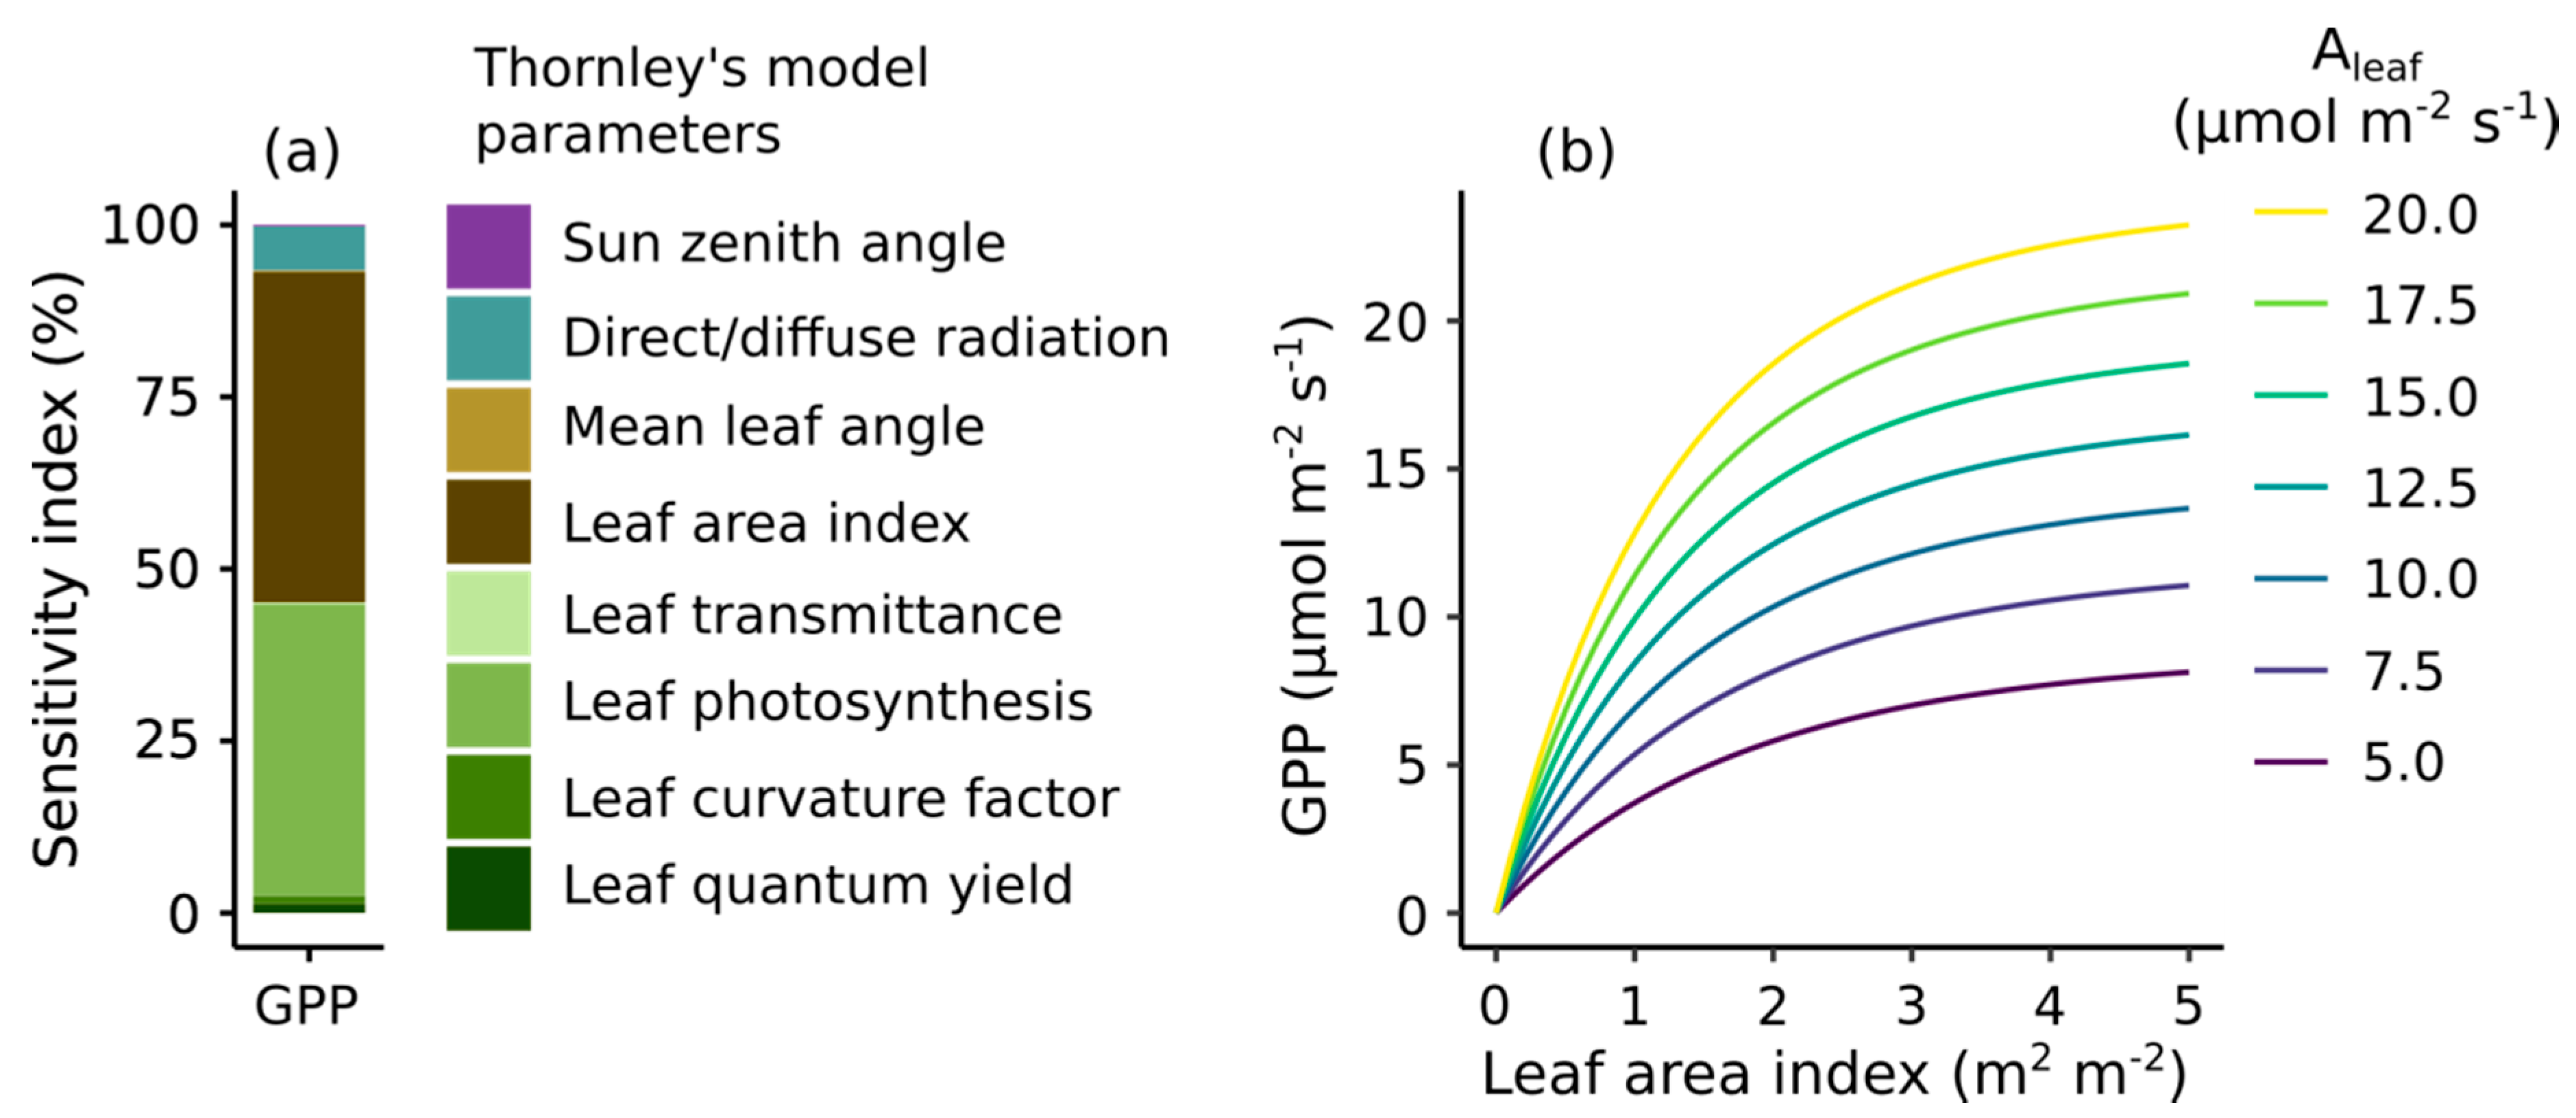
Figure 4.
Relationship between leaf mass per area and light-saturated leaf photosynthesis observed at the field sites, and also obtained from the TRY database for species that are found at the Sierra Nevada sites. Crosses indicate the mean values for each of the 4–7 most dominant species at each site. The solid line is the linear regression across all species values. Filled circles indicate the community-weighted mean for each site, estimated by weighting mean species values by species abundance. See Supplementary Material 2 for more details about species and site data.
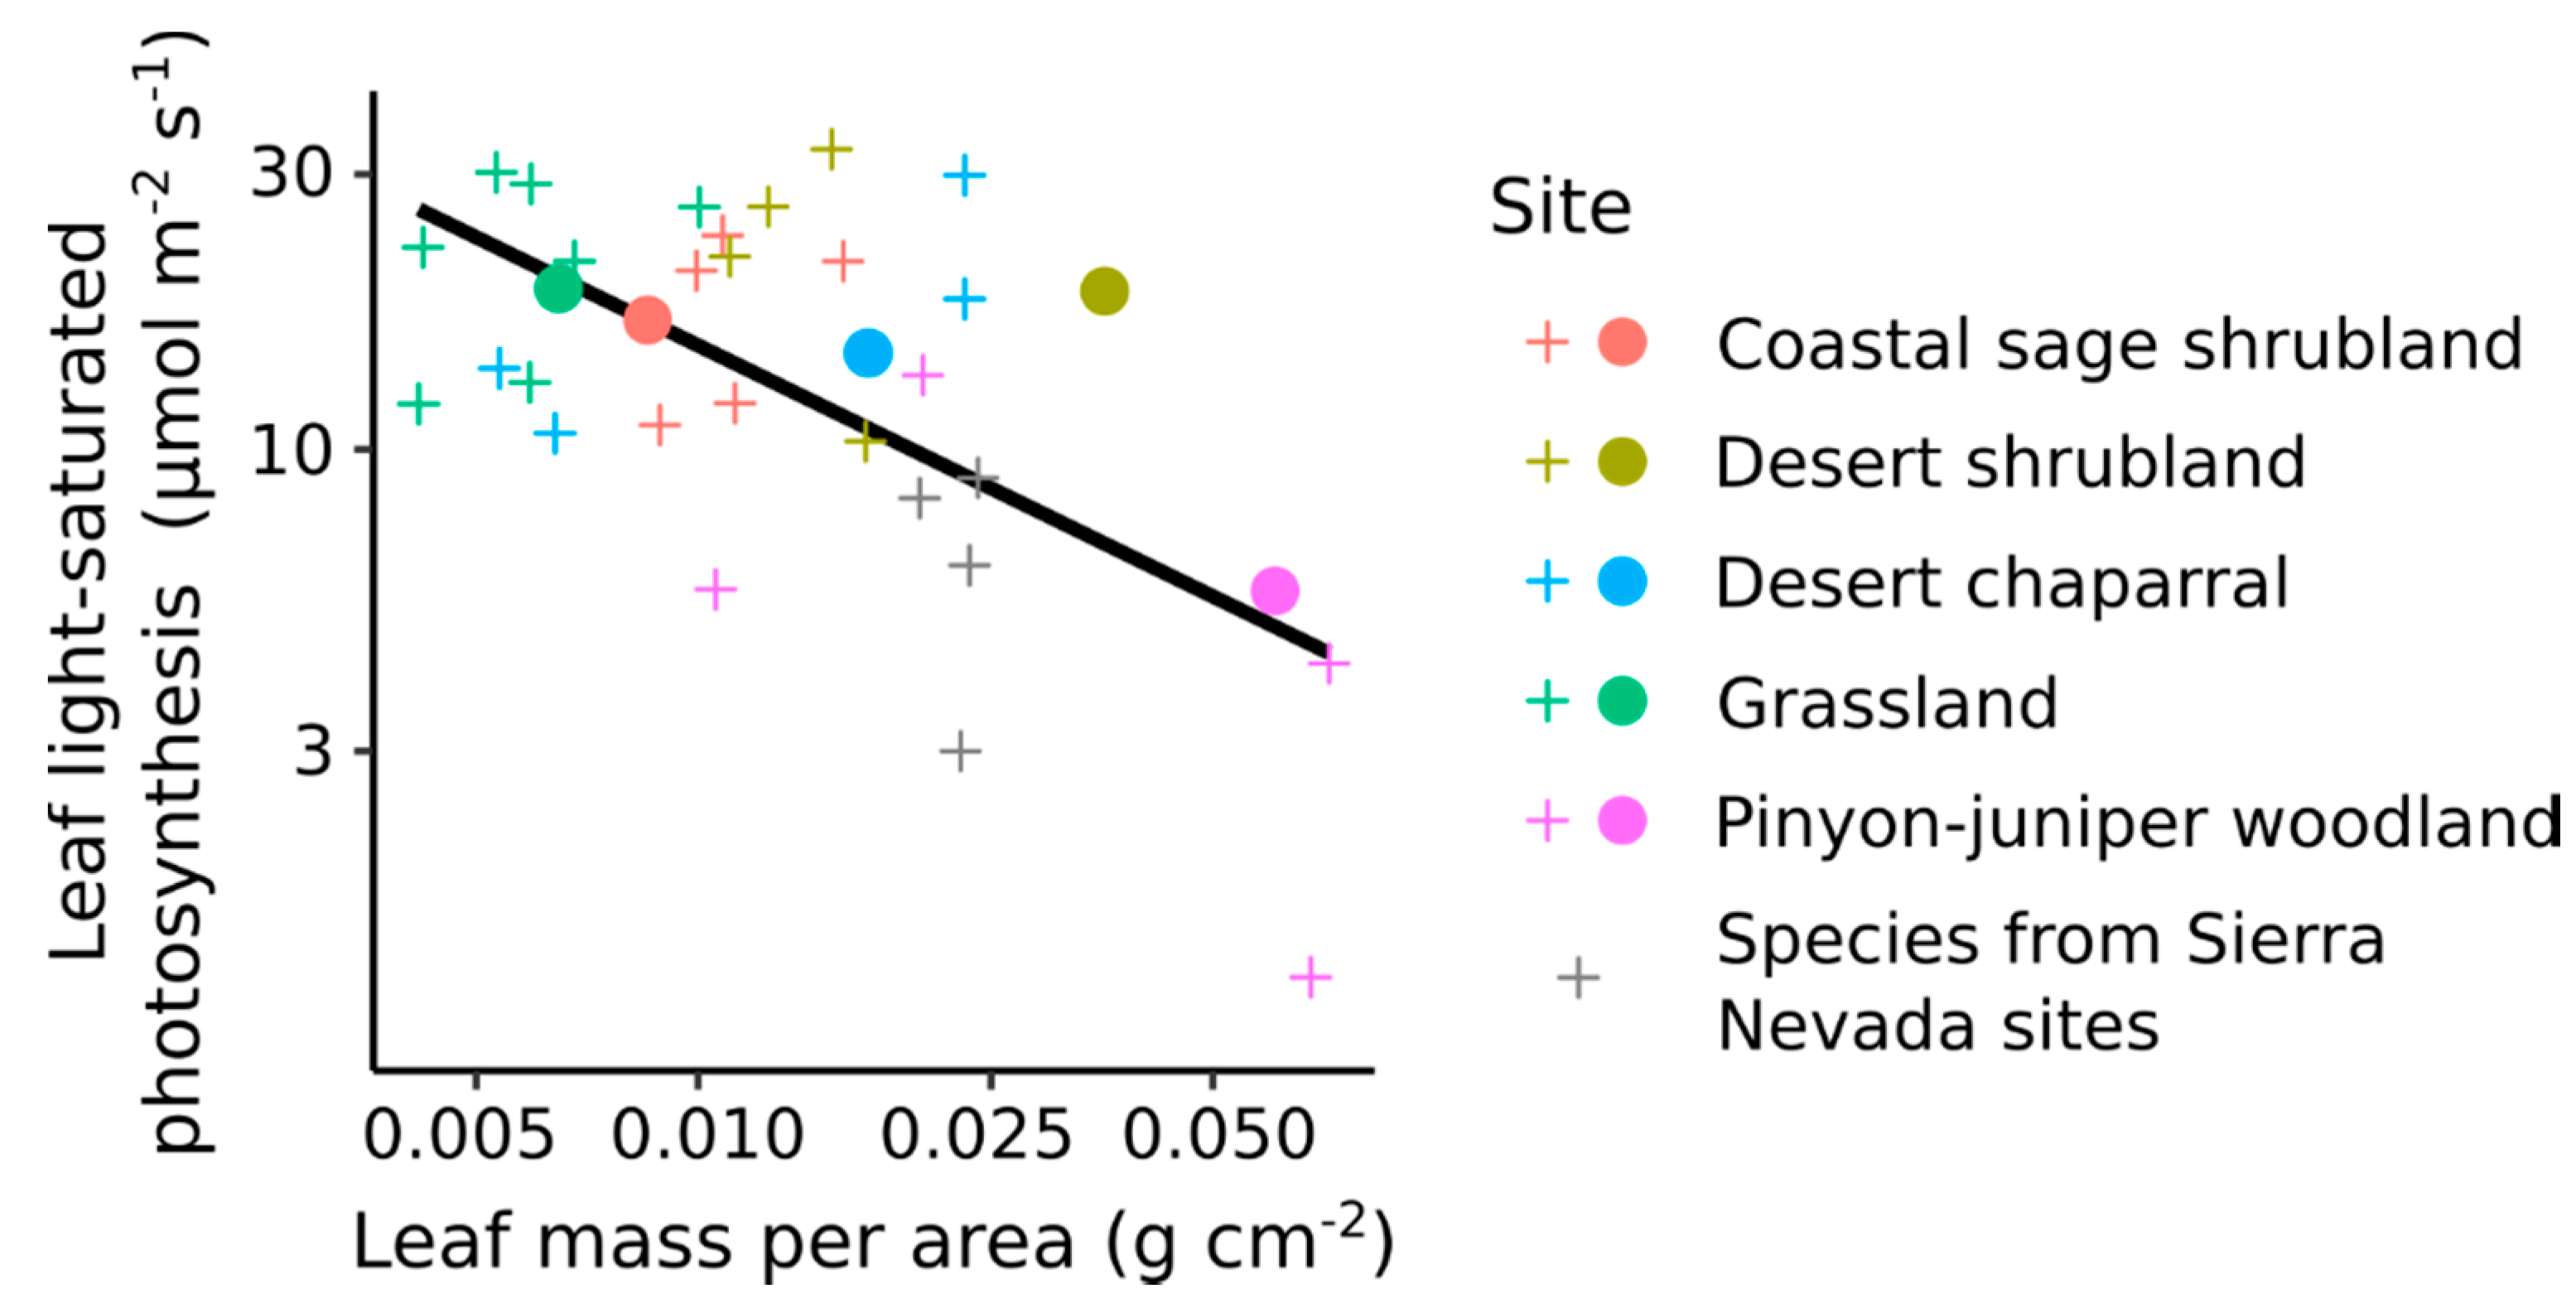
Figure 5.
Global sensitivity analysis of PROSAIL radiative transfer model for top-of canopy reflectance (a) from 400–1000 nm and (b) for red and Near InfraRed Vegetation (NIR) bands and vegetation indices. The spectral ranges used for the broad band reflectance and vegetation indices is shown on (a) for reference, and match those used by MODIS sensors.
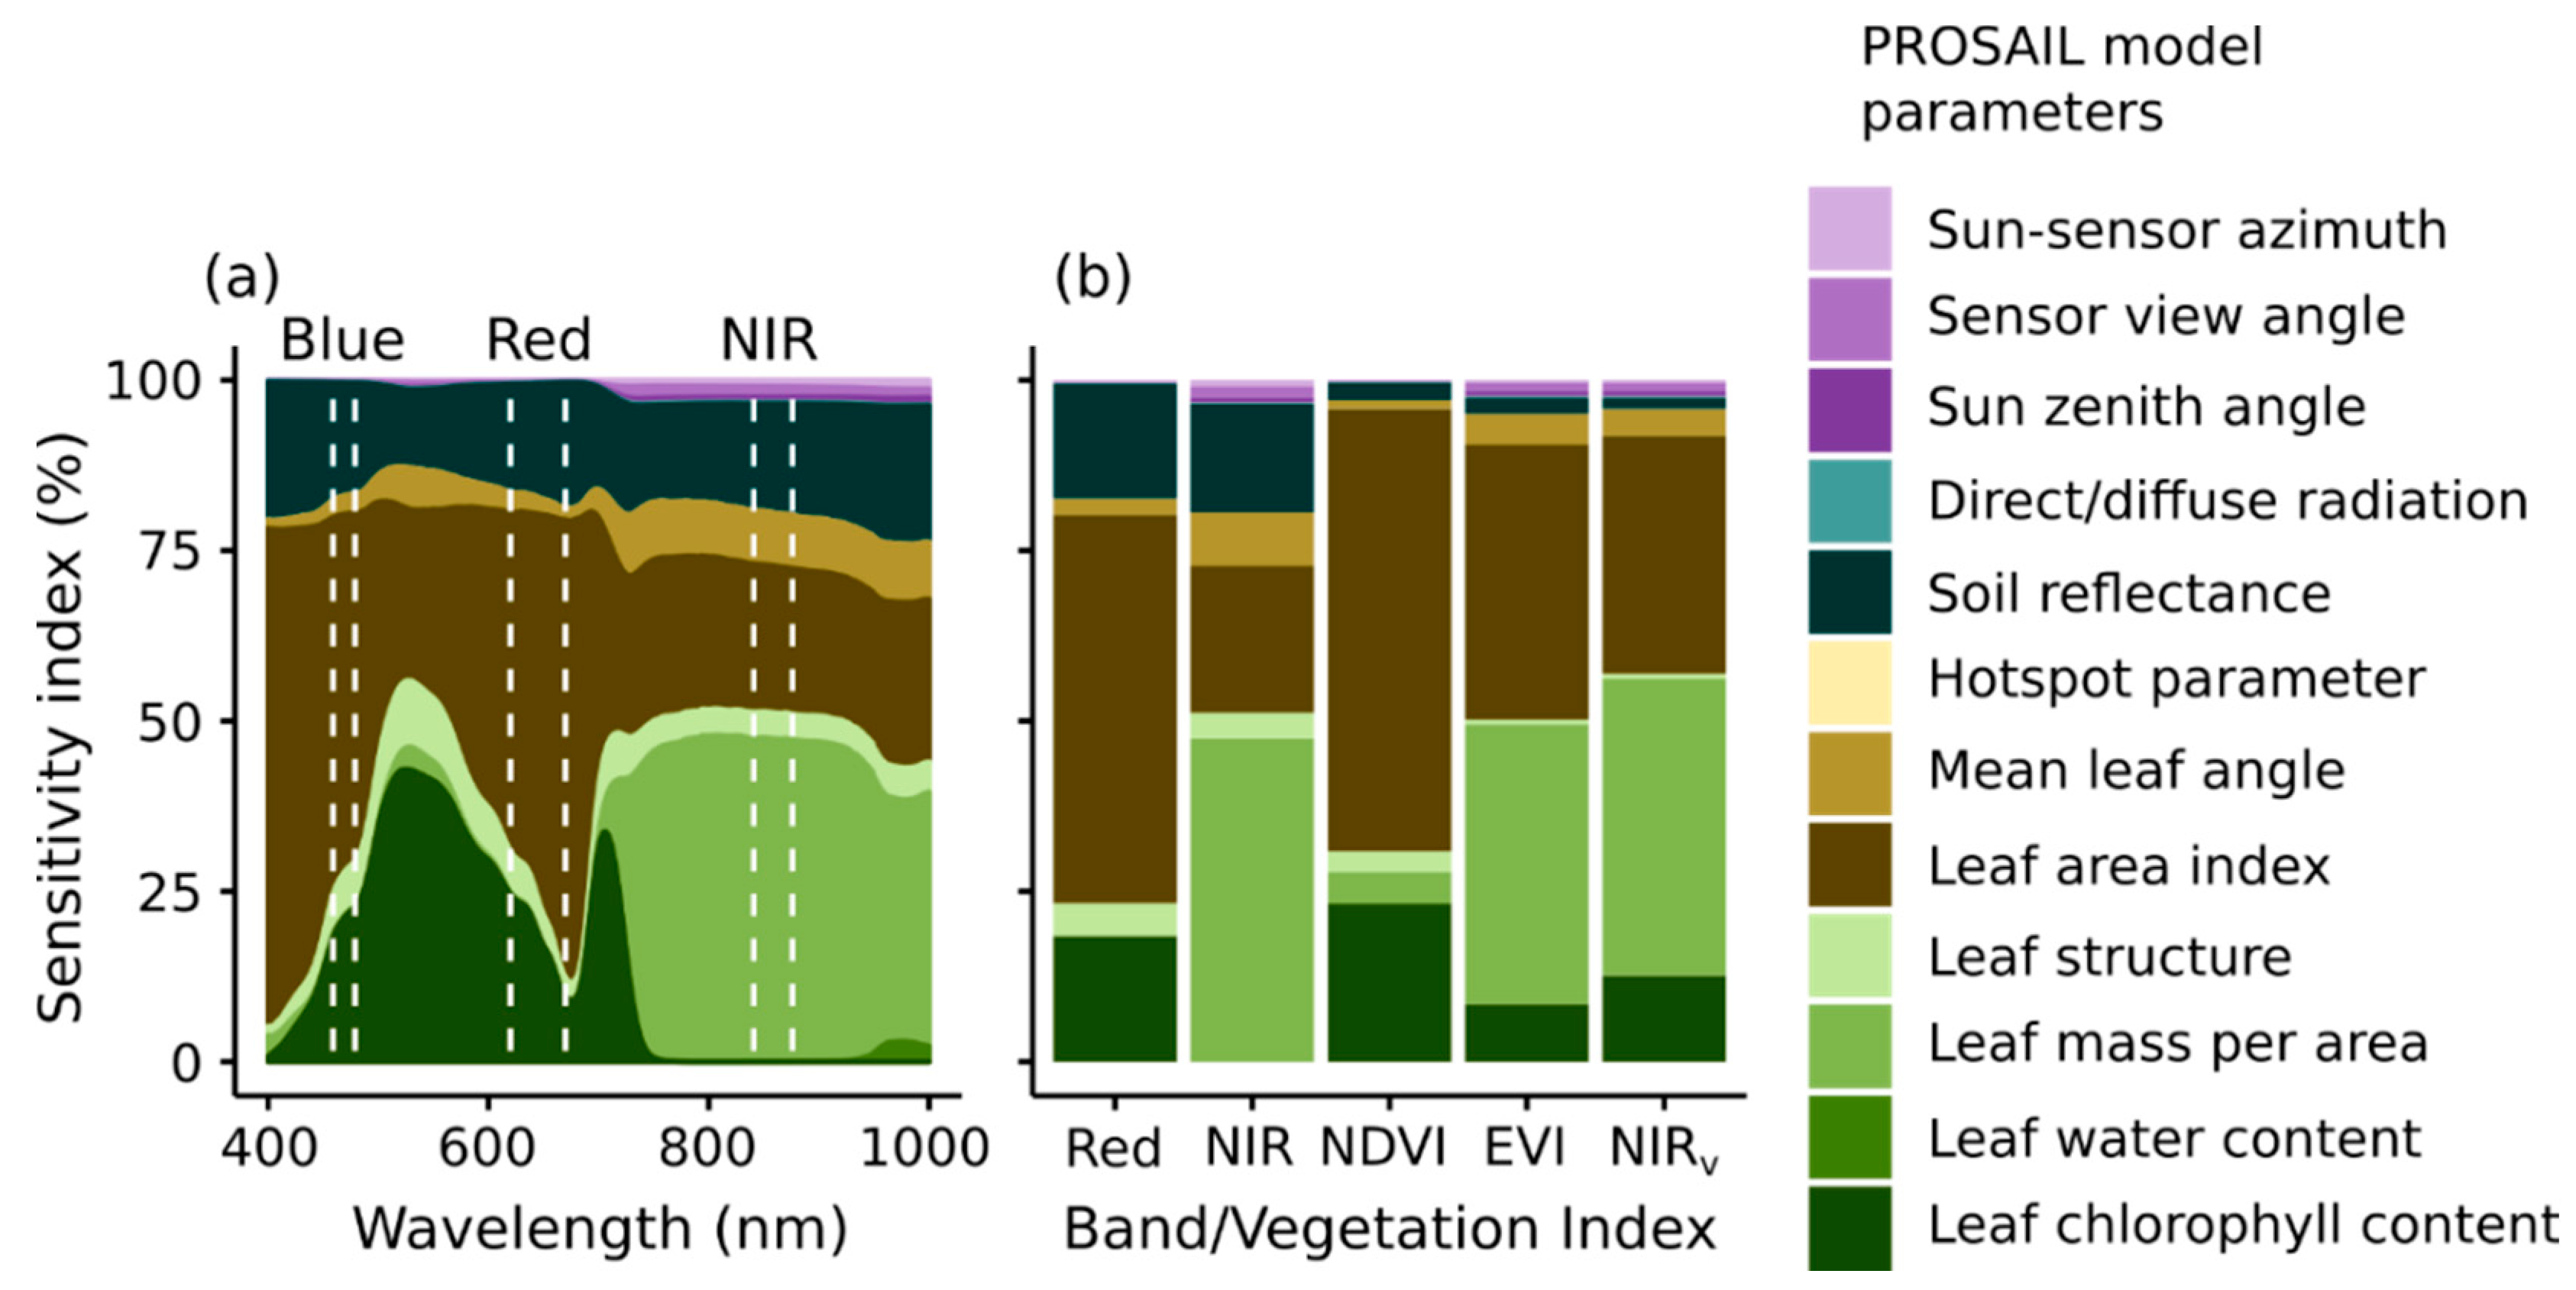
Figure 6.
Response of Vegetation Indices to Leaf Area Index (LAI), leaf chlorophyll content (Cab) and leaf mass per area (LMA) based on the PROSAIL model. Panel (a) shows the modeled response of NDVI to variation in LAI and Cab and (b) the response of NDVI to LAI and LMA. Panel (c) shows the modeled response of EVI to variation in LAI and LMA and (d) the response of NIRv to LAI and LMA. The ranges of Cab and LMA span the ranges found at the field sites (Figure 4, Supplementary Material 5). The seven selected Cab and LMA values correspond to the seven selected rates of leaf photosynthesis shown in Figure 3b, following the relationships in Figure 4 and [14].

Figure 7.
Relationships at all ten study sites between (a) MODIS Enhanced Vegetation Index (EVI) and NIRv and between (b) MODIS NDVI and EVI.
Figure 7.
Relationships at all ten study sites between (a) MODIS Enhanced Vegetation Index (EVI) and NIRv and between (b) MODIS NDVI and EVI.
© 2020 by the authors. Licensee MDPI, Basel, Switzerland. This article is an open access article distributed under the terms and conditions of the Creative Commons Attribution (CC BY) license (http://creativecommons.org/licenses/by/4.0/).
Share and Cite
MDPI and ACS Style
Hinojo-Hinojo, C.; Goulden, M.L. Plant Traits Help Explain the Tight Relationship between Vegetation Indices and Gross Primary Production. Remote Sens. 2020, 12, 1405. https://doi.org/10.3390/rs12091405
AMA Style
Hinojo-Hinojo C, Goulden ML. Plant Traits Help Explain the Tight Relationship between Vegetation Indices and Gross Primary Production. Remote Sensing. 2020; 12(9):1405. https://doi.org/10.3390/rs12091405
Chicago/Turabian StyleHinojo-Hinojo, César, and Michael L. Goulden. 2020. "Plant Traits Help Explain the Tight Relationship between Vegetation Indices and Gross Primary Production" Remote Sensing 12, no. 9: 1405. https://doi.org/10.3390/rs12091405
Note that from the first issue of 2016, this journal uses article numbers instead of page numbers. See further details here.