
Automatic Reconstruction of Building Façade Model from Photogrammetric Mesh Model


1
Key Laboratory of Urban Land Resources Monitoring and Simulation, Ministry of Land and Resources, Shenzhen 518034, China
2
School of Geoscience and Info-Physics, Central South University, Changsha 410083, China
3
Department of Earth Observation Science, Faculty of Geo-Information and Earth Observation (ITC), University of Twente, 7514 AE Enschede, The Netherlands
*
Author to whom correspondence should be addressed.
Remote Sens. 2021, 13(19), 3801; https://doi.org/10.3390/rs13193801
Submission received: 17 June 2021
/
Revised: 8 September 2021
/
Accepted: 18 September 2021
/
Published: 22 September 2021
(This article belongs to the Special Issue Techniques and Applications of UAV-Based Photogrammetric 3D Mapping)
Abstract
:Three-dimensional (3D) building façade model reconstruction is of great significance in urban applications and real-world visualization. This paper presents a newly developed method for automatically generating a 3D regular building façade model from the photogrammetric mesh model. To this end, the contour is tracked on irregular triangulation, and then the local contour tree method based on the topological relationship is employed to represent the topological structure of the photogrammetric mesh model. Subsequently, the segmented contour groups are found by analyzing the topological relationship of the contours, and the original mesh model is divided into various components from bottom to top through the iteration process. After that, each component is iteratively and robustly abstracted into cuboids. Finally, the parameters of each cuboid are adjusted to be close to the original mesh model, and a lightweight polygonal mesh model is taken from the adjusted cuboid. Typical buildings and a whole scene of photogrammetric mesh models are exploited to assess the proposed method quantitatively and qualitatively. The obtained results reveal that the proposed method can derive a regular façade model from a photogrammetric mesh model with a certain accuracy.
1. Introduction
The three-dimensional (3D) façade model of urban buildings plays a crucial role in many fields, including urban planning, solar radiation calculations, noise emission simulations, virtual reality, sustainable development research, and disaster simulation [1,2,3]. The automatic reconstruction of building façades has always been a significant research topic in the fields of photogrammetry and remote sensing, as well as computer vision and computer graphics; nevertheless, due to the intricacy of urban scenes, the automatic reconstruction of urban building façades is still a challenging task.
In past decades, a number of researchers have tried on the (semi-)automatic reconstruction of façade models for generating LoD3 building models [4]. Images and LiDAR (Light Detection and Ranging) point clouds are two common data used for façade model reconstruction. Several methodologies aiming at the automatic reconstruction of 3D façade models have been established in the past years. Xiao et al. [5] proposed a semi-automatic method to generate façade models along a street from multi-view street images. For this purpose, an ortho-rectified image was initially decomposed and structured into a directed acyclic graph of rectilinear elementary patches by considering architectural bilateral symmetry and repetitive patterns. Then each patch was enhanced by the depth from point clouds, which was derived from the results of structure-from-motion. Müller et al. [6] suggested an image-based façade reconstruction approach method by utilizing an image analysis algorithm to divide the façade into meaningful segments and combine the procedural modeling pipeline of shape grammars to ensure the regularity of the final reconstructed model. Sadeghi et al. [7] presented an approach for façade reconstruction from hand-held laser scanner data based on grammar. The method starts from using RANSAC method to extract façade points, and then protrusion, indentation, and wall points are detected by utilizing a density histogram. After that, façade elements are modeled by employing some rules. Edum-Fotwe et al. [8] proposed a façade reconstruction method from LiDAR data; the algorithm employed a top-down strategy to split the point cloud into surface-element rails in signed-distance-field, then completed the façade model reconstruction. Pu and Vosselman [9] contributed to an approach on integrating terrestrial laser points and images for façade reconstruction. The building façade’s general structure from the plane in LiDAR point cloud data was discovered and established, and then the line feature in the images was employed to refine the model and to generate texture. These methods obtained promising results, but they have to utilize the images or point clouds from the terrestrial ground. However, the lower part of the façade is commonly enclosed by various types of vegetation, street signs, cars, and pedestrians, and the obtained point clouds usually suffer from a large number of missing data [10]. This issue may hinder the reconstruction of building façades. It is worth mentioning that TLS often acquires data only on the side of urban streets. The other façade data cannot be readily achieved, making hard to establish a comprehensive building façade model.
Along with the development of Unmanned Aerial Vehicle (UAV) and aerial oblique photogrammetry, it is possible to obtain a high-resolution façade image from UAV by an aerial oblique camera system, and then, a multi-view dense matching methodology is implemented to reconstruct and update the 3D model of urban buildings expressed by the photogrammetric mesh model. The automatic reconstructed model often contains millions of triangles, which brings an onerous burden for storage, web transferring, and visualization. Moreover, due to the problem of occlusion, repetitive texture, and transparent object, there are also some defects in the automatically generated mesh model, which could reduce the visual effects. Hence, some mesh editors such as DP-Modeler and OSketch [11,12] are developed to improve the mesh model by manual work. By this view, the main objective of this research work is to develop a method to reconstruct the regular façade model from the photogrammetry mesh model such that the structure of a single building is preserved. The reconstructed model is potentially employed for visual navigation, online visualization, solar energy estimation, etc.
The current façade modeling methods can be generally categorized into two major types. One is a data-driven method [13,14,15,16], while another is a model-driven method [17,18,19]. There are several data-driven approaches proposed to reconstruct façades model from Airborne-Laser Scanning (ALS) data [20]. The reconstruction is completed by vertically extruding the roof outline to the ground. Thereby, the key problem is the roof outline generating, which can be realized by edge-based methods [21], data clustering [22], region growing [23], model fitting [24], etc. Edge-based methodologies are susceptible to outliers and incomplete edges. The method of data clustering relies on the number of classes defined and the clustering center. The approach based on the region growing is usually influenced by the seed point selection. The RANSAC method is implemented in model fitting, which often results in unwanted false planes. Additionally, the accuracy of the reconstructed façade model based on the roof model boundary is susceptible to eaves. Wu et al. [25] proposed a graph-based method to reconstruct urban building models from ALS data. This method was basically constructed on the hierarchical analysis of the contours to gain the structure of the building, then a bipartite graph matching method was employed to obtain the correspondence between consecutive contours for subsequent surface modeling. The final model heavily relies on the contour’s quality. If there exist some noise or artifacts in the point cloud as in the photogrammetric mesh model, the matching and surface modeling process in Ref. [25] would drop the quality of the final model. Thus, it cannot adapt to the under-study photogrammetric mesh model. For data-driven methods based on the ground data, regularity of symmetry is often detected in the source data, and then exploited to regularize the final model.
Façades usually exhibit strong structural regularities, such as piecewise planar segments, parallelism, and orthogonality lines. Generally, model-driven methods employ this prior information about the face structure to constrain the façade modeling. Nan et al. [26,27,28,29] generated building details by automatically fitting 3D templates on coarse building models with texture. To this end, the 3D templates were produced by employing a semi-automatic procedure, emerging a template construction tool. The boxes were directly fitted to the imperfect point cloud based on the Manhattan-World hypothesis, and then the best subset is selected to achieve reconstruction. Larfage et al. [17] proposed urban buildings reconstruction method by detecting and optimizing 3D blocks on a Digital Surface Model (DSM).
Since the mesh models based on the aerial oblique images often contain noise, herein, a model-driven approach is proposed. The façade of the under-study building is assumed to be composed of several cuboids. The photogrammetric mesh models are iteratively divided into various components from bottom to top by the segmented contour group. Subsequently, each component is fitted by a set level of cuboids, and then we will arrive at the final façade model.
The organization of the paper is as follows: In Section 2, the proposed method for façade modeling is explained described in some detail. In Section 3, the performance of our proposed method is evaluated through a scene of photogrammetric mesh model. In Section 4, some discussions are provided. Finally, the main conclusions are given (i.e., Section 5).
2. Methods
2.1. Overview of the Approach
Generally, a given scene of the photogrammetric mesh model can be classified into façade mesh models of individually single buildings and others. The main goal of the proposed method in the present study is to automatically produce a 3D regular building façade from the photogrammetric façade mesh model (hereafter noted as photogrammetric façade mesh). The workflow of the proposed approach is displayed in Figure 1. It mainly includes three parts in the following:
(1) Firstly, the photogrammetric mesh model is decomposed into components based on the contour line. The closed contours on irregular triangular networks are tracked, and local contour trees are exploited to find the segmented contour groups by analyzing the topological relationship between the contours of the photogrammetric mesh model. Subsequently, such a model is segmented from bottom to top into diverse components through an iterative process.
(2) The photogrammetric mesh model components are approximated by minimum circumscribed cuboids iteratively.
(3) The parameters of the cuboid model are adjusted by means of a least square algorithm to ensure the accuracy of the façade model.
2.2. Component Decomposition Based on Contours Analysis
Assume that the building façade is composed of several cuboids; hence, the first step is to recognize the façade component abstracted by a cuboid. To this end, the photogrammetric mesh model is divided into various parts by analyzing the topological relationship of contours, and then each component is distinctly reconstructed. Generally, the photogrammetric mesh model is segmented from bottom to top by a segmented contour pair.
2.2.1. Contour Segment Pair Generation
If point clouds are used, as in Ref. [25], a linear Triangulated Irregular Network (TIN) interpolation method has to be performed firstly to obtain TIN. In contrast, the photogrammetric mesh model in the presented study is represented by a continuous TIN, the contour line tracking is directly performed on the TIN exploitation of the original data to avoid the loss of accuracy of data interpolation [30]. For the contour lines tracking, the initial elevation Z is set as the lowest elevation of the photogrammetric mesh model for each building, while the contour interval D is set according to the vertical accuracy of the photogrammetric mesh model. Subsequently, each contour line is carefully tracked. In general, there would be two types of contours: open and closed contours. Only closed ones are retained for subsequent processing.
After producing the contour lines, a building can be represented by contour clusters abstracted by cuboids. To split the contour lines into separate parts, the contours are transferred to a graph-based localized contour tree [25,31]. The tree consists of a root node, several internal nodes (branches), and several terminal nodes (leaf). The closed contour is represented as a node in the structure, while the relationship between contours is denoted by an edge between the nodes in the tree-based structure.
The local contour trees are constructed from bottom to top based on the contour elevations. For instance, let us take into account a complex building as demonstrated in Figure 2a. The local contour tree (Figure 2b) is initialized by contour A1 with the lowest elevation as the root node. Then, the adjacent contour A2 is identified and added as the child node of contour A1. These steps are iterated until the highest contour B6 is included. During the adding process, when meeting n (n > 1) contours for a given height value, n branches will be constructed. Figure 2a shows that there are two contours (contour B1 and C1) for the fourth height value. Thus, two subtrees are generated from A3. In these trees, only the contours whose topological relations have not changed exist in the same structure. These contours are represented by a subtree in the contour tree. Finally, the contour tree illustrated in Figure 2b is obtained, where the same color part indicates the same structure of the photogrammetric mesh model. Node A3 has two sub-nodes B1 and C1, and node C3 has a sub-node D1, indicating a separation relationship in the sense of topological representation. After producing the contour tree, the segmented contour pair is attained between subtrees. Therefore, the segmented contour pairs of the photogrammetric mesh model in Figure 2a are A3–B1, A3–C1, and C3–D1.
2.2.2. Decomposition of Components
After generating the contours trees, the photogrammetric mesh model is subdivided to mesh clusters based on the obtained segmented contour pair. For the local contour tree as shown in Figure 2b, firstly, the lowest elevation contour pair A3–B1 (Figure 3a) is exploited to remove the triangles placed between the contours A3 and B1. Then, the remaining triangles are clustered into three components of the photogrammetric mesh model. As demonstrated in Figure 3a, the gray part of the model, which is lower than the A3–B1 elevation of the segmented contour pair, is successfully segmented. Thereafter, the components of the photogrammetric mesh model are subdivided, which are higher than the elevation of the segmented contour pair A3–B1. Due to the lower elevation contour of the next group of the segmented contour pair with the lowest elevation A3–C1 is the same as those of A3, this segmented contour pair (A3–C1) is then skipped. Subsequently, the remaining cluster by the next segmented contour pair C3–D1 is subdivided, then the yellow component of the photogrammetric mesh model (see Figure 3a) is successfully segmented. This process is repeatedly carried out until there is no segmented contour group, and then, the original photogrammetric mesh model is subdivided into basic components. The final obtained results are illustrated in Figure 3a.
During the component decomposing, the triangles between different trees are removed, resulting in a gap between the subsequent generating models (i.e., the gap between A3 and C1 in Figure 3a). To resolve the aforementioned issue, the elevation of the closest point to the segmented contour pair in the photogrammetric mesh model component should be appropriately reformed to the average elevation of the segmented contour pair. The photogrammetric mesh model components after the points’ modification are presented in Figure 3b.
2.3. Cuboid Abstraction
After decomposing the photogrammetric mesh model into separated components, a set of cuboids is exploited to fit each component. At first, a region growing method is applied to the current component mesh model to produce super-facets. Then the least square algorithm is utilized to fit the normal vector of the largest super-facet. After that, the coordinate axis is transformed to the calculated normal vector, and the coordinates of mesh vertexes are centralized to lessen the subsequent iteratively minimum circumscribed cuboid fitting process.
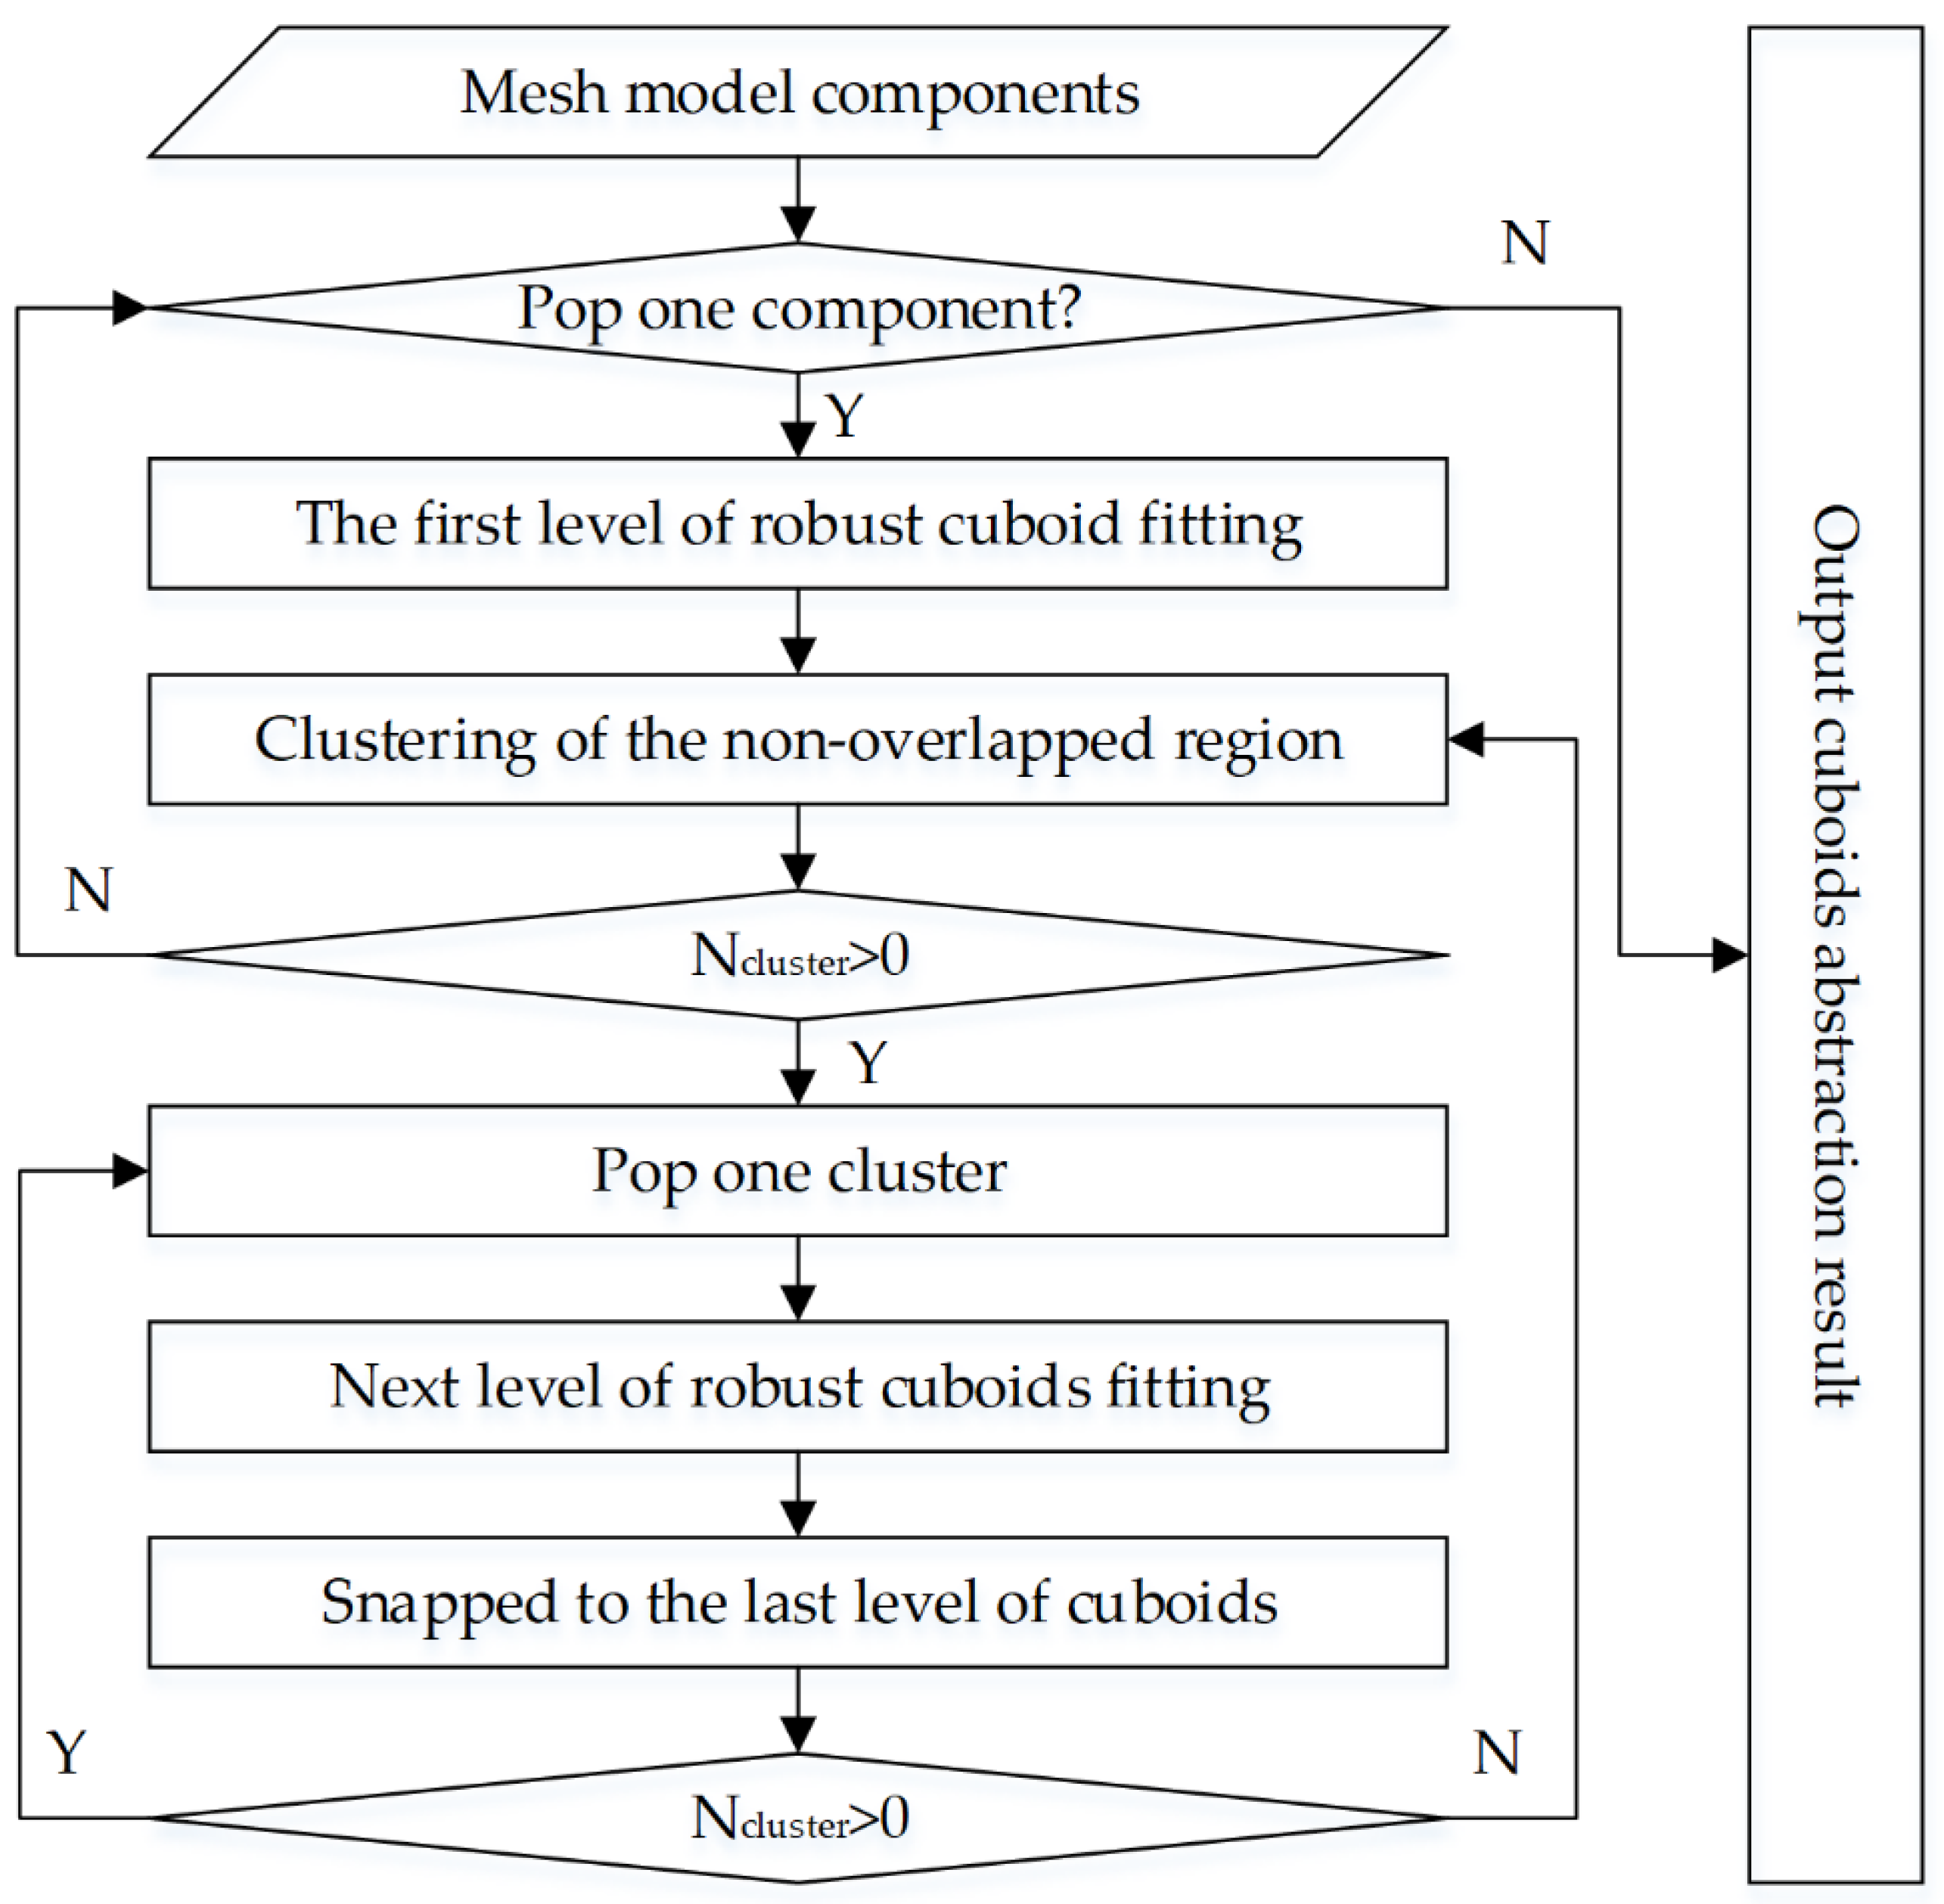
To reconstruct the complex building model, the mesh model components are abstracted to several levels of minimum circumscribed cuboids. The cuboid abstraction performs iteratively, as the corresponding workflow is shown as Figure 4.
The abstraction starts from popping one component from the separated components. If no components are left, the abstraction result is exported to the following processing; otherwise, an iteratively robust cuboid fitting process is performed. For the current component, the first level circumscribed cuboid is fitted to most outside of the component. There could be some noise in the original photogrammetric mesh model. For instance, if all points are exploited to fit the façade model, bias may exist in the façade parameters. A robust fitting strategy is proposed to eliminate possible noise points. Firstly, the distance between each point to the closest plane of the fitted cuboid is calculated. When the distance is larger than a given threshold value of Td (Td is experimentally set equal to 0.2 m in the present study), the points are removed, and the remaining ones are utilized to fit a new plane again for the corresponding side of the cuboid. By taking Figure 5 as an example, it can be seen in Figure 5a (the top view of model component) that there is one protuberance on the north side. The original cuboid is a rectangle with green color, which does not well fit to the point cloud. After removing the possible noise part, a new cuboid is fitted and marked as yellow color in Figure 5b, and the fitted model snapped the point cloud well.
After generating the first level of cuboid, the average distance between the vertexes of a triangle to the nearest plane of the circumscribed cuboid is evaluated. The points whose distances are larger than a given threshold value T2 (T2 is experimentally set equal to 0.2 m) are grown to gather the non-overlapping regions to region groups. The regions with values less than a predefined value on the vertex number and areas are overlooked, and the predefined value of the vertex number and areas are determined according to the target detail of the model. For the remaining groups, robust cuboid fitting processing is performed to derive the next level of cuboids. After generating the next level of cuboid using the remained non-overlapping region, there will be a slight bias from the previous level of the cuboid. In Figure 6a, the top view illustrates the whole process since the façade is vertical to the ground. As observed, the corner of the current cuboid is not on the first level of the cuboid. To avoid this problem, as shown in Figure 6b, the coordinates of the current level of the cuboid are extended to intersect with the nearby cuboid sides, and the new intersect point will be used to replace the original cuboid corner to guarantee the close of the model.
The same procedure is repeated until there would be no non-overlapping region in the current component. Further, the component fitting process is repeatedly carried out until no component is left.
By taking into account Figure 7a as the input component, Figure 7a–e illustrates the process of the iteratively cuboid fitting process step-by-step. If a minimum circumscribed cuboid is directly fitted to the original model component, the first level of the circumscribed cuboid is produced (i.e., the green cuboid in Figure 7b). The cuboid does not sit adjacent to the original mesh very well. By removing possible noise points or small objects on the façades, the remaining points would fit the model as displayed in Figure 7c. It appears that the cuboid is closer to the original model after these modifications. For the non-overlapping from Figure 7c, two second levels of circumscribed cuboids are derived, as demonstrated in Figure 7d. All the cuboids are joined together when there are no overlapping areas, as presented in Figure 7e.
2.4. Parameter Adjustment of Cuboid Model Based on the Least Square Method
As the initial cuboid is attained by a range of transformed coordinates, the resulted cuboid may not fit the initial photogrammetric mesh model very well because of existing noise and noise in the coordinate transform parameters. Thus, the least square method is employed to adjust the cuboid fitting the model to the initial photogrammetric mesh model. Each cuboid can be specified by six parameters (), as the façade only considers the plane coordinates, and H are kept fixed throughout the adjustment process. The adjustment of the model parameters is commonly accomplished by minimizing the distance between the initial model (i.e., the results of the cuboid abstraction process) and the photogrammetric mesh model by a least square algorithm. The adjust mode is defined as Equation (1).
where denote the adjusted cuboid parameters, represent the initial cuboid parameters, (,) are the coordinates of the vertexes of the involved triangles.
After obtaining the error equations, it can be solved by implementing the traditional least square approach. The error equations associated with Equation (1) is formatted in the matrix form as follows:
in which:
V = Ax − L
After obtaining the error equations displayed in Equation (2), the solution for the unknowns is completed in the following form:
For the first level of the cuboid, four model parameters () are adjusted. For other levels of cuboids, only the error equations pertinent to sides over-lapped with the initial photometric mesh model are adjusted, while other parameters are kept fixed. After adjusting the cuboid parameters, there would be some gaps between the subsequent level of the cuboid and its former level, the low level of the cuboid is shifted to the nearest high level of the cuboid.
After performing the adjustment process, the existing planes are chosen from the cuboid and employed to producing the final façade mode.
3. Experiment Results and Analysis
To validate the performance of the proposed method, a set of photogrammetric mesh models is employed to perform the experiments. The mesh model is generated from oblique aerial images taken by SWDC-5 by using ContextCapture [31]. The ground sample distance of the original image is around 0.1 m. The used photogrammetric mesh model is cut from a large part of the scene. Initially, four complex buildings are selected to evaluate the method quantitatively and qualitatively. To further evaluate the actual performance of the proposed method, the whole scene is then reconstructed by the proposed approach.
3.1. Date Description
3.2. Resontruction Results and Analysis
The reconstructed results are presented in the subfigures of the fourth column of Figure 8. The depicted results reveal that the proposed method can generate a faithful polygon model. Compared with the original data, the various profile and details of the building are well preserved in the corresponding reconstruction model.
Figure 8 illustrates the detailed reconstruction processes of four complex buildings. To clarify the reconstruction process better, we present the cuboids before the global fitting of model parameters at each level. In the subfigures of second column of Figure 8, the initial cuboid abstraction results are given. The subfigures in the third column of Figure 8 present the final façade model overlaid on the original date. While those of the fourth column of Figure 8 show the final 3D façade model. Concerning building A, it is divided into five components. The first component generates one first-level and two second-level cuboids (presented by green color in the subfigures of the second column of Figure 8a). The second component produces a first-level and a second-level cuboid (highlighted by yellow color in the subfigures of the second column of Figure 8a). Components 3, 4, and 5 produce a cuboid (displayed by blue, red, and pink colors in the subfigures of the second column of Figure 8a). Then, the final 3D building façade model is generated via plane selection and global fitting of the model parameters. Building B is divided into five components, each one generates a first-level cuboid. Similar to building A, building B is successfully reconstructed. As shown by blue and pink cuboids in building A and yellow and red cuboids in building B, this method can successfully reconstruct buildings with minor structural. Building C is divided into three components. The first component provides a first-level and a second-level cuboid. The second component generates a first-, a second-, and a third-level cuboid, while component three produces one cuboid. The model is established by the global fitting of the model parameters and the plane selection. The first-level yellow cuboid of the second component has a small part that does not fit the original data. It is because of this fact that the distance of the unfitted piece from the model is smaller than the set threshold, so the whole model fits the original data very well. Building D is divided into three components. The first component generates first-level and two second-level cuboids, while components three and four produce a cuboid. The model generated by the global fitting of model parameters and plane selection is also realistically reconstructed.
The reconstruction results show the lower part of the original data has a large number of missing parts. Further, there are many abnormal data phenomena, but the method can still generate fairly accurate reconstruction results.
To further assess the proposed method, the experimentally obtained results are quantitatively evaluated. The quality of the reconstructed model is evaluated by checking the average distance between the original data and the nearest surface of the reconstructed model. Figure 9 displays the reconstruction error diagrams for the under-study buildings. After removing the apparent outliers of the original data, the diagrams of the average distance from the original data for four buildings under consideration are presented in Figure 10. The minimum, maximum, and average errors of the four reconstructed 3D façade models in order are 0.066, 0.154, and 0.09 m.
3.3. Reconstruc Result on a Whole Scene
To assess the practicability and robustness of the proposed method more systematically, we apply the proposed method to the whole scene of the photogrammetric mesh model as shown in Figure 11. The scene is composed of 13 buildings. Figure 12 presents the reconstructed 3D façade model. The obtained results further indicate that the proposed method can generate trustable polygon models from the photogrammetric mesh model in the complex scene, and the reconstructed results are in reasonably agreement with the original data. The final 3D façade model is compared to the original photogrammetric mesh model to assess the reconstruction result; Figure 13 illustrates the average distance from the original data to the derived façade model. The minimum, maximum, and average errors of the thirteen reconstructed 3D façade models, respectively, are 0.066, 0.2, and 0.124 m. The accuracy of the whole scene is somehow lower than that of the test data. This issue is mainly because some buildings in the experimental scene have balconies, resulting in more deformation in the scene.
4. Discussion
4.1. Comparison
The main objective of the present paper is to construct a regular façade model from a photogrammetric mesh model derived from oblique aerial images by Structure from Motion (SfM) and a Multi-View Stereo (MVS) pipeline. Since the relevant methods in the literature often generate models from LiDAR data, having different sources from the proposed method, a direct and thorough comparison to these methods would be difficult. By this view, some presented mean reconstructed errors in typical methods are provided in Table 2 for the sake of comparison. For the selected typical four buildings, the average distance between the reconstructed 3D façade models and the vertex of the input photogrammetric mesh model is 0.09 m, while for the whole scene, the mean distance is 0.124 m. The presented results reveal that the proposed method can successfully reconstruct the building façade model from the photogrammetric mesh model compared to the previously obtained results from the LiDAR data.
Contours extracted from the photogrammetric mesh model are used to segment the different part of a building. However, the surface link between the correspondence contour points between consecutive contours, as used in Ref. [25], cannot adapt to the photogrammetric mesh model well. This is due to fact that there may be some noise in the contours derived from the under-study photogrammetric mesh model. The proposed method in this paper exploited cuboids to fit the mesh model and the least square adjustment to ensure the quality; as a result, the effect of noise in the source mesh model is reduced.
4.2. Limitation of the Proposed Method
The proposed method assumes that the building façades are composed of several cuboids, which cannot adapt to some complex buildings. For future works, some other elements to fit the model can be considered.
Although the proposed method takes into account outliers in the mesh model, when facing a facade model with large defects caused by trees, etc., in front of the façade, the proposed method cannot obtain proper results in such a situation. The future work will focus on considering some clues from ground view data sources to ensure the completeness of the derived façade models.
Currently, the proposed method only considers the geometrics of the model; future work would consider the texture.
5. Conclusions
This paper presents a method for automatically generating a 3D regular building façade model from a photogrammetric mesh model. The proposed method mined the advantage of using a TIN structure for expressing the photogrammetric mesh model. Each component is abstracted by a cuboid, which can reduce the effects of small errors in the contours; in addition, a robust cuboid fitting method is proposed to alleviate the noise problem or small parts possible existing in the source photogrammetric mesh model. A least square method is used to adjust the parameters to finally ensure the quality of the reconstructed model. The average error of the reconstructed 3D building façade models is obtained as 0.124 m. The experimental results reveal that the newly developed method can effectively reconstruct the building façade model from the photogrammetric mesh model. Additionally, the proposed method is not affected by numerous data missing from the lower parts of the original data, outliers, and other issues.
The proposed process starts from the final mesh model, which is derived from software consuming more processing power than the dense point cloud from multiple-view images. For future work, the interested scholars can apply the proposed method to a dense point cloud by incorporating a proper contour-tracking algorithm into the current workflow.
Author Contributions
Conceptualization, Y.Z. and X.C.; methodology, Y.Z. and C.Z.; software, C.Z.; validation, C.Z. and S.C.; resources, X.C.; writing—original draft preparation, Y.Z. and C.Z.; writing—review and editing, Y.Z., C.Z. and X.C. All authors have read and agreed to the published version of the manuscript.
Funding
This research was funded by Open Fund of Key Laboratory of Urban Land Resource Monitoring and Simulation, Ministry of Land and Resource (No. KF-2018-03-047), the University Innovative Platform Open Fund of Hunan (No. 19K099).
Acknowledgments
The authors are grateful to the editors for their helpful comments and Lelin Li for his helpful discussion.
Conflicts of Interest
The authors declare no conflict of interest.
References
- Catita, C.; Redweik, P.; Pereira, J.; Brito, M.C. Extending solar potential analysis in buildings to vertical facades. Comput. Geosci. 2014, 66, 1–12. [Google Scholar] [CrossRef]
- Bagheri, H.; Schmitt, M.; Zhu, X. Fusion of multi-sensor-derived heights and OSM-derived building footprints for urban 3D reconstruction. ISPRS Int. J. Geo-Inf. 2019, 8, 193. [Google Scholar] [CrossRef] [Green Version]
- Zheng, Y.; Weng, Q. Model-driven reconstruction of 3-D buildings using LiDAR data. IEEE Geosci. Remote Sens. Lett. 2015, 12, 1541–1545. [Google Scholar] [CrossRef]
- Xie, L.; Hu, H.; Zhu, Q.; Li, X.; Tang, S.; Li, Y.; Wang, W. Combined rule-based and hypothesis-based method for building model reconstruction from photogrammetric point clouds. Remote Sens. 2021, 13, 1107. [Google Scholar] [CrossRef]
- Xiao, J.; Fang, T.; Tan, P.; Zhao, P.; Ofek, E.; Quan, L. Image-based façade modeling. ACM Trans. Graph. 2008, 27, 1–10. [Google Scholar] [CrossRef]
- Müller, P.; Zeng, G.; Wonka, P.; Van Gool, L. Image-based procedural modeling of façades. ACM Trans. Graph. 2007, 26, 85. [Google Scholar] [CrossRef]
- Sadeghi, F.; Arefi, H.; Fallah, A.; Hahn, M. 3D building Façade reconstruction using handheld laser scanning data. Int. Arch. Photogramm. Remote Sens. Spat. Inf. Sci. 2015, XL-1/W5, 625–630. [Google Scholar] [CrossRef] [Green Version]
- Edum-Fotwe, K.; Shepherd, P.; Brown, M.; Harper, D.; Dinnis, R. Fast, accurate and sparse, automatic façade reconstruction from unstructured ground laser-scans. In Proceedings of the ACM SIGGRAPH 2016, Anaheim, CA, USA, 24–28 July 2016; Association for Computing Machinery: New York, NY, USA, 2016; pp. 45:1–45:2. [Google Scholar] [CrossRef] [Green Version]
- Pu, S.; Vosselman, G. Building façade reconstruction by fusing terrestrial laser points and images. Sensors 2009, 9, 4525–4542. [Google Scholar] [CrossRef] [PubMed] [Green Version]
- Riemenschneider, H.; Krispel, U.; Thaller, W.; Donoser, M.; Havemann, S.; Fellner, D.; Bischof, H. Irregular lattices for complex shape grammar façade parsing. In Proceedings of the IEEE Computer Society Conference on Computer Vision and Pattern Recognition, Providence, RI, USA, 16–21 June 2012; IEEE Computer Society: Washington, DC, USA; pp. 1640–1647. [Google Scholar]
- OSketch. Available online: https://www.zhdgps.com/ (accessed on 4 April 2021).
- DP-Modeler. Available online: http://www.whulabs.com/ (accessed on 4 April 2021).
- Zhang, H.; Xu, K.; Jiang, W.; Lin, J.; Cohen-Or, D.; Chen, B. Layered analysis of irregular façades via symmetry maximization. ACM Trans. Graph. 2013, 32, 1–13. [Google Scholar] [CrossRef] [Green Version]
- Li, Z.; Zhang, L.; Mathiopoulos, P.T.; Liu, F.; Zhang, L.; Li, S.; Liu, H. A hierarchical methodology for urban façade parsing from TLS point clouds. ISPRS J. Photogramm. Remote Sens. 2017, 123, 75–93. [Google Scholar] [CrossRef]
- Yang, B.; Dong, Z.; Wei, Z.; Fang, L. Extracting complex building façades from mobile laser scanning data. Acta Geod. Cartogr. Sin. 2013, 42, 411–417. [Google Scholar]
- Yan, L.; Hu, Q.W.; Wu, M.; Liu, J.M.; Wu, X. Extraction and simplification of building façade pieces from mobile laser scanner point clouds for 3D street view services. ISPRS Int. J. Geo-Inf. 2016, 5, 231. [Google Scholar] [CrossRef] [Green Version]
- Lafarge, F.; Descombes, X.; Zerubia, J.; Pierrot-Deseilligny, M. Structural approach for building reconstruction from a single DSM. IEEE Trans. Pattern Anal. Mach. Intell. 2010, 32, 135–147. [Google Scholar] [CrossRef] [Green Version]
- Kwak, E.; Habib, A. Automatic representation and reconstruction of DBM from LiDAR data using recursive minimum bounding rectangle. ISPRS J. Photogramm. Remote Sens. 2014, 93, 171–191. [Google Scholar] [CrossRef]
- Henn, A.; Gröger, G.; Stroh, V.; Plümer, L. Model driven reconstruction of roofs from sparse LIDAR point clouds. ISPRS J. Photogramm. Remote Sens. 2013, 76, 17–29. [Google Scholar] [CrossRef]
- Cheng, L.; Gong, J. Building boundary extraction using very high resolution images and LiDAR. Acta Geod. Cartogr. Sin. 2008, 37, 391–393. [Google Scholar]
- Jiang, X.; Bunke, H. Fast segmentation of range images into planar regions by scan line grouping. Mach. Vis. Appl. 1994, 7, 115–122. [Google Scholar] [CrossRef]
- Sampath, A.; Shan, J. Segmentation and reconstruction of polyhedral building roofs from aerial LiDAR point clouds. IEEE Trans. Geosci. Remote Sens. 2010, 48, 1554–1567. [Google Scholar] [CrossRef]
- Chen, D.; Zhang, L.; Li, J.; Liu, R. Urban building roof segmentation from airborne LiDAR point clouds. Int. J. Remote Sens. 2012, 33, 6497–6515. [Google Scholar] [CrossRef]
- Chen, D.; Zhang, L.; Mathiopoulos, P.; Huang, X. A methodology for automated segmentation and reconstruction of urban 3-D buildings from ALS point clouds. IEEE J. Sel. Top. Appl. Earth Obs. Remote Sens. 2014, 7, 4199–4217. [Google Scholar] [CrossRef]
- Wu, B.; Yu, B.; Wu, Q.; Yao, S. A Graph-based approach for 3D building model reconstruction from airborne LiDAR point clouds. Remote Sens. 2017, 9, 92. [Google Scholar] [CrossRef] [Green Version]
- Nan, L.; Jiang, C.; Ghanem, B.; Wonka, P. Template assembly for detailed urban reconstruction. Comput. Graph. Forum. 2015, 34, 217–228. [Google Scholar] [CrossRef] [Green Version]
- Li, M.; Nan, L.; Smith, N.; Wonka, P. Reconstructing building mass models from UAV images. Comput. Graph. 2016, 54, 84–93. [Google Scholar] [CrossRef] [Green Version]
- Li, M.; Nan, L.; Liu, S. Fitting boxes to Manhattan scenes using linear integer programming. Int. J. Digit. Earth 2016, 9, 806–817. [Google Scholar] [CrossRef] [Green Version]
- Li, M.; Wonka, P.; Nan, L. Manhattan-World Urban Reconstruction from Point Clouds. In Proceedings of the 14th European Conference on Computer Vision, Amsterdam, The Netherlands, 11–14 October 2016; Springer: Cham, Switzerland, 2016; pp. 54–69. [Google Scholar]
- Zhang, Z.; Zhang, J. Digital Photogrammetry, 1st ed.; Wuhan University Press: Wuhan, China, 1997; pp. 83–84. [Google Scholar]
- ContextCapture. Available online: https://www.bentley.com/en/products/brands/contextcapture (accessed on 4 April 2021).
- Song, J.; Wu, J.; Jiang, Y. Extraction and reconstruction of curved surface buildings by contour clustering using airborne LiDAR data. Optik 2015, 126, 513–521. [Google Scholar] [CrossRef]
- Wu, Q.; Liu, H.; Wang, S.; Yu, B.; Beck, R.; Hinkel, K. A localized contour tree method for deriving geometric and topological properties of complex surface depressions based on high-resolution topographical data. Int. J. Geogr. Inf. Sci. 2015, 29, 2041–2060. [Google Scholar] [CrossRef]
- Lafarge, F.; Mallet, C. Creating large-scale city models from 3d-point clouds: A robust approach with hybrid representation. Int. J. Comput. Vis. 2012, 99, 69–85. [Google Scholar] [CrossRef]
Figure 1.
The workflow of the proposed approach: (a) input of the photogrammetric mesh model; (b,c) segmented components; (d,e) minimum circumscribed cuboids; (f) adjusting model; (g) final 3D building façade model.
Figure 1.
The workflow of the proposed approach: (a) input of the photogrammetric mesh model; (b,c) segmented components; (d,e) minimum circumscribed cuboids; (f) adjusting model; (g) final 3D building façade model.

Figure 2.
An illustration of the local contour tree of the photogrammetric mesh model: (a) contours tracking results; (b) local contour tree generation result.
Figure 2.
An illustration of the local contour tree of the photogrammetric mesh model: (a) contours tracking results; (b) local contour tree generation result.

Figure 3.
Illustration of decomposition of the photogrammetric mesh model: (a) decomposed photogrammetric mesh model components; (b) photogrammetric mesh model components after modification.
Figure 3.
Illustration of decomposition of the photogrammetric mesh model: (a) decomposed photogrammetric mesh model components; (b) photogrammetric mesh model components after modification.

Figure 4.
The workflow of the cuboid abstraction processing.

Figure 5.
Illustration of the robust cuboid fitting segmentation: (a) top view of the model component; (b) fitting result.
Figure 5.
Illustration of the robust cuboid fitting segmentation: (a) top view of the model component; (b) fitting result.

Figure 6.
Top view of extending the endpoint of the non-overlapping region to the nearest plane: (a) the two endpoints (red circle) before extension; (b) the two endpoints after extension.
Figure 6.
Top view of extending the endpoint of the non-overlapping region to the nearest plane: (a) the two endpoints (red circle) before extension; (b) the two endpoints after extension.

Figure 7.
Illustration of the cuboid abstraction processing: (a) input of the original photogrammetric mesh model; (b) the first fitted cuboid; (c) the modification of the first fitted cuboid; (d) the second fitted cuboid; (e) combined cuboid abstraction result.
Figure 7.
Illustration of the cuboid abstraction processing: (a) input of the original photogrammetric mesh model; (b) the first fitted cuboid; (c) the modification of the first fitted cuboid; (d) the second fitted cuboid; (e) combined cuboid abstraction result.

Figure 8.
The reconstruction results. Each row (from left to right) presents the original photogrammetric mesh model, initial cuboid abstraction set, façade model overlaid on the original date, and 3D building façade model.
Figure 8.
The reconstruction results. Each row (from left to right) presents the original photogrammetric mesh model, initial cuboid abstraction set, façade model overlaid on the original date, and 3D building façade model.

Figure 9.
The graphics of reconstruction errors for four buildings: (a,c,e,g) façade model overlaid on the original date; (b,d,f,h) reconstruction error.
Figure 9.
The graphics of reconstruction errors for four buildings: (a,c,e,g) façade model overlaid on the original date; (b,d,f,h) reconstruction error.

Figure 10.
The statistical results of the reconstruction errors for four buildings.

Figure 11.
A scene of photogrammetric mesh model.

Figure 12.
The façade reconstruction result.

Figure 13.
The statistical results of the reconstruction errors for a scene.


Table 1.
The basic information of the selected buildings.
| Test Data | Number of Vertices | Number of Triangle Facets |
|---|---|---|
| Building A | 4324 | 8081 |
| Building B | 2647 | 4899 |
| Building C | 3424 | 6322 |
| Building D | 1834 | 3358 |
Table 2.
A comparison study on previously obtained results by relevant studies.
| Methods | Data Source | Error (Meters) |
|---|---|---|
| Li et al. [27] | 3D point cloud generated from UAV images by SFM and MVS | 0.15 |
| Song et al. [32] | Airborne LiDAR data | 0.17–0.34 |
| Wu et al. [33] | Airborne LiDAR point clouds | 0.32 |
| Lafarge and Mallet, [34] | Digital surface model | 0.1–0.24 |
Publisher’s Note: MDPI stays neutral with regard to jurisdictional claims in published maps and institutional affiliations. |
© 2021 by the authors. Licensee MDPI, Basel, Switzerland. This article is an open access article distributed under the terms and conditions of the Creative Commons Attribution (CC BY) license (https://creativecommons.org/licenses/by/4.0/).
Share and Cite
MDPI and ACS Style
Zhang, Y.; Zhang, C.; Chen, S.; Chen, X. Automatic Reconstruction of Building Façade Model from Photogrammetric Mesh Model. Remote Sens. 2021, 13, 3801. https://doi.org/10.3390/rs13193801
AMA Style
Zhang Y, Zhang C, Chen S, Chen X. Automatic Reconstruction of Building Façade Model from Photogrammetric Mesh Model. Remote Sensing. 2021; 13(19):3801. https://doi.org/10.3390/rs13193801
Chicago/Turabian StyleZhang, Yunsheng, Chi Zhang, Siyang Chen, and Xueye Chen. 2021. "Automatic Reconstruction of Building Façade Model from Photogrammetric Mesh Model" Remote Sensing 13, no. 19: 3801. https://doi.org/10.3390/rs13193801
Note that from the first issue of 2016, this journal uses article numbers instead of page numbers. See further details here.