Next Issue
Volume 13, October-2
Previous Issue
Volume 13, September-2
 
 
remotesensing-logo

Journal Browser

Journal Browser

Remote Sens., Volume 13, Issue 19 (October-1 2021) – 229 articles

Cover Story (view full-size image): 
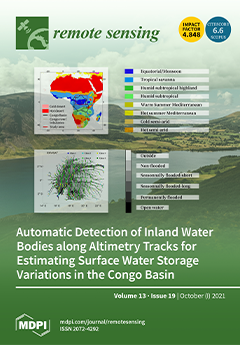
Radar altimetry not only provides information on the surface elevation but also on the nature of the land surfaces via the radar echo and derived parameters as the backscattering coefficient. The presence of water was detected along the altimeter groundtracks using an unsupervised classification approach on the backscattering coefficient. From this detection, a dense network of altimetry-based water level stations was built over the rivers and wetlands in the center of the Congo Basin. Comparisons against manually generated altimetry-based stations showed a good agreement between the two sources of water levels. Lower annual amplitude of the water levels was observed over the wetlands than over the rivers. The inclusion of changes in water levels over the wetlands has a strong implication for surface water storage estimates. View this paper
  • Issues are regarded as officially published after their release is announced to the table of contents alert mailing list.
  • You may sign up for e-mail alerts to receive table of contents of newly released issues.
  • PDF is the official format for papers published in both, html and pdf forms. To view the papers in pdf format, click on the "PDF Full-text" link, and use the free Adobe Reader to open them.
Order results
Result details
Section
Select all
Export citation of selected articles as:
16 pages, 4156 KiB  
Article
Improved Single-Frequency Kinematic Orbit Determination Strategy of Small LEO Satellite with the Sun-Pointing Attitude Mode
by Wenju Fu, Lei Wang, Ruizhi Chen, Haitao Zhou, Tao Li and Yi Han
Remote Sens. 2021, 13(19), 4020; https://doi.org/10.3390/rs13194020 - 08 Oct 2021
Cited by 1 | Viewed by 2333
Abstract
Kinematic orbit determination (KOD) of low earth orbit (LEO) satellites only using single-frequency global navigation satellite system (GNSS) data is a suitable solution for space applications demanding meter-level orbit precision. For some small LEO satellites with the sun-pointing attitude mode, the rotation of [...] Read more.
Kinematic orbit determination (KOD) of low earth orbit (LEO) satellites only using single-frequency global navigation satellite system (GNSS) data is a suitable solution for space applications demanding meter-level orbit precision. For some small LEO satellites with the sun-pointing attitude mode, the rotation of the GNSS antenna radiation pattern changes the observation noise characteristics. Since the rotation angle information of the antenna plane may not be available for most low-cost missions, the true elevation cannot be computed and a general elevation-dependent weighting model remains invalid for the onboard GNSS observations. Furthermore, the low-stability GNSS receiver clock oscillator of the LEO satellite at high speeds makes single-frequency cycle slip detection ineffective and difficult since the clock steering events occur frequently. In this study, we investigated the improved KOD strategy to improve the performance of orbit solution using single-frequency GPS and BeiDou navigation satellite system (BDS) observations collected from the Luojia-1A satellite. The weighting model based on exponential function and signal strength is proposed according to the analysis of satellite attitude impact, and a joint single-frequency detection algorithm of receiver clock jump and cycle slip is investigated as well. Based on the GPS/BDS-combined KOD results, it is demonstrated that the clock jump and cycle slip can be properly detected and observations can be effectively utilized with the proposed weighting model considering satellite attitude, which significantly improves the availability and accuracy of orbit solution. The number of available epochs is increased by 12.9% benefitting from this strategy. The orbital root mean square (RMS) precision improvements in the radial, along-track, and cross-track directions are 22.1%, 16.4%, and 6.5%, respectively. Combining BDS observations also contributes to orbit precision improvement, which reaches up to 28.8%. Full article
(This article belongs to the Special Issue Autonomous Space Navigation)
Show Figures

Figure 1

27 pages, 5315 KiB  
Article
Societal Implications of Forest and Water Body Area Evolution in Czechia and Selected Regions
by Diana Carolina Huertas Bernal, Ratna Chrismiari Purwestri, Mayang Christy Perdana, Miroslav Hájek, Meryem Tahri, Petra Palátová and Miroslava Hochmalová
Remote Sens. 2021, 13(19), 4019; https://doi.org/10.3390/rs13194019 - 08 Oct 2021
Cited by 2 | Viewed by 2570
Abstract
Land cover evolution is an environmental factor that can be used to characterize forest ecosystem services (FES). This study aims to analyze the change in forest cover and water bodies between 1990 and 2018 in the whole Czech Republic, and in the Central [...] Read more.
Land cover evolution is an environmental factor that can be used to characterize forest ecosystem services (FES). This study aims to analyze the change in forest cover and water bodies between 1990 and 2018 in the whole Czech Republic, and in the Central Bohemian and South Moravian regions, and its effects on freshwater provision. Additionally, we attempt to understand the societal implications of water quality, public perception, and environmental investment on natural ecosystems. Forest cover and water body data were obtained from the Corine land cover database, while water quality and investment were compiled from the Czech Statistical Office. Public perceptions on the Czech FES were collected from a national survey. Between 1990 and 2018, forest cover has increased by 3.94% and water bodies by 7.65%; however, from 2014 to 2018, severe droughts were reported that compromised the availability of surface water, presumably on artificial structures, causing an increase in the occupied area. Regarding public perception, respondents with less education, and the older population, obtained an assessment of the low performance of the FES, while the water quality and investment indicate that environmental funding has contributed to improving the quality of outflow water from the wastewater treatment plants, fulfilling all the allowed limits of the urban wastewater treatment directive. Hence, a multidisciplinary approach can help decision makers promote policies that integrate environmental management measures, investment protection, and contribute to sustainable development. Full article
(This article belongs to the Special Issue Remote Sensing of Forest and Wetland Hydrology)
Show Figures

Graphical abstract

29 pages, 11047 KiB  
Article
A Universal Fuzzy Logic Optical Water Type Scheme for the Global Oceans
by Tianxia Jia, Yonglin Zhang and Rencai Dong
Remote Sens. 2021, 13(19), 4018; https://doi.org/10.3390/rs13194018 - 08 Oct 2021
Cited by 9 | Viewed by 2010
Abstract
The classification of natural waters is a way to generalize and systematize ocean color science. However, there is no consensus on an optimal water classification template in many contexts. In this study, we conducted an unsupervised classification of the PACE (Plankton, Aerosols, Cloud, [...] Read more.
The classification of natural waters is a way to generalize and systematize ocean color science. However, there is no consensus on an optimal water classification template in many contexts. In this study, we conducted an unsupervised classification of the PACE (Plankton, Aerosols, Cloud, and Ocean Ecosystem) synthetic hyperspectral data set, divided the global ocean waters into 15 classes, then obtained a set of fuzzy logic optical water type schemes (abbreviated as the U-OWT in this study) that were tailored for several multispectral satellite sensors, including SeaWiFS, MERIS, MODIS, OLI, VIIRS, MSI, and OLCI. The consistency analysis showed that the performance of U-OWT on different satellite sensors was comparable, and the sensitivity analysis demonstrated the U-OWT could resist a certain degree of input disturbance on remote sensing reflectance. Compared to existing ocean-aimed optical water type schemes, the U-OWT can distinguish more mesotrophic and eutrophic water classes. Furthermore, the U-OWT was highly compatible with other water classification taxonomies, including the trophic state index, the multivariate absorption combinations, and the Forel-Ule Scale, which indirectly demonstrated the potential for global applicability of the U-OWT. This finding was also helpful for the further conversion and unification of different water type taxonomies. As the fundamental basis, the U-OWT can be applied to many oceanic fields that need to be explored in the future. To promote the reproducibility of this study, an IDL®-based standalone U-OWT calculation tool is freely distributed. Full article
(This article belongs to the Special Issue Remote Sensing Applications in Ocean Observation)
Show Figures

Graphical abstract

20 pages, 3244 KiB  
Article
Direct Aerial Visual Geolocalization Using Deep Neural Networks
by Winthrop Harvey, Chase Rainwater and Jackson Cothren
Remote Sens. 2021, 13(19), 4017; https://doi.org/10.3390/rs13194017 - 08 Oct 2021
Cited by 7 | Viewed by 2814
Abstract
Unmanned aerial vehicles (UAVs) must keep track of their location in order to maintain flight plans. Currently, this task is almost entirely performed by a combination of Inertial Measurement Units (IMUs) and reference to GNSS (Global Navigation Satellite System). Navigation by GNSS, however, [...] Read more.
Unmanned aerial vehicles (UAVs) must keep track of their location in order to maintain flight plans. Currently, this task is almost entirely performed by a combination of Inertial Measurement Units (IMUs) and reference to GNSS (Global Navigation Satellite System). Navigation by GNSS, however, is not always reliable, due to various causes both natural (reflection and blockage from objects, technical fault, inclement weather) and artificial (GPS spoofing and denial). In such GPS-denied situations, it is desirable to have additional methods for aerial geolocalization. One such method is visual geolocalization, where aircraft use their ground facing cameras to localize and navigate. The state of the art in many ground-level image processing tasks involve the use of Convolutional Neural Networks (CNNs). We present here a study of how effectively a modern CNN designed for visual classification can be applied to the problem of Absolute Visual Geolocalization (AVL, localization without a prior location estimate). An Xception based architecture is trained from scratch over a >1000 km2 section of Washington County, Arkansas to directly regress latitude and longitude from images from different orthorectified high-altitude survey flights. It achieves average localization accuracy on unseen image sets over the same region from different years and seasons with as low as 115 m average error, which localizes to 0.004% of the training area, or about 8% of the width of the 1.5 × 1.5 km input image. This demonstrates that CNNs are expressive enough to encode robust landscape information for geolocalization over large geographic areas. Furthermore, discussed are methods of providing uncertainty for CNN regression outputs, and future areas of potential improvement for use of deep neural networks in visual geolocalization. Full article
(This article belongs to the Special Issue Computer Vision and Deep Learning for Remote Sensing Applications)
Show Figures

Graphical abstract

12 pages, 1590 KiB  
Communication
Photometric Observations of Aerosol Optical Properties and Emission Flux Rates of Stromboli Volcano Plume during the PEACETIME Campaign
by Pasquale Sellitto, Giuseppe Salerno, Jean-François Doussin, Sylvain Triquet, François Dulac and Karine Desboeufs
Remote Sens. 2021, 13(19), 4016; https://doi.org/10.3390/rs13194016 - 08 Oct 2021
Cited by 2 | Viewed by 1936
Abstract
The characterisation of aerosol emissions from volcanoes is a crucial step towards the assessment of their importance for regional air quality and regional-to-global climate. In this paper we present, for the first time, the characterisation of aerosol emissions of the Stromboli volcano, in [...] Read more.
The characterisation of aerosol emissions from volcanoes is a crucial step towards the assessment of their importance for regional air quality and regional-to-global climate. In this paper we present, for the first time, the characterisation of aerosol emissions of the Stromboli volcano, in terms of their optical properties and emission flux rates, carried out during the PEACETIME oceanographic campaign. Using sun-photometric observations realised during a near-ideal full plume crossing, a plume-isolated aerosol optical depth of 0.07–0.08 in the shorter-wavelength visible range, decreasing to about 0.02 in the near infrared range, was found. An Ångström exponent of 1.40 ± 0.40 was also derived. This value may suggest the dominant presence of sulphate aerosols with a minor presence of ash. During the crossing, two separate plume sections were identified, one possibly slightly affected by ash coming from a mild explosion, and the other more likely composed of pure sulphate aerosols. Exploiting the full crossing scan of the plume, an aerosol emission flux rate of 9–13 kg/s was estimated. This value was 50% larger than for typical passively degassing volcanoes, thus pointing to the importance of mild explosions for aerosol emissions in the atmosphere. Full article
Show Figures

Figure 1

24 pages, 9814 KiB  
Article
A Comparison of Volumetric Reconstruction Methods of Archaeological Deposits Using Point-Cloud Data from Ahuahu, Aotearoa New Zealand
by Joshua Emmitt, Patricia Pillay, Matthew Barrett, Stacey Middleton, Timothy Mackrell, Bruce Floyd and Thegn N. Ladefoged
Remote Sens. 2021, 13(19), 4015; https://doi.org/10.3390/rs13194015 - 07 Oct 2021
Cited by 6 | Viewed by 2699
Abstract
Collection of 3D data in archaeology is a long-standing practice. Traditionally, the focus of these data has been visualization as opposed to analysis. Three-dimensional data are often recorded during archaeological excavations, with the provenience of deposits, features, and artefacts documented by a variety [...] Read more.
Collection of 3D data in archaeology is a long-standing practice. Traditionally, the focus of these data has been visualization as opposed to analysis. Three-dimensional data are often recorded during archaeological excavations, with the provenience of deposits, features, and artefacts documented by a variety of methods. Simple analysis of 3D data includes calculating the volumes of bound entities, such as deposits and features, and determining the spatial relationships of artifacts within these. The construction of these volumes presents challenges that originate in computer-aided design (CAD) but have implications for how data are used in archaeological analysis. We evaluate 3D construction processes using data from Waitetoke, Ahuahu Great Mercury Island, Aotearoa, New Zealand. Point clouds created with data collected by total station, photogrammetry, and terrestrial LiDAR using simultaneous localization and mapping (SLAM) are compared, as well as different methods for generating surface area and volumes with triangulated meshes and convex hulls. The differences between methods are evaluated and assessed in relation to analyzing artifact densities within deposits. While each method of 3D data acquisition and modeling has advantages in terms of accuracy and precision, other factors such as data collection and processing times must be considered when deciding on the most suitable. Full article
(This article belongs to the Special Issue Remote Sensing of Past Human Land Use)
Show Figures

Graphical abstract

22 pages, 1448 KiB  
Article
On-Demand Satellite Payload Execution Strategy for Natural Disasters Monitoring Using LoRa: Observation Requirements and Optimum Medium Access Layer Mechanisms
by Lara Fernandez, Joan Adria Ruiz-de-Azua, Anna Calveras and Adriano Camps
Remote Sens. 2021, 13(19), 4014; https://doi.org/10.3390/rs13194014 - 07 Oct 2021
Cited by 7 | Viewed by 2300
Abstract
Natural disasters and catastrophes are responsible for numerous casualties and important economic losses. They can be monitored either with in-situ or spaceborne instruments. However, these monitoring systems are not optimal for an early detection and constant monitoring. An optimisation of these systems could [...] Read more.
Natural disasters and catastrophes are responsible for numerous casualties and important economic losses. They can be monitored either with in-situ or spaceborne instruments. However, these monitoring systems are not optimal for an early detection and constant monitoring. An optimisation of these systems could benefit from networks of Internet of Things (IoT) sensors on the Earth’s surface, capable of automatically triggering on-demand executions of the spaceborne instruments. However, having a vast amount of sensors communicating at once with one satellite in view also poses a challenge in terms of the medium access layer (MAC), since, due to packet collisions, packet losses can occur. As part of this study, the monitoring requirements for an ideal spatial nodes density and measurement update frequencies of those sensors are provided. In addition, a study is performed to compare different MAC protocols, and to assess the sensors density that can be achieved with each of these protocols, using the LoRa technology, and concluding the feasibility of the monitoring requirements identified. Full article
(This article belongs to the Special Issue Remote Sensing for Near-Real-Time Disaster Monitoring)
Show Figures

Figure 1

20 pages, 3450 KiB  
Article
Robust Kalman Filter Soil Moisture Inversion Model Using GPS SNR Data—A Dual-Band Data Fusion Approach
by Lili Jing, Lei Yang, Wentao Yang, Tianhe Xu, Fan Gao, Yilin Lu, Bo Sun, Dongkai Yang, Xuebao Hong, Nazi Wang, Hongliang Ruan and José Darrozes
Remote Sens. 2021, 13(19), 4013; https://doi.org/10.3390/rs13194013 - 07 Oct 2021
Cited by 4 | Viewed by 2211
Abstract
This article aims to attempt to increase the number of satellites that can be used for monitoring soil moisture to obtain more precise results using GNSS-IR (Global Navigation Satellite System-Interferometric Reflectometry) technology to estimate soil moisture. We introduce a soil moisture inversion model [...] Read more.
This article aims to attempt to increase the number of satellites that can be used for monitoring soil moisture to obtain more precise results using GNSS-IR (Global Navigation Satellite System-Interferometric Reflectometry) technology to estimate soil moisture. We introduce a soil moisture inversion model by using GPS SNR (Signal-to-Noise Ratio) data and propose a novel Robust Kalman Filter soil moisture inversion model based on that. We validate our models on a data set collected at Lamasquère, France. This paper also compares the precision of the Robust Kalman Filter model with the conventional linear regression method and robust regression model in three different scenarios: (1) single-band univariate regression, by using only one observable feature such as frequency, amplitude, or phase; (2) dual-band data fusion univariate regression; and (3) dual-band data fusion multivariate regression. First, the proposed models achieve higher accuracy than the conventional method for single-band univariate regression, especially by using the phase as the input feature. Second, dual-band univariate data fusion achieves higher accuracy than single-band and the result of the Robust Kalman Filter model correlates better to the in situ measurement. Third, multivariate variable fusion improves the accuracy for both models, but the Robust Kalman Filter model achieves better improvement. Overall, the Robust Kalman Filter model shows better results in all the scenarios. Full article
(This article belongs to the Special Issue Recent Advances in GNSS Reflectometry)
Show Figures

Figure 1

24 pages, 11717 KiB  
Article
Assessing a Prototype Database for Comprehensive Global Aquatic Land Cover Mapping
by Panpan Xu, Nandin-Erdene Tsendbazar, Martin Herold and Jan G. P. W. Clevers
Remote Sens. 2021, 13(19), 4012; https://doi.org/10.3390/rs13194012 - 07 Oct 2021
Cited by 2 | Viewed by 2035
Abstract
The monitoring of Global Aquatic Land Cover (GALC) plays an essential role in protecting and restoring water-related ecosystems. Although many GALC datasets have been created before, a uniform and comprehensive GALC dataset is lacking to meet multiple user needs. This study aims to [...] Read more.
The monitoring of Global Aquatic Land Cover (GALC) plays an essential role in protecting and restoring water-related ecosystems. Although many GALC datasets have been created before, a uniform and comprehensive GALC dataset is lacking to meet multiple user needs. This study aims to assess the effectiveness of using existing global datasets to develop a comprehensive and user-oriented GALC database and identify the gaps of current datasets in GALC mapping. Eight global datasets were reframed to construct a three-level (i.e., from general to detailed) prototype database for 2015, conforming with the United Nations Land Cover Classification System (LCCS)-based GALC characterization framework. An independent validation was done, and the overall results show some limitations of current datasets in comprehensive GALC mapping. The Level-1 map had considerable commission errors in delineating the general GALC distribution. The Level-2 maps were good at characterizing permanently flooded areas and natural aquatic types, while accuracies were poor in the mapping of temporarily flooded and waterlogged areas as well as artificial aquatic types; vegetated aquatic areas were also underestimated. The Level-3 maps were not sufficient in characterizing the detailed life form types (e.g., trees, shrubs) for aquatic land cover. However, the prototype GALC database is flexible to derive user-specific maps and has important values to aquatic ecosystem management. With the evolving earth observation opportunities, limitations in the current GALC characterization can be addressed in the future. Full article
(This article belongs to the Special Issue Earth Observation Technologies for Monitoring of Water Environments)
Show Figures

Graphical abstract

30 pages, 8692 KiB  
Article
A New Integrated Approach for Landslide Data Balancing and Spatial Prediction Based on Generative Adversarial Networks (GAN)
by Husam A. H. Al-Najjar, Biswajeet Pradhan, Raju Sarkar, Ghassan Beydoun and Abdullah Alamri
Remote Sens. 2021, 13(19), 4011; https://doi.org/10.3390/rs13194011 - 07 Oct 2021
Cited by 23 | Viewed by 3587
Abstract
Landslide susceptibility mapping has significantly progressed with improvements in machine learning techniques. However, the inventory/data imbalance (DI) problem remains one of the challenges in this domain. This problem exists as a good quality landslide inventory map, including a complete record of historical data, [...] Read more.
Landslide susceptibility mapping has significantly progressed with improvements in machine learning techniques. However, the inventory/data imbalance (DI) problem remains one of the challenges in this domain. This problem exists as a good quality landslide inventory map, including a complete record of historical data, is difficult or expensive to collect. As such, this can considerably affect one’s ability to obtain a sufficient inventory or representative samples. This research developed a new approach based on generative adversarial networks (GAN) to correct imbalanced landslide datasets. The proposed method was tested at Chukha Dzongkhag, Bhutan, one of the most frequent landslide prone areas in the Himalayan region. The proposed approach was then compared with the standard methods such as the synthetic minority oversampling technique (SMOTE), dense imbalanced sampling, and sparse sampling (i.e., producing non-landslide samples as many as landslide samples). The comparisons were based on five machine learning models, including artificial neural networks (ANN), random forests (RF), decision trees (DT), k-nearest neighbours (kNN), and the support vector machine (SVM). The model evaluation was carried out based on overall accuracy (OA), Kappa Index, F1-score, and area under receiver operating characteristic curves (AUROC). The spatial database was established with a total of 269 landslides and 10 conditioning factors, including altitude, slope, aspect, total curvature, slope length, lithology, distance from the road, distance from the stream, topographic wetness index (TWI), and sediment transport index (STI). The findings of this study have shown that both GAN and SMOTE data balancing approaches have helped to improve the accuracy of machine learning models. According to AUROC, the GAN method was able to boost the models by reaching the maximum accuracy of ANN (0.918), RF (0.933), DT (0.927), kNN (0.878), and SVM (0.907) when default parameters used. With the optimum parameters, all models performed best with GAN at their highest accuracy of ANN (0.927), RF (0.943), DT (0.923) and kNN (0.889), except SVM obtained the highest accuracy of (0.906) with SMOTE. Our finding suggests that RF balanced with GAN can provide the most reasonable criterion for landslide prediction. This research indicates that landslide data balancing may substantially affect the predictive capabilities of machine learning models. Therefore, the issue of DI in the spatial prediction of landslides should not be ignored. Future studies could explore other generative models for landslide data balancing. By using state-of-the-art GAN, the proposed model can be considered in the areas where the data are limited or imbalanced. Full article
Show Figures

Graphical abstract

16 pages, 63229 KiB  
Article
Sentinel-2 Cloud Removal Considering Ground Changes by Fusing Multitemporal SAR and Optical Images
by Jianhao Gao, Yang Yi, Tang Wei and Guanhao Zhang
Remote Sens. 2021, 13(19), 3998; https://doi.org/10.3390/rs13193998 - 07 Oct 2021
Cited by 9 | Viewed by 2841
Abstract
Publicly available optical remote sensing images from platforms such as Sentinel-2 satellites contribute much to the Earth observation and research tasks. However, information loss caused by clouds largely decreases the availability of usable optical images so reconstructing the missing information is important. Existing [...] Read more.
Publicly available optical remote sensing images from platforms such as Sentinel-2 satellites contribute much to the Earth observation and research tasks. However, information loss caused by clouds largely decreases the availability of usable optical images so reconstructing the missing information is important. Existing reconstruction methods can hardly reflect the real-time information because they mainly make use of multitemporal optical images as reference. To capture the real-time information in the cloud removal process, Synthetic Aperture Radar (SAR) images can serve as the reference images due to the cloud penetrability of SAR imaging. Nevertheless, large datasets are necessary because existing SAR-based cloud removal methods depend on network training. In this paper, we integrate the merits of multitemporal optical images and SAR images to the cloud removal process, the results of which can reflect the ground information change, in a simple convolution neural network. Although the proposed method is based on deep neural network, it can directly operate on the target image without training datasets. We conduct several simulation and real data experiments of cloud removal in Sentinel-2 images with multitemporal Sentinel-1 SAR images and Sentinel-2 optical images. Experiment results show that the proposed method outperforms those state-of-the-art multitemporal-based methods and overcomes the constraint of datasets of those SAR-based methods. Full article
(This article belongs to the Section AI Remote Sensing)
Show Figures

Graphical abstract

18 pages, 29682 KiB  
Article
Vegetation Productivity Losses Linked to Mediterranean Hot and Dry Events
by Tiago Ermitão, Célia M. Gouveia, Ana Bastos and Ana C. Russo
Remote Sens. 2021, 13(19), 4010; https://doi.org/10.3390/rs13194010 - 06 Oct 2021
Cited by 4 | Viewed by 2959
Abstract
Persistent hot and dry conditions play an important role in vegetation dynamics, being generally associated with reduced activity. In the Mediterranean region, ecosystems are adapted to such conditions. However, prolonged and intense heat and drought or the occurrence of compound hot and dry [...] Read more.
Persistent hot and dry conditions play an important role in vegetation dynamics, being generally associated with reduced activity. In the Mediterranean region, ecosystems are adapted to such conditions. However, prolonged and intense heat and drought or the occurrence of compound hot and dry events may still have a negative impact on vegetation activity. This work aims to study how the productivity of Mediterranean vegetation is affected by hot and dry events, examining a set of severe episodes that occurred in three different regions (Iberian Peninsula, Eastern Mediterranean and Western Europe) between 2001 and 2019. The analysis relies on remote sensing products, namely Gross Primary Production from MODIS to detect and monitor vegetative stress and LST from MODIS and SM from ESA CCI to evaluate the influence of temperature and soil water availability on stressed vegetation. Of all events, the 2005 episode in the Iberian Peninsula was the most significant, affecting large sectors of low tree cover areas and crops and leading to reductions of annual plant productivity in affected vegetation of ~47 TgC/year. The obtained results highlight the influence of land-atmosphere coupling on vegetation productivity and clarified the role of warm springs on vegetation activity and soil moisture that may amplify summer temperatures. The functional recovery of affected vegetation productivity after these episodes varied across events, ranging from months to years. This work highlights the influence of hot and dry events on vegetation productivity in the Mediterranean basin and the usefulness of remote-sensing products to assess the response of different land covers to such episodes. Full article
(This article belongs to the Section Forest Remote Sensing)
Show Figures

Figure 1

26 pages, 4350 KiB  
Article
Identifying the Spectral Signatures of Invasive and Native Plant Species in Two Protected Areas of Pakistan through Field Spectroscopy
by Iram M. Iqbal, Heiko Balzter, Firdaus-e-Bareen and Asad Shabbir
Remote Sens. 2021, 13(19), 4009; https://doi.org/10.3390/rs13194009 - 06 Oct 2021
Cited by 9 | Viewed by 3912
Abstract
Globally, biological invasions are considered as one of the major contributing factors for the loss of indigenous biological diversity. Hyperspectral remote sensing plays an important role in the detection and mapping of invasive plant species. The main objective of this study was to [...] Read more.
Globally, biological invasions are considered as one of the major contributing factors for the loss of indigenous biological diversity. Hyperspectral remote sensing plays an important role in the detection and mapping of invasive plant species. The main objective of this study was to discriminate invasive plant species from adjacent native species using a ground-based hyperspectral sensor in two protected areas, Lehri Reserve Forest and Jindi Reserve Forest in Punjab, Pakistan. Field spectral measurements were collected using an ASD FieldSpec handheld2TM spectroradiometer (325–1075 nm) and the discrimination between native and invasive plant species was evaluated statistically using hyperspectral indices as well as leaf wavelength spectra. Finally, spectral separability was calculated using Jeffries Matusita distance index, based on selected wavebands. The results reveal that there were statistically significant differences (p < 0.05) between the different spectral indices of most of the plant species in the forests. However, the red-edge parameters showed the highest potential (p < 0.001) to discriminate different plant species. With leaf spectral signatures, the mean reflectance between all plant species was significantly different (p < 0.05) at 562 (75%) wavelength bands. Among pairwise comparisons, invasive Leucaena leucocephala showed the best discriminating ability, with Dodonaea viscosa having 505 significant wavebands showing variations between them. Jeffries Matusita distance analysis revealed that band combinations of the red-edge region (725, 726 nm) showed the best spectral separability (85%) for all species. Our findings suggest that it is possible to identify and discriminate invasive species through field spectroscopy for their future monitoring and management. However, the upscaling of hyperspectral measurements to airborne and satellite sensors can provide a reliable estimation of invasion through mapping inside the protected areas and can help to conserve biodiversity and environmental ecosystems in the future. Full article
Show Figures

Graphical abstract

38 pages, 15788 KiB  
Article
Impacts of Spatial Configuration of Land Surface Features on Land Surface Temperature across Urban Agglomerations, China
by Qiang Zhang, Zixuan Wu, Vijay P. Singh and Chunling Liu
Remote Sens. 2021, 13(19), 4008; https://doi.org/10.3390/rs13194008 - 06 Oct 2021
Cited by 9 | Viewed by 3017
Abstract
Booming urbanization triggers a significant modification of surface landscape configuration and hence complex urban climates. Considerable concerns exist regarding impacts of impervious surface area (ISA) and/or urban green space (UGS) on land surface temperature (LST). However, a knowledge gap still exists concerning the [...] Read more.
Booming urbanization triggers a significant modification of surface landscape configuration and hence complex urban climates. Considerable concerns exist regarding impacts of impervious surface area (ISA) and/or urban green space (UGS) on land surface temperature (LST). However, a knowledge gap still exists concerning the influence of urban landscape components and related spatial configuration on LST. To date, case studies have usually focused on individual cities, while few reports have addressed the impacts of urban surface components and relevant spatial configurations on LST within cities of different sizes, at different latitudes, and with different climatic backgrounds. Considering case studies from different latitudes and various climatic backgrounds can assist in obtaining comprehensive viewpoints about impacts of urban surface features on LST in both space and time. In this paper we analyzed data from three urban agglomerations, Beijing–Tianjin–Hebei (BTH), the Yangtze River Delta (YRD) and the Pearl River Delta (PRD), over the period 2000–2015. These three regions are densely populated with the most developed socio-economy across China, and are also dominated by booming urbanization. Based on Landsat remotely sensed data, we included the spatial pattern of surface components and related configuration into our analysis, quantifying impacts of spatial configuration of surface components on LST in both space and time. We found generally rising LST over all cities, which can be attributed to continuous urban expansion-induced decreased UGS. Generally, LST over ISA was 0.96–7.96 °C higher than that over UGS. We investigated the impacts of spatial pattern of land surface components on LST and found that the joint effect of the composition and spatial configuration of land surface components had the most significant impact on LST. Specifically, ISA and UGS had higher impact on LST than the impact of geometry of the ISA and UGS on LST. In the future, continuous expansion of ISA and continuous shrinking of UGS will drive the rising tendency of LST. Moreover, a larger rising tendency of LST will be observed in larger sized cities than smaller sized cities. Full article
(This article belongs to the Section Urban Remote Sensing)
Show Figures

Figure 1

22 pages, 8917 KiB  
Article
Gap-Filling of NDVI Satellite Data Using Tucker Decomposition: Exploiting Spatio-Temporal Patterns
by Andri Freyr Þórðarson, Andreas Baum, Mónica García, Sergio M. Vicente-Serrano and Anders Stockmarr
Remote Sens. 2021, 13(19), 4007; https://doi.org/10.3390/rs13194007 - 06 Oct 2021
Cited by 3 | Viewed by 2848
Abstract
Remote sensing satellite images in the optical domain often contain missing or misleading data due to overcast conditions or sensor malfunctioning, concealing potentially important information. In this paper, we apply expectation maximization (EM) Tucker to NDVI satellite data from the Iberian Peninsula in [...] Read more.
Remote sensing satellite images in the optical domain often contain missing or misleading data due to overcast conditions or sensor malfunctioning, concealing potentially important information. In this paper, we apply expectation maximization (EM) Tucker to NDVI satellite data from the Iberian Peninsula in order to gap-fill missing information. EM Tucker belongs to a family of tensor decomposition methods that are known to offer a number of interesting properties, including the ability to directly analyze data stored in multidimensional arrays and to explicitly exploit their multiway structure, which is lost when traditional spatial-, temporal- and spectral-based methods are used. In order to evaluate the gap-filling accuracy of EM Tucker for NDVI images, we used three data sets based on advanced very-high resolution radiometer (AVHRR) imagery over the Iberian Peninsula with artificially added missing data as well as a data set originating from the Iberian Peninsula with natural missing data. The performance of EM Tucker was compared to a simple mean imputation, a spatio-temporal hybrid method, and an iterative method based on principal component analysis (PCA). In comparison, imputation of the missing data using EM Tucker consistently yielded the most accurate results across the three simulated data sets, with levels of missing data ranging from 10 to 90%. Full article
Show Figures

Graphical abstract

18 pages, 8187 KiB  
Article
Seasonal Surface Fluctuation of a Slow-Moving Landslide Detected by Multitemporal Interferometry (MTI) on the Huafan University Campus, Northern Taiwan
by Chiao-Yin Lu, Yu-Chang Chan, Jyr-Ching Hu, Chia-Han Tseng, Che-Hsin Liu and Chih-Hsin Chang
Remote Sens. 2021, 13(19), 4006; https://doi.org/10.3390/rs13194006 - 06 Oct 2021
Cited by 6 | Viewed by 2307
Abstract
A slow-moving landslide on the Huafan University campus, which is located on a dip slope in northern Taiwan, has been observed since 1990. However, reliable monitoring data are difficult to acquire after 2018 due to the lack of continuous maintenance of the field [...] Read more.
A slow-moving landslide on the Huafan University campus, which is located on a dip slope in northern Taiwan, has been observed since 1990. However, reliable monitoring data are difficult to acquire after 2018 due to the lack of continuous maintenance of the field measurement equipment. In this study, the multitemporal interferometry (MTI) technique is applied with Sentinel-1 SAR images to monitor the slow-moving landslide from 2014–2019. The slow-moving areas detected by persistent scatterer (PS) pixels are consistent with the range of previous studies, which are based on in situ monitoring data and field surveys. According to the time series of the PS pixels, a long period gravity-induced deformation of the slow-moving landslide can be clearly observed. Moreover, a short period seasonal surface fluctuation of the slow-moving landslide, which has seldom been discussed before, can also be detected in this study. The seasonal surface fluctuation is in-phase with precipitation, which is inferred to be related to the geological and hydrological conditions of the study area. The MTI technique can compensate for the lack of surface displacement data, in this case, the Huafan University campus, and provide information for evaluating and monitoring slow-moving landslides for possible landslide early warning in the future. Full article
Show Figures

Graphical abstract

18 pages, 5587 KiB  
Article
Multi-Sensor, Active Fire-Supervised, One-Class Burned Area Mapping in the Brazilian Savanna
by Allan A. Pereira, Renata Libonati, Julia A. Rodrigues, Joana Nogueira, Filippe L. M. Santos, Duarte Oom, Waislan Sanches, Swanni T. Alvarado and José M. C. Pereira
Remote Sens. 2021, 13(19), 4005; https://doi.org/10.3390/rs13194005 - 06 Oct 2021
Cited by 5 | Viewed by 2141
Abstract
Increasing efforts are being devoted to understanding fire patterns and changes highlighting the need for a consistent database about the location and extension of burned areas (BA). Satellite-derived BA mapping accuracy in the Brazilian savannas is limited by the underestimation of burn scars [...] Read more.
Increasing efforts are being devoted to understanding fire patterns and changes highlighting the need for a consistent database about the location and extension of burned areas (BA). Satellite-derived BA mapping accuracy in the Brazilian savannas is limited by the underestimation of burn scars from small, fragmented fires and high cloudiness. Moreover, systematic mapping of BA is challenged by the need for human intervention in training sample acquisition, which precludes the development of automatic-generated products over large areas and long periods. Here, we developed a multi-sensor, active fire-supervised, one-class BA mapping algorithm to address several of these limitations. Our main objective is to generate a long-term, detailed BA atlas suitable to improve fire regime characterization and validation of coarse resolution products. We use composite images derived from the Landsat satellite to generate end-of-season maps of fire-affected areas for the entire Cerrado. Validation exercises and intercomparison with BA maps from a semi-automatic algorithm and visual photo interpretation were conducted for the year 2015. Our results improve the BA mapping by reducing omission errors, especially where there is high cloud frequency, few active fires are detected, and burned areas are small and fragmented. Finally, our approach represents at least a 45% increase in BA mapped in the Cerrado, in comparison to the annual extent detected by the current coarse global product from MODIS satellite (MCD64), and thus, it is capable of supporting improved regional emissions estimates. Full article
(This article belongs to the Special Issue Remote Sensing of Vegetation Dynamics and Resilience)
Show Figures

Graphical abstract

28 pages, 9419 KiB  
Article
Applying a Hand-Held Laser Scanner to Monitoring Gully Erosion: Workflow and Evaluation
by Anne Kinsey-Henderson, Aaron Hawdon, Rebecca Bartley, Scott N. Wilkinson and Thomas Lowe
Remote Sens. 2021, 13(19), 4004; https://doi.org/10.3390/rs13194004 - 06 Oct 2021
Cited by 5 | Viewed by 2028
Abstract
Detailed understanding of gully erosion processes is essential for monitoring gully remediation and requires fine-scale monitoring. Hand-held laser scanning systems (HLS) enable rapid ground-based data acquisition at centimeter precision and ranges of 10–100 m. This study quantified errors in measuring gully morphology and [...] Read more.
Detailed understanding of gully erosion processes is essential for monitoring gully remediation and requires fine-scale monitoring. Hand-held laser scanning systems (HLS) enable rapid ground-based data acquisition at centimeter precision and ranges of 10–100 m. This study quantified errors in measuring gully morphology and erosion over a four year period using two models of HLS. Reference datasets were provided by Real-Time-Kinematic (RTK) GPS and a RIEGL Terrestrial Laser Scanner (TLS). The study site was representative of linear gullies that occur extensively on hillslopes throughout Great Barrier Reef catchments, where gully erosion is the dominant source of fine sediment. The RMSE error against RTK survey points varied 0.058–0.097 m over five annual scans. HLS was found to measure annual gully headcut extension within 0.035 m of RTK. HLS was, on average, within 6% of TLS for morphological metrics of depth, area and volume. Volumetric change over a 60 m length of the gully and four years was estimated to within 23% of TLS. Errors could potentially be improved by scanning at times of year with lower ground vegetation cover. HLS provided similar levels of error and was relatively more rapid than TLS and RTK for monitoring gully morphology and change. Full article
(This article belongs to the Section Remote Sensing in Geology, Geomorphology and Hydrology)
Show Figures

Graphical abstract

18 pages, 81419 KiB  
Article
Day–Night Monitoring of Volcanic SO2 and Ash Clouds for Aviation Avoidance at Northern Polar Latitudes
by Nickolay Krotkov, Vincent Realmuto, Can Li, Colin Seftor, Jason Li, Kelvin Brentzel, Martin Stuefer, Jay Cable, Carl Dierking, Jennifer Delamere, David Schneider, Johanna Tamminen, Seppo Hassinen, Timo Ryyppö, John Murray, Simon Carn, Jeffrey Osiensky, Nate Eckstein, Garrett Layne and Jeremy Kirkendall
Remote Sens. 2021, 13(19), 4003; https://doi.org/10.3390/rs13194003 - 06 Oct 2021
Cited by 4 | Viewed by 3327
Abstract
We describe NASA’s Applied Sciences Disasters Program, which is a collaborative project between the Direct Readout Laboratory (DRL), ozone processing team, Jet Propulsion Laboratory, Geographic Information Network of Alaska (GINA), and Finnish Meteorological Institute (FMI), to expedite the processing and delivery of direct [...] Read more.
We describe NASA’s Applied Sciences Disasters Program, which is a collaborative project between the Direct Readout Laboratory (DRL), ozone processing team, Jet Propulsion Laboratory, Geographic Information Network of Alaska (GINA), and Finnish Meteorological Institute (FMI), to expedite the processing and delivery of direct readout (DR) volcanic ash and sulfur dioxide (SO2) satellite data. We developed low-latency quantitative retrievals of SO2 column density from the solar backscattered ultraviolet (UV) measurements using the Ozone Mapping and Profiler Suite (OMPS) spectrometers as well as the thermal infrared (TIR) SO2 and ash indices using Visible Infrared Imaging Radiometer Suite (VIIRS) instruments, all flying aboard US polar-orbiting meteorological satellites. The VIIRS TIR indices were developed to address the critical need for nighttime coverage over northern polar regions. Our UV and TIR SO2 and ash software packages were designed for the DRL’s International Planetary Observation Processing Package (IPOPP); IPOPP runs operationally at GINA and FMI stations in Fairbanks, Alaska, and Sodankylä, Finland. The data are produced within 30 min of satellite overpasses and are distributed to the Alaska Volcano Observatory and Anchorage Volcanic Ash Advisory Center. FMI receives DR data from GINA and posts composite Arctic maps for ozone, volcanic SO2, and UV aerosol index (UVAI, proxy for ash or smoke) on its public website and provides DR data to EUMETCast users. The IPOPP-based software packages are available through DRL to a broad DR user community worldwide. Full article
(This article belongs to the Special Issue Remote Sensing for Near-Real-Time Disaster Monitoring)
Show Figures

Graphical abstract

19 pages, 48266 KiB  
Article
Algorithm Research Using GNSS-TEC Data to Calibrate TEC Calculated by the IRI-2016 Model over China
by Wen Zhang, Xingliang Huo, Yunbin Yuan, Zishen Li and Ningbo Wang
Remote Sens. 2021, 13(19), 4002; https://doi.org/10.3390/rs13194002 - 06 Oct 2021
Cited by 6 | Viewed by 2086
Abstract
The International Reference Ionosphere (IRI) is an empirical model widely used to describe ionospheric characteristics. In the previous research, high-precision total ionospheric electron content (TEC) data derived from global navigation satellite system (GNSS) data were used to adjust the ionospheric global index IG [...] Read more.
The International Reference Ionosphere (IRI) is an empirical model widely used to describe ionospheric characteristics. In the previous research, high-precision total ionospheric electron content (TEC) data derived from global navigation satellite system (GNSS) data were used to adjust the ionospheric global index IG12 used as a driving parameter in the standard IRI model; thus, the errors between IRI-TEC and GNSS-TEC were minimized, and IRI-TEC was calibrated by modifying IRI with the updated IG12 index (IG-up). This paper investigates various interpolation strategies for IG-up values calculated from GNSS reference stations and the calibrated TEC accuracy achieved using the modified IRI-2016 model with the interpolated IG-up values as driving parameters. Experimental results from 2015 and 2019 show that interpolating IG-up with a 2.5° × 5° spatial grid and a 1-h time resolution drives IRI-2016 to generate ionospheric TEC values consistent with GNSS-TEC. For 2015 and 2019, the mean absolute error (MAE) of the modified IRI-TEC is improved by 78.57% and 77.42%, respectively, and the root mean square error (RMSE) is improved by 78.79% and 77.14%, respectively. The corresponding correlations of the linear regression between GNSS-TEC and the modified IRI-TEC are 0.986 and 0.966, more than 0.2 higher than with the standard IRI-TEC. Full article
(This article belongs to the Special Issue GNSS Atmospheric Modelling)
Show Figures

Figure 1

13 pages, 1443 KiB  
Article
Landscape Structure of Woody Cover Patches for Endangered Ocelots in Southern Texas
by Jason V. Lombardi, Humberto L. Perotto-Baldivieso, Maksim Sergeyev, Amanda M. Veals, Landon Schofield, John H. Young and Michael E. Tewes
Remote Sens. 2021, 13(19), 4001; https://doi.org/10.3390/rs13194001 - 06 Oct 2021
Cited by 13 | Viewed by 2954
Abstract
Few ecological studies have explored landscape suitability using the gradient concept of landscape structure for wildlife species. Identification of conditions influencing the landscape ecology of endangered species allows for development of more robust recovery strategies. Our objectives were to (i) identify the range [...] Read more.
Few ecological studies have explored landscape suitability using the gradient concept of landscape structure for wildlife species. Identification of conditions influencing the landscape ecology of endangered species allows for development of more robust recovery strategies. Our objectives were to (i) identify the range of landscape metrics (i.e., mean patch area; patch and edge densities; percent land cover; shape, aggregation, and largest patch indices) associated with woody vegetation used by ocelots (Leopardus pardalis), and (ii) quantify the potential distribution of suitable woody cover for ocelots across southern Texas. We used the gradient concept of landscape structure and the theory of slack combined with GPS telemetry data from 10 ocelots. Spatial distribution of high suitable woody cover is comprised of large patches, with low shape-index values (1.07–2.25), patch (27.21–72.50 patches/100 ha), and edge (0–191.50 m/ha) densities. High suitability landscape structure for ocelots occurs in 45.27% of woody cover in southern Texas. Our study demonstrates a new approach for measuring landscape suitability for ocelots in southern Texas. The range of landscape values identified that there are more large woody patches containing the spatial structure used by ocelots than previously suspected, which will aid in evaluating recovery and road planning efforts. Full article
Show Figures

Figure 1

20 pages, 3425 KiB  
Article
Evaluating Calibration and Spectral Variable Selection Methods for Predicting Three Soil Nutrients Using Vis-NIR Spectroscopy
by Peng Guo, Ting Li, Han Gao, Xiuwan Chen, Yifeng Cui and Yanru Huang
Remote Sens. 2021, 13(19), 4000; https://doi.org/10.3390/rs13194000 - 06 Oct 2021
Cited by 33 | Viewed by 3728
Abstract
Soil nutrients, including soil available potassium (SAK), soil available phosphorous (SAP), and soil organic matter (SOM), play an important role in farmland soil productivity, food security, and agricultural management. Spectroscopic analysis has proven to be a rapid, nondestructive, and effective technique for predicting [...] Read more.
Soil nutrients, including soil available potassium (SAK), soil available phosphorous (SAP), and soil organic matter (SOM), play an important role in farmland soil productivity, food security, and agricultural management. Spectroscopic analysis has proven to be a rapid, nondestructive, and effective technique for predicting soil properties in general and potassium, phosphorous, and organic matter in particular. However, the successful estimation of soil nutrient content by visible and near-infrared (Vis-NIR) reflectance spectroscopy depends on proper calibration methods (including preprocessing transformation methods and multivariate methods for regression analysis) and the selection of appropriate variable selection techniques. In this study, raw spectrum and 13 preprocessing transformations combined with 2 variable selection methods (competitive adaptive reweighted sampling (CARS) and the successive projections algorithm (SPA)) and 2 regression algorithms (support vector machine (SVM) and partial least squares regression (PLSR)), for a total of 56 calibration methods, were investigated for modeling and predicting the above three soil nutrients using hyperspectral Vis-NIR data (400–2450 nm). The results show that first-order derivatives based on logarithmic and inverse transformations (FD-LGRs) can provide better predictions of soil available potassium and phosphorous, and the best form of soil organic matter transformation is SG+MSC. CARS was superior to the SPA in selecting effective variables, and the PLSR model outperformed the SVM models. The best estimation accuracies (R2, RMSE) for soil available potassium, phosphorous, and organic matter were 0.7532, 32.3090 mg/kg; 0.7440, 6.6910 mg/kg; and 0.9009, 3.2103 g/kg, respectively, and their corresponding calibration methods were (FD-LGR)/SPA/PLSR, (FD-LGR)/SPA/PLSR, and SG+MSC/CARS/SVM, respectively. Overall, for the prediction of the soil nutrient content, organic matter was superior to available phosphorous, followed by available potassium. It was concluded that the application of hyperspectral images (Vis-NIR data) was an efficient method for mapping and monitoring soil nutrients at the regional scale, thus contributing to the development of precision agriculture. Full article
Show Figures

Figure 1

17 pages, 17814 KiB  
Communication
Sentinel-1 and RADARSAT Constellation Mission InSAR Assessment of Slope Movements in the Southern Interior of British Columbia, Canada
by Byung-Hun Choe, Andrée Blais-Stevens, Sergey Samsonov and Jonathan Dudley
Remote Sens. 2021, 13(19), 3999; https://doi.org/10.3390/rs13193999 - 06 Oct 2021
Cited by 8 | Viewed by 3128
Abstract
Landslides are the most common natural hazard in British Columbia. The province has recorded the largest number of historical landslide fatalities in Canada, and damage to infrastructure comes at a great cost. In order to understand the potential impacts of landslides, radar remote [...] Read more.
Landslides are the most common natural hazard in British Columbia. The province has recorded the largest number of historical landslide fatalities in Canada, and damage to infrastructure comes at a great cost. In order to understand the potential impacts of landslides, radar remote sensing has become a cost-effective method for detecting downslope movements. This study investigates downslope movements in the Southern Interior of British Columbia, Canada, with Sentinel-1 and RADARSAT Constellation Mission (RCM) interferometric synthetic aperture radar (InSAR) data. The 2-dimensional time-series analysis with Sentinel-1 ascending and descending InSAR pairs from October 2017 to June 2021 observed distinct earthflow movements of up to ~15 cm/year in the east–west direction. The Grinder Creek, Red Mountain, Yalakom River, and Retaskit Creek earthflows previously documented are still active, with east–west movements of ~30 cm over the past four years. New RCM data acquired from June 2020 to September 2020 with a 4-day revisit capability were compared to 12-day Sentinel-1 InSAR pairs. The 4-day RCM InSAR pairs at higher spatial resolution showed better performance by detecting relatively small-sized slope movements within a few hundred meters, which were not clearly observed by Sentinel-1. The temporal variabilities observed from the RCM InSAR showed great potential for observing detailed slope movements within a narrower time window. Full article
(This article belongs to the Special Issue RADARSAT Constellation Mission (RCM))
Show Figures

Graphical abstract

31 pages, 8492 KiB  
Article
Global Land High-Resolution Cloud Climatology Based on an Improved MOD09 Cloud Mask
by Shuyan Zhang, Yong Ma, Fu Chen, Erping Shang, Wutao Yao, Yubao Qiu and Jianbo Liu
Remote Sens. 2021, 13(19), 3997; https://doi.org/10.3390/rs13193997 - 06 Oct 2021
Cited by 2 | Viewed by 2125
Abstract
Clouds play an important role in the energy and moisture cycle of the earth–atmosphere system, which affects many important processes in nature and human societies. However, there are very few fine-grained and high-precision global cloud climatology data available for high-resolution models. In this [...] Read more.
Clouds play an important role in the energy and moisture cycle of the earth–atmosphere system, which affects many important processes in nature and human societies. However, there are very few fine-grained and high-precision global cloud climatology data available for high-resolution models. In this paper, we produced a fine-grained (1 km resolution) global land cloud climatology (GLHCC) report based on MOD09 cloud masks from 2001 to 2016, with a temporal resolution of 10 days. The two improvements (short-wave infrared and Band 2/6 ratio threshold method) on the original MOD09 cloud mask have reduced the snow, ice, and bright areas mistakenly classified as clouds. The preliminary cloud products undergo the removal of orbital artifacts by Variational Stationary Noise Remover (VSNR) and the removal of abnormal albedo areas to generate the final cloud climatology data. The new product was directly validated by ground-based cloud observations collected from 3777 global weather stations. PATMOS-X from the Advanced Very High Resolution Radiometer (AVHRR) and MOD/MYD35 served as comparison products for consistency check of GLHCC. The assessment results show that GLHCC demonstrated a strong correlation with ground station observations, MOD/MYD35, and PATMOS-X. When the ground observations were taken as the truth value, GLHCC and MOD/MYD35 displayed higher accuracy than PATMOS-X. In most selected interested areas where the three behave differently, GLHCC matched the facts better than MOD/MYD35 and PATMOS-X. The GLHCC can well represent the cloud distribution over the past 16 years and will play an important role in the fine-grained demands of many aspects of nature and human society. Full article
Show Figures

Graphical abstract

25 pages, 9187 KiB  
Article
Updates to and Performance of the cBathy Algorithm for Estimating Nearshore Bathymetry from Remote Sensing Imagery
by Rob Holman and Erwin W. J. Bergsma
Remote Sens. 2021, 13(19), 3996; https://doi.org/10.3390/rs13193996 - 06 Oct 2021
Cited by 14 | Viewed by 2337
Abstract
This manuscript describes and tests a set of improvements to the cBathy algorithm, published in 2013 by Holman et al. [hereafter HPH13], for the estimation of bathymetry based on optical observations of propagating nearshore waves. Three versions are considered, the original HPH13 algorithm [...] Read more.
This manuscript describes and tests a set of improvements to the cBathy algorithm, published in 2013 by Holman et al. [hereafter HPH13], for the estimation of bathymetry based on optical observations of propagating nearshore waves. Three versions are considered, the original HPH13 algorithm (now labeled V1.0), an intermediate version that has seen moderate use but limited testing (V1.2), and a substantially updated version (V2.0). Important improvements from V1.0 include a new deep-water weighting scheme, removal of a spurious variable in the nonlinear fitting, an adaptive scheme for determining the optimum tile size based on the approximate wavelength, and a much-improved search seed algorithm. While V1.2 was tested and results listed, the primary interest is in comparing V1.0, the original code, with the new version V2.0. The three versions were tested against an updated dataset of 39 ground-truth surveys collected from 2015 to 2019 at the Field Research Facility in Duck, NC. In all, 624 cBathy collections were processed spanning a four-day period up to and including each survey date. Both the unfiltered phase 2 and the Kalman-filtered phase 3 bathymetry estimates were tested. For the Kalman-filtered estimates, only the estimate from mid-afternoon on the survey date was used for statistical measures. Of those 39 Kalman products, the bias, rms error, and 95% exceedance for V1.0 were 0.15, 0.47, and 0.96 m, respectively, while for V2.0, they were 0.08, 0.38, and 0.78 m. The mean observed coverage, the percentage of successful estimate locations in the map, were 99.1% for V1.0 and 99.9% for V2.0. Phase 2 (unfiltered) bathymetry estimates were also compared to ground truth for the 624 available data runs. The mean bias, rms error, and 95% exceedance statistics for V1.0 were 0.19, 0.64, and 1.27 m, respectively, and for V2.0 were 0.16, 0.56, and 1.19 m, an improvement in all cases. The coverage also increased from 78.8% for V1.0 to 84.7% for V2.0, about a 27% reduction in the number of failed estimates. The largest errors were associated with both large waves and poor imaging conditions such as fog, rain, or darkness that greatly reduced the percentage of successful coverage. As a practical mitigation of large errors, data runs for which the significant wave height was greater than 1.2 m or the coverage was less than 50% were omitted from the analysis, reducing the number of runs from 624 to 563. For this reduced dataset, the bias, rms error, and 95% exceedance errors for V1.0 were 0.15, 0.58, and 1.16 m and for V2.0 were 0.09, 0.41, and 0.85 m, respectively. Successful coverage for V1.0 was 82.8%, while for V2.0, it was 90.0%, a roughly 42% reduction in the number of failed estimates. Performance for V2.0 individual (non-filtered) estimates is slightly better than the Kalman results in the original HPH13 paper, and it is recommended that version 2.0 becomes the new standard algorithm. Full article
(This article belongs to the Special Issue Advances in Remote Sensing in Coastal and Hydraulic Engineering)
Show Figures

Figure 1

18 pages, 3057 KiB  
Article
Multi-Agent Deep Reinforcement Learning for Online 3D Human Poses Estimation
by Zhen Fan, Xiu Li and Yipeng Li
Remote Sens. 2021, 13(19), 3995; https://doi.org/10.3390/rs13193995 - 06 Oct 2021
Cited by 2 | Viewed by 2349
Abstract
Most multi-view based human pose estimation techniques assume the cameras are fixed. While in dynamic scenes, the cameras should be able to move and seek the best views to avoid occlusions and extract 3D information of the target collaboratively. In this paper, we [...] Read more.
Most multi-view based human pose estimation techniques assume the cameras are fixed. While in dynamic scenes, the cameras should be able to move and seek the best views to avoid occlusions and extract 3D information of the target collaboratively. In this paper, we address the problem of online view selection for a fixed number of cameras to estimate multi-person 3D poses actively. The proposed method exploits a distributed multi-agent based deep reinforcement learning framework, where each camera is modeled as an agent, to optimize the action of all the cameras. An inter-agent communication protocol was developed to transfer the cameras’ relative positions between agents for better collaboration. Experiments on the Panoptic dataset show that our method outperforms other view selection methods by a large margin given an identical number of cameras. To the best of our knowledge, our method is the first to address online active multi-view 3D pose estimation with multi-agent reinforcement learning. Full article
Show Figures

Figure 1

31 pages, 119011 KiB  
Article
Paddy Rice Mapping in Thailand Using Time-Series Sentinel-1 Data and Deep Learning Model
by Lu Xu, Hong Zhang, Chao Wang, Sisi Wei, Bo Zhang, Fan Wu and Yixian Tang
Remote Sens. 2021, 13(19), 3994; https://doi.org/10.3390/rs13193994 - 06 Oct 2021
Cited by 27 | Viewed by 5259
Abstract
The elimination of hunger is the top concern for developing countries and is the key to maintain national stability and security. Paddy rice occupies an essential status in food supply, whose accurate monitoring is of great importance for human sustainable development. As one [...] Read more.
The elimination of hunger is the top concern for developing countries and is the key to maintain national stability and security. Paddy rice occupies an essential status in food supply, whose accurate monitoring is of great importance for human sustainable development. As one of the most important paddy rice production countries in the world, Thailand has a favorable hot and humid climate for paddy rice growing, but the growth patterns of paddy rice are too complicated to construct promising growth models for paddy rice discrimination. To solve this problem, this study proposes a large-scale paddy rice mapping scheme, which uses time-series Sentinel-1 data to generate a convincing annual paddy rice map of Thailand. The proposed method extracts temporal statistical features of the time-series SAR images to overcome the intra-class variability due to different management practices and modifies the U-Net model with the fully connected Conditional Random Field (CRF) to maintain the edge of the fields. In this study, 758 Sentinel-1 images that covered the whole country from the end of 2018 to 2019 were acquired to generate the annual paddy rice map. The accuracy, precision, and recall of the resultant paddy rice map reached 91%, 87%, and 95%, respectively. Compared to SVM classifier and the U-Net model based on feature selection strategy (FS-U-Net), the proposed scheme achieved the best overall performance, which demonstrated the capability of overcoming the complex cultivation conditions and accurately identifying the fragmented paddy rice fields in Thailand. This study provides a promising tool for large-scale paddy rice monitoring in tropical production regions and has great potential in the global sustainable development of food and environment management. Full article
(This article belongs to the Section Remote Sensing in Agriculture and Vegetation)
Show Figures

Graphical abstract

23 pages, 12620 KiB  
Article
Satellite Image Time Series Clustering via Time Adaptive Optimal Transport
by Zheng Zhang, Ping Tang, Weixiong Zhang and Liang Tang
Remote Sens. 2021, 13(19), 3993; https://doi.org/10.3390/rs13193993 - 06 Oct 2021
Cited by 2 | Viewed by 2666
Abstract
Satellite Image Time Series (SITS) have become more accessible in recent years and SITS analysis has attracted increasing research interest. Given that labeled SITS training samples are time and effort consuming to acquire, clustering or unsupervised analysis methods need to be developed. Similarity [...] Read more.
Satellite Image Time Series (SITS) have become more accessible in recent years and SITS analysis has attracted increasing research interest. Given that labeled SITS training samples are time and effort consuming to acquire, clustering or unsupervised analysis methods need to be developed. Similarity measure is critical for clustering, however, currently established methods represented by Dynamic Time Warping (DTW) still exhibit several issues when coping with SITS, such as pathological alignment, sensitivity to spike noise, and limitation on capacity. In this paper, we introduce a new time series similarity measure method named time adaptive optimal transport (TAOT) to the application of SITS clustering. TAOT inherits several promising properties of optimal transport for the comparing of time series. Statistical and visual results on two real SITS datasets with two different settings demonstrate that TAOT can effectively alleviate the issues of DTW and further improve the clustering accuracy. Thus, TAOT can serve as a usable tool to explore the potential of precious SITS data. Full article
Show Figures

Graphical abstract

22 pages, 2983 KiB  
Article
Contribution of Biophysical Factors to Regional Variations of Evapotranspiration and Seasonal Cooling Effects in Paddy Rice in South Korea
by Wei Xue, Seungtaek Jeong, Jonghan Ko and Jong-Min Yeom
Remote Sens. 2021, 13(19), 3992; https://doi.org/10.3390/rs13193992 - 06 Oct 2021
Cited by 6 | Viewed by 1922
Abstract
Previous studies have observed seasonal cooling effects in paddy rice as compared to temperate forest through enhanced evapotranspiration (ET) in Northeast Asia, while rare studies have revealed biophysical factors responsible for spatial variations of ET and its cooling effects. In this [...] Read more.
Previous studies have observed seasonal cooling effects in paddy rice as compared to temperate forest through enhanced evapotranspiration (ET) in Northeast Asia, while rare studies have revealed biophysical factors responsible for spatial variations of ET and its cooling effects. In this study, we adopted a data fusion method that integrated MODIS 8-day surface reflectance products, gridded daily climate data of ground surface, and a remote sensing pixel-based Penman-Monteith ET model (i.e., the RS–PM model) to quantify ET patterns of paddy rice in South Korea from 2011 to 2014. Results indicated that the regional variations of the rice-growing season ET (RGS-ET, the sum of daily ET from the season onset of rapid canopy expansion (SoS) to the end of the rice-growing season (EGS)) were primarily influenced by phenological factors (i.e., the length of growing period-LGP), followed by growing season mean climatic factors (i.e., vapor pressure deficit-VPD, and air temperature). For regional variations of the paddy field ET (PF-ET, the sum of daily ET from the field flooding and transplanting date detected by satellite observations (FFTDsat) to SoS, and to EGS), the extents were substantially reduced, only accounting for 54% of the RGS-ET variations. The FFTDsat and SoS were considered critical for the reduced PF-ET variations. In comparison to the temperate forest, changes in monthly ground surface air temperature (Ts) in paddy fields showed the V-shaped seasonal pattern with significant cooling effects found in late spring and early summer, primarily due to a large decline in daytime Ts that exceeded the nighttime warming. Bringing FFTDsat towards late spring and early summer was identified as vital field management practices, causing significant declines in daytime Ts due to enhanced ET. Results highlighted climate-warming mitigation by paddy fields due to early flooding practices. Full article
Show Figures

Graphical abstract

22 pages, 3965 KiB  
Article
Incorporating Multi-Scale, Spectrally Detected Nitrogen Concentrations into Assessing Nitrogen Use Efficiency for Winter Wheat Breeding Populations
by Raquel Peron-Danaher, Blake Russell, Lorenzo Cotrozzi, Mohsen Mohammadi and John J. Couture
Remote Sens. 2021, 13(19), 3991; https://doi.org/10.3390/rs13193991 - 06 Oct 2021
Cited by 5 | Viewed by 2039
Abstract
Annually, over 100 million tons of nitrogen fertilizer are applied in wheat fields to ensure maximum productivity. This amount is often more than needed for optimal yield and can potentially have negative economic and environmental consequences. Monitoring crop nitrogen levels can inform managers [...] Read more.
Annually, over 100 million tons of nitrogen fertilizer are applied in wheat fields to ensure maximum productivity. This amount is often more than needed for optimal yield and can potentially have negative economic and environmental consequences. Monitoring crop nitrogen levels can inform managers of input requirements and potentially avoid excessive fertilization. Standard methods assessing plant nitrogen content, however, are time-consuming, destructive, and expensive. Therefore, the development of approaches estimating leaf nitrogen content in vivo and in situ could benefit fertilization management programs as well as breeding programs for nitrogen use efficiency (NUE). This study examined the ability of hyperspectral data to estimate leaf nitrogen concentrations and nitrogen uptake efficiency (NUpE) at the leaf and canopy levels in multiple winter wheat lines across two seasons. We collected spectral profiles of wheat foliage and canopies using full-range (350–2500 nm) spectroradiometers in combination with leaf tissue collection for standard analytical determination of nitrogen. We then applied partial least-squares regression, using spectral and reference nitrogen measurements, to build predictive models of leaf and canopy nitrogen concentrations. External validation of data from a multi-year model demonstrated effective nitrogen estimation at leaf and canopy level (R2 = 0.72, 0.67; root-mean-square error (RMSE) = 0.42, 0.46; normalized RMSE = 12, 13; bias = −0.06, 0.04, respectively). While NUpE was not directly well predicted using spectral data, NUpE values calculated from predicted leaf and canopy nitrogen levels were well correlated with NUpE determined using traditional methods, suggesting the potential of the approach in possibly replacing standard determination of plant nitrogen in assessing NUE. The results of our research reinforce the ability of hyperspectral data for the retrieval of nitrogen status and expand the utility of hyperspectral data in winter wheat lines to the application of nitrogen management practices and breeding programs. Full article
(This article belongs to the Special Issue Proximal and Remote Sensing for Precision Crop Management)
Show Figures

Figure 1

Previous Issue
Back to TopTop