
Status and Trends of Wetland Studies in Canada Using Remote Sensing Technology with a Focus on Wetland Classification: A Bibliographic Analysis

 ,
,  ,
,  ,
,  ,
,  ,
,  ,
,  and
and 
Abstract
:
1. Introduction
2. Wetland Classification Systems in Canada
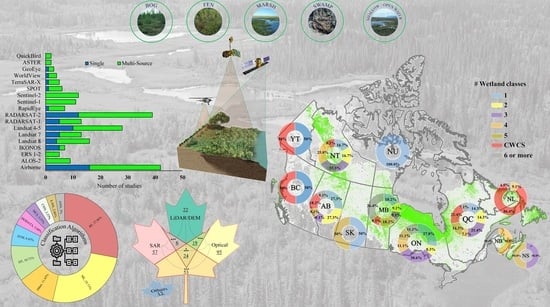
3. Method of Meta-Analysis
4. Results and Discussion
4.1. Publication Details
4.1.1. Number of Annual Publications
4.1.2. Keyword Analysis
4.1.3. Journal and Conference Analyses
4.1.4. First and Co-Authors Analysis
4.1.5. Affiliation Analysis
4.1.6. Citation Analysis
4.1.7. Number of Wetland Classes
4.1.8. Province- and Territories-Based Analysis
4.1.9. Geographical Distribution Based on Provinces/Territories
4.1.10. Geographical Distribution Based on the Extent of the Study Area
4.2. Classification Methods
4.3. RS Data Used in Wetland Studies of Canada
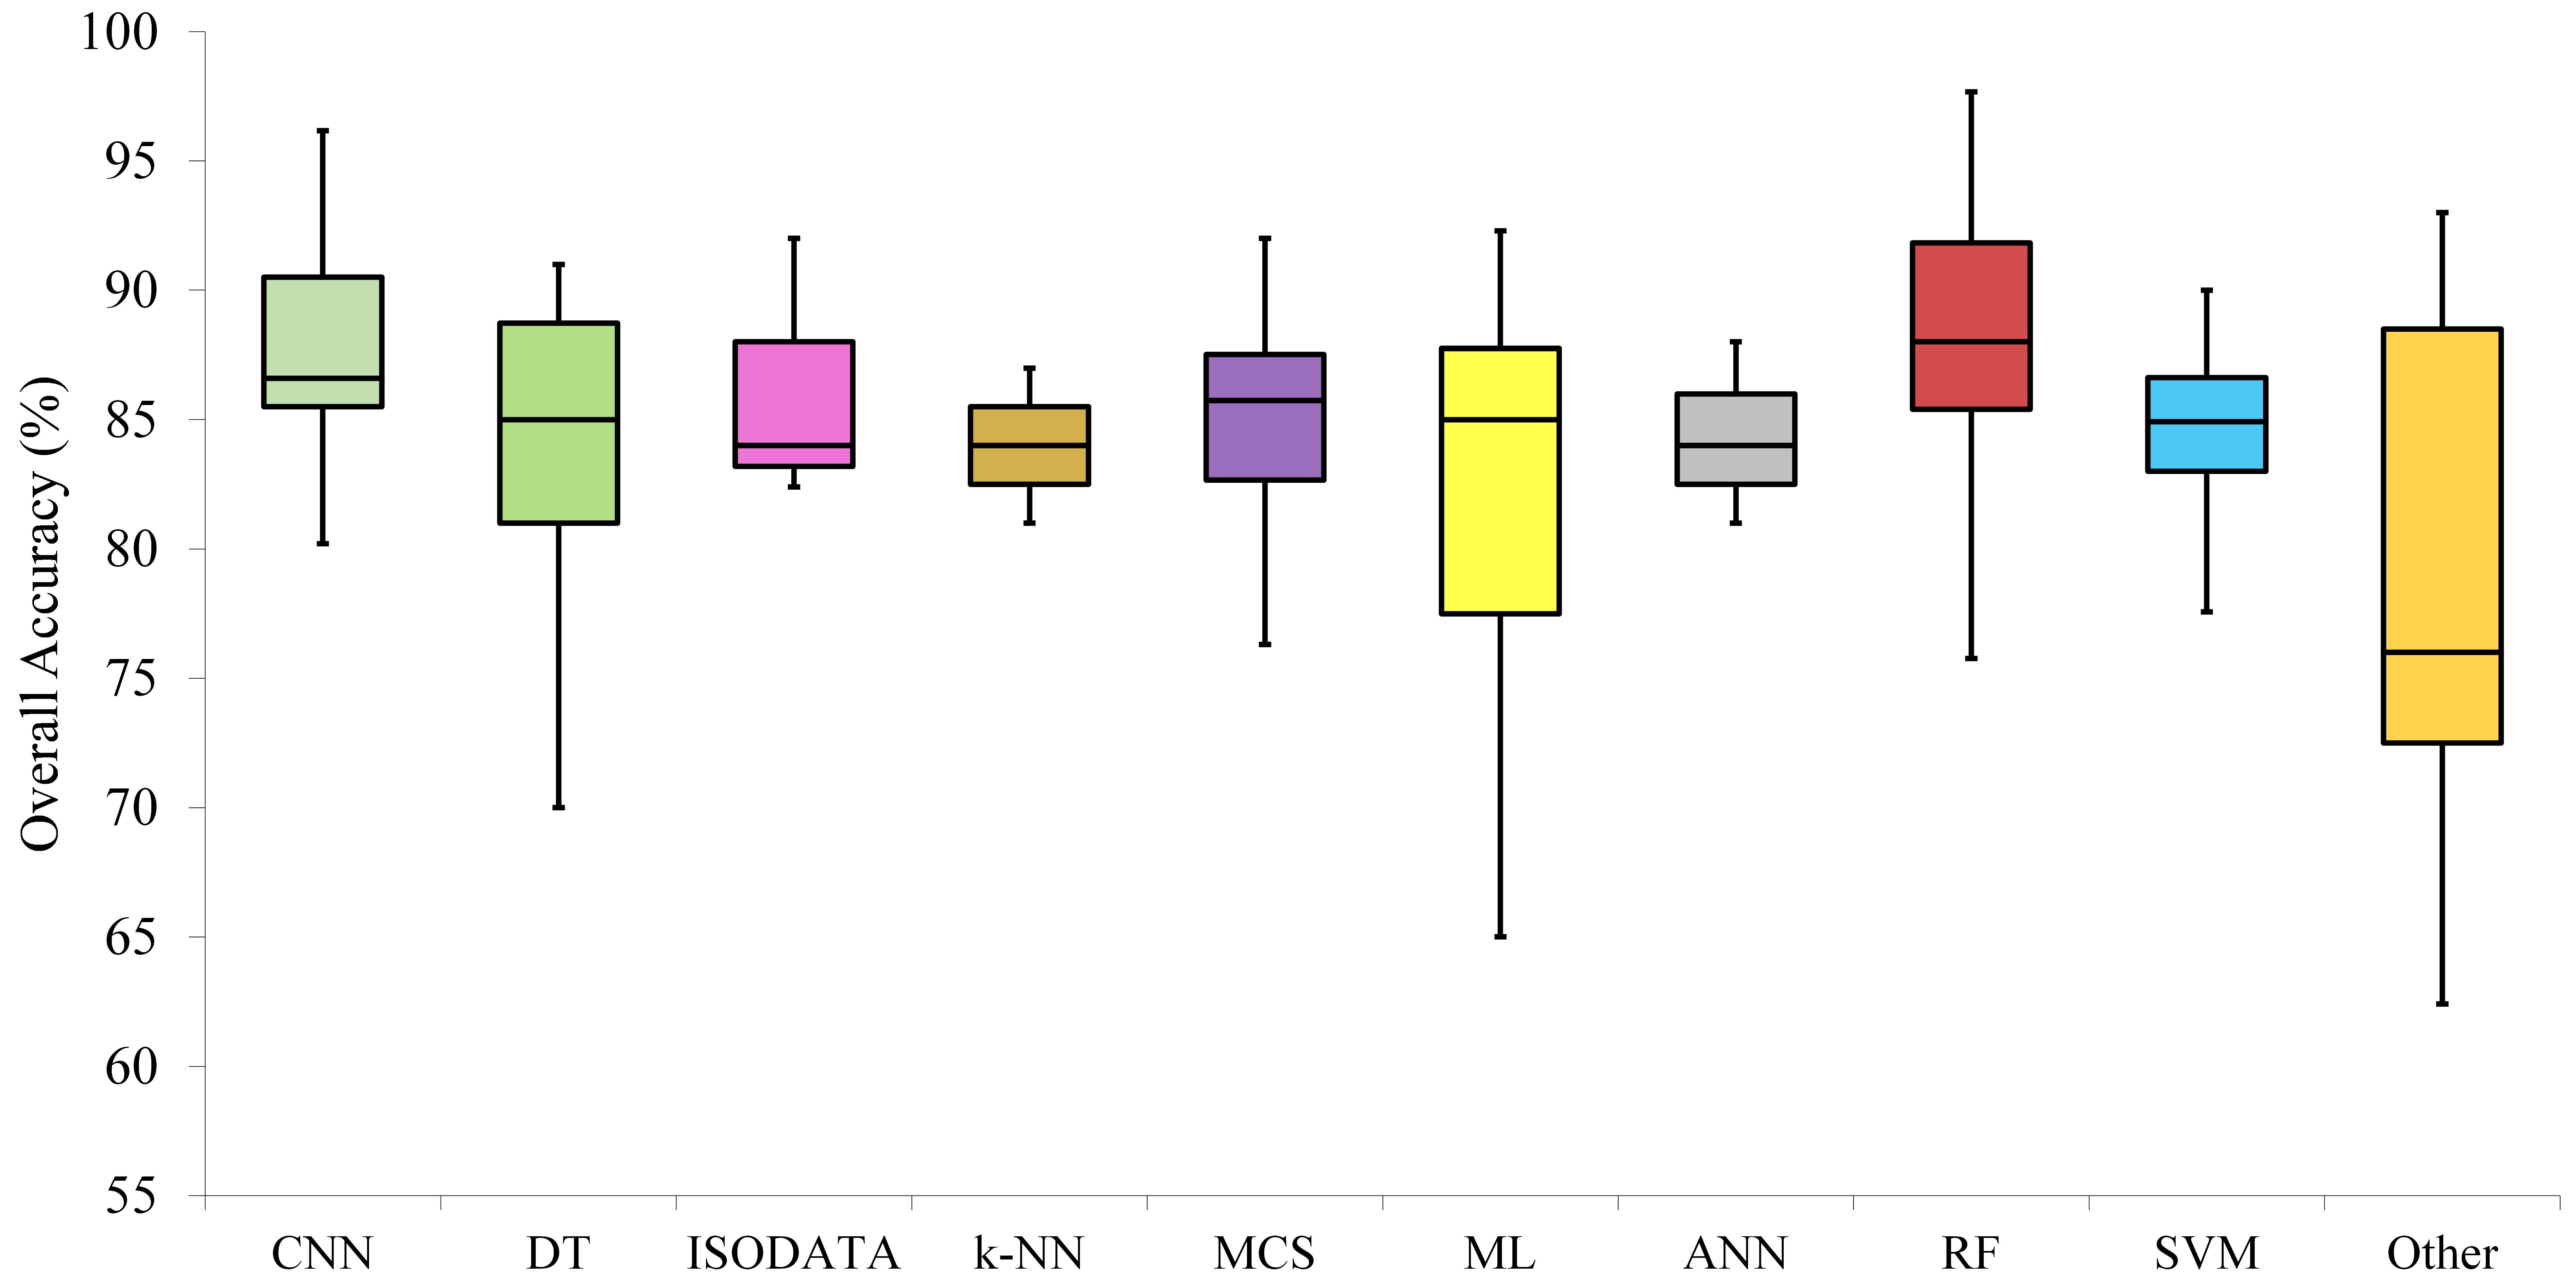
4.4. Level of Classification Accuracy
5. Conclusions
- RS datasets have been increasingly used in the last four years, especially in NL. However, the largest number of studies has been conducted in ON over the past 40 years.
- Around half of the research studies have been implemented over the three provinces of ON, NL, and QC, indicating the requirement for more efforts of wetlands mapping in other Canadian provinces to have a highly accurate and consistent country-wide wetland inventory.
- A total of 40% of the studies have been conducted over regional scales, and only five research papers have been published on a country scale. Although small-scale analysis can result in a classification with relatively higher accuracy, country-based classification can provide valuable details on the status and extent of wetlands for national and local administrative decision-makers.
- Novel deep learning methods and MCSs achieved more accurate maps in comparison to traditional techniques. RF, CNN, and MCS techniques provided the highest median overall accuracies.
- Pixel-based and supervised classification methods were the most popular techniques to map wetlands in Canada due to the simplicity and higher accuracies of these strategies compared to the object-based and unsupervised approaches, respectively. However, the median accuracy of object-based methods was more than pixel-based techniques and, therefore, they have been more frequently used in recent studies.
- Optical imagery and the combinations of optical and SAR datasets have been the most commonly used RS datasets to map wetlands in Canada. Availability, fulfilled archive, the high capability, and cost-effectiveness of optical and SAR imageries have attracted numerous focuses to utilize them. LiDAR/DEM data also resulted in the highest classification accuracies over small regions.
- Most (but not all) of the reviewed studies did not present the full confusion matrix and only reported the overall accuracy to evaluate the results which were easily affected by the stratification of samples between dry and wet classes. Additionally, accuracy statistics often depend on the different factors, such as the geographic extent of the study area, type of RS data, the degrees of wetland species, the quality of training and tests samples, and classification algorithm and its tuning parameter settings. Therefore, it would be required to increase the number of wetland studies that try to actually quantify wetland classification errors in different aspects.
- Approximately 30% of the studies considered the five CWCS wetland classes, and around 54% provides wetland maps using a lower number of classes.
- Frequencies of “SAR” and “RADARSAT (1/2)” displayed the importance of SAR data for wetland mapping in Canada because of the capability of SAR data to acquire images in any weather conditions considering the dominant cloudy and snowy climate of Canada.
Author Contributions
Funding
Data Availability Statement
Acknowledgments
Conflicts of Interest
Appendix A

| Classifier | Description | Type |
|---|---|---|
| ISODATA | It is a modified version of k-means clustering in which k is allowed to range over an interval. It includes the merging and splitting of clusters during the iterative process. | Unsupervised |
| ML | It is a parametric algorithm based on Bayesian theory, assuming data of each class follow the normal distribution. Accordingly, a pixel with the maximum probability is assigned to the corresponding class. | Supervised/Unsupervised |
| k-NN | It is a non-parametric algorithm that classifies a pixel by a variety vote of its neighbors, with the pixel being allocated to the class most common among its k nearest neighbors. | Supervised |
| SVM | It is a type of non-parametric algorithm that defines a hyperplane/set of hyperplanes in feature spaces used for maximizing the distance between training samples of classes space and classify other pixels. | Supervised |
| DT | It is a non-parametric algorithm belonging to the category of classification and regression trees (CART). It employs a tree structure model of decisions for assigning a label to each pixel. | Supervised |
| RF | It is an improved version of DT, which includes an ensemble of decision trees, in which each tree is formed by a subset of training samples with replacements. | Supervised |
| ANN | It is a multi-stage classifier that typically includes the neurons arranged in the input, hidden, and output layers. It is able to learn a non-linear/linear function approximator for the classification scheme. | Supervised |
| CNN | It is a class of multilayered neural networks/deep neural networks, with a remarkable architecture to detect and classify complex features in an image. | Supervised |
| MCS | It advantages from performances of dissimilar classifiers on a specific LULC to achieve accurate classification of the image. | Supervised |
| No. | First Author | Year | Region | Classification Method | Data |
|---|---|---|---|---|---|
| 1 | Jeglum J. K. et al. [124] | 1975 | ON | − | Aerial |
| 2 | Boissonneau A. N. et al. [125] | 1976 | ON | PB */Supervised/Other | Optical + Aerial |
| 3 | Wedler E. et al. [126] | 1981 | ON | − | Radar |
| 4 | Hughes F. M. et al. [127] | 1981 | AB | − | − |
| 5 | Neraasen T. G. et al. [128] | 1981 | Canada | − | Optical |
| 6 | Watson E. K. et al. [129] | 1981 | BC | − | Aerial |
| 7 | Tomlins G. F. et al. [130] | 1981 | BC | − | − |
| 8 | Pala S. et al. [131] | 1982 | ON | − | Aerial |
| 9 | Lafrance P. et al. [132] | 1987 | QC | − | Optical |
| 10 | Lafrance P. et al. [133] | 1988 | QC | − | Optical |
| 11 | Peddle D. R. et al. [134] | 1989 | Canada | PB/Supervised/ML | Optical |
| 12 | Kneppeck I.D. et al. [135] | 1989 | AB | − | − |
| 13 | Drieman J. A. et al. [136] | 1989 | ON | − | Radar |
| 14 | Konrad S. R. et al. [137] | 1990 | Canada | PB/Unsupervised/ML | Optical + Aerial |
| 15 | Franklin S. E. et al. [138] | 1990 | NL | − | Optical |
| 16 | Matthews S. B. et al. [139] | 1991 | NT | − | Optical |
| 17 | McNairn H. E. et al. [23] | 1993 | ON | PB/Supervised/ML | Aerial |
| 18 | Franklin S. E. et al. [140] | 1994 | NL | − | Aerial + Optical |
| 19 | Cihlar J. et al. [141] | 1994 | MB | − | Optical |
| 20 | Franklin S. E. et al. [142] | 1994 | NL | − | Aerial |
| 21 | Yatabe S. M. et al. [50] | 1995 | ON | PB/Supervised/ML | Radar + Optical |
| 22 | Strong L. L. [12] | 1995 | SK | − | Other = Aerial Video |
| 23 | Bubier J. L. [143] | 1995 | MB | − | Optical |
| 24 | Pietroniro A. et al. [144] | 1996 | NT | PB/Supervised + Unsupervised/Other | Optical + Aerial |
| 25 | Hall F. G. et al. [145] | 1996 | Canada | − | Optical + Radar + Aerial |
| 26 | Halsey L. [22] | 1997 | MB | − | Aerial |
| 27 | Steyaert L. T. [93] | 1997 | MB, SK | PB/Unsupervised/ML + Other = ISOCLASS | Optical + Aerial |
| 28 | Hall F. G. et al. [106] | 1997 | SK | PB/Supervised/KNN | Optical |
| 29 | Franklin S. E. et al. [146] | 1997 | NL | − | Aerial |
| 30 | Collins N. et al. [147] | 1997 | NS | − | Aerial |
| 31 | Wang J. et al. [25] | 1998 | ON | PB/Supervised/ML | Optical + Radar + Aerial |
| 32 | Pietroniro A. et al. [148] | 1999 | AB | − | Optical + LiDAR/DEM |
| 33 | Ghedira H. et al. [30] | 2000 | QC | PB/Supervised/DL = NN | Radar |
| 34 | McLaren B. E. et al. [71] | 2001 | NL | PB/Supervised/Other | Radar + Optical + Aerial |
| 35 | Baghdadi N. et al. [101] | 2001 | ON | PB/Supervised/DT | Radar |
| 36 | Rapalee G. et al. [149] | 2001 | Canada | PB/Supervised/Other | Optical + Aerial + LiDAR/DEM |
| 37 | Murphy M. A. [29] | 2001 | ON | PB/Supervised/ISODATA + Other | Radar |
| 38 | Pietroniro A. et al. [150] | 2001 | AB | − | Optical + Radar |
| 39 | Hall-Atkinson C et al. [151] | 2001 | NT | − | Radar + Optical + Aerial |
| 40 | Sokol J. et al. [152] | 2001 | NL | − | Radar |
| 41 | Dechka J. A. et al. [111] | 2002 | SK | PB/Supervised + Unsupervised/ISODATA + Other | Optical + Aerial |
| 42 | Gadallah F.L et al. [105] | 2002 | MB | PB/Supervised/ISODATA | Optical + Radar + Aerial |
| 43 | Arzandeh S. et al. [97] | 2002 | ON | PB/Supervised/ML | Optical + Radar + Aerial |
| 44 | Deslandes S. et al. [100] | 2002 | QC | PB/Supervised/DT | Optical + Radar + Aerial |
| 45 | Jollineau M. et al. [153] | 2002 | ON | PB/Supervised + Unsupervised/ML + K-Means | Optical |
| 46 | Töyrä J. et al. [154] | 2002 | Canada | − | Optical + Radar |
| 47 | Pietroniro A. et al. [155] | 2002 | AB | − | Optical + RADAR + LiDAR |
| 48 | Poulin M. et al. [156] | 2002 | QC | − | Optical + Aerial |
| 49 | Quinton W. L. et al. [157] | 2003 | NT | PB/Supervised/ML | Optical + Aerial |
| 50 | Bernier M. et al. [158] | 2003 | QC | PB/Supervised/ML + DL = NN | Radar |
| 51 | Thomas V. et al. [118] | 2003 | MB | PB/Supervised/ML | Other |
| 52 | Jobin B. et al. [51] | 2003 | QC | PB/Supervised/ML | Optical + Aerial |
| 53 | Arzandeh S. et al. [159] | 2003 | ON | PB/Supervised/ML | Optical + Radar + Aerial |
| 54 | Havholm K. G. et al. [160] | 2003 | MB | − | Other |
| 55 | Wessels J. et al. [161] | 2003 | Canada | − | Optical + Radar |
| 56 | Bernier M. et al. [110] | 2003 | QC | − | Radar |
| 57 | Racine M. J. et al. [162] | 2004 | QC | PB/Supervised/ML | Radar |
| 58 | Rosenqvist A. et al. [163] | 2004 | Canada | − | Radar |
| 59 | Sokol J. et al. [164] | 2004 | Canada | − | Radar |
| 60 | Li J. et al. [33] | 2005 | Canada | PB/Supervised/Other | Optical + Radar + LiDAR |
| 61 | Tedford B. et al. [165] | 2005 | SK | − | Optical + Radar |
| 62 | Grenier M. et al. [166] | 2005 | QC | − | Optical + Radar |
| 63 | Cheng W. F. et al. [167] | 2005 | NL | − | - |
| 64 | Ju W. et al. [168] | 2005 | Canada | − | LiDAR/DEM |
| 65 | Hudon C. et al. [169] | 2005 | QC | − | Optical + Aerial |
| 66 | Niemann K.O. [170] | 2005 | Canada | − | Optical + Radar |
| 67 | Smith K. B. et al. [171] | 2005 | Canada | − | Optical + Radar |
| 68 | Li J. et al. [172] | 2005 | ON | − | Radar |
| 69 | Töyrä J. et al. [173] | 2005 | AB | − | Optical + Radar + LiDAR/DEM + Aerial |
| 70 | Mialon A. et al. [174] | 2005 | Canada | − | Optical +Radar |
| 71 | Brown L. et al. [175] | 2006 | NU | − | Optical + Radar + Aerial |
| 72 | Prowse T. D. et al. [176] | 2006 | AB, BC, SK | − | Optical + Radar + Aerial |
| 73 | Peters D. L. et al. [177] | 2006 | AB, NT | − | LiDAR/DEM |
| 74 | Dillabaugh K. et al. [178] | 2006 | ON | − | Optical |
| 75 | Grenier M. et al. [3] | 2007 | QC | OB */Supervised/Other | Optical + Radar |
| 76 | Hogg A. R. et al. [35] | 2007 | ON | PB/Supervised/CART | LiDAR/DEM |
| 77 | Li J. et al. [179] | 2007 | ON | PB/Supervised/ML | Optical + Radar |
| 78 | Stevens C. E. et al. [180] | 2007 | AB | − | LiDAR/DEM |
| 79 | Smith C. et al. [80] | 2007 | Canada | − | - |
| 80 | Touzi R. et al. [88] | 2007 | ON | − | Radar |
| 81 | Fournier R. A. et al. [181] | 2007 | Canada | − | Optical + Radar + LiDAR +Aerial |
| 82 | Touzi R. et al. [182] | 2007 | ON | − | Radar |
| 83 | Gillanders S. N. et al. [104] | 2008 | AB | PB/Supervised/ISODATA | Optical |
| 84 | Jollineau M. et al. [154] | 2008 | ON | PB/Supervised/ML + Other | Optical |
| 85 | Jollineau M. Y. et al. [32] | 2008 | ON | PB/Supervised/ML + Other | Optical |
| 86 | Grenier M. et al. [3] | 2008 | QC | OB/Supervised/Other | Optical + Radar |
| 87 | Dillabaugh K. A. et al. [109] | 2008 | ON | PB/Supervised/ML + DL = NN | Optical |
| 88 | Hogg A. R. et al. [183] | 2008 | ON | − | Aerial + LiDAR/DEM |
| 89 | Sass G. Z. et al. [184] | 2008 | AB | − | Radar |
| 90 | Liu Y. et al. [185] | 2008 | ON | − | LiDAR/DEM |
| 91 | Creed I. F. et al. [186] | 2008 | AB | − | Radar |
| 92 | Touzi R. et al. [187] | 2008 | ON | − | Radar |
| 93 | Kaheil Y. H. et al. [49] | 2009 | AB | PB/Supervised/SVM + Other | Radar + Optical + LiDAR + LiDAR/DEM |
| 94 | Richardson M. C. et al. [36] | 2009 | ON | PB/Supervised/CART | LiDAR/DEM |
| 95 | Dissanska M. et al. [108] | 2009 | QC | OB/Supervised/DL = NN + Other | Optical + Aerial + DEM |
| 96 | Harris A. et al. [188] | 2009 | ON | − | Aerial + Optical + Radar |
| 97 | Rosa E. et al. [189] | 2009 | QC | − | Radar |
| 98 | Raynolds M. K. et al. [190] | 2009 | NT | − | Optical + Other |
| 99 | Pirie L. D. et al. [191] | 2009 | NT | − | Optical |
| 100 | Spooner I. et al. [192] | 2009 | NS | − | Other |
| 101 | Clark R. B. et al. [193] | 2009 | AB | − | Radar |
| 102 | Fang X. et al. [194] | 2009 | SK | − | Aerial + LiDAR/DEM |
| 103 | Touzi R. et al. [195] | 2009 | ON | − | Radar |
| 104 | Touzi R. et al. [196] | 2009 | ON | − | Radar |
| 105 | Collin A. et al. [37] | 2010 | QC | PB/Supervised/ML | LiDAR |
| 106 | Andrea J. M. et al. [197] | 2010 | ON | − | Optical |
| 107 | Soverel N.O. et al. [198] | 2010 | Canada | − | Optical |
| 108 | Levrel G. et al. [199] | 2010 | QC | − | Radar |
| 109 | Sannel A. B. K. et al. [200] | 2010 | Canada | − | Optical + Aerial |
| 110 | Neta T. et al. T. [201] | 2010 | MB, ON | − | Optical |
| 111 | Midwood J. D. et al. [202] | 2010 | ON | − | Optical |
| 112 | Touzi R. et l. [203] | 2010 | QC | − | Radar |
| 113 | Fang X. et al. [204] | 2010 | SK | − | Optical + Lidar/DEM |
| 114 | Brisco B. et al. [205] | 2011 | MB | PB/Supervised/ML + Other | Radar + LiDAR/DEM |
| 115 | Crowell N. et al. [206] | 2011 | NS | − | LiDAR/DEM |
| 116 | Quinton W. L. et al. [207] | 2011 | NT | PB/Supervised/Other | Optical + Aerial + LiDAR/DEM |
| 117 | Rokitnicki-Wojcik D. et al. [208] | 2011 | ON | OB/Supervised/Other + DT | Optical |
| 118 | Muskett R. R. et al. [209] | 2011 | YT | − | Optical + Other |
| 119 | Chen B. et al. [210] | 2011 | Canada | − | Optical |
| 120 | Neta T. et al. [211] | 2011 | ON, MB | − | Optical + Aerial |
| 121 | Hogan D. et al. [212] | 2011 | AB, BC, YT | − | Optical + Aerial |
| 122 | Shook K. R. et al. [213] | 2011 | SK | − | LiDAR/DEM |
| 123 | Watchorn K. E. et al. [92] | 2012 | MB, ON | − | |
| 124 | Fraser S. et al. [214] | 2012 | MB | − | Optical + Other |
| 125 | Guo X. et al. [215] | 2012 | SK | PB + OB/Supervised/ML + KNN | Radar |
| 126 | Allard M. et al. [11] | 2012 | QC | OB/Supervised/Multiple classifier | Optical |
| 127 | Dribault Y. et al. [19] | 2012 | QC | OB/Supervised/Other | Optical + Aerial |
| 128 | Barker R. et al. [216] | 2012 | QC | − | Aerial |
| 129 | Kaya S. et al. [217] | 2012 | Canada | − | Radar |
| 130 | Pivot F. C [218] | 2012 | MB | − | Radar |
| 131 | Midwood J. D. et al. [219] | 2012 | ON | − | Optical |
| 132 | Gala T. S. et al. [220] | 2012 | SK | − | Optical + Radar + LiDAR/DEM |
| 133 | Brisco B. et al. [48] | 2013 | MB | PB/Supervised/SVM + ML | Radar + Aerial |
| 134 | Chen W. et al. [221] | 2013 | MB | PB/Supervised/Other | Optical + Radar + LiDAR/DEM |
| 135 | Lantz N. J. et al. [63] | 2013 | ON | OB + PB/Supervised/NN + ML | Optical |
| 136 | Millard K. et al. [42] | 2013 | ON | PB/Supervised/RF | Radar + LiDAR |
| 137 | Kokelj, S. V. et al. [87] | 2013 | YT, NT | − | LiDAR |
| 138 | Doiron M. et al. [222] | 2013 | NU | − | Optical |
| 139 | McClymont A. F et al. [223] | 2013 | NT | − | Other |
| 140 | Lapointe J. et al. [224] | 2013 | QC | − | Other |
| 141 | Huschle G. et al. [225] | 2013 | SK, MB, ON | − | Other |
| 142 | Mattar K. E. [226] | 2013 | ON | − | Radar |
| 143 | Jacome A. et al. [227] | 2013 | QC | − | Radar |
| 144 | Chasmer L. et al. [102] | 2014 | NT | PB/Supervised/DT + Other | Optical + LiDAR/DEM |
| 145 | Banks S. N. et al. [228] | 2014 | NT | PB/Supervised + Unsupervised/ML | Optical + Radar + UAV |
| 146 | Banks S. N. et al. [229] | 2014 | NT | PB/Supervised + Unsupervised/Other | Radar + UAV |
| 147 | Touzi R. et al. [115] | 2014 | AB | PB/Supervised/Other | Radar |
| 148 | Pastick N. J. et al. [99] | 2014 | YT | PB/Supervised/DT | Optical |
| 149 | Sutherland G. et al. [38] | 2014 | AB | PB/Supervised/DT | LiDAR + LiDAR/DEM |
| 150 | Ullmann T. et al. [52] | 2014 | NT | PB/Supervised + Unsupervised/ML | Optical + Radar |
| 151 | Dech J. P. et al. [95] | 2014 | ON | − | LiDAR/DEM |
| 152 | Gosselin G. et al. [116] | 2014 | QC | OB/Supervised/ML + Other | Optical + Radar |
| 153 | Ahern F. J. et al. [230] | 2014 | ON | PB/Supervised/Other | Radar |
| 154 | Armenakis C. et al. [231] | 2014 | BC, NS | − | - |
| 155 | Connon R. F. et al. [89] | 2014 | NT | − | Optical + Aerial |
| 156 | Ely C. R. et al. [232] | 2014 | Canada | − | Radar |
| 157 | Chabot D. et al. [233] | 2014 | QC | − | UAS |
| 158 | Cable J. W. et al. [234] | 2014 | ON | − | Radar |
| 159 | Nelson T. A. et al. [235] | 2014 | Canada | − | Optical |
| 160 | Clare S. et al. [236] | 2014 | AB | − | - |
| 161 | Mui A. et al. [107] | 2015 | Canada | OB/Supervised/KNN | Optical + LiDAR/DEM |
| 162 | Dabboor M. et al. [16] | 2015 | MB | PB/Unsupervised/Other | Radar |
| 163 | Bourgeau-Chavez L. et al. [237] | 2015 | ON | PB + OB/Supervised/ML + Other | Optical + Radar + Aerial |
| 164 | Sizo A. et al. [114] | 2015 | SK | PB/Unsupervised/Other | Optical |
| 165 | Umbanhowar Jr C. E et al. [238] | 2015 | MB | PB/Unsupervised/ISODATA | Optical + Aerial + LiDAR/DEM |
| 166 | Sagin J. et al. [239] | 2015 | SK | − | Optical |
| 167 | Dingle R. L. et al. [240] | 2015 | ON | − | Optical |
| 168 | Kalacska M. et al. [241] | 2015 | ON | PB/Supervised/Other | Other |
| 169 | Kotchi S. O. et al. [242] | 2015 | QC | − | Optical + Radar |
| 170 | Tougas-Tellier M. A. et al. [243] | 2015 | QC | − | Optical + Aerial |
| 171 | Messmer D. J. et al. [244] | 2015 | ON | − | Optical + UAV + Aerial |
| 172 | Brisco B. et al. [245] | 2015 | ON | − | Radar |
| 173 | Muster S. et al. [246] | 2015 | NU | − | Optical |
| 174 | Jiao X. et al. [247] | 2015 | AB | − | Radar |
| 175 | Li-Chee-Ming J. et al. [248] | 2015 | AB | − | Radar + UAV |
| 176 | Thompson S. D. et al. [249] | 2016 | BC | PB/Unsupervised/Other | Optical + LiDAR + Aerial |
| 177 | Braverman M. et al. [34] | 2016 | NT | - | LiDAR/DED |
| 178 | Marcaccio J. V.et al. [250] | 2016 | ON | OB/Supervised/ML + Other | Optical + Radar + Aerial + UAV |
| 179 | Ou C. et al. [56] | 2016 | ON | PB/Supervised/RF | Optical + Radar + LiDAR/DEM |
| 180 | Lara M. J. et al. [98] | 2016 | NT | PB/Supervised/ML | Optical + Radar + Aerial |
| 181 | Mohammadimanesh F. et al. [112] | 2016 | NL | PB/Supervised/Other | Radar |
| 182 | Chasmer L. et al. [251] | 2016 | AB | − | LiDAR + Aerial |
| 183 | Spence C. et al. [252] | 2016 | SK | − | Optical + UAV + LiDAR/DEM |
| 184 | Shinneman A. L. C. et al. [253] | 2016 | MB | − | Optical |
| 185 | Finger T. A. et al. [254] | 2016 | ON | − | Other |
| 186 | Miller S. M. et al. [255] | 2016 | Canada | − | Optical + Aerial |
| 187 | Kross A. et al. [256] | 2016 | ON, AB | − | Optical |
| 188 | Shodimu O. et al. [257] | 2016 | NB | − | Optical |
| 189 | Schmitt A. et al. [258] | 2016 | Canada | − | Radar |
| 190 | Emmerton C. A. et al. [259] | 2016 | NU | − | Optical |
| 191 | Serran J. N. et al. [260] | 2016 | AB | − | Aerial + LiDAR/DEM |
| 192 | Bolanos S. et al. [261] | 2016 | AB, SK | − | Optical + Radar |
| 193 | Morsy S. et al. [262] | 2016 | ON | − | LiDAR |
| 194 | van der Kamp G. et al. [263] | 2016 | Canada | − | - |
| 195 | Sizo A. et al. [264] | 2016 | SK | − | Optical |
| 196 | Ullmann T. et al. [265] | 2016 | NT | − | Radar |
| 197 | Mahdianpari M. et al. [43] | 2017 | NL | OB/Supervised/RF | Radar |
| 198 | Banks S. et al. [58] | 2017 | NU | PB/Supervised/RF | Radar + Optical + LiDAR/DEM + UAV |
| 199 | Merchant M.A. et al. [47] | 2017 | NT | PB/Supervised/SVM | Radar |
| 200 | Amani M. et al. [266] | 2017 | NL | OB/Supervised/RF | Optical |
| 201 | Hird J. N. et al. [40] | 2017 | AB | PB/Supervised/ML | Optical + Radar + Aerial + LiDAR/DEM |
| 202 | Chen Z. et al. [57] | 2017 | NT | PB + OB/Supervised/RF + ML | Optical |
| 203 | Bourgeau-Chavez L. L. et al. [55] | 2017 | AB | PB + OB/Supervised/RF | Optical + Radar |
| 204 | White L. et al. [60] | 2017 | ON | PB/Supervised/RF | Optical + Radar + LiDAR/DEM |
| 205 | Mahdavi S. et al. [72] | 2017 | NL | PB + OB/Supervised/RF | Optical + Radar + Aerial |
| 206 | Franklin S. E. et al. [61] | 2017 | ON | OB/Supervised/RF | Optical + Radar + Aerial + LiDAR/DEM |
| 207 | Mahdianpari M. et al. [44] | 2017 | NL | OB/Supervised/RF + Other | Optical + Radar |
| 208 | Amani M. et al. [39] | 2017 | NL | OB/Supervised/RF | Optical + Radar |
| 209 | Mahdianpari M. et al. [267] | 2017 | NL | PB/Supervised/RF | Radar + Aerial |
| 210 | Amani M. et al. [7] | 2017 | NL | OB/Supervised/RF | Optical + Radar + Aerial |
| 211 | Amani M. et al. [73] | 2017 | NL | PB + OB/Supervised/KNN + ML + SVM + CART + RF | Optical + Aerial |
| 212 | Lovitt J. et al. [268] | 2017 | AB | − | UAV + LiDAR |
| 213 | Kim S. et al. [269] | 2017 | Canada | − | Optical + Radar |
| 214 | Mohammadimanesh F. et al. [270] | 2017 | NL | − | Radar + LiDAR/DEM |
| 215 | Dabboor M. et al. [271] | 2017 | ON | − | Radar |
| 216 | Chabot D. et al. [272] | 2017 | ON | − | UAS |
| 217 | Perreault N. et al. [273] | 2017 | NU | − | Optical |
| 218 | Ullmann T. et al. [274] | 2017 | NT | − | Radar |
| 219 | Brisco et al. [275] | 2017 | Canada | − | - |
| 220 | Mahdavi S. et al. [2] | 2018 | Canada | − | - |
| 221 | Amani M. et al. [103] | 2018 | NL | OB/Supervised/Other | Optical + Radar |
| 222 | Wulder, M. A. et al. [90] | 2018 | Canada | PB/Supervised/RF + Other | Optical |
| 223 | Mohammadimanesh F. et al. [276] | 2018 | NL | OB/Supervised/RF + SVM | Radar |
| 224 | Chabot D. et al. [53] | 2018 | ON | OB/Supervised/ML | UAV |
| 225 | Paul S. S. et al. [113] | 2018 | Canada | OB/Supervised/ML + Other | Optical |
| 226 | D’Acunha B. et al. [277] | 2018 | BC | − | Optical |
| 227 | Arroyo-Mora J. P. et al. [20] | 2018 | ON | − | Optical + Other |
| 228 | Mahdianpari M. et al. [83] | 2018 | NL | PB/Supervised/RF | Radar |
| 229 | Ahern F. et al. [278] | 2018 | ON | PB/Supervised/Other | Radar |
| 230 | Jahncke R. et al. [94] | 2018 | NS | PB/Supervised/RF | Optical + Radar + LiDAR + Aerial |
| 231 | Mohammadimanesh F. et al. [96] | 2018 | NL | OB/Supervised/RF | Radar |
| 232 | Amani M. et al. [39] | 2018 | NL | OB/Supervised/RF | Optical |
| 233 | Mahdianpari M. et al. [27] | 2018 | NL | PB /Supervised/DL + SVM + RF | Optical |
| 234 | Franklin S. E. et al. [62] | 2018 | ON | PB + OB/Supervised/ML + RF | Optical + Radar |
| 235 | Whitley M. A. et al. [279] | 2018 | YT | − | Optical + LiDAR + LiDAR/DEM |
| 236 | Jorgenson M. T. et al. [280] | 2018 | YT | − | Optical + Aerial + LiDAR/DEM |
| 237 | Ward E. M. et al. [281] | 2018 | AB | − | Optical |
| 238 | Potter C. [282] | 2018 | YT | − | Optical |
| 239 | Campbell T. K. F. et al. [283] | 2018 | NT | − | Optical + Aerial |
| 240 | Blanchette M. et al. [284] | 2018 | QC | − | Optical + Aerial + LiDAR/DEM |
| 241 | Warren R. K. et al. [285] | 2018 | NT | − | Optical |
| 242 | DeLancey E. R. et al. [286] | 2018 | AB | − | Radar + LiDAR/DEM |
| 243 | Chasmer L. E. et al. [287] | 2018 | AB | − | Optical |
| 244 | Montgomery J. S. et al. [288] | 2018 | AB | − | Optical + Radar + LiDAR/DEM |
| 245 | Mahdavi S. et al. [82] | 2019 | NL | OB/Supervised/RF | Optical + Radar |
| 246 | Merchant M. A. et al. [289] | 2019 | YT | OB/Supervised/KNN + SVM + RF | Optical + Radar + LiDAR/DEM |
| 247 | Pouliot D. et al. [54] | 2019 | AB, QC | PB/Supervised/DL = CNN | Optical |
| 248 | Amani M. et al. [68] | 2019 | Canada | PB/Supervised/RF | Optical |
| 249 | Dabboor M. et al. [31] | 2019 | ON | − | Optical + Radar |
| 250 | Mohammadimanesh F. et al. [28] | 2019 | NL | OB/Supervised/RF | Radar |
| 251 | Rupasinghe P. A. et al. [46] | 2019 | ON | PB/Supervised/SVM | Optical + UAV |
| 252 | DeLancey E. R. et al. [41] | 2019 | AB | PB/Supervised/DL | Optical + Radar + LiDAR |
| 253 | Mahdianpari M. et al. [86] | 2019 | NL | PB + OB/Supervised/RF | Optical + Radar |
| 254 | Judah A. et al. [290] | 2019 | ON | PB/Supervised/KNN + SVM + RF + Other | Optical + Radar |
| 255 | Banks S. et al. [45] | 2019 | ON | PB/Supervised/RF | Radar + DSM/DEM |
| 256 | Pitcher L. H. et al. [291] | 2019 | YT | − | Radar |
| 257 | Gonsamo A. et al. [292] | 2019 | ON | − | Optical |
| 258 | Westwood A. et al. [293] | 2019 | NB, NS | − | Aerial |
| 259 | Brisco B. et al. [294] | 2019 | AB | − | Radar + UAV + LiDAR + LiDAR/DEM |
| 260 | Jensen D. et al. [295] | 2019 | AB | − | Optical |
| 261 | Palumbo M. D. et al. [296] | 2019 | ON | − | Other |
| 262 | Montgomery J. et al. [297] | 2019 | AB | − | Optical + Radar + LiDAR |
| 263 | Amani M. et al. [78] | 2019 | NL | − | Radar |
| 264 | Lane D. et al. [298] | 2019 | ON | − | LiDAR/DEM |
| 265 | Mahdianpari M. et al. [299] | 2020 | NL | PB/Supervised/RF + CART + Other | Optical + DEM |
| 266 | Mahdianpari M. et al. [69] | 2020 | Canada | OB/Supervised/RF | Optical + Radar |
| 267 | Chen Z. et al. [300] | 2020 | ON | − | Radar + Optical + UAV |
| 268 | DeLancey E. R. et al. [21] | 2020 | AB | PB/Supervised/DL = CNN | Radar + Optical + Aerial |
| 269 | Merchant M. et al. [301] | 2020 | NT | OB/Supervised/RF | Optical + Radar + DEM |
| 270 | Siles G. et al. [302] | 2020 | AB | OB/Supervised/ML + Other | Optical + Radar + LiDAR/DEM |
| 271 | White L. et al. [303] | 2020 | QC | PB/Supervised/Other | Radar + UAV |
| 272 | Valenti V. L. et al. [59] | 2020 | ON | PB/Supervised/RF | Optical + Radar |
| 273 | Hawkes V. C. et al. [304] | 2020 | AB | Visual Analysis/Other | Optical + Aerial + LiDAR/DEM |
| 274 | Brisco B. et al. [305] | 2020 | Canada | - | Radar |
| 275 | Amani M. et al. [120] | 2020 | NL | OB + PB/Supervised/RF | Optical + Radar + LiDAR |
| 276 | Mahdianpari M. et al. [70] | 2020 | Canada | OB/Supervised/RF | Optical + Radar |
| 277 | LaRocque A. et al. [306] | 2020 | NB | PB/Supervised/RF | Optical + Radar |
| 278 | LaRocque A. et al. [117] | 2020 | NB | PB/Supervised/RF | Optical + Radar + DEM |
| 279 | Ahmed, M. I. et al. [307] | 2020 | SK | − | DEM |
| 280 | Bahrami A. et al. [308] | 2020 | QC | − | Radar + Other |
| 281 | Bergeron J. et al. [309] | 2020 | AB | − | Optical + LiDAR + LiDAR/DEM |
| 282 | Mahoney C. et al. [310] | 2020 | AB | − | Radar |
| 283 | Wulder M. A. et al. [311] | 2020 | Canada | − | Optical + LiDAR |
| 284 | Janardanan R. et al. [312] | 2020 | Canada | − | Optical + UAV |
| 285 | O’Sullivan A. M. et al. [313] | 2020 | NB | − | LiDAR/DEM |
| 286 | Olthof I. et al. [314] | 2020 | QC, ON | − | Radar |
| 287 | Wadsworth E. et al. [315] | 2020 | Canada | − | LiDAR/DEM + Other |
| 288 | Amani M. et al. [316] | 2020 | Canada | − | Optical |
| 289 | Omari K. et al. [317] | 2020 | QC | − | Radar |
| 290 | Sewell P. D. et al. [318] | 2020 | AB | − | LiDAR |
| 291 | Peters D. L. et al. [319] | 2020 | AB | − | Optical + LiDAR |
| 292 | Zakharov I. et al. [320] | 2020 | AB | − | Radar |
| 293 | Wulder M. A. et al. [321] | 2020 | Canada | − | Optical |
| 294 | Wang L. et al. [322] | 2020 | QC | − | Radar |
| 295 | White L. et al. [323] | 2020 | ON | − | - |
| 296 | Wu J. et al. [324] | 2020 | NL | − | - |
| 297 | Haynes K. M. et al. [325] | 2020 | NT | − | LiDAR |
| 298 | Hopkinson C. et al. [326] | 2020 | BC | − | Optical + Radar + LiDAR/DEM |
| 299 | Adeli S. et al. [18] | 2020 | Canada | − | - |
| 300 | Mahdianpari M. et al. [327] | 2020 | NL | OB/Supervised/RF | Optical + LiDAR/DEM |
References
- Why Wetlands. Available online: http://www.wetlands-initiative.org/what-is-a-wetland (accessed on 21 January 2021).
- Mahdavi, S.; Salehi, B.; Granger, J.; Amani, M.; Brisco, B.; Huang, W. Remote Sensing for Wetland Classification: A Comprehensive Review. GISci. Remote Sens. 2018, 55, 623–658. [Google Scholar] [CrossRef]
- Grenier, M.; Labrecque, S.; Garneau, M.; Tremblay, A. Object-Based Classification of a SPOT-4 Image for Mapping Wetlands in the Context of Greenhouse Gases Emissions: The Case of the Eastmain Region, Québec, Canada. Can. J. Remote Sens. 2008, 34, S398–S413. [Google Scholar] [CrossRef]
- Trepel, M. Assessing the Cost-Effectiveness of the Water Purification Function of Wetlands for Environmental Planning. Ecol. Complex. 2010, 7, 320–326. [Google Scholar] [CrossRef]
- Knox, A.K.; Dahlgren, R.A.; Tate, K.W.; Atwill, E.R. Efficacy of Natural Wetlands to Retain Nutrient, Sediment and Microbial Pollutants. J. Environ. Qual. 2008, 37, 1837–1846. [Google Scholar] [CrossRef] [PubMed]
- Claassen, R. Compliance Provisions for Soil and Wetland Conservation. In Agricultural Resources and Environmental Indicators; Wiebe, K., Gollehon, N., Eds.; Nova Science Publishers, Inc.: Hauppauge, NY, USA, 2006; ISBN 978-1-60021-467-7. [Google Scholar]
- Amani, M.; Salehi, B.; Mahdavi, S.; Granger, J.; Brisco, B. Wetland Classification in Newfoundland and Labrador Using Multi-Source SAR and Optical Data Integration. GISci. Remote Sens. 2017, 54, 779–796. [Google Scholar] [CrossRef]
- Zedler, J.; Leach, M. Managing Urban Wetlands for Multiple Use: Research, Restoration, and Recreation. Urban Ecosyst. 1998, 2, 189–204. [Google Scholar] [CrossRef]
- Li, X.; Bellerby, R.; Craft, C.; Widney, S.E. Coastal Wetland Loss, Consequences, and Challenges for Restoration. Anthr. Coasts 2018, 1, 1–15. [Google Scholar] [CrossRef] [Green Version]
- Ming, J.; Xian-guo, L.; Lin-shu, X.; Li-juan, C.; Shouzheng, T. Flood Mitigation Benefit of Wetland Soil—A Case Study in Momoge National Nature Reserve in China. Ecol. Econ. 2007, 61, 217–223. [Google Scholar] [CrossRef]
- Allard, M.; Fournier, R.A.; Grenier, M.; Lefebvre, J.; Giroux, J.F. Forty Years of Change in the Bulrush Marshes of the St. Lawrence Estuary and the Impact of the Greater Snow Goose. Wetlands 2012, 32, 1175–1188. [Google Scholar] [CrossRef]
- Strong, L.L.; Cowardin, L.M. Improving Prairie Pond Counts with Aerial Video and Global Positioning Systems. J. Wildl. Manag. 1995, 59, 708. [Google Scholar] [CrossRef]
- Koch, M.; Schmid, T.; Reyes, M.; Gumuzzio, J. Evaluating Full Polarimetric C- and L-Band Data for Mapping Wetland Conditions in a Semi-Arid Environment in Central Spain. IEEE J. Sel. Top. Appl. Earth Obs. Remote Sens. 2012, 5, 1033–1044. [Google Scholar] [CrossRef]
- Castro, G.; Chomitz, K.; Thomas, T.S. The Ramsar Convention: Measuring Its Effectiveness for Conserving Wetlands of International Importance. In Proceedings of the Ramsar COP8, Valencia, Spain, 18–26 November 2002. [Google Scholar]
- Grobicki, A.; Chalmers, C.; Jennings, E.; Jones, T.; Peck, D. An Introduction to the Ramsar Convention on Wetlands, 7th ed.; Ramsar Convention Secretariat: Gland, Switzerland, 2016. [Google Scholar]
- Dabboor, M.; White, L.; Brisco, B.; Charbonneau, F. Change Detection with Compact Polarimetric SAR for Monitoring Wetlands. Can. J. Remote Sens. 2015, 41, 408–417. [Google Scholar] [CrossRef]
- Mahdianpari, M.; Granger, J.E.; Mohammadimanesh, F.; Salehi, B.; Brisco, B.; Homayouni, S.; Gill, E.; Huberty, B.; Lang, M. Meta-Analysis of Wetland Classification Using Remote Sensing: A Systematic Review of a 40-Year Trend in North America. Remote Sens. 2020, 12, 1882. [Google Scholar] [CrossRef]
- Adeli, S.; Salehi, B.; Mahdianpari, M.; Quackenbush, L.J.; Brisco, B.; Tamiminia, H.; Shaw, S. Wetland Monitoring Using SAR Data: A Meta-Analysis and Comprehensive Review. Remote Sens. 2020, 12, 2190. [Google Scholar] [CrossRef]
- Dribault, Y.; Chokmani, K.; Bernier, M. Monitoring Seasonal Hydrological Dynamics of Minerotrophic Peatlands Using Multi-Date GeoEye-1 Very High Resolution Imagery and Object-Based Classification. Remote Sens. 2012, 4, 1887–1912. [Google Scholar] [CrossRef] [Green Version]
- Arroyo-Mora, J.P.; Kalacska, M.; Soffer, R.; Ifimov, G.; Leblanc, G.; Schaaf, E.S.; Lucanus, O. Evaluation of Phenospectral Dynamics with Sentinel-2A Using a Bottom-up Approach in a Northern Ombrotrophic Peatland. Remote Sens. Environ. 2018, 216, 544–560. [Google Scholar] [CrossRef]
- DeLancey, E.R.; Simms, J.F.; Mahdianpari, M.; Brisco, B.; Mahoney, C.; Kariyeva, J. Comparing Deep Learning and Shallow Learning for Large-Scalewetland Classification in Alberta, Canada. Remote Sens. 2020, 12, 2. [Google Scholar] [CrossRef] [Green Version]
- Halsey, L.; Vitt, D.; Zoltai, S. Climatic and Physiographic Controls on Wetland Type and Distribution in Manitoba, Canada. Wetlands 1997, 17, 243–262. [Google Scholar] [CrossRef] [Green Version]
- McNairn, H.E.; Protz, R.; Duke, C. Scale and Remotely Sensed Data for Change Detection in the James Bay, Ontario, Coastal Wetlands. Can. J. Remote Sens. 1993, 19, 45–49. [Google Scholar] [CrossRef]
- Zaman, B.; Jensen, A.M.; McKee, M. Use of High-Resolution Multispectral Imagery Acquired with an Autonomous Unmanned Aerial Vehicle to Quantify the Spread of an Invasive Wetlands Species. In Proceedings of the International Geoscience and Remote Sensing Symposium (IGARSS), Vancouver, BC, Canada, 24–29 July 2011; pp. 803–806. [Google Scholar]
- Wang, J.; Shang, J.; Brisco, B.; Brown, R.J. Evaluation of Multidate ERS-1 and Multispectral Landsat Imagery for Wetland Detection in Southern Ontario. Can. J. Remote Sens. 1998, 24, 60–68. [Google Scholar] [CrossRef]
- Mutanga, O.; Adam, E.; Cho, M.A. High Density Biomass Estimation for Wetland Vegetation Using WorldView-2 Imagery and Random Forest Regression Algorithm. Int. J. Appl. Earth Obs. Geoinf. 2012, 18, 399–406. [Google Scholar] [CrossRef]
- Mahdianpari, M.; Salehi, B.; Rezaee, M.; Mohammadimanesh, F.; Zhang, Y. Very Deep Convolutional Neural Networks for Complex Land Cover Mapping Using Multispectral Remote Sensing Imagery. Remote Sens. 2018, 10, 1119. [Google Scholar] [CrossRef] [Green Version]
- Mohammadimanesh, F.; Salehi, B.; Mahdianpari, M.; Brisco, B.; Gill, E. Full and Simulated Compact Polarimetry SAR Responses to Canadian Wetlands: Separability Analysis and Classification. Remote Sens. 2019, 11, 516. [Google Scholar] [CrossRef] [Green Version]
- Murphy, M.A.; Martini, J.P.; Protz, R. Seasonal Changes in Subarctic Wetlands and River Ice Breakup Detectable on RADARSAT Images, Southern Hudson Bay Lowland, Ontario, Canada. Can. J. Remote Sens. 2001, 27, 143–158. [Google Scholar] [CrossRef]
- Ghedira, H.; Bernier, M.; Ouarda, T.B.M.J. Application of Neural Networks for Wetland Classification in RADARSAT SAR Imagery. In Proceedings of the International Geoscience and Remote Sensing Symposium (IGARSS), Honolulu, HI, USA, 24–28 July 2000; Volume 2, pp. 675–677. [Google Scholar]
- Dabboor, M.; Banks, S.; White, L.; Brisco, B.; Behnamian, A.; Chen, Z.; Murnaghan, K. Comparison of Compact and Fully Polarimetric SAR for Multitemporal Wetland Monitoring. IEEE J. Sel. Top. Appl. Earth Obs. Remote Sens. 2019, 12, 1417–1430. [Google Scholar] [CrossRef]
- Jollineau, M.Y.; Howarth, P.J. Mapping an Inland Wetland Complex Using Hyperspectral Imagery. Int. J. Remote Sens. 2008, 29, 3609–3631. [Google Scholar] [CrossRef]
- Li, J.; Chen, W. A Rule-Based Method for Mapping Canada’s Wetlands Using Optical, Radar and DEM Data. Int. J. Remote Sens. 2005, 26, 5051–5069. [Google Scholar] [CrossRef]
- Braverman, M.; Quinton, W.L. Hydrological Impacts of Seismic Lines in the Wetland-Dominated Zone of Thawing, Discontinuous Permafrost, Northwest Territories, Canada. Hydrol. Process. 2016, 30, 2617–2627. [Google Scholar] [CrossRef]
- Hogg, A.R.; Todd, K.W. Automated Discrimination of Upland and Wetland Using Terrain Derivatives. Can. J. Remote Sens. 2007, 33, S68–S83. [Google Scholar] [CrossRef]
- Richardson, M.C.; Fortin, M.J.; Branfireun, B.A. Hydrogeomorphic Edge Detection and Delineation of Landscape Functional Units from Lidar Digital Elevation Models. Water Resour. Res. 2009, 45, 10441. [Google Scholar] [CrossRef]
- Collin, A.; Long, B.; Archambault, P. Salt-Marsh Characterization, Zonation Assessment and Mapping through a Dual-Wavelength LiDAR. Remote Sens. Environ. 2010, 114, 520–530. [Google Scholar] [CrossRef]
- Sutherland, G.; Chasmer, L.E.; Petrone, R.M.; Kljun, N.; Devito, K.J. Evaluating the Use of Spatially Varying versus Bulk Average 3D Vegetation Structural Inputs to Modelled Evapotranspiration within Heterogeneous Land Cover Types. Ecohydrology 2014, 7, 1545–1559. [Google Scholar] [CrossRef]
- Amani, M.; Salehi, B.; Mahdavi, S.; Brisco, B. Spectral Analysis of Wetlands Using Multi-Source Optical Satellite Imagery. ISPRS J. Photogramm. Remote Sens. 2018, 144, 119–136. [Google Scholar] [CrossRef]
- Hird, J.N.; DeLancey, E.R.; McDermid, G.J.; Kariyeva, J. Google Earth Engine, Open-Access Satellite Data, and Machine Learning in Support of Large-Area Probabilisticwetland Mapping. Remote Sens. 2017, 9, 1315. [Google Scholar] [CrossRef] [Green Version]
- DeLancey, E.R.; Kariyeva, J.; Bried, J.T.; Hird, J.N. Large-Scale Probabilistic Identification of Boreal Peatlands Using Google Earth Engine, Open-Access Satellite Data, and Machine Learning. PLoS ONE 2019, 14, e0218165. [Google Scholar] [CrossRef] [Green Version]
- Millard, K.; Richardson, M. Wetland Mapping with LiDAR Derivatives, SAR Polarimetric Decompositions, and LiDAR-SAR Fusion Using a Random Forest Classifier. Can. J. Remote Sens. 2013, 39, 290–307. [Google Scholar] [CrossRef]
- Mahdianpari, M.; Salehi, B.; Mohammadimanesh, F.; Brisco, B. An Assessment of Simulated Compact Polarimetric SAR Data for Wetland Classification Using Random Forest Algorithm. Can. J. Remote Sens. 2017, 43, 468–484. [Google Scholar] [CrossRef]
- Mahdianpari, M.; Salehi, B.; Mohammadimanesh, F.; Motagh, M. Random Forest Wetland Classification Using ALOS-2 L-Band, RADARSAT-2 C-Band, and TerraSAR-X Imagery. ISPRS J. Photogramm. Remote Sens. 2017, 130, 13–31. [Google Scholar] [CrossRef]
- Banks, S.; White, L.; Behnamian, A.; Chen, Z.; Montpetit, B.; Brisco, B.; Pasher, J.; Duffe, J. Wetland Classification with Multi-Angle/Temporal SAR Using Random Forests. Remote Sens. 2019, 11, 670. [Google Scholar] [CrossRef] [Green Version]
- Rupasinghe, P.A.; Chow-Fraser, P. Identification of Most Spectrally Distinguishable Phenological Stage of Invasive Phramites Australis in Lake Erie Wetlands (Canada) for Accurate Mapping Using Multispectral Satellite Imagery. Wetl. Ecol. Manag. 2019, 27, 513–538. [Google Scholar] [CrossRef]
- Merchant, M.A.; Adams, J.R.; Berg, A.A.; Baltzer, J.L.; Quinton, W.L.; Chasmer, L.E. Contributions of C-Band SAR Data and Polarimetric Decompositions to Subarctic Boreal Peatland Mapping. IEEE J. Sel. Top. Appl. Earth Obs. Remote Sens. 2017, 10, 1467–1482. [Google Scholar] [CrossRef]
- Brisco, B.; Li, K.; Tedford, B.; Charbonneau, F.; Yun, S.; Murnaghan, K. Compact Polarimetry Assessment for Rice and Wetland Mapping. Int. J. Remote Sens. 2013, 34, 1949–1964. [Google Scholar] [CrossRef] [Green Version]
- Kaheil, Y.H.; Creed, I.F. Detecting and Downscaling Wet Areas on Boreal Landscapes. IEEE Geosci. Remote Sens. Lett. 2009, 6, 179–183. [Google Scholar] [CrossRef]
- Yatabe, S.M.; Leckie, D.G. Clearcut and Forest-Type Discrimination in Satellite Sar Imagery. Can. J. Remote Sens. 1995, 21, 455–467. [Google Scholar] [CrossRef]
- Jobin, B.; Beaulieu, J.; Grenier, M.; Bélanger, L.; Maisonneuve, C.; Bordage, D.; Filion, B. Landscape Changes and Ecological Studies in Agricultural Regions, Québec, Canada. Landsc. Ecol. 2003, 18, 575–590. [Google Scholar] [CrossRef]
- Ullmann, T.; Schmitt, A.; Roth, A.; Duffe, J.; Dech, S.; Hubberten, H.W.; Baumhauer, R. Land Cover Characterization and Classification of Arctic Tundra Environments by Means of Polarized Synthetic Aperture X- and C-Band Radar (PolSAR) and Landsat 8 Multispectral Imagery—Richards Island, Canada. Remote Sens. 2014, 6, 8565–8593. [Google Scholar] [CrossRef] [Green Version]
- Chabot, D.; Dillon, C.; Shemrock, A.; Weissflog, N.; Sager, E.P.S. An Object-Based Image Analysis Workflow for Monitoring Shallow-Water Aquatic Vegetation in Multispectral Drone Imagery. ISPRS Int. J. Geo-Inf. 2018, 7, 294. [Google Scholar] [CrossRef] [Green Version]
- Pouliot, D.; Latifovic, R.; Pasher, J.; Duffe, J. Assessment of Convolution Neural Networks for Wetland Mapping with Landsat in the Central Canadian Boreal Forest Region. Remote Sens. 2019, 11, 772. [Google Scholar] [CrossRef] [Green Version]
- Bourgeau-Chavez, L.L.; Endres, S.; Powell, R.; Battaglia, M.J.; Benscoter, B.; Turetsky, M.; Kasischke, E.S.; Banda, E. Mapping Boreal Peatland Ecosystem Types from Multitemporal Radar and Optical Satellite Imagery. Can. J. For. Res. 2017, 47, 545–559. [Google Scholar] [CrossRef]
- Ou, C.; LaRocque, A.; Leblon, B.; Zhang, Y.; Webster, K.; McLaughlin, J. Modelling and Mapping Permafrost at High Spatial Resolution Using Landsat and Radarsat-2 Images in Northern Ontario, Canada: Part 2—Regional Mapping. Int. J. Remote Sens. 2016, 37, 2751–2779. [Google Scholar] [CrossRef]
- Chen, Z.; Pasher, J.; Duffe, J.; Behnamian, A. Mapping Arctic Coastal Ecosystems with High Resolution Optical Satellite Imagery Using a Hybrid Classification Approach. Can. J. Remote Sens. 2017, 43, 513–527. [Google Scholar] [CrossRef]
- Banks, S.; Millard, K.; Behnamian, A.; White, L.; Ullmann, T.; Charbonneau, F.; Chen, Z.; Wang, H.; Pasher, J.; Duffe, J. Contributions of Actual and Simulated Satellite SAR Data for Substrate Type Differentiation and Shoreline Mapping in the Canadian Arctic. Remote Sens. 2017, 9, 1206. [Google Scholar] [CrossRef] [Green Version]
- Valenti, V.L.; Carcelen, E.C.; Lange, K.; Russo, N.J.; Chapman, B. Leveraging Google Earth Engine User Interface for Semiautomated Wetland Classification in the Great Lakes Basin at 10 m with Optical and Radar Geospatial Datasets. IEEE J. Sel. Top. Appl. Earth Obs. Remote Sens. 2020, 13, 6008–6018. [Google Scholar] [CrossRef]
- White, L.; Millard, K.; Banks, S.; Richardson, M.; Pasher, J.; Duffe, J. Moving to the RADARSAT Constellation Mission: Comparing Synthesized Compact Polarimetry and Dual Polarimetry Data with Fully Polarimetric RADARSAT-2 Data for Image Classification of Peatlands. Remote Sens. 2017, 9, 573. [Google Scholar] [CrossRef] [Green Version]
- Franklin, S.E.; Ahmed, O.S. Object-Based Wetland Characterization Using Radarsat-2 Quad-Polarimetric SAR Data, Landsat-8 OLI Imagery, and Airborne Lidar-Derived Geomorphometric Variables. Photogramm. Eng. Remote Sens. 2017, 83, 27–36. [Google Scholar] [CrossRef]
- Franklin, S.E.; Skeries, E.M.; Stefanuk, M.A.; Ahmed, O.S. Wetland Classification Using Radarsat-2 SAR Quad-Polarization and Landsat-8 OLI Spectral Response Data: A Case Study in the Hudson Bay Lowlands Ecoregion. Int. J. Remote Sens. 2018, 39, 1615–1627. [Google Scholar] [CrossRef]
- Lantz, N.J.; Wang, J. Object-Based Classification of Worldview-2 Imagery for Mapping Invasive Common Reed, Phragmites Australis. Can. J. Remote Sens. 2013, 39, 328–340. [Google Scholar] [CrossRef]
- Melton, J.R.; Wania, R.; Hodson, E.L.; Poulter, B.; Ringeval, B.; Spahni, R.; Bohn, T.; Avis, C.A.; Beerling, D.J.; Chen, G.; et al. Present State of Global Wetland Extent and Wetland Methane Modelling: Conclusions from a Model Inter-Comparison Project (WETCHIMP). Biogeosciences 2013, 10, 753–788. [Google Scholar] [CrossRef] [Green Version]
- Canadian Environmental Sustainability Indicators: Extent of Canada’s Wetlands. 2016. Available online: https://www.canada.ca/content/dam/eccc/migration/main/indicateurs-indicators/69e2d25b-52a2-451e-ad87-257fb13711b9/4.0.b-20wetlands_en.pdf (accessed on 31 August 2016).
- Wetlands. Available online: https://cwf-fcf.org/en/explore/gardening-for-wildlife/tools/recreating-natural-habitats/wetlands.html (accessed on 31 August 2016).
- Warner, B.G.; Rubec, C.D.A.; National Wetlands Working Group. The Canadian Wetland Classification System; Wetlands Research Centre, University of Waterloo: Waterloo, ON, Canada, 1997. [Google Scholar]
- Amani, M.; Mahdavi, S.; Afshar, M.; Brisco, B.; Huang, W.; Mirzadeh, S.M.J.; White, L.; Banks, S.; Montgomery, J.; Hopkinson, C. Canadian Wetland Inventory Using Google Earth Engine: The First Map and Preliminary Results. Remote Sens. 2019, 11, 842. [Google Scholar] [CrossRef] [Green Version]
- Mahdianpari, M.; Salehi, B.; Mohammadimanesh, F.; Brisco, B.; Homayouni, S.; Gill, E.; DeLancey, E.R.; Bourgeau-Chavez, L. Big Data for a Big Country: The First Generation of Canadian Wetland Inventory Map at a Spatial Resolution of 10-m Using Sentinel-1 and Sentinel-2 Data on the Google Earth Engine Cloud Computing Platform. Can. J. Remote Sens. 2020, 46, 15–33. [Google Scholar] [CrossRef]
- Mahdianpari, M.; Brisco, B.; Granger, J.E.; Mohammadimanesh, F.; Salehi, B.; Banks, S.; Homayouni, S.; Bourgeau-Chavez, L.; Weng, Q. The Second Generation Canadian Wetland Inventory Map at 10 Meters Resolution Using Google Earth Engine. Can. J. Remote Sens. 2020, 46, 360–375. [Google Scholar] [CrossRef]
- McLaren, B.E.; Mahoney, S.P. Comparison of Forestry-Based Remote Sensing Methodologies to Evaluate Woodland Caribou Habitat in Non-Forested Areas of Newfoundland. For. Chron. 2001, 77, 866–873. [Google Scholar] [CrossRef] [Green Version]
- Mahdavi, S.; Salehi, B.; Amani, M.; Granger, J.E.; Brisco, B.; Huang, W.; Hanson, A. Object-Based Classification of Wetlands in Newfoundland and Labrador Using Multi-Temporal PolSAR Data. Can. J. Remote Sens. 2017, 43, 432–450. [Google Scholar] [CrossRef]
- Amani, M.; Salehi, B.; Mahdavi, S.; Granger, J.E.; Brisco, B.; Hanson, A. Wetland Classification Using Multi-Source and Multi-Temporal Optical Remote Sensing Data in Newfoundland and Labrador, Canada. Can. J. Remote Sens. 2017, 43, 360–373. [Google Scholar] [CrossRef]
- Chasmer, L.; Cobbaert, D.; Mahoney, C.; Millard, K.; Peters, D.; Devito, K.; Brisco, B.; Hopkinson, C.; Merchant, M.; Montgomery, J.; et al. Remote Sensing of Boreal Wetlands 1: Data Use for Policy and Management. Remote Sens. 2020, 12, 1320. [Google Scholar] [CrossRef] [Green Version]
- Chasmer, L.; Mahoney, C.; Millard, K.; Nelson, K.; Peters, D.; Merchant, M.; Hopkinson, C.; Brisco, B.; Niemann, O.; Montgomery, J.; et al. Remote Sensing of Boreal Wetlands 2: Methods for Evaluating Boreal Wetland Ecosystem State and Drivers of Change. Remote Sens. 2020, 12, 1321. [Google Scholar] [CrossRef] [Green Version]
- Guo, M.; Li, J.; Sheng, C.; Xu, J.; Wu, L. A Review of Wetland Remote Sensing. Sensors 2017, 17, 777. [Google Scholar] [CrossRef] [PubMed] [Green Version]
- Branch, W.; Floor, M. Alberta Environment and Sustainable Resource Development (ESRD). 2015. Alberta Wetland Classification System; Water Policy Branch, Policy and Planning Division: Edmonton, AB, Canada, 2015; ISBN 9781460122570. [Google Scholar]
- Amani, M.; Salehi, B.; Mahdavi, S.; Brisco, B. Separability Analysis of Wetlands in Canada Using Multi-Source SAR Data. GISci. Remote Sens. 2019, 56, 1233–1260. [Google Scholar] [CrossRef]
- National Wetlands Working Group. Canada. Lands Directorate. The Canadian Wetland Classification System; Environment Canada: Ottawa, ON, Canada, 1987. [Google Scholar]
- Smith, K.B.; Smith, C.; Forest, S.; Richard, A. A Field Guide to the Wetlands of the Boreal Plains Ecozone of Canada; Ducks Unlimited Canada, Western Boreal Office: Edmonton, AB, Canada, 2007. [Google Scholar]
- Rubec, C. The Canadian Wetland Classification System. In Finlay; Springer: Dordrecht, The Netherlands, 2018; ISBN 978-90-481-3493-9. [Google Scholar]
- Mahdavi, S.; Salehi, B.; Amani, M.; Granger, J.; Brisco, B.; Huang, W. A Dynamic Classification Scheme for Mapping Spectrally Similar Classes: Application to Wetland Classification. Int. J. Appl. Earth Obs. Geoinf. 2019, 83, 101914. [Google Scholar] [CrossRef]
- Mahdianpari, M.; Salehi, B.; Mohammadimanesh, F.; Brisco, B.; Mahdavi, S.; Amani, M.; Granger, J.E. Fisher Linear Discriminant Analysis of Coherency Matrix for Wetland Classification Using PolSAR Imagery. Remote Sens. Environ. 2018, 206, 300–317. [Google Scholar] [CrossRef]
- Moher, D.; Shamseer, L.; Clarke, M.; Ghersi, D.; Liberati, A.; Petticrew, M.; Shekelle, P.; Stewart, L.A.; Group, P.-P. Preferred Reporting Items for Systematic Review and Meta-Analysis Protocols (PRISMA-P) 2015 Statement. Syst. Rev. 2015, 4, 1–9. [Google Scholar] [CrossRef] [Green Version]
- Zupic, I.; Čater, T. Bibliometric Methods in Management and Organization. Organ. Res. Methods 2015, 18, 429–472. [Google Scholar] [CrossRef]
- Mahdianpari, M.; Salehi, B.; Mohammadimanesh, F.; Homayouni, S.; Gill, E. The First Wetland Inventory Map of Newfoundland at a Spatial Resolution of 10 m Using Sentinel-1 and Sentinel-2 Data on the Google Earth Engine Cloud Computing Platform. Remote Sens. 2019, 11, 43. [Google Scholar] [CrossRef] [Green Version]
- Kokelj, S.V.; Jorgenson, M.T. Advances in Thermokarst Research. Permafr. Periglac. Process. 2013, 24, 108–119. [Google Scholar] [CrossRef]
- Touzi, R. Target Scattering Decomposition in Terms of Roll-Invariant Target Parameters. IEEE Trans. Geosci. Remote Sens. 2007, 45, 73–84. [Google Scholar] [CrossRef]
- Connon, R.F.; Quinton, W.L.; Craig, J.R.; Hayashi, M. Changing Hydrologic Connectivity Due to Permafrost Thaw in the Lower Liard River Valley, NWT, Canada. Hydrol. Process. 2014, 28, 4163–4178. [Google Scholar] [CrossRef]
- Wulder, M.A.; Li, Z.; Campbell, E.M.; White, J.C.; Hobart, G.; Hermosilla, T.; Coops, N.C. A National Assessment Ofwetland Status and Trends for Canada’s Forested Ecosystems Using 33 Years of Earth Observation Satellite Data. Remote Sens. 2018, 10, 1623. [Google Scholar] [CrossRef] [Green Version]
- Hermosilla, T.; Wulder, M.A.; White, J.C.; Coops, N.C.; Hobart, G.W. Disturbance-Informed Annual Land Cover Classification Maps of Canada’s Forested Ecosystems for a 29-Year Landsat Time Series. Can. J. Remote Sens. 2018, 44, 67–87. [Google Scholar] [CrossRef]
- Watchorn, K.E.; Goldsborough, L.G.; Wrubleski, D.A.; Mooney, B.G. A Hydrogeomorphic Inventory of Coastal Wetlands of the Manitoba Great Lakes: Lakes Winnipeg, Manitoba, and Winnipegosis. J. Great Lakes Res. 2012, 38, 115–122. [Google Scholar] [CrossRef]
- Steyaert, L.T.; Hall, F.G.; Loveland, T.R. Land Cover Mapping, Fire Regeneration, and Scaling Studies in the Canadian Boreal Forest with 1 Km AVHRR and Landsat TM Data. J. Geophys. Res. Atmos. 1997, 102, 29581–29598. [Google Scholar] [CrossRef]
- Jahncke, R.; Leblon, B.; Bush, P.; LaRocque, A. Mapping Wetlands in Nova Scotia with Multi-Beam RADARSAT-2 Polarimetric SAR, Optical Satellite Imagery, and Lidar Data. Int. J. Appl. Earth Obs. Geoinf. 2018, 68, 139–156. [Google Scholar] [CrossRef]
- Dech, J.P.; Mayhew-Hammond, S.; James, A.L.; Pokharel, B. Modeling Canada Yew (Taxus Canadensis Marsh.) Distribution and Abundance in the Boreal Forest of Northeastern Ontario, Canada. Ecol. Indic. 2014, 36, 48–58. [Google Scholar] [CrossRef]
- Mohammadimanesh, F.; Salehi, B.; Mahdianpari, M.; Brisco, B.; Motagh, M. Multi-Temporal, Multi-Frequency, and Multi-Polarization Coherence and SAR Backscatter Analysis of Wetlands. ISPRS J. Photogramm. Remote Sens. 2018, 142, 78–93. [Google Scholar] [CrossRef]
- Arzandeh, S.; Wang, J. Texture Evaluation of RADARSAT Imagery for Wetland Mapping. Can. J. Remote Sens. 2002, 28, 653–666. [Google Scholar] [CrossRef]
- Lara, M.J.; Genet, H.; Mcguire, A.D.; Euskirchen, E.S.; Zhang, Y.; Brown, D.R.N.; Jorgenson, M.T.; Romanovsky, V.; Breen, A.; Bolton, W.R. Thermokarst Rates Intensify Due to Climate Change and Forest Fragmentation in an Alaskan Boreal Forest Lowland. Glob. Chang. Biol. 2016, 22, 816–829. [Google Scholar] [CrossRef] [PubMed]
- Pastick, N.J.; Rigge, M.; Wylie, B.K.; Jorgenson, M.T.; Rose, J.R.; Johnson, K.D.; Ji, L. Distribution and Landscape Controls of Organic Layer Thickness and Carbon within the Alaskan Yukon River Basin. Geoderma 2014, 230–231, 79–94. [Google Scholar] [CrossRef]
- Deslandes, S.; Grenier, M.; Bélanger, L.; Lacroix, G.; Zingraff, V. The Wetland Conservation Atlas of the St. Lawrence Valley Produced from Decision Tree Classifications of RADARSAT and Landsat Images. In Proceedings of the International Geoscience and Remote Sensing Symposium (IGARSS), Toronto, ON, Canada, 24–28 June 2002; Volume 5, pp. 2893–2895. [Google Scholar]
- Baghdadi, N.; Bernier, M.; Gauthier, R.; Neeson, I. Evaluation of C-Band SAR Data for Wetlands Mapping. Int. J. Remote Sens. 2001, 22, 71–88. [Google Scholar] [CrossRef]
- Chasmer, L.; Hopkinson, C.; Veness, T.; Quinton, W.; Baltzer, J. A Decision-Tree Classification for Low-Lying Complex Land Cover Types within the Zone of Discontinuous Permafrost. Remote Sens. Environ. 2014, 143, 73–84. [Google Scholar] [CrossRef]
- Amani, M.; Salehi, B.; Mahdavi, S.; Brisco, B.; Shehata, M. A Multiple Classifier System to Improve Mapping Complex Land Covers: A Case Study of Wetland Classification Using SAR Data in Newfoundland, Canada. Int. J. Remote Sens. 2018, 39, 7370–7383. [Google Scholar] [CrossRef]
- Gillanders, S.N.; Coops, N.C.; Wulder, M.A.; Goodwin, N.R. Application of Landsat Satellite Imagery to Monitor Land-Cover Changes at the Athabasca Oil Sands, Alberta, Canada. Can. Geogr. 2008, 52, 466–485. [Google Scholar] [CrossRef]
- Gadallah, F.L. Historical Vegetation Reconstruction of a Degraded Sub-Arctic Coastal Marsh Using Landsat Imagery and Ancillary Data. Ecoscience 2002, 9, 271–279. [Google Scholar] [CrossRef]
- Hall, F.G.; Knapp, D.E.; Huemmrich, K.F. Physically Based Classification and Satellite Mapping of Biophysical Characteristics in the Southern Boreal Forest. J. Geophys. Res. Atmos. 1997, 102, 29567–29580. [Google Scholar] [CrossRef]
- Mui, A.; He, Y.; Weng, Q. An Object-Based Approach to Delineate Wetlands across Landscapes of Varied Disturbance with High Spatial Resolution Satellite Imagery. ISPRS J. Photogramm. Remote Sens. 2015, 109, 30–46. [Google Scholar] [CrossRef] [Green Version]
- Dissanska, M.; Bernier, M.; Payette, S. Object-Based Classification of Very High Resolution Panchromatic Images for Evaluating Recent Change in the Structure of Patterned Peatlands. Can. J. Remote Sens. 2009, 35, 189–215. [Google Scholar] [CrossRef]
- Dillabaugh, K.A.; King, D.J. Riparian Marshland Composition and Biomass Mapping Using Ikonos Imagery. Can. J. Remote Sens. 2008, 34, 143–158. [Google Scholar] [CrossRef]
- Bernier, M.; Ghedira, H.; Gauthier, Y.; Magagi, R.; Filion, R.; De Sève, D.; Ouarda, T.B.M.J.; Villeneuve, J.P.; Buteau, P. Détection et Classification de Tourbières Ombrotrophes Du Québec à Partir d’images RADARSAT-1. Can. J. Remote Sens. 2003, 29, 88–98. [Google Scholar] [CrossRef]
- Dechka, J.A.; Franklin, S.E.; Watmough, M.D.; Bennett, R.P.; Ingstrup, D.W. Classification of Wetland Habitat and Vegetation Communities Using Multi-Temporal Ikonos Imagery in Southern Saskatchewan. Can. J. Remote Sens. 2002, 28, 679–685. [Google Scholar] [CrossRef]
- Mohammadimanesh, F.; Salehi, B.; Mahdianpari, M.; Homayouni, S. Unsupervised Wishart Classfication of Wetlands in Newfoundland, Canada Using Polsar Data Based on Fisher Linear Discriminant Analysis. In Proceedings of the International Archives of the Photogrammetry, Remote Sensing and Spatial Information Sciences—ISPRS Archives, Prague, Czech Republic, 12–19 July 2016; Volume 41, pp. 305–310. [Google Scholar]
- Paul, S.S.; Li, J.; Wheate, R.; Li, Y. Application of Object Oriented Image Classification and Markov Chain Modeling for Land Use and Land Cover Change Analysis. J. Environ. Inform. 2018, 31, 30–40. [Google Scholar] [CrossRef]
- Sizo, A.; Noble, B.; Bell, S. Futures Analysis of Urban Land Use and Wetland Change in Saskatoon, Canada: An Application in Strategic Environmental Assessment. Sustaininability 2015, 7, 811–830. [Google Scholar] [CrossRef] [Green Version]
- Touzi, R.; Omari, K.; Sleep, B. Combination of Target Scattering Decomposition with the Optimum Degree of Polarization for Improved Classification of Boreal Peatlands in the Athabasca Region. In Proceedings of the International Geoscience and Remote Sensing Symposium (IGARSS), Quebec City, QC, Canada, 13–18 July 2014; pp. 1013–1016. [Google Scholar]
- Gosselin, G.; Touzi, R.; Cavayas, F. Polarimetric Radarsat-2 Wetland Classificationusing the Touzi Decomposition: Case of the Lac Saint-Pierre Ramsar Wetland. Can. J. Remote Sens. 2014, 39, 491–506. [Google Scholar] [CrossRef]
- LaRocque, A.; Phiri, C.; Leblon, B.; Pirotti, F.; Connor, K.; Hanson, A. Wetland Mapping with Landsat 8 OLI, Sentinel-1, ALOS-1 PALSAR, and LiDAR Data in Southern New Brunswick, Canada. Remote Sens. 2020, 12, 2095. [Google Scholar] [CrossRef]
- Thomas, V.; Treitz, P.; Jelinski, D.; Miller, J.; Lafleur, P.; McCaughey, J.H. Image Classification of a Northern Peatland Complex Using Spectral and Plant Community Data. Remote Sens. Environ. 2003, 84, 83–99. [Google Scholar] [CrossRef]
- You, Y.; Cao, J.; Zhou, W. A Survey of Change Detection Methods Based on Remote Sensing Images for Multi-Source and Multi-Objective Scenarios. Remote Sens. 2020, 12, 2460. [Google Scholar] [CrossRef]
- Amani, M.; Mahdavi, S.; Berard, O. Supervised Wetland Classification Using High Spatial Resolution Optical, SAR, and LiDAR Imagery. J. Appl. Remote Sens. 2020, 14, 1. [Google Scholar] [CrossRef]
- Amani, M.; Ghorbanian, A.; Ahmadi, S.A.; Kakooei, M.; Moghimi, A.; Mirmazloumi, S.M.; Moghaddam, S.H.A.; Mahdavi, S.; Ghahremanloo, M.; Parsian, S.; et al. Google Earth Engine Cloud Computing Platform for Remote Sensing Big Data Applications: A Comprehensive Review. IEEE J. Sel. Top. Appl. Earth Obs. Remote Sens. 2020, 13, 5326–5350. [Google Scholar] [CrossRef]
- Moghimi, A.; Khazai, S.; Mohammadzadeh, A. An Improved Fast Level Set Method Initialized with a Combination of K-Means Clustering and Otsu Thresholding for Unsupervised Change Detection from SAR Images. Arab. J. Geosci. 2017, 10, 1–18. [Google Scholar] [CrossRef]
- Marti-Cardona, B.; Lopez-Martinez, C.; Dolz-Ripolles, J.; Bladè-Castellet, E. ASAR Polarimetric, Multi-Incidence Angle and Multitemporal Characterization of Doñana Wetlands for Flood Extent Monitoring. Remote Sens. Environ. 2010, 114, 2802–2815. [Google Scholar] [CrossRef]
- Jeglum, J.K.; Boissonneau, A.N. Regional Level of Wetlands Mapping for the Northern Clay Section of Ontario. In Proceedings of the 5th Canadian Symposium on Remote Sensing, Edmonton, AB, Canada, 28–31 August 1978. [Google Scholar]
- Boissonneau, A.N.; Jeglum, J.K. A regional level of wetlands mapping for the northern Clay Section of Ontario. In Proceedings of the 3rd Canadian Symposium on Remote Sensing, Edmonton, AB, Canada, 22–24 September 1975; pp. 349–357. [Google Scholar]
- Wedler, E.; Kessler, R. Interpretation of Vegetative Cover in Wetlands Using Four-Channel SAR Imagery. In Proceedings of the 47th American Society of Photogrammetry, Annual Meeting, Washington, DC, USA, 22–27 February 1981; pp. 111–124. [Google Scholar]
- Hughes, F.M.; Cordes, L.D. Peace-Athabasca Delta—Wetland in Transition ( Alberta, Canada). Geogr. Mag. 1981. [Google Scholar]
- Neraasen, T.G.; Macaulay, A.J.; Mroczynski, R.P. Pintails and Pixels: A Potential Application of Landsat Technology to Waterfowl Habitat Inventory; Purdue University: West Lafayette, IN, USA, 1981. [Google Scholar]
- Watson, E.K.; Ryswyk, V.A.N. Remote Sensing Applications for British Columbia Wetlands Using 35 Mm Aerial Photography. In Proceedings of the 7th Canadian Symposium on Remote Sensing, Winnipeg, MB, Canada, 8–11 September 1981; pp. 211–221. [Google Scholar]
- Tomlins, G.F.; Thomson, K.P.B. Toward an Operational, Satellite-Based, Wetland Monitoring Program for the Fraser River Estuary, British Columbia. In Proceedings of the 7th Canadian Symposium on Remote Sensing, Winnipeg, MB, Canada, 8–11 September 1981; pp. 74–82. [Google Scholar]
- Pala, S.; Boissonneau, A. Wetland Classification Maps for the Hudson Bay Lowland. Le Nat. Can. 1982, 109, 653–659. [Google Scholar]
- Lafrance, P.; Dubois, J.; Bonn, F. Remote Sensing of Humid Environments: Comparison of MSS, TM and SPOT Images [La Teledetection Des Milieux Humides: Comparaison Des Images MSS, TM et SPOT]. Nat. Can. 1987, 114, 433–448. [Google Scholar]
- Lafrance, P.; Dubois, J.; Bonn, F. Enhancement of a SPOT Simulation by Integration of Panchromatic into Multi-Spectral Mode: Example of Wetlands (Canada). Photo Interpret. Images Aeriennes Spat. 1988. [Google Scholar]
- Peddle, D.R.; Franklin, S.E. High Resolution Satellite Image Texture for Moderate Relief Terrain Analysis. In Proceedings of the 12th Canadian Symposium on Remote Sensing Geoscience and Remote Sensing Symposium, Vancouver, BC, Canada, 10–14 July 1989; IEEE: Piscataway, NJ, USA, 1989; Volume 2, pp. 653–655. [Google Scholar]
- Kneppeck, I.D.; Ahern, F.J. Stratification of a Regenerating Burned Forest in Alberta Using Thematic Mapper and C-SAR Images. In Proceedings of the Digest—International Geoscience and Remote Sensing Symposium (IGARSS), Vancouver, BC, Canada, 10–14 July 1989; Volume 3, pp. 1391–1396. [Google Scholar]
- Drieman, J.A.; Leckie, D.G.; Ahern, F.J. Multitemporal C-SAR for Forest Typing in Eastern Ontario. In Proceedings of the 12th Canadian Symposium on Remote Sensing Geoscience and Remote Sensing Symposium, Vancouver, BC, Canada, 10–14 July 1989; IEEE: Piscataway, NJ, USA, 1989; Volume 3, pp. 1376–1378. [Google Scholar]
- Konrad, S.R.; Rempel, R.S. Cost-Effectiveness of Landsat TM Classification by Operations Staff. IEEE Trans. Geosci. Remote Sens. 1990, 28, 769–771. [Google Scholar] [CrossRef]
- Franklin, S.E.; Peddle, D.R. Classification of SPOT HRV Imagery and Texture Features. Remote Sens. 1990, 11, 551–556. [Google Scholar] [CrossRef]
- Matthews, S.B. An Assessment of Bison Habitat in the Mills/Mink Lakes Area, Northwest Territories, Using LANDSAT Thematic Mapper Data. Arctic 1991, 44, 75–80. [Google Scholar] [CrossRef] [Green Version]
- Franklin, S.E.; Gillespie, R.T.; Titus, B.D.; Pike, D.B. Aerial and Satellite Sensor Detection of Kalmia Angustifolia at Forest Regeneration Sites in Central Newfoundland. Int. J. Remote Sens. 1994, 15, 2553–2557. [Google Scholar] [CrossRef]
- Cihlar, J.; Manak, D.; Voisin, N. AVHRR Bidirectional Reflectance Effects and Compositing. Remote Sens. Environ. 1994, 48, 77–88. [Google Scholar] [CrossRef]
- Franklin, S.E.; Titus, B.D.; Gillespie, R.T. Remote Sensing of Vegetation Cover at Forest Regeneration Sites. Glob. Ecol. Biogeogr. Lett. 1994, 4, 40–46. [Google Scholar] [CrossRef]
- Bubier, J.L.; Moore, T.R.; Bellisario, L.; Comer, N.T.; Crill, P.M. Ecological Controls on Methane Emissions from a Northern Peatland Complex in the Zone of Discontinuous Permafrost, Manitoba, Canada. Glob. Biogeochem. Cycles 1995, 9, 455–470. [Google Scholar] [CrossRef]
- Pietroniro, A.; Prowse, T.D.; Lalonde, V. Classifying Terrain in a Muskeg-Wetland Regime for Application to GRU-Type Distributed Hydrologic Models. Can. J. Remote Sens. 1996, 22, 45–52. [Google Scholar] [CrossRef]
- Hall, F.G.; Sellers, P.J.; Williams, D.L. Initial Results from the Boreal Ecosystem-Atmosphere Experiment, BOREAS; The Finnish Society of Forest Science and The Finnish Forest Research Institute: Helsinki, Finland, 1996. [Google Scholar]
- Franklin, S.E.; Gillespie, R.T.; Titus, B.D.; McCaffrey, T.M. Discrimination of Kalmia Angustifolia Using Compact Airborne Spectrographic Imager (CASI) Data. Can. J. Remote Sens. 1997, 23, 71–75. [Google Scholar] [CrossRef]
- Collins, N.; Davis, L. Minimizing Impacts of Highway Construction on Freshwater Wetlands in Nova Scotia. In Ecological Reclamation in Canada at Century’s Turn, Proceedings of the 35th Annual Meeting of the Canadian Society of Environmental Biologists, Regina, SK, Canada, 26–29 September 1995; University of Regina Press: Regina, SK, Canada, 1997; Volume 28, p. 80. [Google Scholar]
- Pietroniro, A.; Prowse, T.; Peters, D.L. Hydrologic Assessment of an Inland Freshwater Delta Using Multi-temporal Satellite Remote Sensing. Hydrol. Process. 1999, 13, 2483–2498. [Google Scholar] [CrossRef]
- Rapalee, G.; Steyaert, L.T.; Hall, F.G. Moss and Lichen Cover Mapping at Local and Regional Scales in the Boreal Forest Ecosystem of Central Canada. J. Geophys. Res. Atmos. 2001, 106, 33551–33563. [Google Scholar] [CrossRef]
- Pietroniro, A.; Leconte, R.; Peters, D.L.; Prowse, T.D. Application of a Hydrodynamic Model in a Freshwater Delta Using Remote Sensing. IAHS Publ. 2001, 519–525. [Google Scholar]
- Hall-Atkinson, C.; Smith, L.C. Delineation of Delta Ecozones Using Interferometric SAR Phase Coherence: Mackenzie River Delta, NWT, Canada. Remote Sens. Environ. 2001, 78, 229–238. [Google Scholar] [CrossRef]
- Sokol, J.; Pultz, T.J.; Bulzgis, V. Monitoring Wetland Hydrology in Atlantic Canada Using Multi-Temporal and Multi-Beam Radarsat Data. IAHS Publ. 2001, 526–530. [Google Scholar]
- Jollineau, M.; Howarth, P. Use of High-Resolution Imagery to Map Wetland Environments in South-Central Ontario, Canada. In Proceedings of the IEEE International Geoscience and Remote Sensing Symposium, Toronto, ON, Canada, 24–28 June 2002; IEEE: Piscataway, NJ, USA, 2002; Volume 5, pp. 3089–3091. [Google Scholar]
- Töyrä, J.; Pietroniro, A.; Martz, L.W.; Prowse, T.D. A Multi-sensor Approach to Wetland Flood Monitoring. Hydrol. Process. 2002, 16, 1569–1581. [Google Scholar] [CrossRef]
- Pietroniro, A.; Toyra, J. A Multi-Sensor Remote Sensing Approach for Monitoring Large Wetland Complexes in Northern Canada. In Proceedings of the IEEE International Geoscience and Remote Sensing Symposium, Toronto, ON, Canada, 24–28 June 2002; IEEE: Piscataway, NJ, USA, 2002; Volume 2, pp. 1069–1072. [Google Scholar]
- Poulin, M.; Careau, D.; Rochefort, L.; Desrochers, A. From Satellite Imagery to Peatland Vegetation Diversity: How Reliable Are Habitat Maps? Conserv. Ecol. 2002, 6. [Google Scholar] [CrossRef] [Green Version]
- Quinton, W.L.; Hayashi, M.; Pietroniro, A. Connectivity and Storage Functions of Channel Fens and Flat Bogs in Northern Basins. Hydrol. Process. 2003, 17, 3665–3684. [Google Scholar] [CrossRef]
- Bernier, M.; Ghedira, H.; Gauthier, Y.; Magagi, R.; Filion, R.; De Seve, D.; Ouarda, T.; Villeneuve, J.P.; Buteau, P. Remote Sensing and Classification Bogs in Quebec Using Radarsat-1 Images. Can. J. Remote Sens. 2003, 29, 88–98. [Google Scholar]
- Arzandeh, S.; Wang, J. Monitoring the Change of Phragmites Distribution Using Satellite Data. Can. J. Remote Sens. 2003, 29, 24–35. [Google Scholar] [CrossRef]
- Havholm, K.G.; Bergstrom, N.D.; Jol, H.M.; Running, G.L. GPR Survey of a Holocene Aeolian/Fluvial/Lacustrine Succession, Lauder Sandhills, Manitoba, Canada. Geol. Soc. Lon. Spec. Publ. 2003, 211, 47–54. [Google Scholar] [CrossRef]
- Wessels, J.; Ball, D.; Prieto, D.F.; Ahern, F. Operational Wetlands Monitoring for the Ramsar Convention: TESEO Powers a Breakthrough. In Proceedings of the IGARSS 2003—2003 IEEE International Geoscience and Remote Sensing Symposium. Proceedings (IEEE Cat. No. 03CH37477), Toulouse, France, 21–25 July 2003; IEEE: Piscataway, NJ, USA, 2003; Volume 3, pp. 1486–1489. [Google Scholar]
- Racine, M.-J.; Bernier, M.; Ouarda, T.B.M.J. Evaluation of RADARSAT-1 Images Acquired in Fine-Beam Mode for Boreal Peatlands: A Study in the La Grande River Watershed, James Bay, Québec, Canada. In Proceedings of the Remote Sensing for Environmental Monitoring, GIS Applications, and Geology IV; International Society for Optics and Photonics: Bellingham, WA, USA, 2004; Volume 5574, pp. 160–171. [Google Scholar]
- Rosenqvist, A.; Shimada, M.; Chapman, B.; McDonald, K.; De Grandi, G.; Jonsson, H.; Williams, C.; Rauste, Y.; Nilsson, M.; Sango, D. An Overview of the JERS-1 SAR Global Boreal Forest Mapping (GBFM) Project. In Proceedings of the IGARSS 2004—2004 IEEE International Geoscience and Remote Sensing Symposium, Anchorage, AK, USA, 20–24 September 2004; IEEE: Piscataway, NJ, USA, 2004; Volume 2, pp. 1033–1036. [Google Scholar]
- Sokol, J.; NcNairn, H.; Pultz, T.J. Case Studies Demonstrating the Hydrological Applications of C-Band Multipolarized and Polarimetric SAR. Can. J. Remote Sens. 2004, 30, 470–483. [Google Scholar] [CrossRef]
- Tedford, B.; Hopkins, N.; Boychuk, L.; Kazmerik, B. “The Harder You Look, the More Wetlands You Will Find”. An Evaluation of Wetland Identification Methods Utilizing Medium and High-Resolution Data Sources in the Glaciated Prairie Region of Canada. In Proceedings of the 26th Canadian Symposium on Remote Sensing, Wolfville, NS, Canada, 14–16 June 2005; p. 319. [Google Scholar]
- Grenier, M.; Demers, A.-M.; Labrecque, S.; Fournier, R.A.; Drolet, B.; Benoit, M. A Classification Method to Map Wetlands in Quebec for the Canadian Wetland Inventory Using a Top-down Approach with Object-Oriented Segmentation. In Proceedings of the 26th Canadian Symposium on Remote Sensing, Wolfville, NS, Canada, 14–16 June 2005. [Google Scholar]
- Cheng, W.F.; Satish, M.G.; Liu, L.; Pomeroy, J.; Mahoney, M. Development of an Integrated GIS and Remote Sensing Geodatabase for Wetland Assessment along a Proposed Highway in Southern Labrador, Canada. In Proceedings of the Annual Conference—Canadian Society for Civil Engineering, Toronto, ON, Canada, 2–4 June 2005; pp. EV-159-1–EV-159-9. [Google Scholar]
- Ju, W.; Chen, J.M. Distribution of Soil Carbon Stocks in Canada’s Forests and Wetlands Simulated Based on Drainage Class, Topography and Remotely Sensed Vegetation Parameters. Hydrol. Process. Int. J. 2005, 19, 77–94. [Google Scholar] [CrossRef]
- Hudon, C.; Gagnon, P.; Jean, M. Hydrological Factors Controlling the Spread of Common Reed (Phragmites Australis) in TheSt. Lawrence River (Québec, Canada). Ecoscience 2005, 12, 347–357. [Google Scholar] [CrossRef]
- Niemann, K.O.; Moore, K.; Stockler, C.; Beaudet, F. Identification Coastal Seagrasses through the Fusion of Landsat and RADARSAT Imagery. In Proceedings of the 26th Canadian Symposium on Remote Sensing, Wolfville, NS, Canada, 14–16 June 2005; p. 483. [Google Scholar]
- Smith, K.B.; Smith, C.E.; Richard, A.J. Mapping the Boreal Forest Using an Object-Oriented Earthcover Classification. In Proceedings of the 26th Canadian Symposium on Remote Sensing, Wolfville, NS, Canada, 14–16 June 2005; p. 223. [Google Scholar]
- Li, J.; Chen, W.; Touzi, R. SAR Backscatter Characteristics of Wetlands in Mer Bleue. In Proceedings of the 26th Canadian Symposium on Remote Sensing, Wolfville, NS, Canada, 14–16 June 2005; p. 485. [Google Scholar]
- Töyrä, J.; Pietroniro, A. Towards Operational Monitoring of a Northern Wetland Using Geomatics-Based Techniques. Remote Sens. Environ. 2005, 97, 174–191. [Google Scholar] [CrossRef]
- Mialon, A.; Royer, A.; Fily, M. Wetland Seasonal Dynamics and Interannual Variability over Northern High Latitudes, Derived from Microwave Satellite Data. J. Geophys. Res. Atmos. 2005, 110. [Google Scholar] [CrossRef] [Green Version]
- Brown, L.; Young, K.L. Assessment of Three Mapping Techniques to Delineate Lakes and Ponds in a Canadian High Arctic Wetland Complex. Arctic 2006, 59, 283–293. [Google Scholar] [CrossRef] [Green Version]
- Prowse, T.D.; Beltaos, S.; Gardner, J.T.; Gibson, J.J.; Granger, R.J.; Leconte, R.; Peters, D.L.; Pietroniro, A.; Romolo, L.A.; Toth, B. Climate Change, Flow Regulation and Land-Use Effects on the Hydrology of the Peace-Athabasca-Slave System; Findings from the Northern Rivers Ecosystem Initiative. Environ. Monit. Assess. 2006, 113, 167–197. [Google Scholar] [CrossRef] [PubMed] [Green Version]
- Peters, D.L.; Prowse, T.D.; Pietroniro, A.; Leconte, R. Flood Hydrology of the Peace-Athabasca Delta, Northern Canada. Hydrol. Process. Int. J. 2006, 20, 4073–4096. [Google Scholar] [CrossRef]
- Dillabaugh, K.; King, D. Wetland Composition and Productivity Mapping Using Ikonos Imagery. In Proceedings of the American Society for Photogrammetry and Remote Sensing—20th Biennial Workshop on Aerial Photography, Videography, and High Resolution Digital Imagery for Resource Assessment, Weslaco, TX, USA, 4–6 October 2005; pp. 516–523. [Google Scholar]
- Li, J.; Chen, W.; Touzi, R. Optimum RADARSAT-1 Configurations for Wetlands Discrimination: A Case Study of the Mer Bleue Peat Bog. Can. J. Remote Sens. 2007, 33, S46–S55. [Google Scholar] [CrossRef]
- Stevens, C.E.; Paszkowski, C.A.; Foote, A.L. Beaver (Castor Canadensis) as a Surrogate Species for Conserving Anuran Amphibians on Boreal Streams in Alberta, Canada. Biol. Conserv. 2007, 134, 1–13. [Google Scholar] [CrossRef]
- Fournier, R.A.; Grenier, M.; Lavoie, A.; Hélie, R. Towards a Strategy to Implement the Canadian Wetland Inventory Using Satellite Remote Sensing. Can. J. Remote Sens. 2007, 33, S1–S16. [Google Scholar] [CrossRef]
- Touzi, R.; Deschamps, A.; Rother, G. Wetland Characterization Using Polarimetric RADARSAT-2 Capability. Can. J. Remote Sens. 2007, 33, S56–S67. [Google Scholar] [CrossRef]
- Hogg, A.R.; Holland, J. An Evaluation of DEMs Derived from LiDAR and Photogrammetry for Wetland Mapping. For. Chron. 2008, 84, 840–849. [Google Scholar] [CrossRef] [Green Version]
- Sass, G.Z.; Creed, I.F. Characterizing Hydrodynamics on Boreal Landscapes Using Archived Synthetic Aperture Radar Imagery. Hydrol. Process. Int. J. 2008, 22, 1687–1699. [Google Scholar] [CrossRef]
- Liu, Y.; Yang, W.; Wang, X. Development of a SWAT Extension Module to Simulate Riparian Wetland Hydrologic Processes at a Watershed Scale. Hydrol. Process. Int. J. 2008, 22, 2901–2915. [Google Scholar] [CrossRef]
- Creed, I.F.; Sass, G.Z.; Wolniewicz, M.B.; Devito, K.J. Incorporating Hydrologic Dynamics into Buffer Strip Design on the Sub-Humid Boreal Plain of Alberta. For. Ecol. Manag. 2008, 256, 1984–1994. [Google Scholar] [CrossRef]
- Touzi, R.; Deschamps, A.; Rother, G. Scattering Type Phase for Wetland Classification Using C-Band Polarimetric SAR. In Proceedings of the IGARSS 2008—2008 IEEE International Geoscience and Remote Sensing Symposium, Boston, MA, USA, 7–11 July 2008; IEEE: Piscataway, NJ, USA, 2008; Volume 2, p. II-285. [Google Scholar]
- Harris, A.; Bryant, R.G. A Multi-Scale Remote Sensing Approach for Monitoring Northern Peatland Hydrology: Present Possibilities and Future Challenges. J. Environ. Manag. 2009, 90, 2178–2188. [Google Scholar] [CrossRef]
- Rosa, E.; Larocque, M.; Pellerin, S.; Gagné, S.; Fournier, B. Determining the Number of Manual Measurements Required to Improve Peat Thickness Estimations by Ground Penetrating Radar. Earth Surf. Process. Landforms 2009, 34, 377–383. [Google Scholar] [CrossRef]
- Raynolds, M.K.; Walker, D.A. Effects of Deglaciation on Circumpolar Distribution of Arctic Vegetation. Can. J. Remote Sens. 2009, 35, 118–129. [Google Scholar] [CrossRef]
- Pirie, L.; Francis, C.; Johnston, V. Evaluating the Potential Impact of a Gas Pipeline on Whimbrel Breeding Habitat in the Outer Mackenzie Delta, Northwest Territories. Avian Conserv. Ecol. 2009, 4, 2. [Google Scholar] [CrossRef] [Green Version]
- Spooner, I.; Stevens, G.; Morrow, J.; Pufahl, P.; Grieve, R.; Raeside, R.; Pilon, J.; Stanley, C.; Barr, S.; McMullin, D. Identification of the Bloody Creek Structure, a Possible Impact Crater in Southwestern Nova Scotia, Canada. Meteorit. Planet. Sci. 2009, 44, 1193–1202. [Google Scholar] [CrossRef]
- Clark, R.B.; Creed, I.F.; Sass, G.Z. Mapping Hydrologically Sensitive Areas on the Boreal Plain: A Multitemporal Analysis of ERS Synthetic Aperture Radar Data. Int. J. Remote Sens. 2009, 30, 2619–2635. [Google Scholar] [CrossRef]
- Fang, X.; Pomeroy, J.W. Modelling Blowing Snow Redistribution to Prairie Wetlands. Hydrol. Process. Int. J. 2009, 23, 2557–2569. [Google Scholar] [CrossRef]
- Touzi, R.; Deschamps, A.; Demers, A.M.; Rother, G. The Touzi Decomposition for Wetland Classification Using Polarimetric C-Band SAR. In Proceedings of the 4th Int. Workshop Sci. Appl. SAR Polarimetry Polarimetric Interferometry (PolInSAR), Frascati, Italy, 26–30 January 2009; p. 261. [Google Scholar]
- Touzi, R.; Deschamps, A.; Rother, G. Phase of Target Scattering for Wetland Characterization Using Polarimetric C-Band SAR. IEEE Trans. Geosci. Remote Sens. 2009, 47, 3241–3261. [Google Scholar] [CrossRef]
- Maxie, A.J.; Hussey, K.F.; Lowe, S.J.; Middel, K.R.; Pond, B.A.; Obbard, M.E.; Patterson, B.R. A Comparison of Forest Resource Inventory, Provincial Land Cover Maps and Field Surveys for Wildlife Habitat Analysis in the Great Lakes–St. Lawrence Forest. For. Chron. 2010, 86, 77–86. [Google Scholar] [CrossRef] [Green Version]
- Soverel, N.O.; Coops, N.C.; White, J.C.; Wulder, M.A. Characterizing the Forest Fragmentation of Canada’s National Parks. Environ. Monit. Assess. 2010, 164, 481–499. [Google Scholar] [CrossRef] [PubMed]
- Levrel, G.; Rousseau, A.N. Étalonnage de Sondes FDR («frequency Domain Reflectometry») Sur Les Cinq Premiers Centimètres Des Sols et Des Couverts de Bryophytes de Deux Tourbières Minérotrophes Du Milieu Boréal Québécois (Canada). Can. J. Remote Sens. 2010, 36, 313–331. [Google Scholar] [CrossRef]
- Sannel, A.B.K.; Brown, I.A. High-Resolution Remote Sensing Identification of Thermokarst Lake Dynamics in a Subarctic Peat Plateau Complex. Can. J. Remote Sens. 2010, 36, S26–S40. [Google Scholar] [CrossRef]
- Neta, T.; Cheng, Q.; Bello, R.L.; Hu, B. Lichens and Mosses Moisture Content Assessment through High-spectral Resolution Remote Sensing Technology: A Case Study of the Hudson Bay Lowlands, Canada. Hydrol. Process. 2010, 24, 2617–2628. [Google Scholar] [CrossRef]
- Midwood, J.D.; Chow-Fraser, P. Mapping Floating and Emergent Aquatic Vegetation in Coastal Wetlands of Eastern Georgian Bay, Lake Huron, Canada. Wetlands 2010, 30, 1141–1152. [Google Scholar] [CrossRef]
- Touzi, R.; Gosselin, G. Peatland Subsurface Water Flow Monitoring Using Polarimetric L-Band PALSAR. In Proceedings of the 2010 IEEE International Geoscience and Remote Sensing Symposium, Honolulu, HI, USA, 25–30 July 2010; IEEE: Piscataway, NJ, USA, 2010; pp. 750–753. [Google Scholar]
- Fang, X.; Pomeroy, J.W.; Westbrook, C.J.; Guo, X.; Minke, A.G.; Brown, T. Prediction of Snowmelt Derived Streamflow in a Wetland Dominated Prairie Basin. Hydrol. Earth Syst. Sci. 2010, 14, 991–1006. [Google Scholar] [CrossRef] [Green Version]
- Brisco, B.; Kapfer, M.; Hirose, T.; Tedford, B.; Liu, J. Evaluation of C-Band Polarization Diversity and Polarimetry for Wetland Mapping. Can. J. Remote Sens. 2011, 37, 82–92. [Google Scholar] [CrossRef]
- Crowell, N.; Webster, T.; O’Driscoll, N.J. GIS Modelling of Intertidal Wetland Exposure Characteristics. J. Coast. Res. 2011, 27, 44–51. [Google Scholar] [CrossRef]
- Quinton, W.L.; Hayashi, M.; Chasmer, L.E. Permafrost-Thaw-Induced Land-Cover Change in the Canadian Subarctic: Implications for Water Resources. Hydrol. Process. 2011, 25, 152–158. [Google Scholar] [CrossRef]
- Rokitnicki-Wojcik, D.; Wei, A.; Chow-Fraser, P. Transferability of Object-Based Rule Sets for Mapping Coastal High Marsh Habitat among Different Regions in Georgian Bay, Canada. Wetl. Ecol. Manag. 2011, 19, 223–236. [Google Scholar] [CrossRef]
- Muskett, R.R.; Romanovsky, V.E. Alaskan Permafrost Groundwater Storage Changes Derived from GRACE and Ground Measurements. Remote Sens. 2011, 3, 378–397. [Google Scholar] [CrossRef] [Green Version]
- Chen, B.; Coops, N.C.; Fu, D.; Margolis, H.A.; Amiro, B.D.; Barr, A.G.; Black, T.A.; Arain, M.A.; Bourque, C.P.-A.; Flanagan, L.B. Assessing Eddy-Covariance Flux Tower Location Bias across the Fluxnet-Canada Research Network Based on Remote Sensing and Footprint Modelling. Agric. For. Meteorol. 2011, 151, 87–100. [Google Scholar] [CrossRef]
- Neta, T.; Cheng, Q.; Bello, R.L.; Hu, B. Development of New Spectral Reflectance Indices for the Detection of Lichens and Mosses Moisture Content in the Hudson Bay Lowlands, Canada. Hydrol. Process. 2011, 25, 933–944. [Google Scholar] [CrossRef]
- Hogan, D.; Thompson, J.E.; Esler, D.; Boyd, W.S. Discovery of Important Postbreeding Sites for Barrow’s Goldeneye in the Boreal Transition Zone of Alberta. Waterbirds Int. J. Waterbird Biol. 2011, 34, 261–268. [Google Scholar] [CrossRef]
- Shook, K.R.; Pomeroy, J.W. Memory Effects of Depressional Storage in Northern Prairie Hydrology. Hydrol. Process. 2011, 25, 3890–3898. [Google Scholar] [CrossRef]
- Fraser, S.; Storie, S. Detecting Historic Wetlands Using Radar Data: A Review. In Proceedings of the 2012 IEEE International Geoscience and Remote Sensing Symposium, Munich, Germany, 22–27 July 2012; IEEE: Piscataway, NJ, USA, 2012; pp. 772–774. [Google Scholar]
- Guo, X.; Pomeroy, J.W.; Fang, X.; Lowe, S.; Li, Z.; Westbrook, C.; Minke, A. Effects of Classification Approaches on CRHM Model Performance. Remote Sens. Lett. 2012, 3, 39–47. [Google Scholar] [CrossRef]
- Barker, R.; King, D.J. Blanding’s Turtle (Emydoidea Blandingii) Potential Habitat Mapping Using Aerial Orthophotographic Imagery and Object Based Classification. Remote Sens. 2012, 4, 194–219. [Google Scholar] [CrossRef] [Green Version]
- Kaya, S.; Brisco, B.; Cull, A.; Gallant, A.; Sadinski, W.; Thompson, D. Canadian SAR Remote Sensing for the Terrestrial Wetland Global Change Research Network (TWGCRN). In Proceedings of the Remote Sensing and Hydrology 2010 Symposium, Jackson Hole, WY, USA, 27–30 September 2010; Volume 2730. [Google Scholar]
- Pivot, F.C. C-Band SAR Imagery for Snow-Cover Monitoring at Treeline, Churchill, Manitoba, Canada. Remote Sens. 2012, 4, 2133–2155. [Google Scholar] [CrossRef] [Green Version]
- Midwood, J.D.; Chow-Fraser, P. Changes in Aquatic Vegetation and Fish Communities Following 5 Years of Sustained Low Water Levels in Coastal Marshes of Eastern G Eorgian B Ay, L Ake H Uron. Glob. Chang. Biol. 2012, 18, 93–105. [Google Scholar] [CrossRef]
- Gala, T.S.; Melesse, A.M. Monitoring Prairie Wet Area with an Integrated LANDSAT ETM+, RADARSAT-1 SAR and Ancillary Data from LIDAR. Catena 2012, 95, 12–23. [Google Scholar] [CrossRef]
- Chen, W.; Foy, N.; Olthof, I.; Latifovic, R.; Zhang, Y.; Li, J.; Fraser, R.; Chen, Z.; McLennan, D.; Poitevin, J. Evaluating and Reducing Errors in Seasonal Profiles of AVHRR Vegetation Indices over a Canadian Northern National Park Using a Cloudiness Index. Int. J. Remote Sens. 2013, 34, 4320–4343. [Google Scholar] [CrossRef]
- Doiron, M.; Legagneux, P.; Gauthier, G.; Lévesque, E. Broad-scale Satellite N Ormalized D Ifference V Egetation I Ndex Data Predict Plant Biomass and Peak Date of Nitrogen Concentration in A Rctic Tundra Vegetation. Appl. Veg. Sci. 2013, 16, 343–351. [Google Scholar] [CrossRef]
- McClymont, A.F.; Hayashi, M.; Bentley, L.R.; Christensen, B.S. Geophysical Imaging and Thermal Modeling of Subsurface Morphology and Thaw Evolution of Discontinuous Permafrost. J. Geophys. Res. Earth Surf. 2013, 118, 1826–1837. [Google Scholar] [CrossRef]
- Lapointe, J.; Imbeau, L.; Tremblay, J.A.; Maisonneuve, C.; Mazerolle, M.J. Habitat Use by Female Peregrine Falcons (Falco Peregrinus) in an Agricultural Landscape. Auk 2013, 130, 381–391. [Google Scholar] [CrossRef]
- Huschle, G.; Toepfer, J.E.; Douglas, D.C. Migration and Wintering Areas of American Bitterns (Botaurus Lentiginosus) That Summer in Central North America as Determined by Satellite and Radio Telemetry, 1998–2003. Waterbirds 2013, 36, 300–309. [Google Scholar] [CrossRef]
- Mattar, K.E. Monitoring the Persistence of Odd and Even Scatterers in a Mixed Urban Environment Using Pol-InSAR Acquisitions. Can. J. Remote Sens. 2013, 39, 34–41. [Google Scholar] [CrossRef]
- Jacome, A.; Bernier, M.; Chokmani, K.; Gauthier, Y.; Poulin, J.; De Sève, D. Monitoring Volumetric Surface Soil Moisture Content at the La Grande Basin Boreal Wetland by Radar Multi Polarization Data. Remote Sens. 2013, 5, 4919–4941. [Google Scholar] [CrossRef] [Green Version]
- Banks, S.N.; King, D.J.; Merzouki, A.; Duffe, J. Assessing RADARSAT-2 for Mapping Shoreline Cleanup and Assessment Technique (SCAT) Classes in the Canadian Arctic. Can. J. Remote Sens. 2014, 40, 243–267. [Google Scholar] [CrossRef]
- Banks, S.N.; King, D.J.; Merzouki, A.; Duffe, J. Characterizing Scattering Behaviour and Assessing Potential for Classification of Arctic Shore and Near-Shore Land Covers with Fine Quad-Pol RADARSAT-2 Data. Can. J. Remote Sens. 2014, 40, 291–314. [Google Scholar] [CrossRef]
- Ahern, F.J.; Brisco, B.; Murnaghan, K.; White, L.; Wdowinski, S.; Hong, S.-H.; Atwood, D. PolSAR Imaging of Wetlands: New Insights into Backscatter Physics. In Proceedings of the 2014 IEEE Geoscience and Remote Sensing Symposium, Quebec City, QC, Canada, 13–18 July 2014; IEEE: Piscataway, NJ, USA, 2014; pp. 1171–1174. [Google Scholar]
- Armenakis, C.; Alexandridis, T.; Nirupama, N.; Zalidis, G. A Study on Degradation of Coastal Wetlands Using Examples from Greece and Canada. Int. J. Ecol. Dev. 2014, 29. [Google Scholar]
- Ely, C.R.; Sladen, W.J.L.; Wilson, H.M.; Savage, S.E.; Sowl, K.M.; Henry, B.; Schwitters, M.; Snowdon, J. Delineation of Tundra Swan Cygnus c. Columbianus Populations in North America: Geographic Boundaries and Interchange. Wildfowl 2014, 64, 132–147. [Google Scholar]
- Chabot, D.; Carignan, V.; Bird, D.M. Measuring Habitat Quality for Least Bitterns in a Created Wetland with Use of a Small Unmanned Aircraft. Wetlands 2014, 34, 527–533. [Google Scholar] [CrossRef]
- Cable, J.W.; Kovacs, J.M.; Shang, J.; Jiao, X. Multi-Temporal Polarimetric RADARSAT-2 for Land Cover Monitoring in Northeastern Ontario, Canada. Remote Sens. 2014, 6, 2372–2392. [Google Scholar] [CrossRef] [Green Version]
- Nelson, T.A.; Coops, N.C.; Wulder, M.A.; Perez, L.; Fitterer, J.; Powers, R.; Fontana, F. Predicting Climate Change Impacts to the Canadian Boreal Forest. Diversity 2014, 6, 133–157. [Google Scholar] [CrossRef] [Green Version]
- Clare, S.; Creed, I.F. Tracking Wetland Loss to Improve Evidence-Based Wetland Policy Learning and Decision Making. Wetl. Ecol. Manag. 2014, 22, 235–245. [Google Scholar] [CrossRef]
- Bourgeau-Chavez, L.; Endres, S.; Battaglia, M.; Miller, M.E.; Banda, E.; Laubach, Z.; Higman, P.; Chow-Fraser, P.; Marcaccio, J. Development of a Bi-National Great Lakes Coastal Wetland and Land Use Map Using Three-Season PALSAR and Landsat Imagery. Remote Sens. 2015, 7, 8655–8682. [Google Scholar] [CrossRef] [Green Version]
- Umbanhowar Jr, C.E.; Camill, P.; Edlund, M.B.; Geiss, C.; Henneghan, P.; Passow, K. Lake–Landscape Connections at the Forest–Tundra Transition of Northern Manitoba. Inland Waters 2015, 5, 57–74. [Google Scholar] [CrossRef] [Green Version]
- Sagin, J.; Sizo, A.; Wheater, H.; Jardine, T.D.; Lindenschmidt, K.-E. A Water Coverage Extraction Approach to Track Inundation in the Saskatchewan River Delta, Canada. Int. J. Remote Sens. 2015, 36, 764–781. [Google Scholar] [CrossRef]
- Dingle Robertson, L.; King, D.J.; Davies, C. Assessing Land Cover Change and Anthropogenic Disturbance in Wetlands Using Vegetation Fractions Derived from Landsat 5 TM Imagery (1984–2010). Wetlands 2015, 35, 1077–1091. [Google Scholar] [CrossRef]
- Kalacska, M.; Lalonde, M.; Moore, T.R. Estimation of Foliar Chlorophyll and Nitrogen Content in an Ombrotrophic Bog from Hyperspectral Data: Scaling from Leaf to Image. Remote Sens. Environ. 2015, 169, 270–279. [Google Scholar] [CrossRef]
- Kotchi, S.O.; Brazeau, S.; Turgeon, P.; Pelcat, Y.; Légaré, J.; Lavigne, M.-P.; Essono, F.N.; Fournier, R.A.; Michel, P. Evaluation of Earth Observation Systems for Estimating Environmental Determinants of Microbial Contamination in Recreational Waters. IEEE J. Sel. Top. Appl. Earth Obs. Remote Sens. 2015, 8, 3730–3741. [Google Scholar] [CrossRef]
- Tougas-Tellier, M.; Morin, J.; Hatin, D.; Lavoie, C. Freshwater Wetlands: Fertile Grounds for the Invasive P Hragmites Australis in a Climate Change Context. Ecol. Evol. 2015, 5, 3421–3435. [Google Scholar] [CrossRef]
- Messmer, D.J.; Petrie, S.A.; Badzinski, S.S.; Gloutney, M.L.; Schummer, M.L. Habitat Associations of Breeding Mallards and Canada Geese in Southern Ontario, Canada. Wildl. Soc. Bull. 2015, 39, 543–552. [Google Scholar] [CrossRef]
- Brisco, B.; Ahern, F.; Hong, S.-H.; Wdowinski, S.; Murnaghan, K.; White, L.; Atwood, D.K. Polarimetric Decompositions of Temperate Wetlands at C-Band. IEEE J. Sel. Top. Appl. Earth Obs. Remote Sens. 2015, 8, 3585–3594. [Google Scholar] [CrossRef]
- Muster, S.; Langer, M.; Abnizova, A.; Young, K.L.; Boike, J. Spatio-Temporal Sensitivity of MODIS Land Surface Temperature Anomalies Indicates High Potential for Large-Scale Land Cover Change Detection in Arctic Permafrost Landscapes. Remote Sens. Environ. 2015, 168, 1–12. [Google Scholar] [CrossRef] [Green Version]
- Jiao, X.; Zhang, Y.; Guindon, B. Synergistic Use of RADARSAT-2 Ultra Fine and Fine Quad-Pol Data to Map Oilsands Infrastructure Land: Object-Based Approach. Int. J. Appl. Earth Obs. Geoinf. 2015, 38, 193–203. [Google Scholar] [CrossRef]
- Li-Chee-Ming, J.; Murnaghan, K.; Sherman, D.; Poncos, V.; Brisco, B.; Armenakis, C. Validation of Spaceborne Radar Surface Water Mapping with Optical SUAS Images. Int. Arch. Photogramm. Remote Sens. Spat. Inf. Sci. 2015, 40, 363. [Google Scholar] [CrossRef] [Green Version]
- Thompson, S.D.; Nelson, T.A.; Giesbrecht, I.; Frazer, G.; Saunders, S.C. Data-Driven Regionalization of Forested and Non-Forested Ecosystems in Coastal British Columbia with LiDAR and RapidEye Imagery. Appl. Geogr. 2016, 69, 35–50. [Google Scholar] [CrossRef]
- Marcaccio, J.V.; Chow-Fraser, P. Mapping Options to Track Invasive Phragmites Australis in the Great Lakes Basin in Canada. In Proceedings of the 3rd International Conference “Water Resources and Wetlands”, Tulcea, Romania, 8–10 September 2014. [Google Scholar]
- Chasmer, L.; Hopkinson, C.; Montgomery, J.; Petrone, R. A Physically Based Terrain Morphology and Vegetation Structural Classification for Wetlands of the Boreal Plains, Alberta, Canada. Can. J. Remote Sens. 2016, 42, 521–540. [Google Scholar] [CrossRef]
- Spence, C.; Mengistu, S. Deployment of an Unmanned Aerial System to Assist in Mapping an Intermittent Stream. Hydrol. Process. 2016, 30, 493–500. [Google Scholar] [CrossRef]
- Shinneman, A.L.C.; Umbanhowar, C.E.; Edlund, M.B.; Hobbs, W.O.; Camill, P.; Geiss, C. Diatom Assemblages Reveal Regional-Scale Differences in Lake Responses to Recent Climate Change at the Boreal-Tundra Ecotone, Manitoba, Canada. J. Paleolimnol. 2016, 56, 275–298. [Google Scholar] [CrossRef]
- Finger, T.A.; Afton, A.D.; Schummer, M.L.; Petrie, S.A.; Badzinski, S.S.; Johnson, M.A.; Szymanski, M.L.; Jacobs, K.J.; Olsen, G.H.; Mitchell, M.A. Environmental Factors Influence Lesser Scaup Migration Chronology and Population Monitoring. J. Wildl. Manag. 2016, 80, 1437–1449. [Google Scholar] [CrossRef]
- Miller, S.M.; Commane, R.; Melton, J.R.; Andrews, A.E.; Benmergui, J.; Dlugokencky, E.J.; Janssens-Maenhout, G.; Michalak, A.M.; Sweeney, C.; Worthy, D.E.J. Evaluation of Wetland Methane Emissions across North America Using Atmospheric Data and Inverse Modeling. Biogeosciences 2016, 13, 1329–1339. [Google Scholar] [CrossRef] [Green Version]
- Kross, A.; Seaquist, J.W.; Roulet, N.T. Light Use Efficiency of Peatlands: Variability and Suitability for Modeling Ecosystem Production. Remote Sens. Environ. 2016, 183, 239–249. [Google Scholar] [CrossRef]
- Shodimu, O.; Al-Tahir, R. Modeling Land Cover Dynamics to Assess the Sustainability of Wetland Services: A Case Study of the Grand Lake Meadows, Canada. In Proceedings of the IOP Conference Series: Earth and Environmental Science, Halifax, NS, Canada, 5–9 October 2015; Volume 34, p. 12033. [Google Scholar]
- Schmitt, A.; Wendleder, A.; Murnaghan, K.; Brisco, B.; Poncos, V. Multi-Sensor Wetland Mapping over the Peace Athabasca Delta. In Proceedings of the EUSAR 2016: 11th European Conference on Synthetic Aperture Radar, Hamburg, Germany, 6–9 June 2016; pp. 1–4. [Google Scholar]
- Emmerton, C.A.; St. Louis, V.L.; Humphreys, E.R.; Gamon, J.A.; Barker, J.D.; Pastorello, G.Z. Net Ecosystem Exchange of CO2 with Rapidly Changing High Arctic Landscapes. Glob. Chang. Biol. 2016, 22, 1185–1200. [Google Scholar] [CrossRef]
- Serran, J.N.; Creed, I.F. New Mapping Techniques to Estimate the Preferential Loss of Small Wetlands on Prairie Landscapes. Hydrol. Process. 2016, 30, 396–409. [Google Scholar] [CrossRef]
- Bolanos, S.; Stiff, D.; Brisco, B.; Pietroniro, A. Operational Surface Water Detection and Monitoring Using Radarsat 2. Remote Sens. 2016, 8, 285. [Google Scholar] [CrossRef] [Green Version]
- Morsy, S.; Shaker, A.; El-Rabbany, A. Potential Use of Multispectral Airborne LiDAR Data in Land Cover Classification. In Proceedings of the Asian conference on Remote Sensing (ACRS), Colombo, Sri Lanka, 17–21 October 2016; pp. 17–21. [Google Scholar]
- van der Kamp, G.; Hayashi, M.; Bedard-Haughn, A.; Pennock, D. Prairie Pothole Wetlands--Suggestions for Practical and Objective Definitions and Terminology. Wetlands 2016, 36, 229–235. [Google Scholar] [CrossRef]
- Sizo, A.; Noble, B.F.; Bell, S. Strategic Environmental Assessment Framework for Landscape-Based, Temporal Analysis of Wetland Change in Urban Environments. Environ. Manag. 2016, 57, 696–710. [Google Scholar] [CrossRef] [PubMed]
- Ullmann, T.; Schmitt, A.; Jagdhuber, T. Two Component Decomposition of Dual Polarimetric HH/VV SAR Data: Case Study for the Tundra Environment of the Mackenzie Delta Region, Canada. Remote Sens. 2016, 8, 1027. [Google Scholar] [CrossRef] [Green Version]
- Amani, M.; Salehi, B.; Mahdavi, S.; Granger, J.; Brisco, B. Evaluation of Multi-Temporal Landsat 8 Data for Wetland Classification in Newfoundland, Canada. In Proceedings of the International Geoscience and Remote Sensing Symposium (IGARSS), Fort Worth, TX, USA, 23–28 July 2017; pp. 6229–6231. [Google Scholar]
- Mahdianpari, M.; Salehi, B.; Mohammadimanesh, F. The Effect of PolSAR Image De-Speckling on Wetland Classification: Introducing a New Adaptive Method. Can. J. Remote Sens. 2017, 43, 485–503. [Google Scholar] [CrossRef]
- Lovitt, J.; Rahman, M.M.; McDermid, G.J. Assessing the Value of UAV Photogrammetry for Characterizing Terrain in Complex Peatlands. Remote Sens. 2017, 9, 715. [Google Scholar] [CrossRef] [Green Version]
- Kim, S.; Brisco, B.; Poncos, V. Inundation Extent Monitoring with Smap Data for Carbon Studies. In Proceedings of the International Geoscience and Remote Sensing Symposium (IGARSS), Fort Worth, TX, USA, 23–28 July 2017; pp. 5693–5696. [Google Scholar]
- Mohammadimanesh, F.; Bahram, S.; Brisco, B.; Mahdianpari, M. Monitoring of Wetland Water Levels in Newfoundland and Labrador Using Interferometric Synthetic Aperture Radar (INSAR) Technique. In Proceedings of the Asprs IGTF2017, Baltimore MD, USA, 12–16 March 2017. [Google Scholar]
- Dabboor, M.; Brisco, B.; Banks, S.; Murnaghan, K.; White, L. Multitemporal Monitoring of Wetlands Using Simulated Radarsat Constellation Mission Compact Polarimetric SAR Data. In Proceedings of the International Geoscience and Remote Sensing Symposium (IGARSS), Fort Worth, TX, USA, 23–28 July 2017; pp. 4586–4589. [Google Scholar]
- Chabot, D.; Dillon, C.; Ahmed, O.; Shemrock, A. Object-Based Analysis of Uas Imagery to Map Emergent and Submerged Invasive Aquatic Vegetation: A Case Study. J. Unmanned Veh. Syst. 2016, 5, 27–33. [Google Scholar] [CrossRef] [Green Version]
- Perreault, N.; Lévesque, E.; Fortier, D.; Gratton, D.; Lamarque, L.J. Remote Sensing Evaluation of High Arctic Wetland Depletion Following Permafrost Disturbance by Thermo-Erosion Gullying Processes. Arct. Sci. 2017, 3, 237–253. [Google Scholar] [CrossRef] [Green Version]
- Ullmann, T.; Banks, S.N.; Schmitt, A.; Jagdhuber, T. Scattering Characteristics of X-, C- and L-Band Polsar Data Examined for the Tundra Environment of the Tuktoyaktuk Peninsula, Canada. Appl. Sci. 2017, 7, 595. [Google Scholar] [CrossRef] [Green Version]
- Brisco, B.; Ahern, F.; Murnaghan, K.; White, L.; Canisus, F.; Lancaster, P. Seasonal Change in Wetland Coherence as an Aid to Wetland Monitoring. Remote Sens. 2017, 9, 158. [Google Scholar] [CrossRef] [Green Version]
- Mohammadimanesh, F.; Salehi, B.; Mahdianpari, M.; Motagh, M.; Brisco, B. An Efficient Feature Optimization for Wetland Mapping by Synergistic Use of SAR Intensity, Interferometry, and Polarimetry Data. Int. J. Appl. Earth Obs. Geoinf. 2018, 73, 450–462. [Google Scholar] [CrossRef]
- D’Acunha, B.; Lee, S.C.; Johnson, M.S. Ecohydrological Responses to Rewetting of a Highly Impacted Raised Bog Ecosystem. Ecohydrology 2018, 11, e1922. [Google Scholar] [CrossRef]
- Ahern, F.; Brisco, B.; Murnaghan, K.; Lancaster, P.; Atwood, D.K. Insights into Polarimetric Processing for Wetlands from Backscatter Modeling and Multi-Incidence Radarsat-2 Data. IEEE J. Sel. Top. Appl. Earth Obs. Remote Sens. 2018, 11, 3040–3050. [Google Scholar] [CrossRef]
- Whitley, M.A.; Frost, G.V.; Jorgenson, M.T.; Macander, M.J.; Maio, C.V.; Winder, S.G. Assessment of LiDAR and Spectral Techniques for High-Resolution Mapping of Sporadic Permafrost on the Yukon-Kuskokwim Delta, Alaska. Remote Sens. 2018, 10, 258. [Google Scholar] [CrossRef] [Green Version]
- Jorgenson, T.M.; Frost, G.V.; Dissing, D. Drivers of Landscape Changes in Coastal Ecosystems on the Yukon-Kuskokwim Delta, Alaska. Remote Sens. 2018, 10, 1280. [Google Scholar] [CrossRef] [Green Version]
- Ward, E.M.; Gorelick, S.M. Drying Drives Decline in Muskrat Population in the Peace-Athabasca Delta, Canada. Environ. Res. Lett. 2018, 13, 124026. [Google Scholar] [CrossRef]
- Potter, C. Ecosystem Carbon Emissions from 2015 Forest Fires in Interior Alaska. Carbon Balance Manag. 2018, 13, 1–10. [Google Scholar] [CrossRef] [Green Version]
- Campbell, T.K.F.; Lantz, T.C.; Fraser, R.H. Impacts of Climate Change and Intensive Lesser Snow Goose (Chen Caerulescens Caerulescens) Activity on Surfacewater in High Arctic Pond Complexes. Remote Sens. 2018, 10, 1892. [Google Scholar] [CrossRef] [Green Version]
- Blanchette, M.; Rousseau, A.N.; Poulin, M. Mapping Wetlands and Land Cover Change with Landsat Archives: The Added Value of Geomorphologic Data: Cartographie de La Dynamique Spatio-Temporelle Des Milieux Humides à Partir d’archives Landsat: La Valeur Ajoutée de Données Géomorphologiques. Can. J. Remote Sens. 2018, 44, 337–356. [Google Scholar] [CrossRef]
- Warren, R.K.; Pappas, C.; Helbig, M.; Chasmer, L.E.; Berg, A.A.; Baltzer, J.L.; Quinton, W.L.; Sonnentag, O. Minor Contribution of Overstorey Transpiration to Landscape Evapotranspiration in Boreal Permafrost Peatlands. Ecohydrology 2018, 11, e1975. [Google Scholar] [CrossRef]
- DeLancey, E.R.; Kariyeva, J.; Cranston, J.; Brisco, B. Monitoring Hydro Temporal Variability in Alberta, Canada with Multi-Temporal Sentinel-1 SAR Data. Can. J. Remote Sens. 2018, 44, 1–10. [Google Scholar] [CrossRef]
- Chasmer, L.E.; Devito, K.J.; Hopkinson, C.D.; Petrone, R.M. Remote Sensing of Ecosystem Trajectories as a Proxy Indicator for Watershed Water Balance. Ecohydrology 2018, 11, e1987. [Google Scholar] [CrossRef]
- Montgomery, J.S.; Hopkinson, C.; Brisco, B.; Patterson, S.; Rood, S.B. Wetland Hydroperiod Classification in the Western Prairies Using Multitemporal Synthetic Aperture Radar. Hydrol. Process. 2018, 32, 1476–1490. [Google Scholar] [CrossRef]
- Merchant, M.A.; Warren, R.K.; Edwards, R.; Kenyon, J.K. An Object-Based Assessment of Multi-Wavelength SAR, Optical Imagery and Topographical Datasets for Operational Wetland Mapping in Boreal Yukon, Canada. Can. J. Remote Sens. 2019, 45, 308–332. [Google Scholar] [CrossRef]
- Judah, A.; Hu, B. The Integration of Multi-Source Remotely-Sensed Data in Support of the Classification of Wetlands. Remote Sens. 2019, 11, 1537. [Google Scholar] [CrossRef] [Green Version]
- Pitcher, L.H.; Pavelsky, T.M.; Smith, L.C.; Moller, D.K.; Altenau, E.H.; Allen, G.H.; Lion, C.; Butman, D.; Cooley, S.W.; Fayne, J.V.; et al. AirSWOT InSAR Mapping of Surface Water Elevations and Hydraulic Gradients Across the Yukon Flats Basin, Alaska. Water Resour. Res. 2019, 55, 937–953. [Google Scholar] [CrossRef]
- Gonsamo, A.; Ter-Mikaelian, M.T.; Chen, J.M.; Chen, J. Does Earlier and Increased Spring Plant Growth Lead to Reduced Summer Soil Moisture and Plant Growth on Landscapes Typical of Tundra-Taiga Interface? Remote Sens. 2019, 11, 1989. [Google Scholar] [CrossRef] [Green Version]
- Westwood, A.R.; Staicer, C.; Sólymos, P.; Haché, S.; Fontaine, T.; Bayne, E.M.; Mazerolle, D. Estimating the Conservation Value of Protected Areas in Maritime Canada for Two Species at Risk: The Olive-Sided Flycatcher (Contopus Cooperi) and Canada Warbler (Cardellina Canadensis). Avian Conserv. Ecol. 2019, 14, 16. [Google Scholar] [CrossRef]
- Brisco, B.; Shelat, Y.; Murnaghan, K.; Montgomery, J.; Fuss, C.; Olthof, I.; Hopkinson, C.; Deschamps, A.; Poncos, V. Evaluation of C-Band SAR for Identification of Flooded Vegetation in Emergency Response Products. Can. J. Remote Sens. 2019, 45, 73–87. [Google Scholar] [CrossRef]
- Jensen, D.; Simard, M.; Cavanaugh, K.; Sheng, Y.; Fichot, C.G.; Pavelsky, T.; Twilley, R. Improving the Transferability of Suspended Solid Estimation in Wetland and Deltaic Waters with an Empirical Hyperspectral Approach. Remote Sens. 2019, 11, 1629. [Google Scholar] [CrossRef] [Green Version]
- Palumbo, M.D.; Petrie, S.A.; Schummer, M.; Rubin, B.D.; Bonner, S. Mallard Resource Selection Trade-Offs in a Heterogeneous Environment during Autumn and Winter. Ecol. Evol. 2019, 9, 1798–1808. [Google Scholar] [CrossRef] [PubMed] [Green Version]
- Montgomery, J.; Brisco, B.; Chasmer, L.; Devito, K.; Cobbaert, D.; Hopkinson, C. SAR and Lidar Temporal Data Fusion Approaches to Boreal Wetland Ecosystem Monitoring. Remote Sens. 2019, 11, 161. [Google Scholar] [CrossRef] [Green Version]
- Lane, D.; McCarter, C.P.R.; Richardson, M.; McConnell, C.; Field, T.; Yao, H.; Arhonditsis, G.; Mitchell, C.P.J. Wetlands and Low-Gradient Topography Are Associated with Longer Hydrologic Transit Times in Precambrian Shield Headwater Catchments. Hydrol. Process. 2020, 34, 598–614. [Google Scholar] [CrossRef]
- Mahdianpari, M.; Jafarzadeh, H.; Granger, J.E.; Mohammadimanesh, F.; Brisco, B.; Salehi, B.; Homayouni, S.; Weng, Q. A Large-Scale Change Monitoring of Wetlands Using Time Series Landsat Imagery on Google Earth Engine: A Case Study in Newfoundland. GISci. Remote Sens. 2020, 57, 1102–1124. [Google Scholar] [CrossRef]
- Chen, Z.; White, L.; Banks, S.; Behnamian, A.; Montpetit, B.; Pasher, J.; Duffe, J.; Bernard, D. Characterizing Marsh Wetlands in the Great Lakes Basin with C-Band InSAR Observations. Remote Sens. Environ. 2020, 242, 111750. [Google Scholar] [CrossRef]
- Merchant, M.; Haas, C. High-Latitude Wetland Mapping Using Multidate and Multisensor Earth Observation Data: A Case Study in the Northwest Territories. J. Appl. Remote Sens. 2020, 14, 034511. [Google Scholar] [CrossRef]
- Siles, G.; Trudel, M.; Peters, D.L.; Leconte, R. Hydrological Monitoring of High-Latitude Shallow Water Bodies from High-Resolution Space-Borne D-InSAR. Remote Sens. Environ. 2020, 236, 111444. [Google Scholar] [CrossRef]
- White, L.; McGovern, M.; Hayne, S.; Touzi, R.; Pasher, J.; Duffe, J. Investigating the Potential Use of RADARSAT-2 and UAS Imagery for Monitoring the Restoration of Peatlands. Remote Sens. 2020, 12, 2383. [Google Scholar] [CrossRef]
- Hawkes, V.C.; Miller, M.T.; Novoa, J.; Ibeke, E.; Martin, J.P. Opportunistic Wetland Formation, Characterization, and Quantification on Landforms Reclaimed to Upland Ecosites in the Athabasca Oil Sands Region. Wetl. Ecol. Manag. 2020, 28, 953–970. [Google Scholar] [CrossRef]
- Brisco, B.; Mahdianpari, M.; Mohammadimanesh, F. Hybrid Compact Polarimetric SAR for Environmental Monitoring with the RADARSAT Constellation Mission. Remote Sens. 2020, 12, 1–20. [Google Scholar] [CrossRef]
- Larocque, A.; Leblon, B.; Woodward, R.; Bourgeau-Chavez, L. Wetland Mapping in New Brunswick, Canada with Landsat5-Tm, Alos-Palsar, and Radarsat-2 Imagery. ISPRS Ann. Photogramm. Remote Sens. Spat. Inf. Sci. 2020, 5, 301–308. [Google Scholar] [CrossRef]
- Ahmed, M.I.; Elshorbagy, A.; Pietroniro, A. A Novel Model for Storage Dynamics Simulation and Inundation Mapping in the Prairies. Environ. Model. Softw. 2020, 133, 104850. [Google Scholar] [CrossRef]
- Bahrami, A.; Goïta, K.; Magagi, R. Analysing the Contribution of Snow Water Equivalent to the Terrestrial Water Storage over Canada. Hydrol. Process. 2020, 34, 175–188. [Google Scholar] [CrossRef]
- Bergeron, J.; Siles, G.; Leconte, R.; Trudel, M.; Desroches, D.; Peters, D.L. Assessing the Capabilities of the Surface Water and Ocean Topography (SWOT) Mission for Large Lake Water Surface Elevation Monitoring under Different Wind Conditions. Hydrol. Earth Syst. Sci. 2020, 24, 5985–6000. [Google Scholar] [CrossRef]
- Mahoney, C.; Merchant, M.; Boychuk, L.; Hopkinson, C.; Brisco, B. Automated SAR Image Thresholds for Water Mask Production in Alberta’s Boreal Region. Remote Sens. 2020, 12, 2223. [Google Scholar] [CrossRef]
- Wulder, M.A.; Hermosilla, T.; White, J.C.; Coops, N.C. Biomass Status and Dynamics over Canada’s Forests: Disentangling Disturbed Area from Associated Aboveground Biomass Consequences. Environ. Res. Lett. 2020, 15, 94093. [Google Scholar] [CrossRef]
- Janardanan, R.; Maksyutov, S.; Tsuruta, A.; Wang, F.; Tiwari, Y.K.; Valsala, V.; Ito, A.; Yoshida, Y.; Kaiser, J.W.; Janssens-Maenhout, G.; et al. Country-Scale Analysis of Methane Emissions with a High-Resolution Inverse Model Using GOSAT and Surface Observations. Remote Sens. 2020, 12, 375. [Google Scholar] [CrossRef] [Green Version]
- O’Sullivan, A.M.; Devito, K.J.; Ogilvie, J.; Linnansaari, T.; Pronk, T.; Allard, S.; Curry, R.A. Effects of Topographic Resolution and Geologic Setting on Spatial Statistical River Temperature Models. Water Resour. Res. 2020, 56, e2020WR028122. [Google Scholar] [CrossRef]
- Olthof, I.; Rainville, T. Evaluating Simulated RADARSAT Constellation Mission (RCM) Compact Polarimetry for Open-Water and Flooded-Vegetation Wetland Mapping. Remote Sens. 2020, 12, 1476. [Google Scholar] [CrossRef]
- Wadsworth, E.; Champagne, C.; Berg, A.A. Evaluating the Utility of Remotely Sensed Soil Moisture for the Characterization of Runoff Response over Canadian Watersheds. Can. Water Resour. J. 2020, 45, 77–89. [Google Scholar] [CrossRef]
- Amani, M.; Brisco, B.; Mahdavi, S.; Ghorbanian, A.; Moghimi, A.; Delancey, E.R.; Merchant, M.; Jahncke, R.; Fedorchuk, L.; Mui, A.; et al. Evaluation of the Landsat-Based Canadian Wetland Inventory Map Using Multiple Sources: Challenges of Large-Scale Wetland Classification Using Remote Sensing. IEEE J. Sel. Top. Appl. Earth Obs. Remote Sens. 2021, 14, 32–52. [Google Scholar] [CrossRef]
- Omari, K.; Chenier, R.; Touzi, R.; Sagram, M. Investigation of C-Band SAR Polarimetry for Mapping a High-Tidal Coastal Environment in Northern Canada. Remote Sens. 2020, 12, 1941. [Google Scholar] [CrossRef]
- Sewell, P.D.; Quideau, S.A.; Dyck, M.; Macdonald, E. Long-Term Effects of Harvest on Boreal Forest Soils in Relation to a Remote Sensing-Based Soil Moisture Index. For. Ecol. Manag. 2020, 462, 117986. [Google Scholar] [CrossRef]
- Peters, D.; Niemann, O.; Skelly, R. Remote Sensing of Ecosystem Structure: Fusing Passive and Active Remotely Sensed Data to Characterize a Deltaic Wetland Landscape. Remote Sens. 2020, 12, 3819. [Google Scholar] [CrossRef]
- Zakharov, I.; Kapfer, M.; Hornung, J.; Kohlsmith, S.; Puestow, T.; Howell, M.; Henschel, M.D. Retrieval of Surface Soil Moisture from Sentinel-1 Time Series for Reclamation of Wetland Sites. IEEE J. Sel. Top. Appl. Earth Obs. Remote Sens. 2020, 13, 3569–3578. [Google Scholar] [CrossRef]
- Wulder, M.A.; Hermosilla, T.; Stinson, G.; Gougeon, F.A.; White, J.C.; Hill, D.A.; Smiley, B.P. Satellite-Based Time Series Land Cover and Change Information to Map Forest Area Consistent with National and International Reporting Requirements. Forestry 2020, 93, 331–343. [Google Scholar] [CrossRef] [Green Version]
- Wang, L.; Marzahn, P.; Bernier, M.; Ludwig, R. Sentinel-1 InSAR Measurements of Deformation over Discontinuous Permafrost Terrain, Northern Quebec, Canada. Remote Sens. Environ. 2020, 248, 111965. [Google Scholar] [CrossRef]
- White, L.; Ryerson, R.A.; Pasher, J.; Duffe, J. State of Science Assessment of Remote Sensing of Great Lakes Coastal Wetlands: Responding to an Operational Requirement. Remote Sens. 2020, 12, 3024. [Google Scholar] [CrossRef]
- Wu, J.; Gillani, S.S.M.; Wang, M. The Difference in Light Use Efficiency between an Abandoned Peatland Pasture and an Adjacent Boreal Bog in Western Newfoundland, Canada. Wetlands 2020, 40, 733–743. [Google Scholar] [CrossRef]
- Haynes, K.M.; Smart, J.; Disher, B.; Carpino, O.; Quinton, W.L. The Role of Hummocks in Re-Establishing Black Spruce Forest Following Permafrost Thaw. Ecohydrology 2021, 14, e2273. [Google Scholar] [CrossRef]
- Hopkinson, C.; Fuoco, B.; Grant, T.; Bayley, S.E.; Brisco, B.; Macdonald, R. Wetland Hydroperiod Change along the Upper Columbia River Floodplain, Canada, 1984 to 2019. Remote Sens. 2020, 12, 4084. [Google Scholar] [CrossRef]
- Mahdianpari, M.; Granger, J.E.; Mohammadimanesh, F.; Warren, S.; Puestow, T.; Salehi, B.; Brisco, B. Smart Solutions for Smart Cities: Urban Wetland Mapping Using Very-High Resolution Satellite Imagery and Airborne LiDAR Data in the City of St. John’s, NL, Canada. J. Environ. Manag. 2021, 280, 111676. [Google Scholar] [CrossRef] [PubMed]


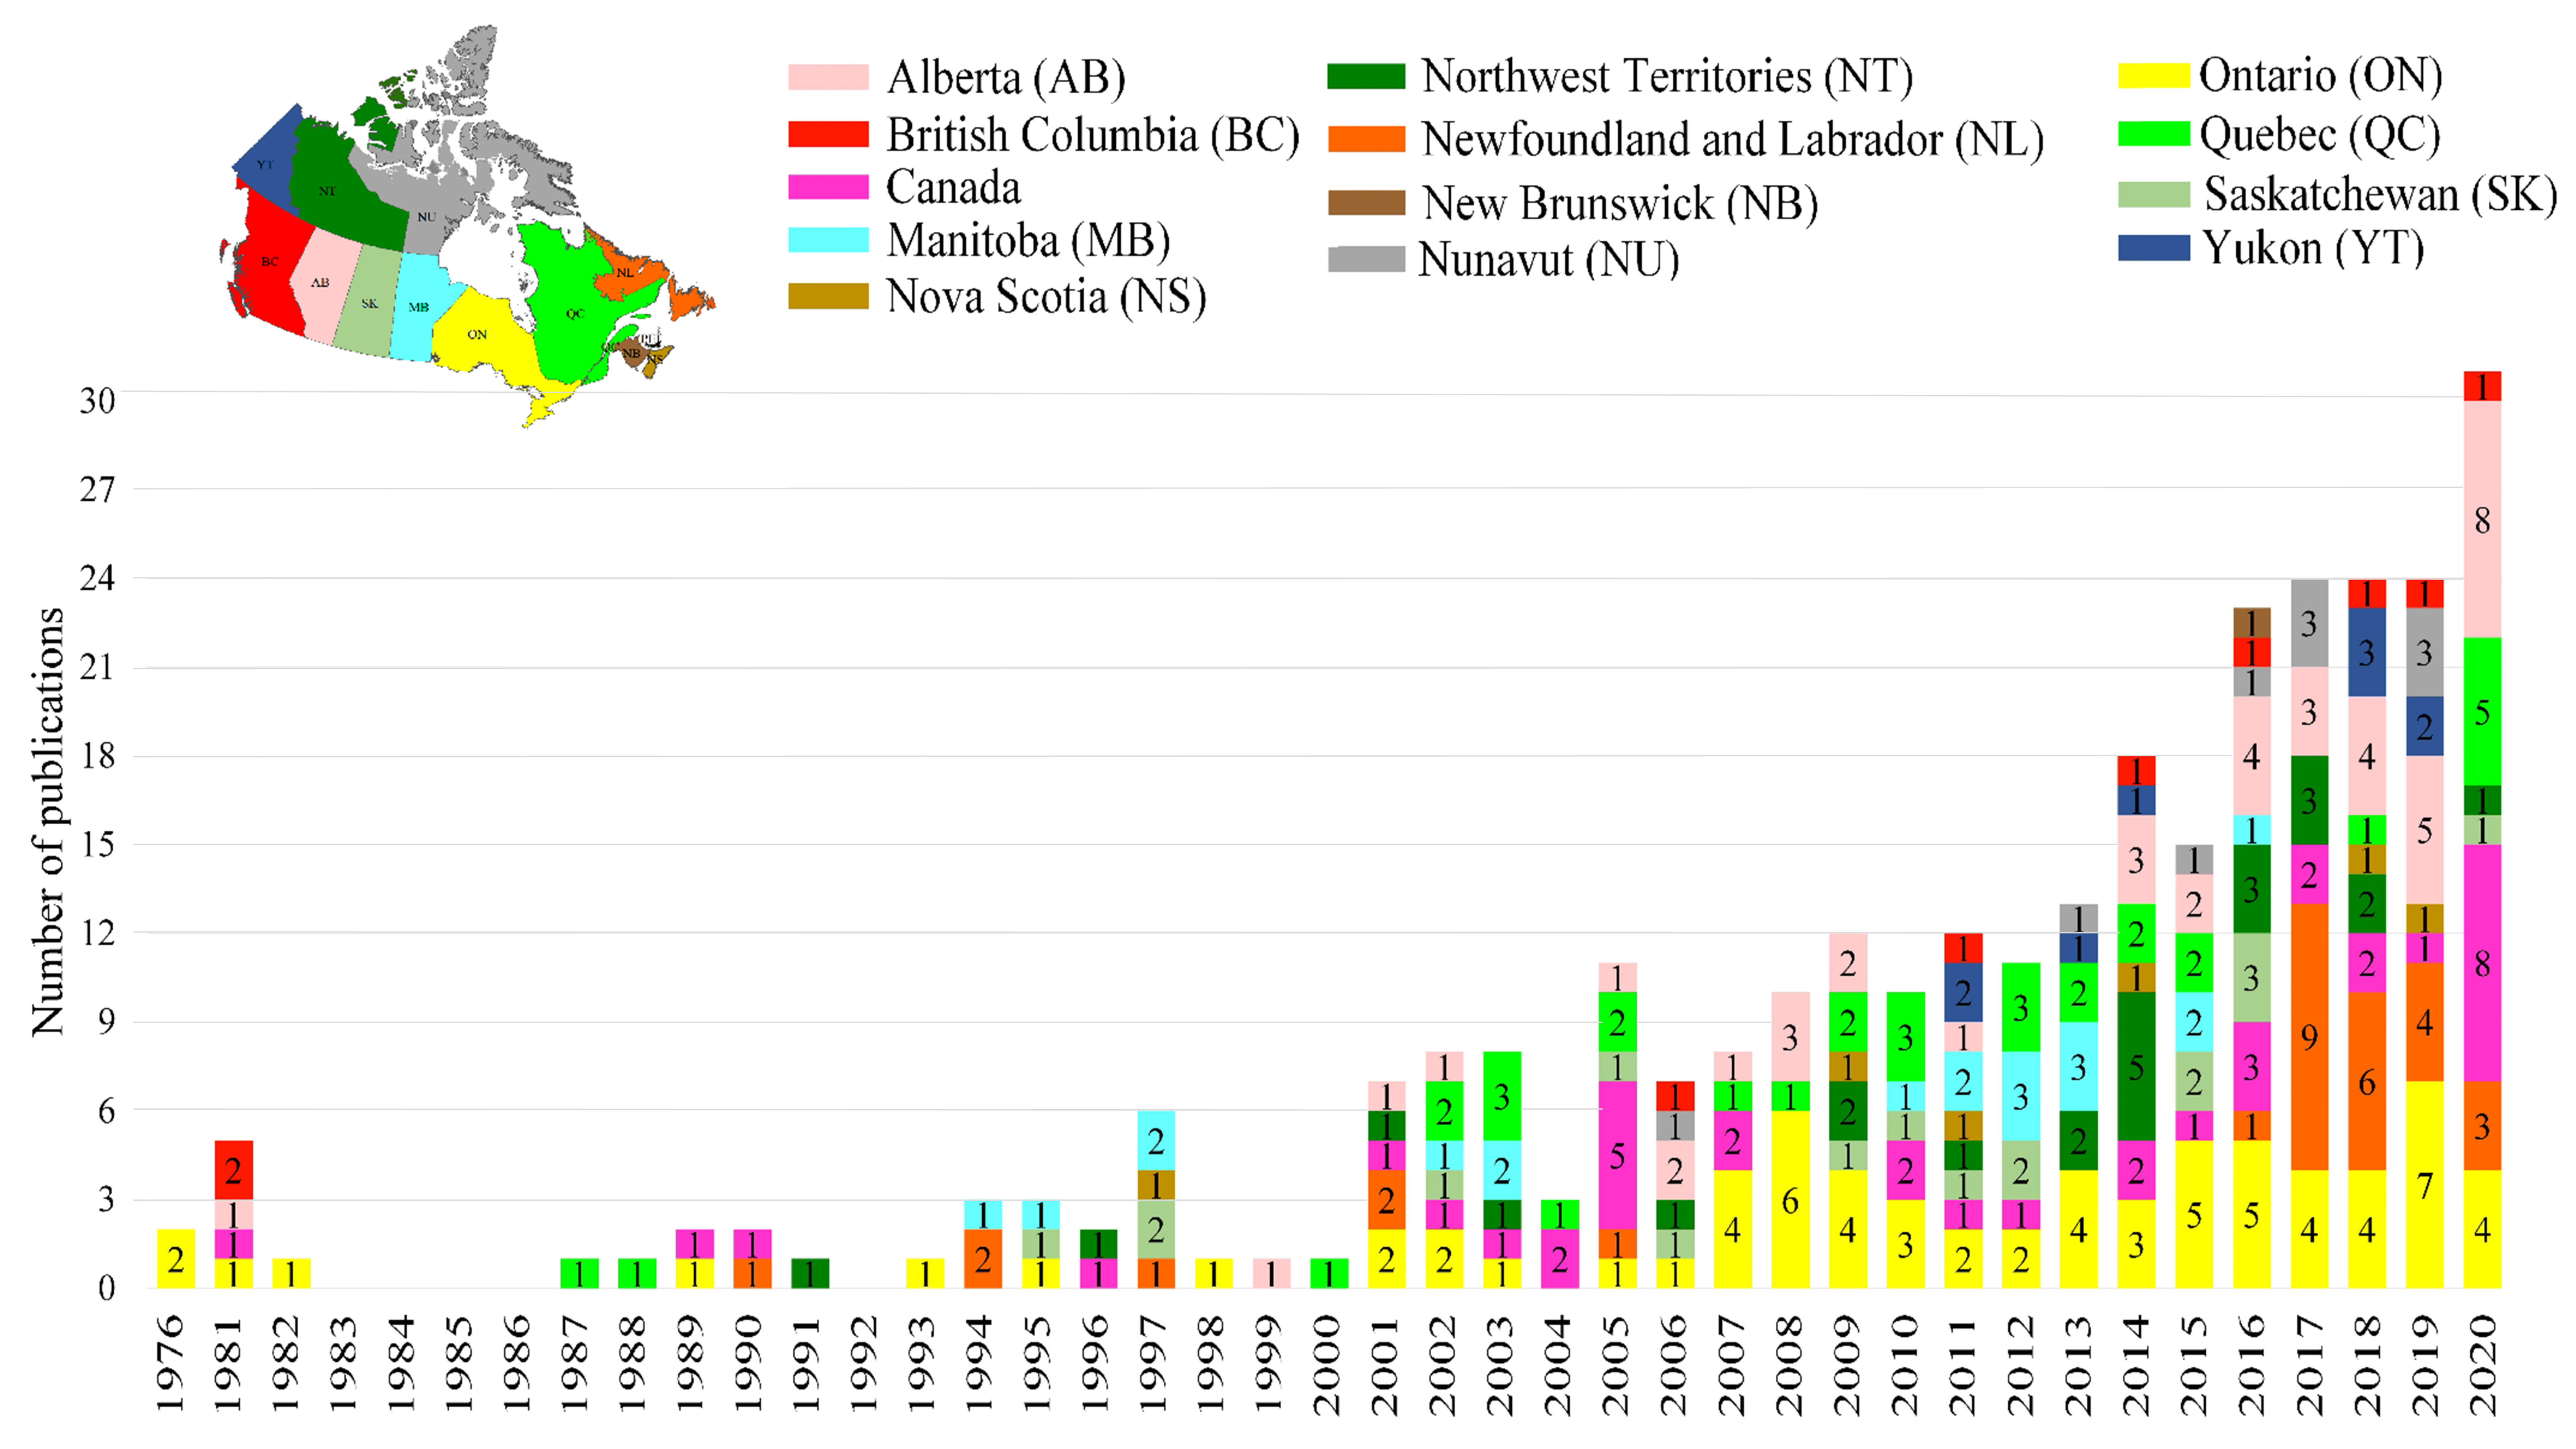
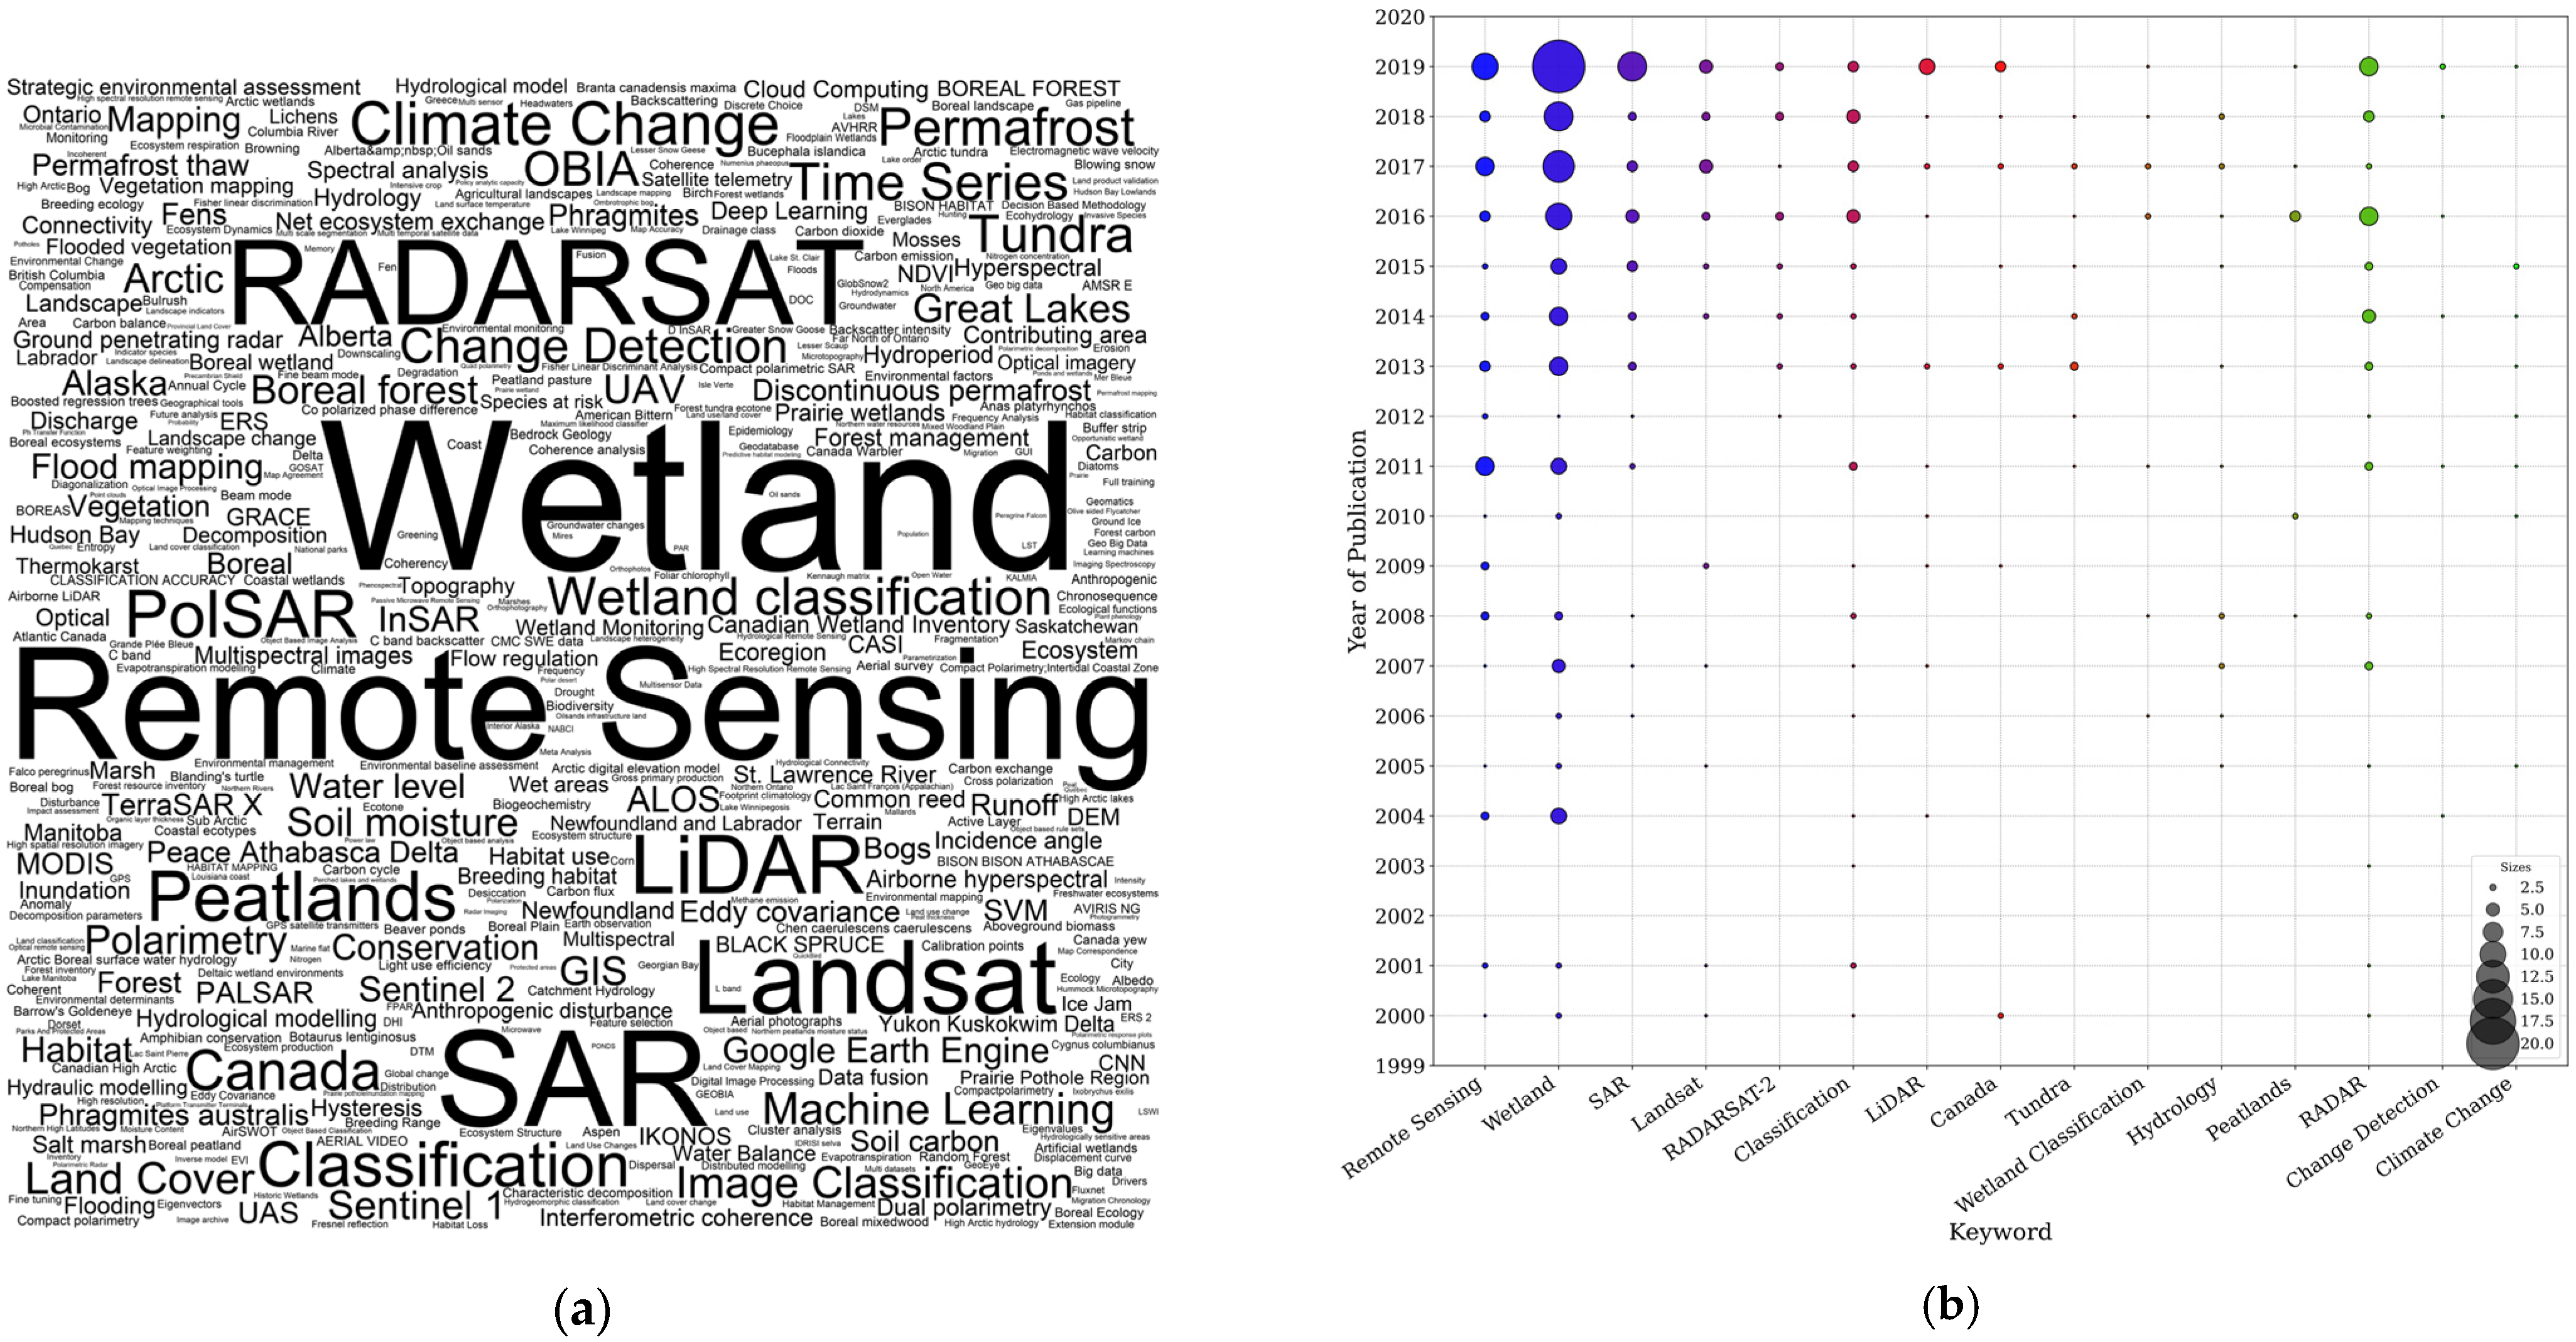
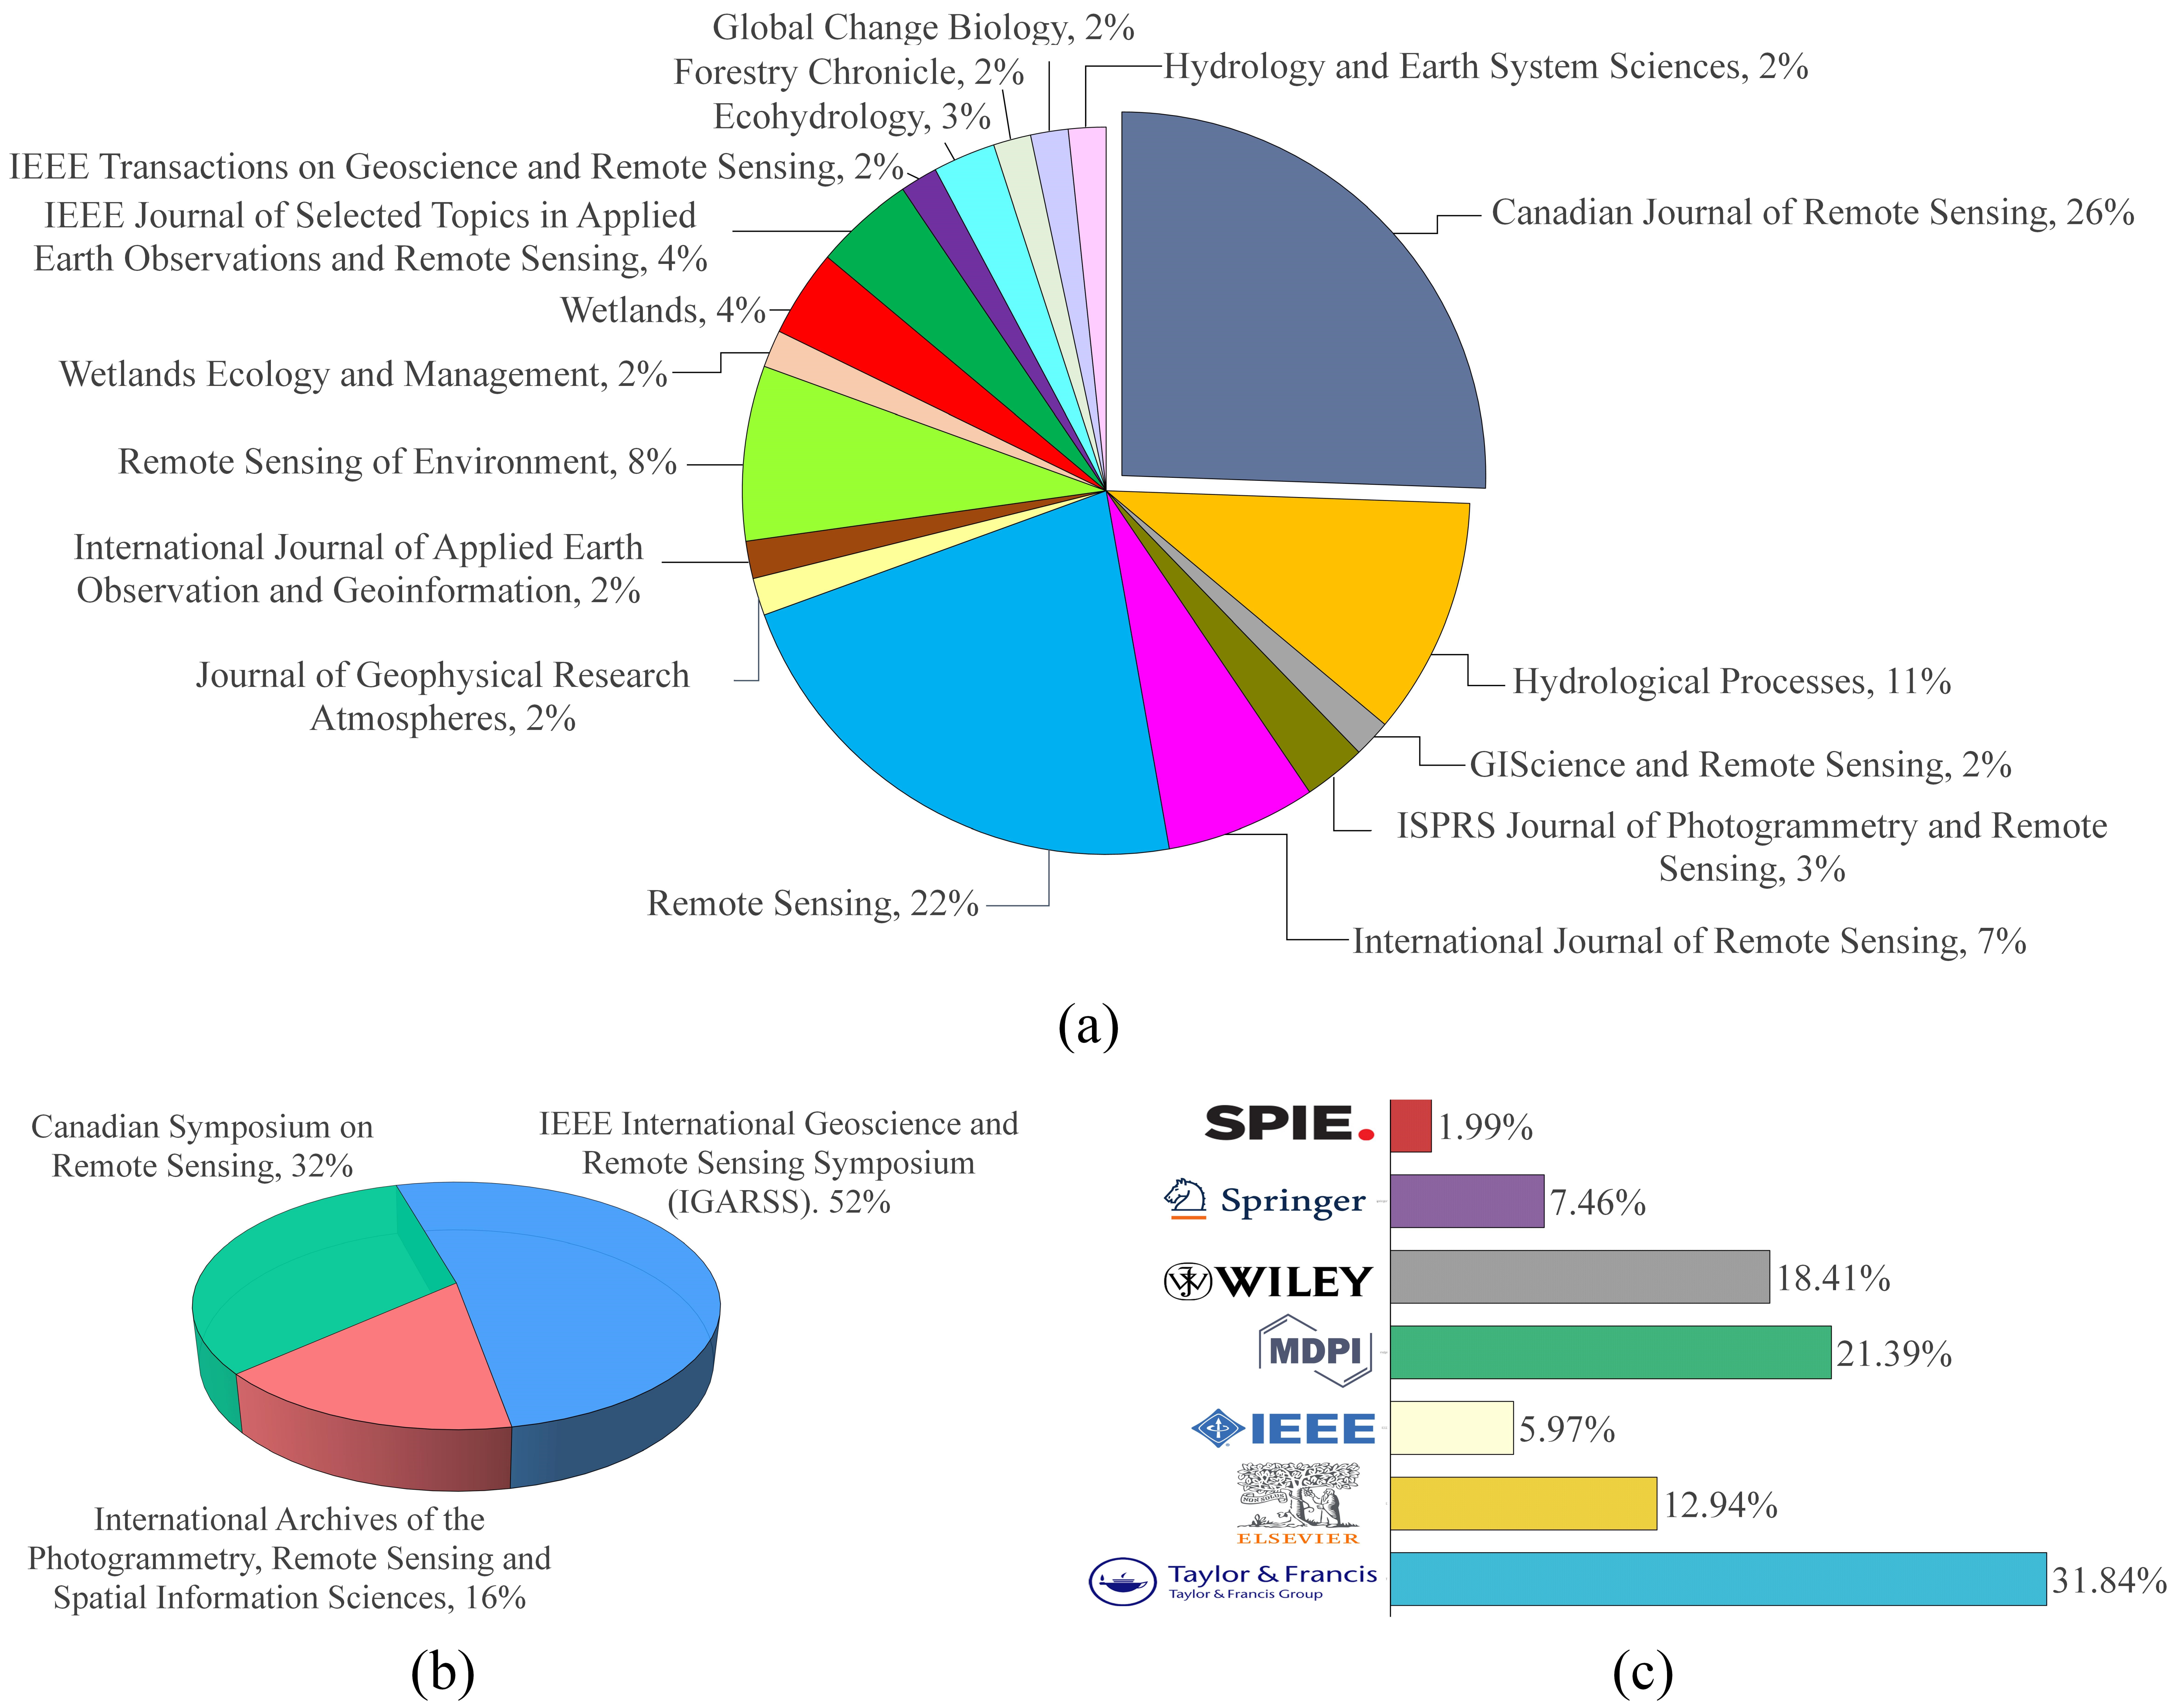
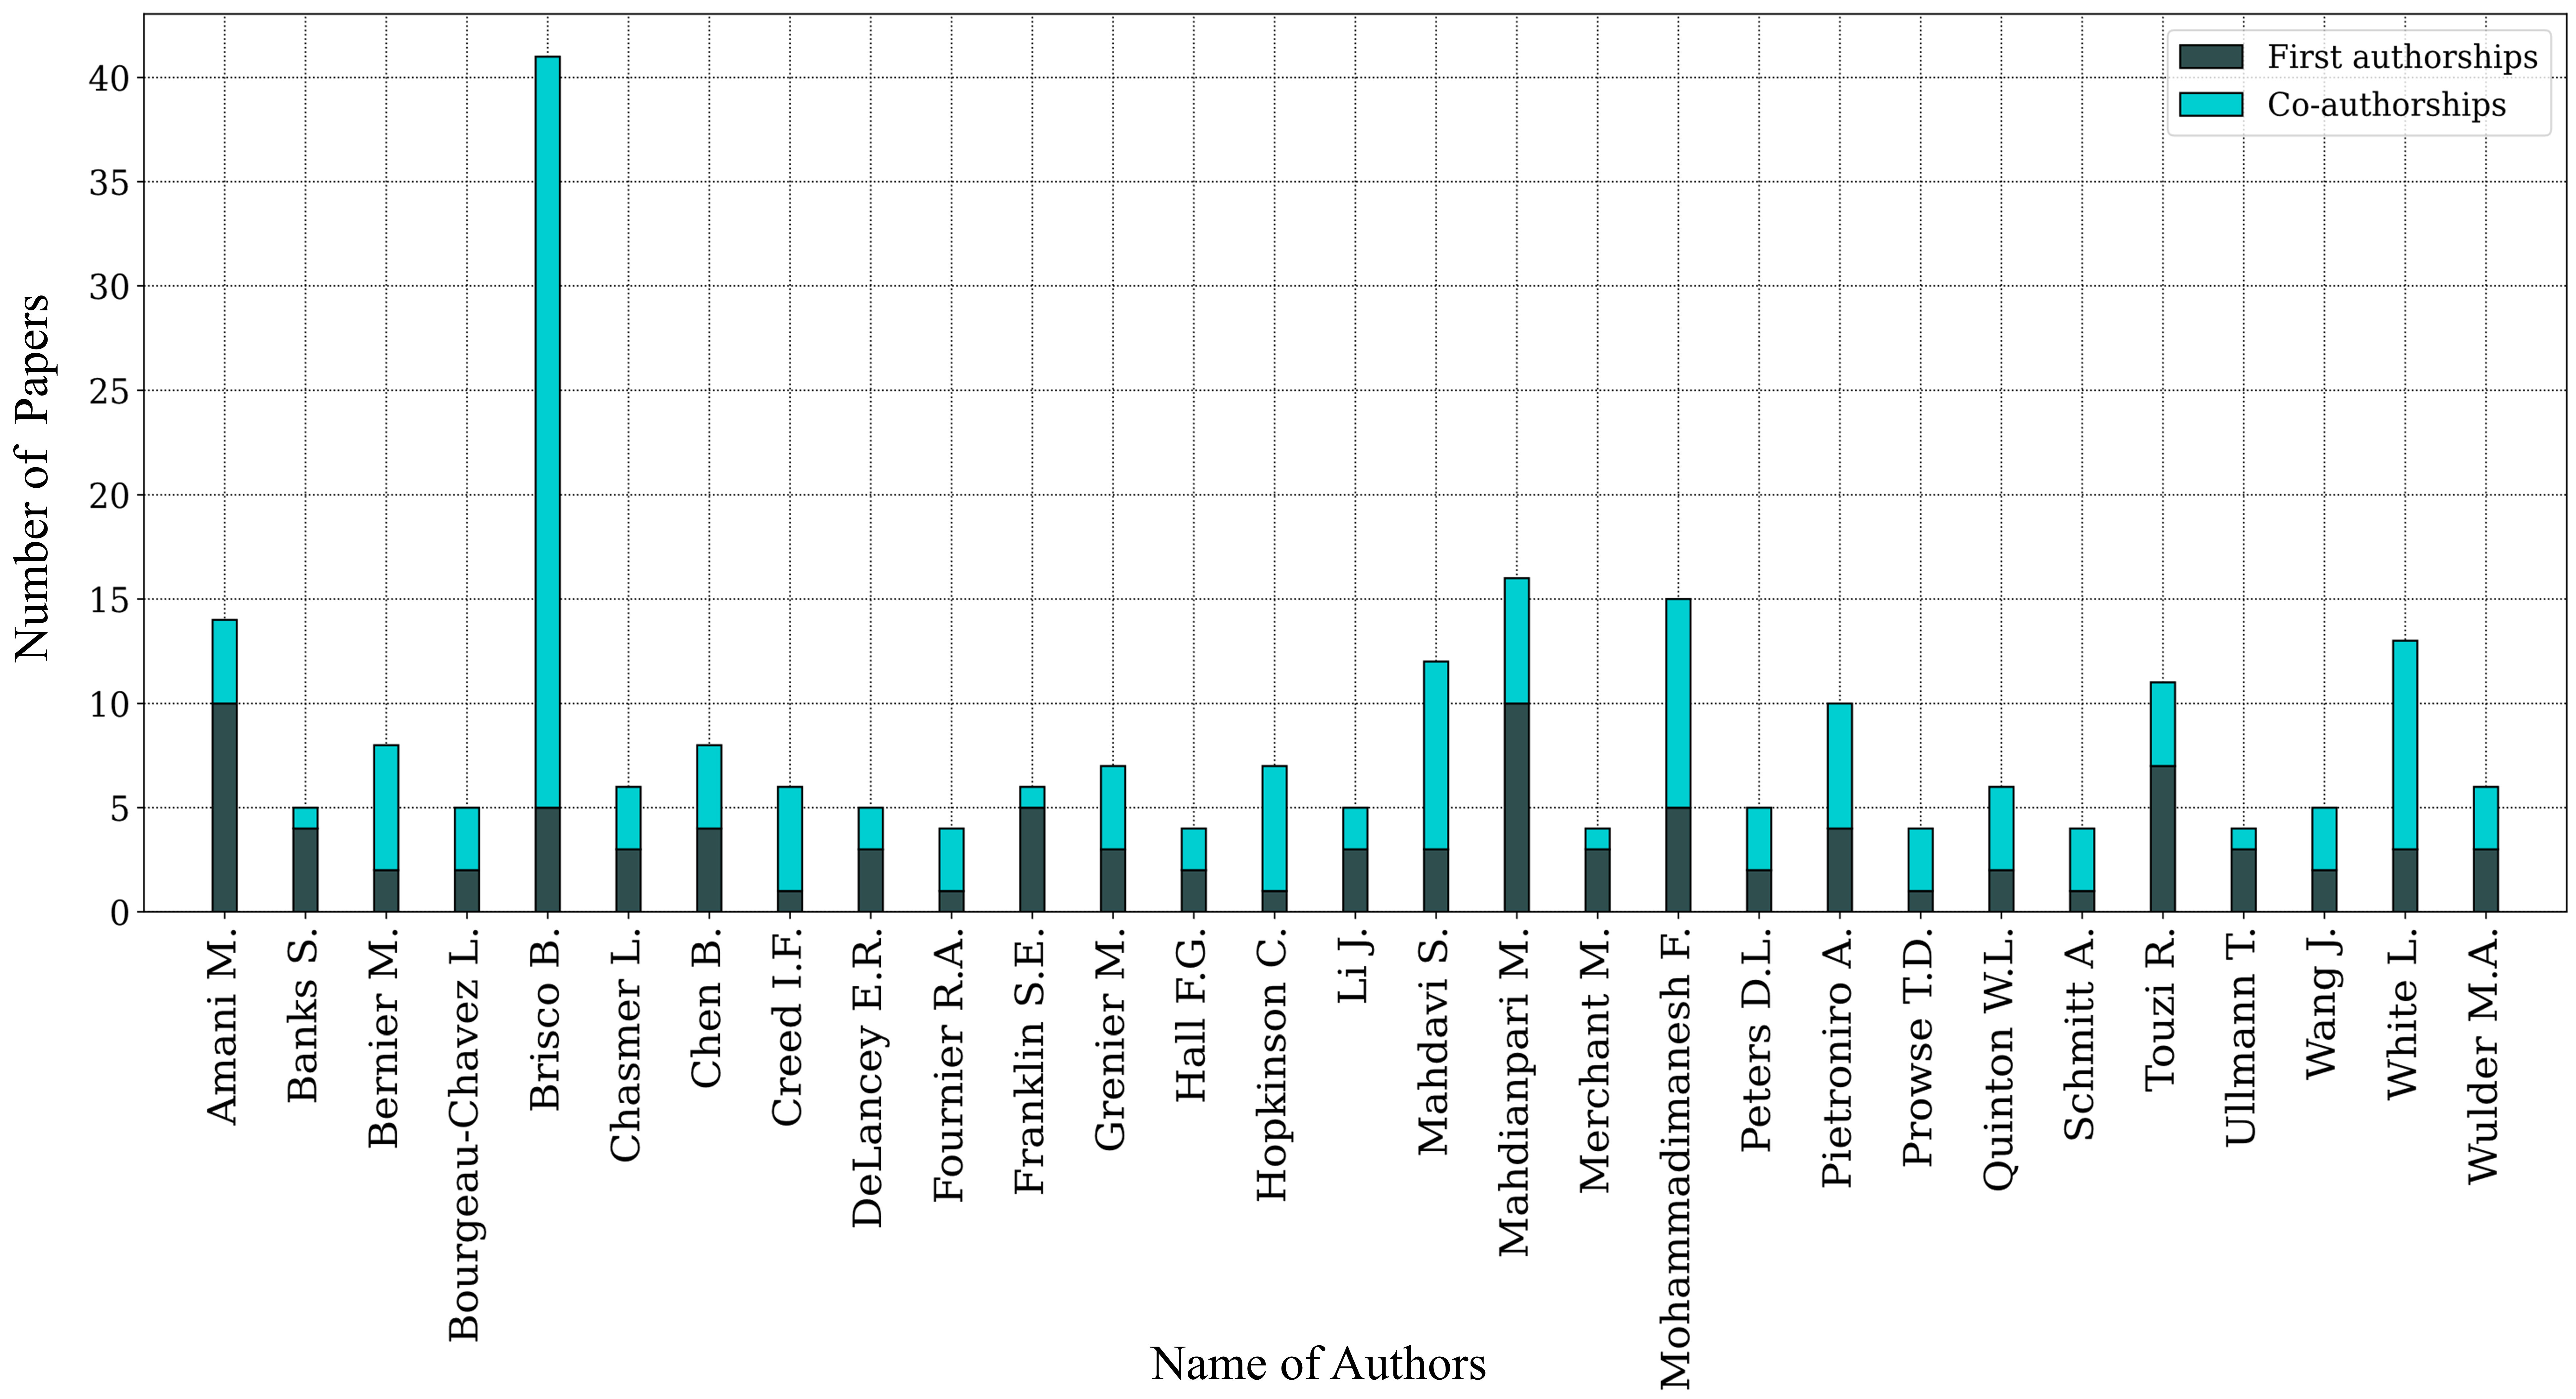
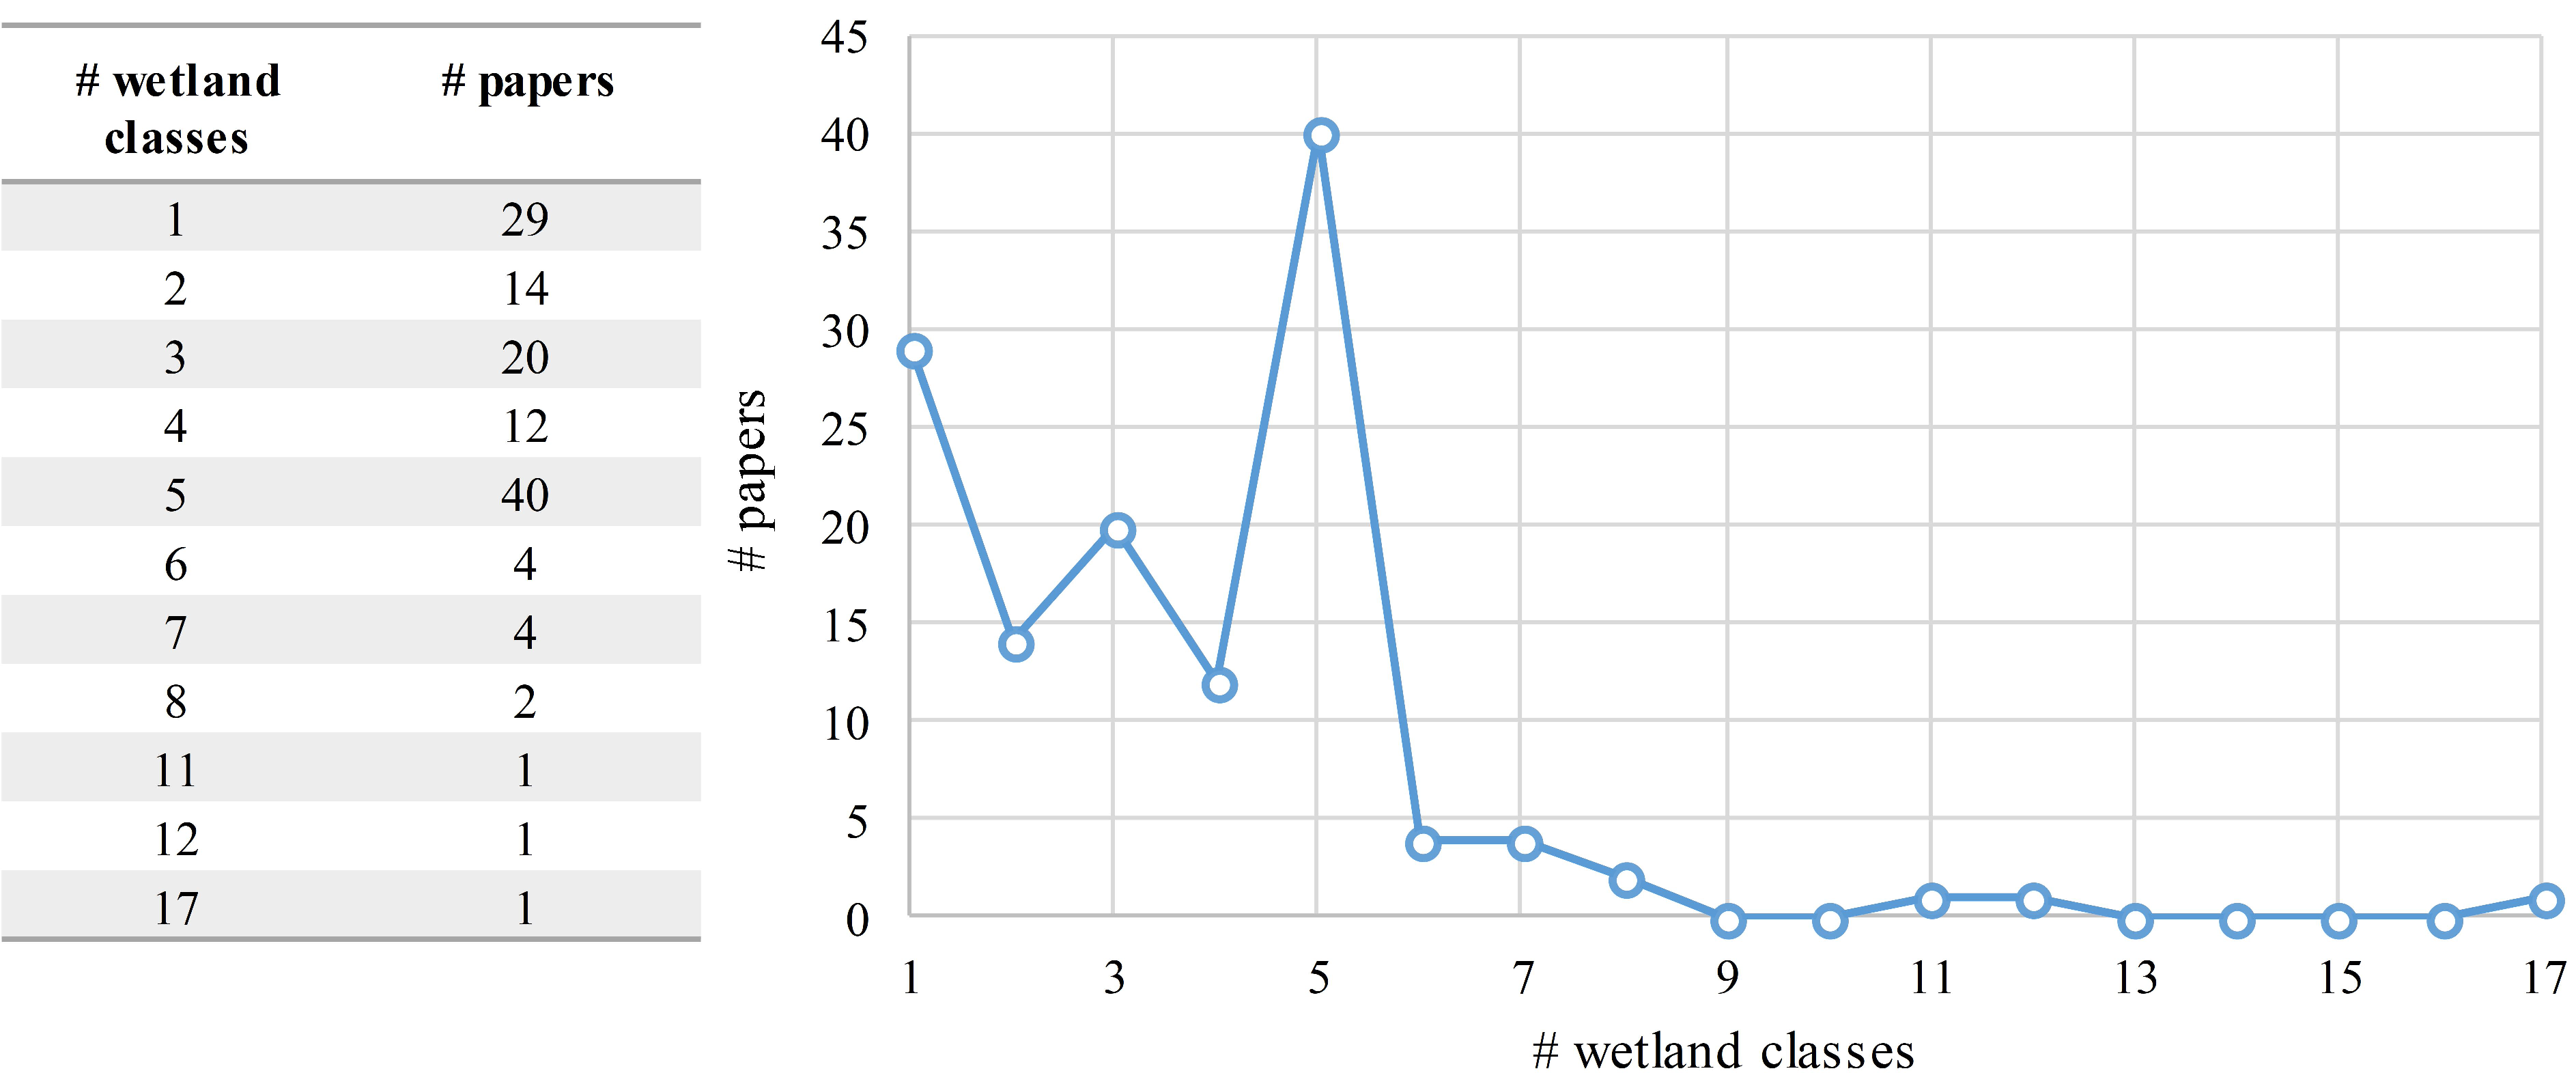
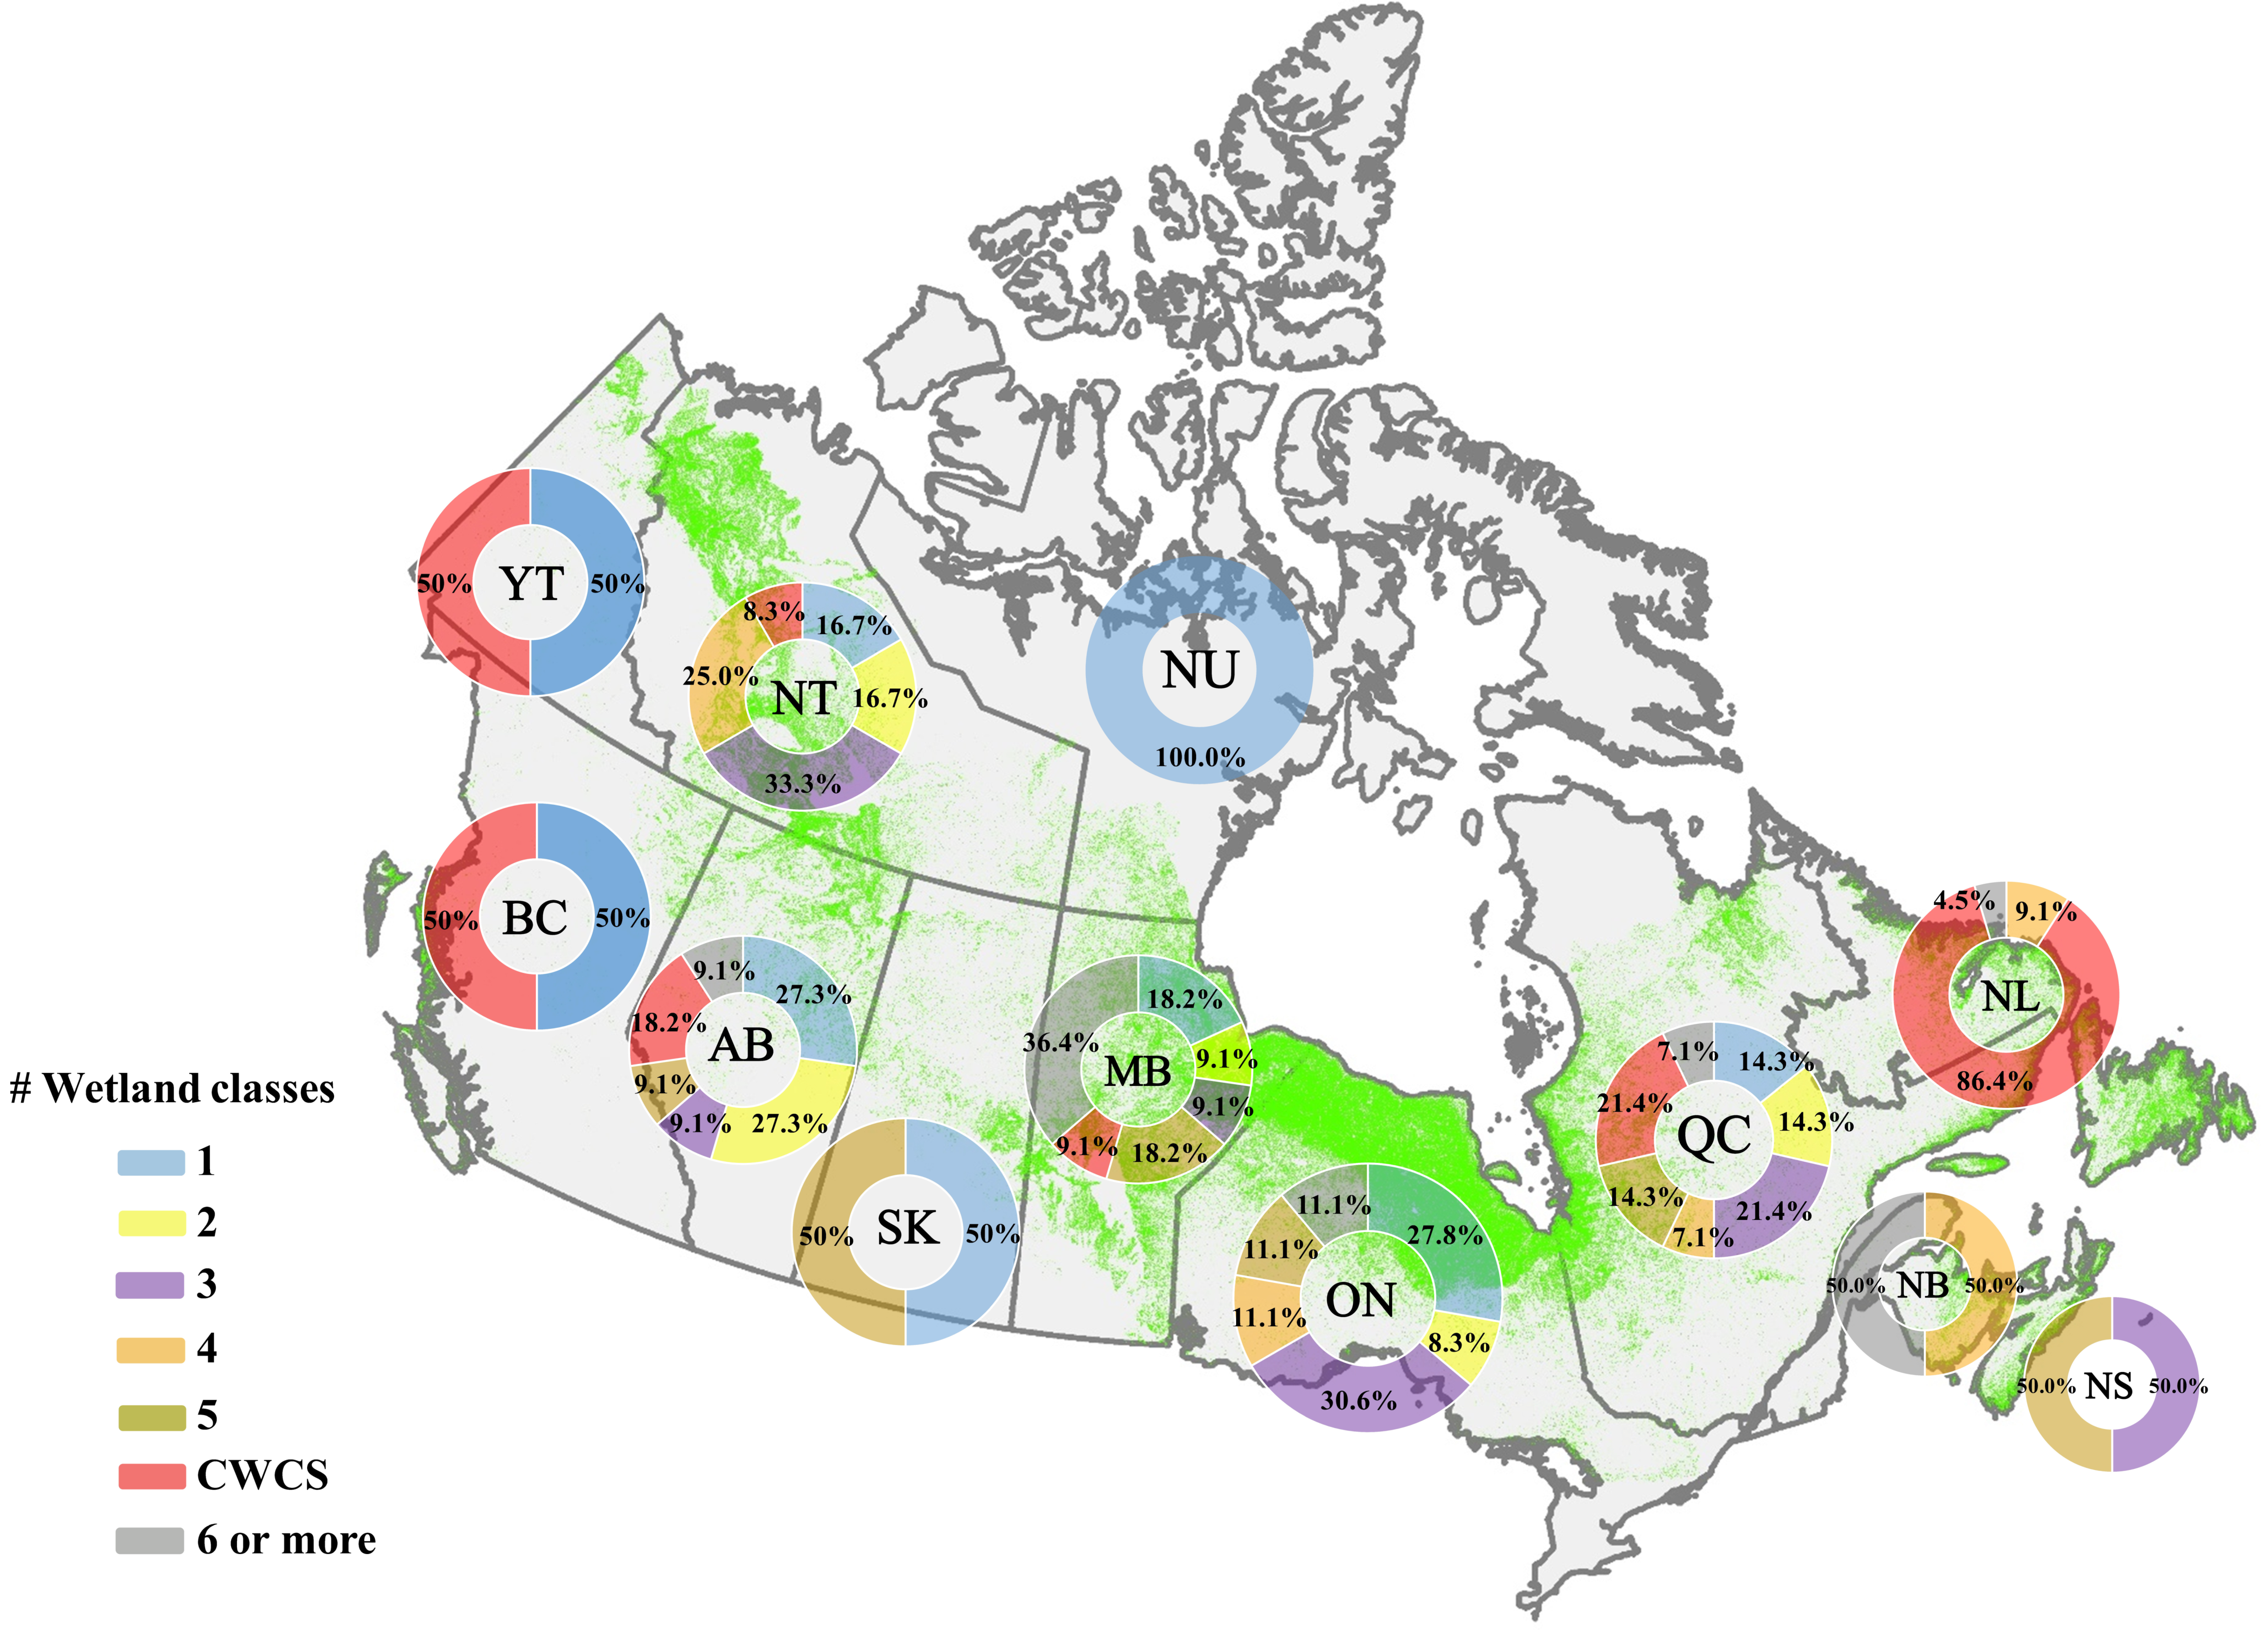


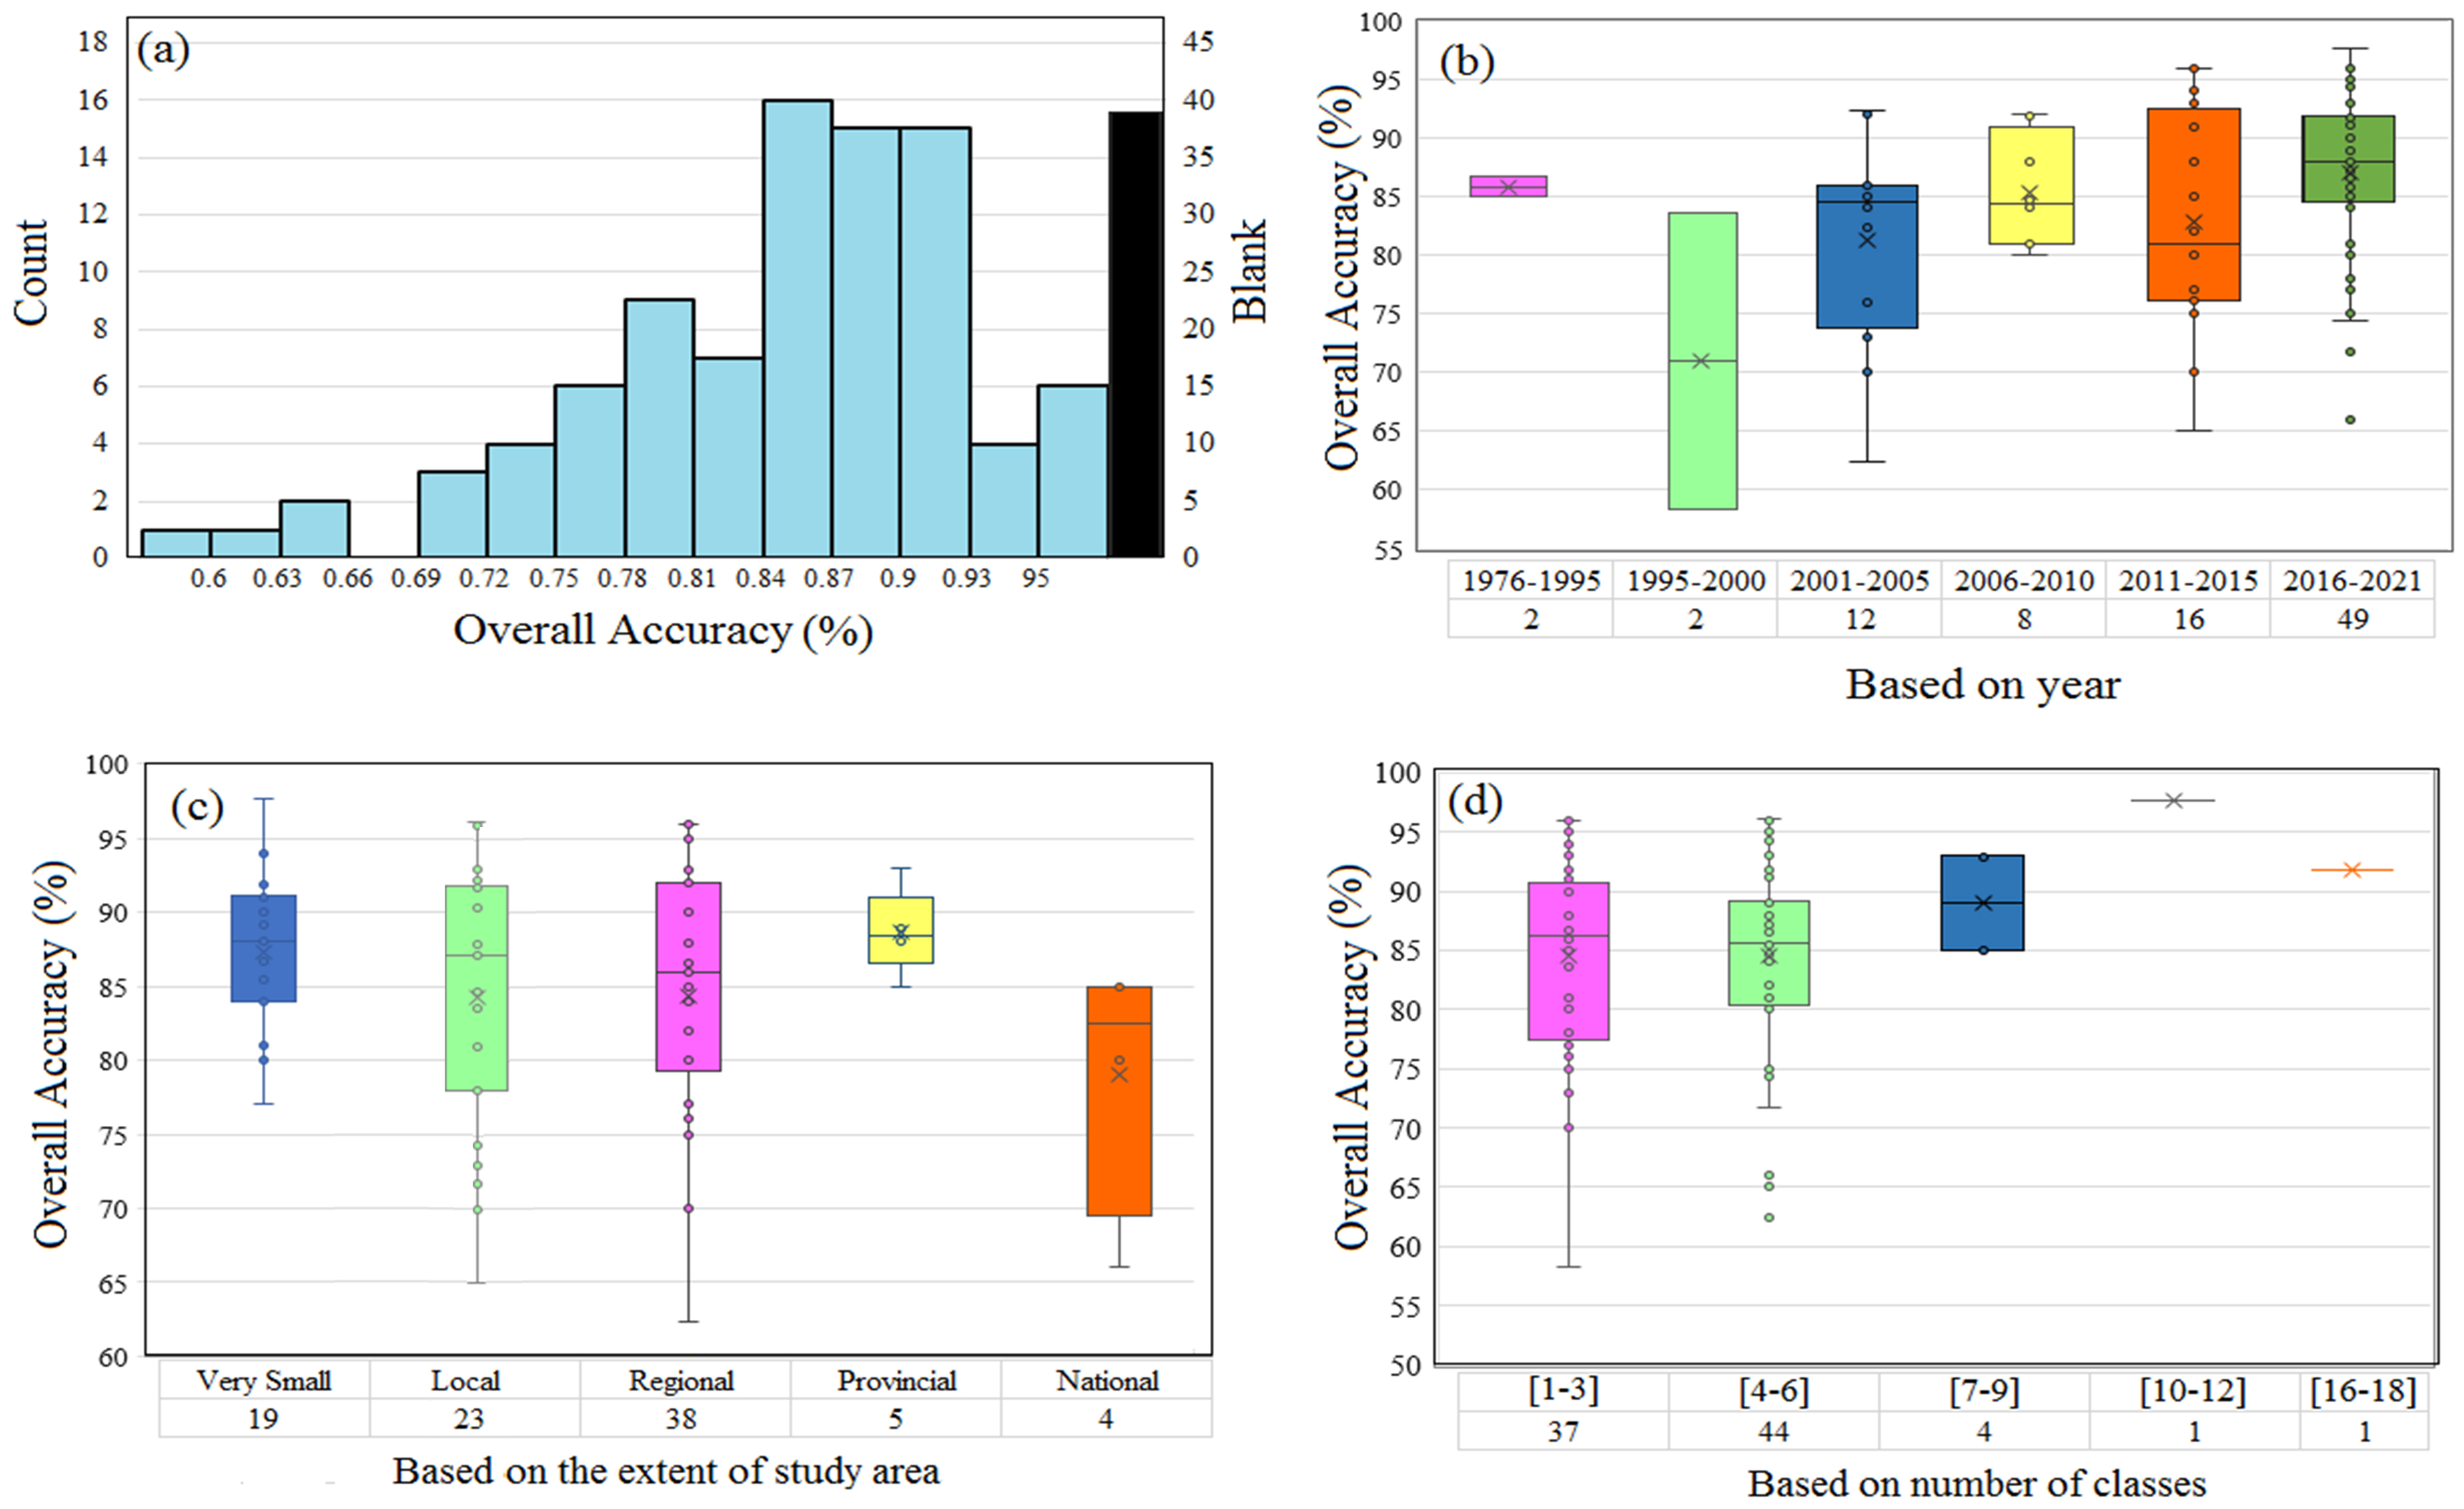
| First Word | Second Word | Third Word | ||
|---|---|---|---|---|
| Wetland | And | Canada Newfoundland and Labrador (NL) Ontario Quebec (QC) Nova Scotia (NS) New Brunswick (NB) Manitoba British Columbia (BC) Prince Edward Island (PE) Saskatchewan (SK) Alberta (AB) Northwest Territories Yukon (YT) Nunavut (NU) | And | Remote Sensing Radar Satellite |
| Attribute | Categories | |
|---|---|---|
| 1 | First Author | Name |
| 2 | Co-authors | Name |
| 3 | Publication year | Value |
| 4 | Citation | Value |
| 5 | Paper type | Type: Journal, Conference |
| 6 | Study area | Type: 13 provinces/territories and Canada |
| 7 | Affiliation | Type: University, Organization |
| 8 | Data type | Type: Optical, SAR, LiDAR, UAV, Aerial, Orthophoto, Multi-sensor |
| 9 | Method | Type: (Supervised, Unsupervised), (Object-based, Pixel-based) |
| 10 | Number of wetland classes | Value: One, Two, Three, Four, Five, CWCS, and Six or more |
| 11 | Classifier | Type: 8 classifiers, multiple classifiers, and Other |
| 12 | Journal | Name |
| 13 | Area extent | Type: Very small, Local, Regional, Provincial, National |
| 14 | Accuracy | Value |
| Institute | Country/Province | Papers | Citation | CPP |
|---|---|---|---|---|
| Memorial University of Newfoundland | NL | 29 | 787 | 27.14 |
| Canada Centre for Remote Sensing | ON | 15 | 952 | 63.47 |
| INRS | QC | 11 | 419 | 38.09 |
| University of Saskatchewan | SK | 10 | 423 | 42.3 |
| Ducks Unlimited Canada | MB | 9 | 23 | 2.56 |
| University of Western Ontario | ON | 9 | 279 | 31 |
| University of Alberta | AB | 9 | 236 | 26.22 |
| Canada Center for Mapping and Earth Observation | ON | 9 | 71 | 7.89 |
| National Wildlife Research Centre | ON | 8 | 105 | 13.125 |
| Carleton University | ON | 7 | 176 | 25.14 |
| Université de Sherbrook | QC | 7 | 85 | 12.14 |
| Canadian Wildlife Service of Environment Canada | QC | 6 | 218 | 36.33 |
| University of Toronto | ON | 6 | 150 | 25 |
| National Water Research Institute, Environment Canada | SK | 6 | 416 | 69.33 |
| McMaster University | ON | 5 | 93 | 18.6 |
| University of New Brunswick | NB | 5 | 26 | 5.2 |
| University of Calgary | AB | 5 | 270 | 54 |
| University of Victoria | BC | 5 | 211 | 42.2 |
| Wilfrid Laurier University | ON | 4 | 270 | 67.5 |
| University of Guelph | ON | 4 | 106 | 26.5 |
| University of Alaska Fairbanks | Alaska, U.S. | 4 | 85 | 21.25 |
| University of Lethbridge | AB | 4 | 44 | 11 |
| McGill University | QC | 3 | 375 | 125 |
| University of Waterloo | ON | 3 | 102 | 34 |
| Trent University | ON | 3 | 48 | 16 |
| Université Laval | QC | 3 | 110 | 36.67 |
| Environment and Climate Change Canada | QC | 3 | 70 | 23.33 |
| The University of British Columbia | BC | 3 | 65 | 21.67 |
| University of California at Los Angeles | CA, U.S. | 3 | 39 | 13 |
| Ontario Centre for Remote Sensing | ON | 3 | 26 | 8.67 |
| Wood Environment & Infrastructure Solutions | NL | 3 | 23 | 7.67 |
| Rank | First Author | Average Number of Citations per Year | Total Citations | Publication Year | Region |
|---|---|---|---|---|---|
| 1 | Mahdianpari et al. [27] | 44 | 132 | 2018 | Part of NL |
| 2 | Mahdianpari et al. [86] | 37.5 | 75 | 2019 | Entire NL |
| 3 | Kokelj and Jorgenson [87] | 30.37 | 243 | 2013 | - |
| 4 | Mahdianpari et al. [44] | 29.75 | 119 | 2017 | Part of NL |
| 5 | Touzi, R. [88] | 28.5 | 399 | 2006 | Part of ON |
| 6 | Mahdavi et al. [2] | 24 | 72 | 2018 | - |
| 7 | Delancey et al. [21] | 23 | 23 | 2020 | Part of AB |
| 8 | Hird et al. [40] | 22.5 | 90 | 2017 | Part of AB |
| 9 | Connon et al. [89] | 18.28 | 128 | 2014 | Part of NT |
| 10 | Amani et al. [68] | 17 | 34 | 2019 | Entire Canada |
| Scale | ON | NL | SK | NT | NS | MB | QC | AB | YT | NU | NB | BC | Canada | Total | Percentage |
|---|---|---|---|---|---|---|---|---|---|---|---|---|---|---|---|
| Very small | 8 | 4 | 1 | 4 | 2 | 1 | 5 | 3 | − | − | 2 | 1 | − | 32 | 25% |
| Local | 16 | 10 | 2 | 3 | − | 3 | 2 | 1 | − | − | − | 1 | − | 36 | 28% |
| Regional | 13 | 6 | 4 | 5 | − | 7 | 6 | 7 | 2 | 1 | − | 1 | − | 50 | 40% |
| Provincial | − | 4 | − | − | − | − | 1 | − | − | − | − | − | − | 5 | 4% |
| National | − | − | − | − | − | − | − | − | − | − | − | − | 5 | 5 | 4% |
Publisher’s Note: MDPI stays neutral with regard to jurisdictional claims in published maps and institutional affiliations. |
© 2021 by the authors. Licensee MDPI, Basel, Switzerland. This article is an open access article distributed under the terms and conditions of the Creative Commons Attribution (CC BY) license (https://creativecommons.org/licenses/by/4.0/).
Share and Cite
Mirmazloumi, S.M.; Moghimi, A.; Ranjgar, B.; Mohseni, F.; Ghorbanian, A.; Ahmadi, S.A.; Amani, M.; Brisco, B. Status and Trends of Wetland Studies in Canada Using Remote Sensing Technology with a Focus on Wetland Classification: A Bibliographic Analysis. Remote Sens. 2021, 13, 4025. https://doi.org/10.3390/rs13204025
Mirmazloumi SM, Moghimi A, Ranjgar B, Mohseni F, Ghorbanian A, Ahmadi SA, Amani M, Brisco B. Status and Trends of Wetland Studies in Canada Using Remote Sensing Technology with a Focus on Wetland Classification: A Bibliographic Analysis. Remote Sensing. 2021; 13(20):4025. https://doi.org/10.3390/rs13204025
Chicago/Turabian StyleMirmazloumi, S. Mohammad, Armin Moghimi, Babak Ranjgar, Farzane Mohseni, Arsalan Ghorbanian, Seyed Ali Ahmadi, Meisam Amani, and Brian Brisco. 2021. "Status and Trends of Wetland Studies in Canada Using Remote Sensing Technology with a Focus on Wetland Classification: A Bibliographic Analysis" Remote Sensing 13, no. 20: 4025. https://doi.org/10.3390/rs13204025