
Identifying Urban Functional Areas in China’s Changchun City from Sentinel-2 Images and Social Sensing Data


1
Northeast Institute of Geography and Agroecology, Chinese Academy of Sciences, Changchun 130102, China
2
School of Geomatics and Prospecting Engineering, Jilin Jianzhu University, Changchun 130118, China
3
National Earth System Science Data Center, Beijing 100101, China
4
Changchun Municipal Engineering Design and Research Institute, Changchun 130022, China
*
Author to whom correspondence should be addressed.
Remote Sens. 2021, 13(22), 4512; https://doi.org/10.3390/rs13224512
Submission received: 10 October 2021
/
Revised: 7 November 2021
/
Accepted: 8 November 2021
/
Published: 10 November 2021
(This article belongs to the Special Issue Urban Land-System Synergies and Governance Using Remote Sensing, Modeling and Big Data, Analysis)
Abstract
:The urban functional area is critical to an understanding of the complex urban system, resource allocation, and management. However, due to urban surveys’ focus on geographic objects and the mixture of urban space, it is difficult to obtain such information. The function of a place is determined by the activities that take place there. This study employed mobile phone signaling data to extract temporal features of human activities through discrete Fourier transform (DFT). Combined with the features extracted from the point of interest (POI) data and Sentinel images, the urban functional areas of Changchun City were identified using a random forest (RF) model. The results indicate that integrating features derived from remote sensing and social sensing data can effectively improve the identification accuracy and that features derived from dynamic mobile phone signaling have a higher identification accuracy than those derived from POI data. The human activity characteristics on weekends are more distinguishable for different functional areas than those on weekdays. The identified urban functional layout of Changchun is consistent with the actual situation. The residential functional area has the highest proportion, accounting for 33.51%, and is mainly distributed in the central area, while the industrial functional area and green-space are distributed around.
1. Introduction
The term “urban functional area” refers to zones divided in accordance with the dominant function [1], it is associated with land use, and its external form is closely related to its economic, social, and cultural functions [2]. Urban functional area delimitation can significantly facilitate urban research and planning [3,4]. In particular, as urbanization increases worldwide, life is changing rapidly from the traditional rural way to urbanization [5,6]. The United Nations Sustainable Development Goals (SDGs) seek to make cities inclusive and sustainable. The statements of SDG 3 (promoting good health and well-being) and 11 (sustainable cities and communities) demonstrate that people are devoted to investing efforts and resources to achieve goals, including making cities more livable, promoting well-being, and promoting sustainable development [7]. Understanding the spatial pattern of urban functional areas is conducive to better allocation of resources and improvement of the urban living environment. However, because most urban surveys focus on geographical objects rather than functional areas on a larger scale, functional area maps are difficult to obtain in most cities [8], and the complexity and integration of urban functions create great difficulties for accurate and efficient mapping of urban functional areas [9].
While remote sensing effectively extracts surface physical features in urban areas, identifying socio-economic characteristics and human activity patterns is challenging [10,11]. Recognizing functional areas using remote sensing data cannot avoid confusion when investigating areas with different functions but similar physical characteristics [12]. With the development of information technology and various location acquisition technologies, several types of geospatial data, such as point of interest (POI) data, taxi trajectory data, and mobile phone signaling data, could be applied to describe spatial and temporal characteristics of human activities, thus providing a new way to discover urban function with fine resolution [13]. Due to the common characteristics between these data and traditional remote sensing data, the social sensing method has been introduced as a supplement to remote sensing to reveal socio-economic characteristics of urban areas. This method has great potential for conducting urban social research combined with new methods [14,15].
The function of a place depends on what activities take place there [16]. Social sensing data related to human activities have been continuously applied in identifying urban functional areas. For instance, POI data are often combined with remote sensing data to identify urban functional areas [17,18,19]. POI data have high position accuracy, and thus were used to correct the position of geotagged microblog posts [20]. POI data cannot be linked to individual behavior but can be used as an indirect representation of human activities. Taxi trajectory data were used to define the hourly traffic flow with an hour-day-spectrum (HDS) method, and then the functional categories of urban areas of interest were determined by comparing waveforms with standard waveforms of six taxi pick-up and drop-off points [1]. Taxi origin/destination data were utilized to divide the city into three functional areas: workspace, leisure, and shopping functional areas, which enhanced the understanding of the relationship between functional areas. However, taxi trajectory data only represent the travel characteristics of some residents within a specific distance [21]. Smart card data and network community detection algorithms were used to investigate the urban spatial layout and evolution characteristics of London [22]. Check-in records on an information sharing communication platform contain coordinate and time information. This information was utilized to identify urban boundaries and produced more accurate results than administrative regions [23,24]. Due to the widespread use of mobile Internet, the mobile phone serves as an effective sensor for human activities [25,26]. Different functional areas have distinct life rhythms that change over time [27]. The mobile phone signaling data contain the coordinates of anonymous customers with a time stamp to provide rich temporal and spatial information about human mobile modes [28] and achieved good results in identifying residence and workplace [25]. Combined with remote sensing and mobile phone signaling data, hierarchical cluster analysis was conducted for urban functional area identification, and human activities were quantified using a set of indicators described in family, work, and social activities [29]. The hourly call and total call volumes were generated from mobile phone signaling data, and a vector could be constructed for a semi-supervised fuzzy clustering method to identify urban functional areas [30]. The estimated daily population could be obtained by averaging the 24-h mobile phone user data, which was used to identify the scope of intensive human activities and evaluate the mismatch with urban built-up areas [31]. The time series data of mobile signaling reveal the temporal rhythm and spatial variation of human activities in different functional areas. Moreover, there are significant differences in human activities on weekdays and weekends. The aggregated data cannot fully express these differences, resulting in insufficient utilization of the time dynamic characteristics of mobile signaling data.
This study combined remote sensing and social sensing data for urban functional area identification, highlighted the time dynamic advantages of mobile phone signaling, and constructed features to express the intensity difference of human activities in a day and the difference of population activities between weekdays and weekends. This study can serve as a reference for identifying urban functional areas and as a source of basic data to understand the layout of urban functional areas in the study area.
The remainder of the paper is organized as follows. The second section describes the study area and the used data. The third section describes the research workflow and the features used to identify urban functional areas. The fourth section compares the performances of different feature combinations, and analyzes the results of the identification. The fifth section discusses the influencing factors and uncertainty in the identification. The last section presents the research conclusions and suggestions for future work about the identification of urban functional areas.
2. Study Area and Data Sources
2.1. Study Area
Changchun is the capital of Jilin Province in China. Changchun has convenient traffic conditions and obvious location advantages. Beijing-Harbin railway and most expressways and high-grade highways in Jilin Province cover Changchun. The central area of Changchun was taken as the research area (Figure 1), which is a concentrated construction area allowed by the current urban master plan, with a total planning area of 610 square kilometers, accounting for about 0.25% of the total area of Jilin province. This region has a highly concentrated population and serves as the province’s economic and social hub, accounting for 12.64% of the province’s population in 2015 [32].
2.2. Data Collection
2.2.1. Remote Sensing Image
The study selected Sentinel-2A as the remote sensing data source. The Sentinel-2A satellite was successfully launched in June 2015 with a 13-band multi-spectral instrument (MSI). The spatial resolution of four bands is 10 m and the revisit period is 10 days [33,34]. It has been widely used in urban studies [35]. The Level 1C data were downloaded from the Sentinels Scientific Data Hub [36] with an acquisition time of 27 September 2020.
2.2.2. Social Sensing Data
Social sensing data used in the study include POI and mobile phone signaling data. Baidu map, founded in 2005, has become the main online map system in China, providing intelligent positioning and POI retrieval services [37], with high POI coverage and a total volume of 150 million. Therefore, the Baidu Map application program interface (API) was used to obtain POI data of the research area in 2020 (Figure 2).
The signaling data of mobile phones were provided by China Unicom. The data period includes a complete week, from 6 July 2020 to 12 July 2020. When mobile phone users make calls, send and receive SMS, move, and switch their phones on and off, the corresponding location and time data are generated and recorded [38]. According to the geographic location information recorded in mobile phone signaling data, the signaling records were allocated to the cell tower at hourly intervals, and then mobile phone time series data were obtained. The smaller the distance between adjacent cell towers, the greater the cell tower density, and the higher the location accuracy of mobile phone signaling will be. The average value of the nearest distance between cell towers in the study area was 97 m, and 98% of the cell towers had an adjacent distance of less than 500 m (Figure 3).
2.2.3. Urban Function Type Definition
Land-use type is a basic unit reflecting and bearing urban functions. Based on the land use classification standard of China, Gong, et al. [39] created the essential urban land use categories (EULUCs), which contain two classification levels. The classification system is based on China’s urban land survey and management standard, which is consistent with the land use survey type conducted in the central urban area of Changchun, China. Therefore, this study divided urban functions into five types: residential, commercial, industrial, public, and greenspace according to the first-level classification system of EULUC. Green space refers to green open space and waterbody. The study area was divided into 500 m × 500 m urban cells following the method of Tu et al. [29]. Su et al. [40] deeply analyzed the impact of different sampling strategies on the classification of urban land use, and found that the preferred purity of samples was 60–90%. In order to ensure a sufficient number of available samples, functional types with an area ratio of over 60% were selected to label urban cells according to the field survey data of land types in Changchun in 2016, and their labels were verified in 2020 using Sentinel-2A image and POI data. A total of 367 samples were selected, of which 252 were used as training samples and the remaining 115 as testing samples (Table 1).
3. Methodology
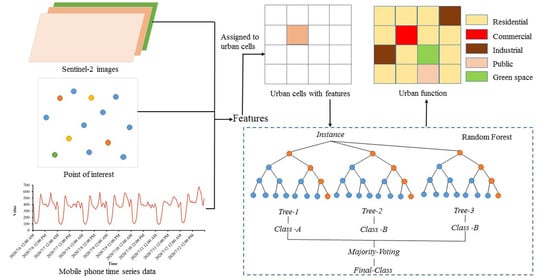
An identification framework for urban functional areas based on remote sensing image and social sensing data was proposed. The main work included four steps. (1) The original data were pre-processed. The Sentinel-2A L1C images underwent atmospheric correction. The Baidu POI data were reclassified according to the functional area categories. The cell towers were assigned to the mobile phone signaling records to obtain spatialized mobile phone signaling time series data. (2) With the help of ENVI, ArcGIS, and Spyder software, texture analysis, spatial analysis, and discrete Fourier transform (DFT) were employed to extract features, which were assigned to urban cells. (3) By comparing the overall accuracy of repeated classification, the optimal feature combination was determined. (4) The random forest model was trained by using the samples with the optimal feature combination, and the optimal model was utilized to identify urban functional areas (Figure 4). Examples of urban cells and related features (Experiment_dataset.csv), code for evaluating identification performance of different feature combinations (Comparison_of_classification_accuracy.py), code for parameter tuning of RF (RF_parameter_optimization.py), and optimized RF model (RF_trained.sav) are available in the Supplementary Materials Section.
3.1. Sentinel 2A Data Processing and Feature Extraction
The Level 1C product was processed with the Sen2cor v2.5.5 tool provided by the European Space Agency. Sen2Cor performs a pre-processing of Level-1C Top of Atmosphere (TOA) image data, and applies a scene classification and atmospheric correction and a subsequent conversion into an ortho-image Level-2A Bottom-Of-Atmosphere (BOA) reflectance product [41]. Typical spectral indices, such as the normalized difference vegetation index (NDVI) [42] and normalized difference built-up index (NDBI) [43], were obtained by band calculation. Gray-Level Co-occurrence Matrix was used to generate texture features of red (band 4), green (band 3), blue (band 2), near-infrared (band 8), and mid-infrared (band 11) bands, including entropy, correlation, and angular second moment. Finally, the mean values of the spectrum, spectral indices, and texture features of each band in the urban cell were obtained as features [44].
3.2. POI Data Processing and Feature Extraction
Baidu Map POI data mainly serve the internet navigation map, and their classification system is different from the classification of urban functional areas. The original Baidu POI data contained 19 groups, including food, hotels, shopping, tourist attractions, education, training, etc. The rescreening was performed according to the categories of urban functional areas, and the types that are not highly related to urban functions were deleted. For instance, convenience stores, shops, and small supermarkets included in POI of shopping type do not have an independent land-use scope. A total of 30,474 POI data were obtained. Using the spatial analysis of ArcGIS 10.2, the total number and the proportion of each type of POI were obtained. The number of POI categories, total number of POIs [45], and mean kernel density of each POI category [20] in the urban cell were calculated as features.
3.3. Mobile Phone Signaling Data Processing and Feature Extraction
The profiles of mobile phone time series data exhibit periodicity, and there are obvious differences in the temporal profile between different functional areas. The shapes of change curves are different, and the time points of peaks are also different. This study assumes that similar functional areas exhibit similar temporal characteristics [3]. At 11 p.m., the value fluctuates, higher than that of the two adjacent time periods. The main reason is that applications in the mobile phone are automatically updated and produce more signaling data. Considering that 23:00 to 5:00 in the next day is the time when crowd activity is at its weak intensity, the data of this time period were excluded from our analysis (Figure 5).
The mobile phone time series data were fitted by DFT to extract temporal features. Fourier transform can suppress noise and truly reflect the periodic change of time series data. It is demonstrated that it can be effectively applied to smoothing and interpolating NDVI time series data [46,47,48], and the obtained coefficients are employed as temporal indicators [43].
Assuming that mobile phone time series data are expressed as , they can be decomposed into a set of trigonometric forms:
where is the mean, and and are the jth order cosine trigonometric function and sine trigonometric function, where each order represents a harmonic. is the frequency of the trigonometric function. According to the change frequency of the time profile every day, was set as . N was set to equal 5 and 2, respectively, to fit the mobile phone time series data of weekdays and weekends.
According to Sentinel-2A, Baidu POI, and mobile phone signaling data, 39 features were extracted to describe urban cells (Table 2).
3.4. Prediction Model
In this study, the random forest model was employed as the prediction model, which is insensitive to multicollinearity and robust and has a good prediction effect for various types of observation data [49,50]. Random forest is a decision tree model based on a bagging framework and consists of multiple cart trees. To generate an independent tree, samples and features are randomly selected, which can prevent overfitting. The classification problem is determined by the category with the most output times of individual trees [51].
Real-world datasets are usually composed of many general data samples and a few abnormal but important samples [52]. This study collected 162 samples of residential function areas and only 17 samples of commercial function areas. Class imbalanced data is advantageous to the majority class, and the cost of classifying an abnormal example as a normal example is usually much higher than that of a reverse error [52]. The Synthetic Minority Oversampling Technique (SMOTE) was used to tackle class-imbalance problems at the data level [53]. The basic idea of the SMOTE algorithm is to analyze minority samples and synthesize new samples according to minority samples and add them to the dataset, rather than replicating minority samples. SMOTE and random forest were implemented by the Scikit-Learn package, a free machine learning library for Python programming language.
The number of features (max_features) and decision trees (n_estimators) used to generate decision trees are two main parameters affecting the accuracy of RF classification [35,54]. In the process of model parameter optimization, the ‘GridSearchCV’ method was used for determining the model parameter combination with the highest accuracy in the validation set through cross-validation. The importance of a specific feature is determined by the sum of impurity reduction degrees of branch nodes formed by it in each RF tree [55]. To compare the prediction accuracy of each combination and optimize the random forest parameters, the K-fold stratified cross-validation method was used, and the F1_macro index was utilized to evaluate the model performance. F1_ Macro was obtained by calculating the mean of F1 of all categories (the weight of each category is the same). F1 measurement is the harmonic average of precision and recall. For a specific category C, F1 is defined as follows [56]:
where TP is the number of samples correctly classified as C, FP is the number of samples wrongly classified as C, and FN is the number of samples belonging to C but wrongly classified.
4. Results
4.1. The Overall Identification Performance of Different Combinations
Seven combinations were set up (Table 3) to compare the classification accuracies of random forest under various feature combinations. The F1_macro scores were calculated by random forest with three-fold stratified cross validation, and the process was repeated 50 times, yielding 150 F1_macro values for each combination.
The classification accuracy based on single-source features is less than that based on the combination of different source features. For the classification using single-source features, features derived from Sentinel-2A data had the highest classification accuracy, with an average of 79.62%, while features derived from POI data had the lowest classification accuracy, with an average of 74.83%. The accuracy was the lowest for combining multiple source features when only based on features derived from social sensing data. The combination of the Sentinel-2A, POI, and mobile phone signaling data features exhibited the highest classification accuracy (88.06%) (Figure 6).
4.2. Parameter Tuning of Random Forest
When using features of three data sources concurrently, the classification accuracy was the highest. Based on this understanding, the “GridSearchCV” method was used to find the model with the highest classification accuracy, and the corresponding model parameters ‘max_features’ and ‘n_estimators’ were 9 and 38, respectively, and the ‘F1_macro’ value was 0.88 (Figure 7).
The importance scores of features derived from Sentinel-2A images, mobile phone signaling data, and POI data respectively accounted for 45%, 34%, and 22% of the total scores. The features derived from the Sentinel-2A blue band scored high in importance, while the spectral mean of the blue band (B2_mean) was in the first position. The texture features, “B2_ent” and “B2_asm”, were in the fifth and eighth places, respectively, and the scores of the above three features were in the top three of all derived features of Sentinel-2A. The score of the signaling-derived features of mobile phones ranked second and third. For different time periods of mobile phone signaling-derived features, three of the top five features came from weekend mobile phone signaling data, ranking first and second (Figure 8).
The obtained model was applied to the testing samples to evaluate its generalization ability to a dataset independent of the training data, resulting in an F1_macro value of 74.69%. Regarding the F1 value of each category, the classification accuracy of green space, residence, and industry were high, reaching 86.49%, 81.25%, and 74.51%, respectively. The recall value of public function was 83.33%, while other categories were misclassified as a public function, resulting in an accuracy rate of 52.63%. Only one industrial function sample was wrongly classified as commercial function, whereas four commercial function samples were wrongly classified as public and residential functions (Table 4).
4.3. Spatial Layout of Urban Functional Areas in Changchun
According to the optimized model, the urban function of each grid in the central urban area was identified. The residential, commercial, industrial, public, and green space functional area accounted for 33.51% (204.42 km2), 1.97% (12.01 km2), 26.46% (161.38 km2), 10.42% (63.55 km2), and 27.65% (168.64 km2) of the whole central urban area, respectively. The identified results were consistent with the actual urban function layout of Changchun City. Specifically, the residential function area of Changchun City was mainly located in the central region, and the industrial area and green space were distributed in the surrounding areas. The ecological environment in the southeast of the city was favorable due to a more concentrated distribution of green space (Figure 9). The largest area of the south and southeast regions where the public land was concentrated was university campuses (Figure 9).
5. Discussion
This study evaluated the performance of different source feature combinations in identifying urban functions and predicted the urban function layout of the central urban area of China’s Changchun City. It was found that integrating remote sensing data with social sensing data can significantly improve the identification accuracy, and the accuracy of all features reached 88.06%, which is higher than that of single-source features. The proportion of residential functional areas is the largest in the city, whereas the proportion of green space and industrial functional areas exceeds 25%. Green space functional areas are concentrated around the city, resulting in unequal access to green space for residents in different locations. According to studies, cities in northeast China have a greater supply of green space but are less accessible than those in southern China [57,58]. In conjunction with residential layout, it is meaningful to evaluate spatial disparities in access to urban green space and provide a reference for planning and policy intervention closely related to a location to make the supply of urban green space more equitable and inclusive [57].
The comparison of the prediction accuracy of different features and analysis of the feature importance of the optimal model reveal that the derived features of remote sensing data perform the best, while the derived features of POI data perform the worst. POIs of the same type may be located in different areas and support different functions. For instance, restaurants exist in residential, commercial, and industrial areas [10]. At present, POI data does not include scale information, such as floor area and building area. In addition, different types of points are not balanced, resulting in redundant POI points for the same residential area.
Fourier transform was employed to fit the change curves of mobile phone signaling time series on weekdays and weekends. The obtained features can distinguish between change characteristics of different functional areas, with a prediction accuracy of 79.25%. In addition, derivative characteristics of mobile phone signaling during the weekend are found to be more important than those during the weekday period in the prediction model, indicating that derivative characteristics of the weekend can better represent the population activity rules of various functional areas. The activities of residents vary significantly between weekdays and weekends [59]. For example, people are more likely to go to shopping malls or public cultural places, such as libraries and theatres, during weekends.
The verification of the testing samples reveals a significant risk of public and commercial functions being misclassified. Theoretically, the characteristics of crowd activity in various functional areas are highly differentiated. However, the scope of urban functional areas varies. Commercial and public functional areas are often small in area or attached to other functional buildings [3], whereas the space of original mobile signaling data used in the study is represented by the location of cell towers. However, the distribution of mobile networks is usually uneven, which is related to the population density and traffic facility [26,60]. In general, the cell towers in the central area of the city are densely distributed, while the cell towers in the urban fringe are sparse. The representativeness of the POI function is related to the density of its points. For the industrial functional area, a plant with a large area may be divided into two urban cells, but only one POI represents the location of the plant, resulting in no direct social sensing data to describe its characteristics. It is necessary to determine a reasonable aggregation scale for social sensing data and compare the results with survey data, particularly for tasks of determining the absolute number, such as the O/D volume in a traffic survey [27]. Remote sensing data were consistent in space and possessed relative advantages. However, by constructing smart cities, more accurate data of location information can be used to perceive human activities, such as individual Global Positioning System (GPS) trajectory data or indoor positioning data, and the combination of remote sensing and social sensing data can describe urban function at a fine-grained spatial resolution, as well as the relationships between them. The populations of different ages and occupations in the city have different activity characteristics. The social characteristics of mobile phone users will help to improve the recognition accuracy. The population activity characteristics in urban fringe and central areas are also different. Indicators representing the distance from the urban cell to the urban center (single center or multi center) could be introduced to enrich the features of the urban cell in future research. Additional methods are required to fully investigate the temporal dynamic information of social sensing data. For instance, social sensing data with spatial and temporal dimension information can be regarded as multispectral remote sensing data, allowing for an evaluation of the effectiveness of applying remote sensing image processing methods.
6. Conclusions
The urban functional area is an important basis for considering urban resource allocation and management. Most urban land surveys focus on geographical objects rather than urban functional areas, and due to the complexity of urban systems, most cities lack data on urban functional areas. In this study, social sensing data were used in conjunction with remote sensing data to reflect social characteristics, in which DFT change was employed to extract temporal characteristics from mobile phone signaling data, and then the classification accuracies of different feature combinations were compared using the random forest model. Finally, the optimized RF model was used to map the layout of functional areas of Changchun. The findings indicate that integrating remote sensing and social sensing data can significantly improve the identification accuracy of urban functional areas. The feature importance hierarchy for the optimized model was as follows: features from remote sensing data, mobile signaling data, and POI data. For different functional areas, dynamic characteristics of the weekend were more distinguishable than those of the working day period. Residential areas represent the highest proportion (33.51%) in Changchun, which are mainly distributed in the central area, while industrial areas and green spaces are mainly distributed around.
The combination of social sensing data and remote sensing data achieved high recognition accuracy of urban functional areas. Urban area is a complex system with high heterogeneity. Some issues still need to be further discussed in the future, such as how to obtain social sensing data considering population characteristics, to describe spatial proximity characteristics, and to make up for the spatial sparsity of social sensing data.
Supplementary Materials
The following are available online at https://www.mdpi.com/article/10.3390/rs13224512/s1, Experiment_dataset.csv: Examples of urban cells and related features; Comparison_of_classification_accuracy.py: Code for evaluating identification performance of different feature combinations; RF_parameter_optimization.py: Code for parameter tuning of RF; RF_trained.sav: Optimized RF model.
Author Contributions
Conceptualization, S.C., Z.W. and D.M.; Data curation, F.L. and L.L.; Formal analysis, S.C. and D.M.; Writing—original draft, S.C.; Writing—review & editing, D.M. and H.Y. All authors have read and agreed to the published version of the manuscript.
Funding
This study was jointly supported by the funding from the Strategic Priority Research Program of the Chinese Academy of Sciences (XDA19040500), the Science and Technology Development Program of Jilin Province (20200301014RQ), the Youth Innovation Promotion Association, Chinese Academy of Sciences (2017277), and the National Earth System Science Data Center (www.geodata.cn).
Acknowledgments
The authors would like to thank the anonymous reviewers and handling editors for their constructive comments.
Conflicts of Interest
The authors declare no conflict of interest.
References
- Zhou, T.; Liu, X.; Qian, Z.; Chen, H.; Tao, F. Automatic Identification of the Social Functions of Areas of Interest (AOIs) Using the Standard Hour-Day-Spectrum Approach. ISPRS Int. J. Geo-Inf. 2019, 9, 7. [Google Scholar] [CrossRef] [Green Version]
- Lin, T.; Sun, C.; Li, X.; Zhao, Q.; Zhang, G.; Ge, R.; Ye, H.; Huang, N.; Yin, K. Spatial pattern of urban functional landscapes along an urban–rural gradient: A case study in Xiamen City, China. Int. J. Appl. Earth Obs. 2016, 46, 22–30. [Google Scholar] [CrossRef]
- Chen, Y.; Liu, X.; Li, X.; Liu, X.; Yao, Y.; Hu, G.; Xu, X.; Pei, F. Delineating urban functional areas with building-level social media data: A dynamic time warping (DTW) distance based k -medoids method. Landsc. Urban Plan. 2017, 160, 48–60. [Google Scholar] [CrossRef]
- Heiden, U.; Heldens, W.; Roessner, S.; Segl, K.; Esch, T.; Mueller, A. Urban structure type characterization using hyperspectral remote sensing and height information. Landsc. Urban Plan. 2012, 105, 361–375. [Google Scholar] [CrossRef]
- Matsuoka, R.H.; Kaplan, R. People needs in the urban landscape: Analysis of Landscape and Urban Planning contributions. Landsc. Urban Plan. 2008, 84, 7–19. [Google Scholar] [CrossRef]
- Gu, C.; Hu, L.; Cook, I.G. China’s urbanization in 1949–2015: Processes and driving forces. Chin. Geogr. Sci. 2017, 27, 847–859. [Google Scholar] [CrossRef]
- Martínez, L. Health differences in an unequal city. Cities 2021, 108, 102976. [Google Scholar] [CrossRef]
- Zhang, X.; Du, S.; Wang, Q. Hierarchical semantic cognition for urban functional zones with VHR satellite images and POI data. ISPRS J. Photogramm. Remote Sens. 2017, 132, 170–184. [Google Scholar] [CrossRef]
- Li, C.; Wang, J.; Wang, L.; Hu, L.; Gong, P. Comparison of Classification Algorithms and Training Sample Sizes in Urban Land Classification with Landsat Thematic Mapper Imagery. Remote Sens. 2014, 6, 964–983. [Google Scholar] [CrossRef] [Green Version]
- Gao, S.; Janowicz, K.; Couclelis, H. Extracting urban functional regions from points of interest and human activities on location-based social networks. Trans. GIS 2017, 21, 446–467. [Google Scholar] [CrossRef]
- Herold, M.; Couclelis, H.; Clarke, K.C. The role of spatial metrics in the analysis and modeling of urban land use change. Comput. Environ. Urban. Syst. 2005, 29, 369–399. [Google Scholar] [CrossRef]
- Wu, S.; Qiu, X.; Usery, E.L.; Wang, L. Using Geometrical, Textural, and Contextual Information of Land Parcels for Classification of Detailed Urban Land Use. Ann. Am. Assoc. Geogr. 2009, 99, 76–98. [Google Scholar] [CrossRef]
- Lu, Y.; Liu, Y. Pervasive location acquisition technologies: Opportunities and challenges for geospatial studies. Comput. Environ. Urban Syst. 2012, 36, 105–108. [Google Scholar] [CrossRef]
- Liu, Y.; Liu, X.; Gao, S.; Gong, L.; Kang, C.; Zhi, Y.; Chi, G.; Shi, L. Social Sensing: A New Approach to Understanding Our Socioeconomic Environments. Ann. Am. Assoc. Geogr. 2015, 105, 512–530. [Google Scholar] [CrossRef]
- Ferreira, A.P.G.; Silva, T.H.; Loureiro, A.A.F. Uncovering spatiotemporal and semantic aspects of tourists mobility using social sensing. Comput. Commun. 2020, 160, 240–252. [Google Scholar] [CrossRef]
- Chen, Z.; Huang, X.; Arisona, S.M.; Schmitt, G.; Batty, M. Inferring building functions from a probabilistic model using public transportation data. Comput. Environ. Urban. Syst. 2014, 48, 124–137. [Google Scholar]
- Cui, H.; Wu, L.; Hu, S.; Lu, R.; Wang, S. Recognition of Urban Functions and Mixed Use Based on Residents’ Movement and Topic Generation Model: The Case of Wuhan, China. Remote Sens. 2020, 12, 2889. [Google Scholar] [CrossRef]
- Jendryke, M.; Balz, T.; McClure, S.C.; Liao, M. Putting people in the picture: Combining big location-based social media data and remote sensing imagery for enhanced contextual urban information in Shanghai. Comput. Environ. Urban Syst. 2017, 62, 99–112. [Google Scholar] [CrossRef] [Green Version]
- Dong, X.; Xu, Y.; Huang, L.; Liu, Z.; Xu, Y.; Zhang, K.; Hu, Z.; Wu, G. Exploring Impact of Spatial Unit on Urban Land Use Mapping with Multisource Data. Remote Sens. 2020, 12, 3597. [Google Scholar] [CrossRef]
- Zhang, Y.; Li, Q.; Huang, H.; Wu, W.; Du, X.; Wang, H. The Combined Use of Remote Sensing and Social Sensing Data in Fine-Grained Urban Land Use Mapping: A Case Study in Beijing, China. Remote Sens. 2017, 9, 865. [Google Scholar] [CrossRef] [Green Version]
- Wang, Y.; Gu, Y.; Dou, M.; Qiao, M. Using Spatial Semantics and Interactions to Identify Urban Functional Regions. ISPRS Int. J. Geo-Inf. 2018, 7, 130. [Google Scholar] [CrossRef] [Green Version]
- Zhang, Y.; Marshall, S.; Cao, M.; Manley, E.; Chen, H. Discovering the evolution of urban structure using smart card data: The case of London. Cities 2021, 112, 103157. [Google Scholar] [CrossRef]
- Zhen, F.; Cao, Y.; Qin, X.; Wang, B. Delineation of an urban agglomeration boundary based on Sina Weibo microblog ‘check-in’ data: A case study of the Yangtze River Delta. Cities 2017, 60, 180–191. [Google Scholar] [CrossRef]
- Long, Y.; Zhang, Y.; Cui, C. Identifying commuting pattern of Beijing using bus smart card data. Acta Geogr. Sin. 2012, 67, 1339–1352. [Google Scholar]
- Lane, N.D.; Miluzzo, E.; Lu, H.; Peeble, D.; Choudhury, T.; Campbell, A. A Survey of Mobile Phone Sensing. IEEE Commun. Mag. 2010, 48, 140–150. [Google Scholar] [CrossRef]
- Ahas, R.; Silm, S.; Järv, O.; Saluveer, E.; Tiru, M. Using Mobile Positioning Data to Model Locations Meaningful to Users of Mobile Phones. J. Urban Technol. 2010, 17, 3–27. [Google Scholar] [CrossRef]
- Sevtsuk, A.; Ratti, C. Does Urban Mobility Have a Daily Routine? Learning from the Aggregate Data of Mobile Networks. J. Urban Technol. 2010, 17, 41–60. [Google Scholar] [CrossRef]
- Alexander, L.; Jiang, S.; Murga, M.; González, M.C. Origin–destination trips by purpose and time of day inferred from mobile phone data. Transport. Res. C-Emer. 2015, 58, 240–250. [Google Scholar] [CrossRef]
- Tu, W.; Hu, Z.; Li, L.; Cao, J.; Jiang, J.; Li, Q.; Li, Q. Portraying Urban Functional Zones by Coupling Remote Sensing Imagery and Human Sensing Data. Remote Sens. 2018, 10, 141. [Google Scholar] [CrossRef] [Green Version]
- Pei, T.; Sobolevsky, S.; Ratti, C.; Shaw, S.-L.; Li, T.; Zhou, C. A new insight into land use classification based on aggregated mobile phone data. Int. J. Geogr. Inf. Sci. 2014, 28, 1988–2007. [Google Scholar] [CrossRef] [Green Version]
- Ma, Q.; Gong, Z.; Kang, J.; Tao, R.; Dang, A. Measuring Functional Urban Shrinkage with Multi-Source Geospatial Big Data: A Case Study of the Beijing-Tianjin-Hebei Megaregion. Remote Sens. 2020, 12, 2513. [Google Scholar] [CrossRef]
- Chang, S.; Jiang, Q.; Zhao, Y. Integrating CFD and GIS into the Development of Urban Ventilation Corridors: A Case Study in Changchun City, China. Sustainability 2018, 10, 1814. [Google Scholar] [CrossRef] [Green Version]
- Jia, M.; Wang, Z.; Mao, D.; Ren, C.; Wang, C.; Wang, Y. Rapid, robust, and automated mapping of tidal flats in China using time series Sentinel-2 images and Google Earth Engine. Remote Sens. Environ. 2021, 255, 112285. [Google Scholar] [CrossRef]
- Roy, D.P.; Li, J.; Zhang, H.K.; Yan, L. Best practices for the reprojection and resampling of Sentinel-2 Multi Spectral Instrument Level 1C data. Remote Sens. Lett. 2016, 7, 1023–1032. [Google Scholar] [CrossRef]
- Zong, L.; He, S.; Lian, J.; Bie, Q.; Wang, X.; Dong, J.; Xie, Y. Detailed Mapping of Urban Land Use Based on Multi-Source Data: A Case Study of Lanzhou. Remote Sens. 2020, 12, 1987. [Google Scholar] [CrossRef]
- The Sentinels Scientific Data Hub. Available online: https://scihub.copernicus.eu/ (accessed on 21 January 2021).
- Chang, S.; Wang, Z.; Mao, D.; Guan, K.; Jia, M.; Chen, C. Mapping the Essential Urban Land Use in Changchun by Applying Random Forest and Multi-Source Geospatial Data. Remote Sens. 2020, 12, 2488. [Google Scholar] [CrossRef]
- Wang, B.; Wang, L.; Liu, Y.; Yang, B.; Huang, X.; Yang, M. Characteristics of jobs-housing spatial distribution in Beijing based on mobile phone signaling data. Prog. Geog. 2020, 39, 2028–2042. [Google Scholar] [CrossRef]
- Gong, P.; Chen, B.; Li, X.; Liu, H.; Wang, J.; Bai, Y.; Chen, J.; Chen, X.; Fang, L.; Feng, S.; et al. Mapping essential urban land use categories in China (EULUC-China): Preliminary results for 2018. Sci. Bull. 2020, 65, 182–187. [Google Scholar] [CrossRef] [Green Version]
- Su, M.; Guo, R.; Chen, B.; Hong, W.; Wang, J.; Feng, Y.; Xu, B. Sampling Strategy for Detailed Urban Land Use Classification: A Systematic Analysis in Shenzhen. Remote Sens. 2020, 12, 1497. [Google Scholar] [CrossRef]
- Introduction of Sen2cor. Available online: http://step.esa.int/main/snap-supported-plugins/sen2cor/ (accessed on 22 January 2021).
- Mao, D.; Luo, L.; Wang, Z.; Wilson, M.C.; Zeng, Y.; Wu, B.; Wu, J. Conversions between natural wetlands and farmland in China: A multiscale geospatial analysis. Sci. Total Environ. 2018, 634, 550–560. [Google Scholar] [CrossRef]
- Wang, J.; Hadjikakou, M.; Bryan, B.A. Consistent, accurate, high resolution, long time-series mapping of built-up land in the North China Plain. GISci. Remote Sens. 2021, 1–17. [Google Scholar] [CrossRef]
- Mao, D.; Wang, Z.; Du, B.; Li, L.; Tian, Y.; Jia, M.; Zeng, Y.; Song, K.; Jiang, M.; Wang, Y. National wetland mapping in China: A new product resulting from object-based and hierarchical classification of Landsat 8 OLI images. ISPRS J. Photogramm. Remote Sens. 2020, 164, 11–25. [Google Scholar] [CrossRef]
- Tu, Y.; Chen, B.; Zhang, T.; Xu, B. Regional Mapping of Essential Urban Land Use Categories in China: A Segmentation-Based Approach. Remote Sens. 2020, 12, 1058. [Google Scholar] [CrossRef] [Green Version]
- Moody, A.; Johnson, D.M. Land-Surface Phenologies from AVHRR Using the Discrete Fourier Transform. Remote Sens. Environ. 2001, 75, 305–323. [Google Scholar] [CrossRef]
- Roerink, G.J.; Menenti, M.; Verhoef, W. Reconstructing cloudfree NDVI composites using Fourier analysis of time series. Int. J. Remote Sens. 2000, 21, 1911–1917. [Google Scholar] [CrossRef]
- Pastor-Guzman, J.; Dash, J.; Atkinson, P.M. Remote sensing of mangrove forest phenology and its environmental drivers. Remote Sens. Environ. 2018, 205, 71–84. [Google Scholar] [CrossRef] [Green Version]
- Collins, L.; Mccarthy, G.; Mellor, A.; Newell, G.; Smith, L. Training data requirements for fire severity mapping using Landsat imagery and random forest. Remote Sens. Environ. 2020, 245, 111839. [Google Scholar] [CrossRef]
- Ghimire, B.; Rogan, J.; Miller, J. Contextual land-cover classification: Incorporating spatial dependence in land-cover classification models using random forests and the Getis statistic. Remote Sens. Lett. 2010, 1, 45–54. [Google Scholar] [CrossRef] [Green Version]
- Kranjčić, N.; Medak, D.; Župan, R.; Rezo, M. Machine Learning Methods for Classification of the Green Infrastructure in City Areas. ISPRS Int. J. Geo-Inf. 2019, 8, 463. [Google Scholar] [CrossRef] [Green Version]
- Chawla, N.V.; Bowyer, K.W.; Hall, L.O.; Kegelmeyer, W.P. SMOTE: Synthetic Minority Over-sampling Technique. J. Artif. Intell. Res. 2002, 16, 321–357. [Google Scholar] [CrossRef]
- Blagus, R.; Lusa, L. SMOTE for high-dimensional class-imbalanced data. BMC Bioinform. 2013, 14, 106. [Google Scholar] [CrossRef] [PubMed] [Green Version]
- Sheykhmousa, M.; Mahdianpari, M.; Ghanbari, H.; Mohammadimanesh, F.; Ghamisi, P.; Homayouni, S. Support Vector Machine Versus Random Forest for Remote Sensing Image Classification: A Meta-Analysis and Systematic Review. IEEE J.-STARS 2020, 13, 6308–6325. [Google Scholar] [CrossRef]
- Hayes, M.M.; Miller, S.N.; Murphy, M.A. High-resolution landcover classification using Random Forest. Remote Sens. Lett. 2014, 5, 112–121. [Google Scholar] [CrossRef]
- Wang, Y.; Feng, L. A new hybrid feature selection based on multi-filter weights and multi-feature weights. Appl. Intell. 2019, 49, 4033–4057. [Google Scholar] [CrossRef]
- Wu, L.; Kim, S.K. Exploring the equality of accessing urban green spaces: A comparative study of 341 Chinese cities. Ecol. Indic. 2021, 121, 107080. [Google Scholar] [CrossRef]
- Pan, Z.; Wang, J. Spatially heterogeneity response of ecosystem services supply and demand to urbanization in China. Ecol. Eng. 2021, 169, 106303. [Google Scholar] [CrossRef]
- Jia, T.; Jiang, B. Exploring Human Activity Patterns Using Taxicab Static Points. ISPRS Int. J. Geo-Inf. 2012, 1, 89–107. [Google Scholar] [CrossRef] [Green Version]
- Ahas, R.; Aasa, A.; Silm, S.; Aunap, R.; Kalle, H.; Mark, Ü. Mobile Positioning in Space–Time Behaviour Studies: Social Positioning Method Experiments in Estonia. Cartogr. Geogr. Inf. Sci. 2007, 34, 259–273. [Google Scholar] [CrossRef]
Figure 1.
Location of the central area of Changchun. The data source of the remote sensing image base map is Sentinel-2A.
Figure 1.
Location of the central area of Changchun. The data source of the remote sensing image base map is Sentinel-2A.

Figure 2.
Spatial distribution characteristics of POI. (a) Location of different types of POI; (b) Density of POI.
Figure 2.
Spatial distribution characteristics of POI. (a) Location of different types of POI; (b) Density of POI.

Figure 3.
Spatial pattern of cell towers. (a) Location of cell towers; (b) Density of cell towers.

Figure 4.
The overall process of integrating remote sensing data and social sensing data to identify urban functional areas.
Figure 4.
The overall process of integrating remote sensing data and social sensing data to identify urban functional areas.

Figure 5.
Profiles of mobile phone time series in different functional areas.

Figure 6.
Comparison of the classification accuracy using different feature combinations.

Figure 7.
‘F1_macro’ values under different parameter combinations.

Figure 8.
Comparison of feature importance. (a) The top 20 important features; (b) Importance ranking of mobile phone signaling-derived features.
Figure 8.
Comparison of feature importance. (a) The top 20 important features; (b) Importance ranking of mobile phone signaling-derived features.


Figure 9.
Spatial pattern of urban functional areas.


Table 1.
Statistical table of the training samples and testing samples.
| Function Types | Training Samples | Testing Samples |
|---|---|---|
| Residential | 110 | 52 |
| Commercial | 8 | 9 |
| Industrial | 64 | 25 |
| Public | 30 | 12 |
| Green space | 40 | 17 |
| Total | 252 | 115 |
Table 2.
Summary of the derived features for urban function identification.
| Data Source | Feature Description | Feature Name | Count |
|---|---|---|---|
| Sentinel-2A | Mean of blue, green, red, near-infrared, and mid-infrared bands | B2_mean, B3_mean, B4_mean, B8_mean, B11_mean | 5 |
| Texture mean value of blue, green, and red bands | B2_ent, B2_corr, B2_asm, B3_ent, B3_corr, B3_asm, B4_ent, B4_corr, B4_asm | 9 | |
| Mean value of NDVI and NDBI | NDVI_mean, NDBI_mean | 2 | |
| Baidu POI | Total POI and total POI types | POI_Num, POI_Type | 2 |
| Mean kernel density of POI | Des_Res, Des_Com, Des_Ind, Des_Pub, Des_Gre | 5 | |
| Mobile signaling data | The coefficients of discrete Fourier transform of weekday data | Week_c0, Week_a1, Week_a2, Week_a3, Week_a4, Week_a5, Week_b1, Week_b2, Week_b3, Week_b4, Week_b5 | 11 |
| Coefficients of discrete Fourier transform for weekend data | Wend_c0, Wend_a1, Wend_a2, Wend_b1, Wend_b2 | 5 |
Table 3.
Different combinations of features.
| Combination | Feature Source |
|---|---|
| S1 | Sentinel-2A |
| S2 | Baidu POI |
| S3 | Mobile Signaling data |
| S4 | Mobile Signaling data and Baidu POI |
| S5 | Sentinel-2A and Baidu POI |
| S6 | Sentinel-2A and Mobile Signaling data |
| S7 | Sentinel-2A, Mobile Signaling data and Baidu POI |
Table 4.
The accuracy assessment of the optimized model with testing samples.
| Actual Category | |||||||
|---|---|---|---|---|---|---|---|
| Residential | Commercial | Industrial | Public | Green Space | Precision | ||
| Predicted category | Residential | 39 | 2 | 1 | 2 | 0 | 88.64% |
| Commercial | 0 | 5 | 1 | 0 | 0 | 83.33% | |
| Industrial | 7 | 0 | 19 | 0 | 0 | 73.08% | |
| Public | 3 | 2 | 3 | 10 | 1 | 52.63% | |
| Green space | 3 | 0 | 1 | 0 | 16 | 80.00% | |
| Recall | 75.00% | 55.56% | 76.00% | 83.33% | 94.12% | ||
| F1 | 81.25% | 66.67% | 74.51% | 64.52% | 86.49% | ||
| F1_macro = 74.69% | |||||||
Publisher’s Note: MDPI stays neutral with regard to jurisdictional claims in published maps and institutional affiliations. |
© 2021 by the authors. Licensee MDPI, Basel, Switzerland. This article is an open access article distributed under the terms and conditions of the Creative Commons Attribution (CC BY) license (https://creativecommons.org/licenses/by/4.0/).
Share and Cite
MDPI and ACS Style
Chang, S.; Wang, Z.; Mao, D.; Liu, F.; Lai, L.; Yu, H. Identifying Urban Functional Areas in China’s Changchun City from Sentinel-2 Images and Social Sensing Data. Remote Sens. 2021, 13, 4512. https://doi.org/10.3390/rs13224512
AMA Style
Chang S, Wang Z, Mao D, Liu F, Lai L, Yu H. Identifying Urban Functional Areas in China’s Changchun City from Sentinel-2 Images and Social Sensing Data. Remote Sensing. 2021; 13(22):4512. https://doi.org/10.3390/rs13224512
Chicago/Turabian StyleChang, Shouzhi, Zongming Wang, Dehua Mao, Fusheng Liu, Lina Lai, and Hao Yu. 2021. "Identifying Urban Functional Areas in China’s Changchun City from Sentinel-2 Images and Social Sensing Data" Remote Sensing 13, no. 22: 4512. https://doi.org/10.3390/rs13224512
Note that from the first issue of 2016, this journal uses article numbers instead of page numbers. See further details here.