
Campus Violence Detection Based on Artificial Intelligent Interpretation of Surveillance Video Sequences
by
 , , and
Liang Ye
1,2,3,* ,
,
Tong Liu
1,4,
Tian Han
2,5,
Hany Ferdinando
2,6,
Tapio Seppänen
7 and
Esko Alasaarela
2 1
Department of Information and Communication Engineering, Harbin Institute of Technology, Harbin 150001, China
2
OPEM Research Unit, University of Oulu, 90014 Oulu, Finland
3
Science and Technology on Communication Networks Laboratory, Shijiazhuang 050000, China
4
ChinaUnicom Software Harbin Branch, Harbin 150001, China
5
Jinhua Advanced Research Institute, Jinhua 321000, China
6
Department of Electrical Engineering, Petra Christian University, Surabaya 60236, Indonesia
7
Physiological Signal Analysis Team, University of Oulu, 90014 Oulu, Finland
*
Author to whom correspondence should be addressed.
Remote Sens. 2021, 13(4), 628; https://doi.org/10.3390/rs13040628
Submission received: 31 December 2020
/
Revised: 31 January 2021
/
Accepted: 6 February 2021
/
Published: 9 February 2021
(This article belongs to the Special Issue AI Interpretation of Satellite, Aerial, Ground, and Underwater Image and Video Sequences)
Abstract
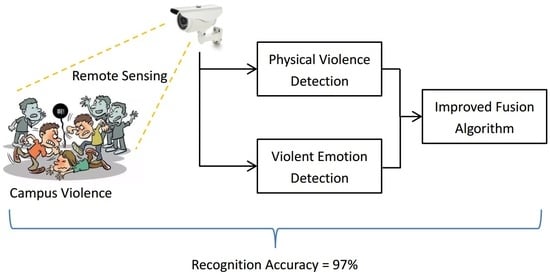
:Campus violence is a common social phenomenon all over the world, and is the most harmful type of school bullying events. As artificial intelligence and remote sensing techniques develop, there are several possible methods to detect campus violence, e.g., movement sensor-based methods and video sequence-based methods. Sensors and surveillance cameras are used to detect campus violence. In this paper, the authors use image features and acoustic features for campus violence detection. Campus violence data are gathered by role-playing, and 4096-dimension feature vectors are extracted from every 16 frames of video images. The C3D (Convolutional 3D) neural network is used for feature extraction and classification, and an average recognition accuracy of 92.00% is achieved. Mel-frequency cepstral coefficients (MFCCs) are extracted as acoustic features, and three speech emotion databases are involved. The C3D neural network is used for classification, and the average recognition accuracies are 88.33%, 95.00%, and 91.67%, respectively. To solve the problem of evidence conflict, the authors propose an improved Dempster–Shafer (D–S) algorithm. Compared with existing D–S theory, the improved algorithm increases the recognition accuracy by 10.79%, and the recognition accuracy can ultimately reach 97.00%.
1. Introduction
School bullying is a common social phenomenon all over the world. School bullying means aggressive behaviors or words which hurt another person intentionally. It is often applied by the stronger upon the weaker, or by the elder upon the younger. Victims of school bullying suffer from both mental and physical violence. School bullying is considered as one of the main reasons for depression, dropping out of school, and adolescent suicide. According to the report “Campus Violence and Bullying” released by UNESCO (United Nations Educational, Scientific and Cultural Organization), in 2017, 243 million students all over the world suffered from campus bullying. Therefore, school bullying prevention is an important and timeless issue.
School bullying has been studied since the 1960s in Sweden, Finland, and Norway. However, traditional school bullying prevention methods are mostly human-driven, i.e., school bullying events are reported by victims or bystanders, which is usually inconvenient and untimely. As smartphones became popular, anti-bullying applications such as ICE BlackBox and TipOff appeared. These applications work in a similar way. When school bullying happens, the victim or a bystander needs to take out his/her smartphone and operate it to send an alarm to his/her parents or teacher, which is hardly possible in a school bullying event. Therefore, an automatic method to detect school bullying is necessary.
As artificial intelligence (AI) techniques and remote sensing (RS) techniques develop, information-driven school bullying detection methods become possible. This paper will introduce one such method. School bullying can happen in various forms, e.g., physical violence, verbal bullying, destroying personal property, and social media bullying. According to an early survey by the authors’ research group, physical violence was considered to be the most harmful to teenagers. Therefore, this paper focuses on the detection of campus violence.
There are two main kinds of method to detect campus violence, i.e., movement sensor-based methods and video sequence-based methods [1]. In the authors’ previous work, they used movement sensor-based methods to detect campus violence. However, movement sensors can be removed by the bullies before they bully the victims. Therefore, in this paper, the authors propose a video sequence-based method to detect campus violence as a complement. We gathered campus violence video sequences and daily-life activity video sequences by role-playing such actions with surveillance cameras. In the pre-processing procedure, 16 frames were processed as one unit. The C3D (Convolutional 3D) neural network was used for feature extraction and classification. In campus violence events, there are often offensive emotions from the bullies and negative emotions from the bullied, so speech emotion recognition can assist campus violence detection. Mel-frequency cepstral coefficient (MFCC) features were extracted from speech, and three speech emotion databases were involved. The C3D neural network was used as the classifier. To solve the problem of evidence conflict when combining the recognition results of activity recognition and speech emotion recognition, the authors proposed an improved Dempster–Shafer (D–S) fusion algorithm. The simulation results show that the proposed campus violence detection method was able to detect violence events at average accuracies of 94.00%, 97.00%, and 92.00% based on three different databases, respectively.
2. Related Work
As sensor techniques develop, activity recognition with artificial intelligence has become a hot topic in areas of remote sensing [2], smart homes, and smart cities [3,4]. Violence recognition with AI techniques [5,6] has also gained more and more attention.
Chen et al. [7] used a 3D convolution neural network and a support vector machine to detect violence in video sequences. The proposed method could effectively detect combat, aggressive action, and violence scenes in real-time video stream, and demonstrated good performance in a hockey fight, crowd violence, and movie violence. They obtained an average accuracy of 89.1% based on the UCF101 database.
Shakil et al. [8] used pre-training modules with different deep learning methods to detect large-scale violence such as riots in the streets. They combined ResNet50 net and long short-term memory (LSTM) net together for violence detection. They achieved an average accuracy of 97.06% based on their collected database.
Eknarin et al. [9] proposed a deep learning method based on time series images. By running a deep convolution neural network on the video database, the violence level of the video database can be classified. They obtained an average accuracy of 88.74% based on the movie database.
Simone et al. [10] proposed a method for overall visual-audio emotion recognition based on multi-task fusion learning and multiple features. This method applied multi-task learning to deep functions in a convolutional neural network model. The function was able to use fewer parameters and predict multiple tasks at the same time. It could improve the sensitivity of single recognition model to user emotion by sharing information among different tasks. The accuracy of emotion recognition for video and audio could reach 81.36%.
Nawaz et al. [11] used a pleasure-displeasure, arousal-nonarousal, dominance-submissiveness (PAD) three-dimensional emotion model to identify the emotion caused by a music video in an individual, and compared the performance of two feature selection methods based on feature and principal component analysis (PCA). They used support vector machine (SVM), K-nearest neighbor (KNN) and decision tree (DT) to test the performance, and the final recognition accuracy reached 78.96%.
Sugan et al. [12] used cepstrum features extracted from equivalent rectangular bandwidth (ERB) triangular filter banks for speech emotion recognition. Two new triangular filter banks were proposed and used together with the traditional filter banks to extract four different cepstrum features. The experimental results show that the maximum recognition accuracies of this method based on speaker-dependent (SD) and speaker-independent (SI) scenes were 77.08% and 55.83%, respectively.
Han et al. [13] proposed a consecutive elimination process (CEP) algorithm to detect campus bullying events by recognizing children’s emotions. They tested the proposed algorithm with both the Berlin database and a violence experiment database, and obtained average accuracies of 79.05% and 66.13%, respectively.
Kushwah et al. [14] applied information fusion to the context awareness system, and proposed a multi-sensor fusion method based on time evidence theory for indoor activity recognition. This fusion method developed an incremental conflict resolution method within the framework of the classical Dempster–Shafer (D–S) evidence theory. Time information was introduced into the multi-sensor environment to improve the recognition accuracy. They obtained an average accuracy of 72.7% based on indoor activities.
A lot of work has been done to detect violent behaviors all over the world, but most of these studies were about social violence such as street fights, and few covered campus violence. Campus violence differs from social violence in the following aspects: (1) the victims in campus violence events usually do not dare to resist, (2) no weapons are used, and (3) campus violence is generally not as strong as social violence, so campus violence sometimes can be confused with playing or sports with physical confrontation. Therefore, in this paper, the authors build their campus violence databases and design a campus violence detecting method. As mentioned above, campus violence can be confused with playing or sports with physical confrontation, so the authors use speech emotion recognition to assist physical violence recognition to finally identify a campus violence event.
The authors firstly detect physical violence with video sequences and detect bullying emotions with audio signals. Then they propose an improved fusion algorithm to combine the detection results together. They finally get average recognition accuracies of 94.00%, 97.00%, and 92.00% based on three different databases, respectively.
3. Materials and Methods
3.1. Video-Based Physical Violence Detection
3.1.1. Data Gathering and Pre-Processing
Since there is no public campus violence database, the authors designed campus violence experiments and took video recordings. Several volunteers participated in the experiment. Experimental data were gathered by role-playing of campus violence and daily-life activities. Campus violence activities included hitting, kicking, etc., whereas daily-life activities included walking, running, etc. Figure 1 shows two examples of the collected video frames.
The authors collected 12,448 frames of campus violence and 12,448 frames of daily-life activities. Firstly, pre-processing was performed. We normalized the size of the images into 112 pixels × 112 pixels. The size of 112 × 112 is a trade-off result between the recognition accuracy and the real-time performance. If the size was too small, the images would lose too much information and thus the recognition accuracy would decline. If the size was too large, the dimension of the input vector would be highly increased, and the computational cost would increase a lot, but the recognition accuracy would not increase significantly. Therefore, experimentally, the authors chose the size of 112 × 112.
Every 16 frames formed one processing unit (one tensor). Thus, the dimensions of one tensor are 3 × 16 × 112 × 112 (3 stands for three color channels, i.e., red, green, and blue). Figure 2 shows the structure of one tensor. Thus, there are 778 campus violence tensors and 778 daily-life activity tensors. The video was recorded without audio, so the authors later used three independent audio databases to combine with the video to form different scenes.
3.1.2. Feature Extraction
The authors built a C3D neural network based on the TensorFlow framework to extract features from video images. The input of the network is the tensor introduced in Section 3.1.1. The C3D neural network is based on eight 3D convolution operations and four 3D maximum pooling operations. The sizes of the convolution kernels in the convolution operations are 3 × 3 × 3, and the step sizes are 1 × 1 × 1. In the first pooling operation, the size of the pooling core is 1 × 2 × 2, and the step size is 1 × 2 × 2. In the remaining three pooling operations, the sizes of the pooling cores are 2 × 2 × 2, and the step sizes are 2 × 2 × 2.
Two fully connected layers follow the convolution and pooling operations. The number of neurons in the first fully connected layer is 4096, and that in the second fully connected layer is 487. The authors selected the 4096-dimensional features output by the first fully connected layer as the input of the classification model. The structure of the C3D neural network is given in Figure 3.
3.1.3. Classifier Design
The authors built a 4-layer neural network for classification. Figure 4 shows the structure of the network model.
The input of this model is the 4096-dimensional feature vector extracted in Section 3.1.2. The target of this work was to detect violent events, which is a 2-class classification, so the number of neurons in the output layer is 2. The authors used two hidden layers in this model, in which the numbers of neurons are set to be 512 and 32, respectively.
In order to prevent over-fitting, dropout was introduced into the hidden layers. The activation functions of the hidden layers use the ReLU function, which is a piecewise linear function and fits deep neural networks. The authors chose the Adagrad optimizer to train the model because the learning rate can be changed automatically. The global learning rate , and the actual rate is given as,
where δ = 10−7. The specific iterative process of the optimizer is given as follows:
- (1)
- Randomly select m samples and their corresponding labels from the training set.
- (2)
- Calculate the gradient value and error, and update the gradient accumulation r.
- (3)
- Update the parameters according to r and the gradient values.
The TensorFlow framework provides 4 cross-entropy functions, and the softmax_cross_entropy_with_logits function optimizes the calculation of the cross-entropy to avoid overflow of the recognition results. Therefore, this paper chose the softmax_cross_entropy_with_logits as the cross-entropy function.
When the authors used this classifier to test the video-based physical violence detection performance, over-fitting occurred and the loss function did not converge. Therefore, the authors improved the loss function by regularizing the weight parameters on the basis of the cross-entropy function.
Firstly, convert the predicted results into probability vectors. Mark the predicted labels as Logits_y = [y1, y2, …, yn], and the real labels as Logits_Y = [Y1, Y2, …, Yn], where n is the number of classes. Convert Logits_y to probability vectors as,
where , i = 1, 2, …, n. Calculate the cross-entropy loss between Logits_softmax and Logits_Y as,
Mark the weight parameters as , , and regularize the weight parameters as,
The improved loss function is given as,
loss = loss_cross + loss_regular
After 50 epochs, the new loss function converged, so this improvement solved the problem of overfitting.
3.2. Audio-Based Bullying Emotion Detection
3.2.1. Audio Databases and Acoustic Features
The authors tested three speech databases in this work, i.e., the CASIA (Institute of Automation of Chinese Academy of Sciences) public database, the Finnish emotional private database, and the Chinese emotional private database. The two private databases were recorded by the authors’ research group, including bullying emotions and daily-life emotions with either single pure emotion or mixed emotions. CASIA is a public database which contains single pure basic emotion, such as happy, sad, and angry. The authors cataloged the basic emotions into bullying emotions, such as angry and frightened, and daily-life emotions, such as happy and neutral. The Finnish emotional database has 132 samples, the Chinese emotional database has 370 samples, and the CASIA database has 960 samples. The ratio of positive and negative samples in the three databases is 1:1.
For speech emotion recognition, MFCC features are commonly used [15] and have proven to be effective [16]. Firstly, we performed voice activity detection (VAD) on the speech signals, and pre-emphasized the active speech signals to weaken the effect of oronasal radiation with a high-pass filter. We then framed the signals into short frames so that each frame can be seen as a stationary stochastic process. To inhibit spectrum leakage, we applied a Hamming window on the frames, and then performed fast Fourier transform (FFT) on the time domain signals to get their corresponding frequency domain signals. We let the frequency domain signals pass a set of Mel filters and get Mel frequency signals. We calculated the logarithm and performed discrete cosine transform (DCT), and finally we obtained the MFCCs. The entire speech emotion recognition procedure is given in Figure 5. The next section will describe the classifier part in detail.
3.2.2. Classifier Design
For bullying emotion recognition, the authors chose the Keras deep learning framework. The constructed neural network model structure is given in Figure 6.
The input of the network is the extracted MFCC features, and the output is a probability indicating bullying or non-bullying. Empirically, the authors applied 6 convolution layers and 2 max_pooling layers. The parameters were set experimentally and aregiven in Figure 6. In the convolution layers, the authors used the ReLU function as the activation function to avoid gradient vanishing. Moreover, the ReLU function does not contain exponential operations, which reduces the computational cost. The dropout layer is involved to avoid over-fitting. The authors selected padding as the convolution method to keep the size of the input vector unchanged to retain original information. The output layer is a flattened layer which outputs a probability indicating violence or non-violence.
3.3. Improved D–S Fusion Algorithm
3.3.1. Classic D–S Fusion Algorithm
Since the video-based physical violence detection procedure and the audio-based bullying emotion detection procedure were executed separately, a combination of the two results was necessary. There were two possible results of physical violence detection and bullying emotion detection, i.e., true and false, so there were four possible combinations,
- (1)
- physical violence = true and bullying emotion = true: this is a typical campus violence scene, and is exactly what the authors want to detect;
- (2)
- physical violence = true and bullying emotion = false: this can be a playing or sport scene with physical confrontation. According to the authors’ observations, campus violence events are usually accompanied by bullying emotions, so this case is classified as non-violence in this paper;
- (3)
- physical violence = false and bullying emotion = true: this can be an argument or a criticism scene. In this paper, the authors focus on physical violence, so they catalog this case into non-violence, too;
- (4)
- physical violence = false and bullying emotion = false: this is a typical non-violent scene.
The fusion result is based on this classification criteria. Moreover, note that the actual outputs of the physical violence recognition and the bullying emotion recognition are not definite results such as true (1) or false (0), but two probabilities. If the output probabilities are simply mapped into 1 or 0 and a simple AND operation combines the two outputs, lots of information provided by the classifiers would be lost. Therefore, a fusion algorithm was necessary.
Dempster–Shafer (D–S) is a kind of uncertain evidential reasoning theory. Even if the prior probability is unknown, the D–S theory can perform fuzzy reasoning on things. Assume that A is a proposition and Θ is the recognition frame of A, i.e., Θ contains all the possible hypotheses of A, and 2Θ contains all the subsets of Θ. In a subset of Θ, if all the elements are mutually exclusive and finite, then there is only one element is the correct hypothesis of A. The hypothesis is supported by several pieces of evidence, and this evidence has certain credibilities as well as uncertainties and insufficiencies. Therefore, D–S defines basic probability assignment (BPA) functions marked as m. The BPA maps the set 2Θ into the period [0,1], i.e., . The BPA function m meets,
where a is a possible hypothesis of A.
Once the recognition frame Θ is determined, mark the BPA function as mi. When making a decision, multiple pieces of evidence are usually taken into consideration. In the classic D–S theory, the fusion function is given as,
where
represents the conflict level between evidence. is the conflict factor. When = 0, it means that there is no conflict between the evidence; when > 0, it means that there is conflict between the evidence, and the conflict level between the evidence is proportional to the value of ; when = 1, it means that there is significant conflict between the evidence, and the classic D–S theory is no longer applicable.
The classic D–S theory has some limitations.
- If there is serious conflict between the evidence, then the fusion result is unsatisfactory;
- It is difficult to identify the degree of fuzziness;
- The fusion result is greatly influenced by the value of probability distribution function.
In this work, there are four possible combinations of video samples and audio samples, i.e., violent video and bullying audio, violent video and non-bullying audio, non-violent video and bullying audio, and non-violent video and non-bullying audio. Among these four combinations, the combination of violent video and bullying audio is considered to be a violent scene, the combination of violent video and non-bullying audio is considered to be a scene of playing or competitive games, the combination of non-violent video and bullying audio is considered to be a criticism scene, and the combination of non-violent video and non-bullying audio is considered to be a daily-life scene. The first scene is considered as violence and marked as positive, and the remaining three are considered as non-violence and marked as negative. In this situation, there exist strong conflicts between video evidence and audio evidence, so the classic D–S theory needs to be improved.
Quite a few researchers are researching the improvement of the classic D–S fusion theory [17]. The improvement of the D–S fusion theory can be divided into two types,
- Improve the BPA functions of certain evidence on certain hypotheses;
- Take the confidence levels and conflict levels of evidence into consideration.
This paper improves the classic D–S fusion algorithm from the two abovementioned aspects, and compares the fusion results to decide the better one.
3.3.2. Improvement on BPA Functions
Firstly, the authors improved the BPA functions. Classic D–S fusion theory has the problem of veto power when a BPA function becomes 0. To solve this problem, BPA functions cannot be 0. Therefore, the authors redefined BPA functions in the form of exponential functions,
where ni is the level of support of evidence i to the hypothesis, and r is a regulatory factor which depends on the level of support. We normalized Ni as,
According to (10), Ni > 0, so the BPA functions cannot be 0. Therefore, the problem of veto power is solved. When fusing the recognition results, not all of the evidence is credible, so this paper introduces a correlation coefficient to represent the confidence level of the evidence. We marked the recognition frame as , and then the correlation coefficient between two pieces of evidence can be expressed as,
where ni represents the support level of evidence i, and represents a recognition result in the recognition frame. According to (12), if the support level of either of the two pieces of evidence is 0, then the correlation coefficient is 0, and this means that the correlation between the two pieces of evidence is weak. If the support levels of two pieces of evidence upon one recognition result are the same, then their correlation coefficient is 1, and this means that the correlation between the two pieces of evidence is strong. Given n pieces of evidence, their correlation coefficient matrix is,
Aij∈[0,1] is the correlation coefficient of evidence i and j, Aij = Aji, and Aij = 1 when i = j. Define the absolute correlation degree as,
We used the absolute correlation degree as the weight of the support level of a piece of evidence on a recognition result, and recalculated the support level as,
Finally, we fused the recognition results with the new evidence.
3.3.3. Improvement on Fusion Rules
Although the above-mentioned improvement can solve the problem of veto power, the computational cost is increased. Therefore, the authors considered improving the fusion rules.
The Yager fusion rule is an improvement of the classic D–S fusion theory. The Yager fusion rule introduces an unknown proposition m(X) to solve the problem of evidence conflict. The improvement is given as,
where A, B, and C are recognition results and m(A) means the probability of result A, X is an unknown proposition, and k is a conflict factor which is defined as,
Although the Yager algorithm can decrease the credibility of evidence with significant conflicts, it brings in more uncertainty. Therefore, some researchers [18] improved the Yager fusion algorithm. Mark evidence as m1, m2, …, mn, and recognition result sets as F1, F2, …, Fn. The conflict factor k is defined as,
The improved Yager fusion rule introduces a new concept named evidence credibility, which is calculated as,
where n is the number of pieces of evidence. Calculate the average support level of evidence on recognition result A as,
The improved Yager fusion algorithm introduces the concepts of evidence credibility and average support level, based on which a new fusion rule is proposed as,
This paper further improves this fusion rule by assigning evidence conflict levels according to the average support levels on the recognition results. The proposed fusion rule is given as,
where k represents the conflict between evidence. This fusion rule can be rewritten as,
where y(A) is the average trust level on A. The calculation of the average trust level is given as below.
Firstly, define the energy function of a recognition result as,
where |A| represents the number of possible recognition results.
Assume that m1 and m2 are two independent pieces of evidence on the recognition frame Θ, and Ai and Bj (i, j = 1, 2, …, n) are the focal elements (masses) of them. Mark their non-empty intersection as Ck (k = 1, 2, …, n), the union of the recognition frames of two completely conflicting pieces of evidence as F, and Fi represents a certain recognition result in F. Then, the energy function of conflicting focal elements is,
The average trust level is calculated as follows:
Step 1. Perform basic evidence fusion as,
If there is significant conflict between two pieces of evidence, it is difficult to judge which evidence is correct without a third piece of evidence. Therefore, the authors assigned this conflict in the intersection of the two evidence, given as,
Step 2. Two pieces of evidence are related if the intersection of their recognition frames is not empty. Then, calculate the related conflict sum of the two evidences as,
Step 3. Assign the conflict according to the conflict energy of the related focal elements as,
Step 4. Calculate the average trust level as,
Section 4 will give a comparison of the existing algorithm and the improved algorithms.
4. Results
4.1. Video-Based Physical Violence Classification Results
Firstly, the authors tested the classification performance of the video-based physical violence detecting algorithm. Five-fold cross validation was used for the collected video dataset, i.e., the dataset was divided into five equal parts, four of which were used as the training set and one as the testing set, and the classification procedure was repeated five times to get an average recognition result. Table 1 shows the recognition result.
According to Table 1, the average recognition accuracy of the video-based physical violence detecting algorithm is 92.00%. The precision is 95.65%, and the recall is 88.00%. Precision is a parameter which reflects the false alarm ratio, whereas recall reflects the missing alarm ratio. The false alarm ratio is equal to 1-precision, and the missing alarm ratio is equal to 1-recall. Normally, precision and recall are two contradictory indicators, so the F1-score is introduced to give an overall evaluation of the classification model. In this section, the physical violence detecting algorithm gives an F1-score of 91.67%, which shows that the overall classification performance of this algorithm is good.
4.2. Audio-Based Bullying Emotion Classification Results
The purpose of this paper is to recognize school bullying events, so the recognition results are cataloged into two classes, i.e., school bullying emotion and non-bullying emotion. The Finnish emotional private database and the Chinese emotional private database were gathered by the authors’ research group by role playing school bullying, so they are already ready for bullying emotion recognition. The CASIA public database is composed of single basic emotions such as happy and sad, so the authors first catalog them into bullying or non-bullying emotions, and then perform classification. The authors used five-fold cross validation to test the performance of the designed classifier on the three emotion databases, and Table 2 shows the recognition results.
According to Table 2, the Finnish database achieved the best performance. This is because that the Finnish database was gathered by role playing of school bullying by Finnish pupils, and they acted out the bullying scenarios very well. The CASIA database was recorded by professional actors and actresses, and they also did well, but the emotional speeches were not particular for school bullying scenarios, and the authors cataloged them manually into bullying emotions and non-bullying emotions, so the results were not as good as the Finnish database. The Chinese database was gathered by the authors’ group members who were not professional, and they thus felt embarrassed to express bullying emotions, so the emotional samples were not very good, and the recognition results were not good either. In any case, the recognition accuracies based on the three databases are all larger than 88%, so the emotion recognition model is proven to be effective.
4.3. Improved D–S Fusion Classification Results
The authors first tested the classic D–S fusion algorithm with a playing sample in which people have frequent physical contact, and Table 3 shows the recognition result.
According to Table 3, there is a strong conflict between the video-based evidence and the audio-based evidence, and the classic D–S fusion algorithm gave an incorrect result. Then the authors tested another example of a violent scene, and Table 4 shows the fusion result.
Comparing Table 3 with Table 4, one can see that the support level of the audio evidence changed very little, but the D–S fusion result changed a lot, and again the hypothesis was incorrect, so the classic D–S fusion algorithm is unable to give a reliable prediction when the pieces of evidence have significant conflict between each other.
Then, the authors improved the BPA functions of the classic D–S fusion algorithm (Section 3.3.2), and Table 5 shows the improved result.
The values of the focal element functions vary with the adjusting factor r, as shown in Figure 7.
In Figure 7, focal element A (mass A) represents the violent event, whereas focal element B (mass B) represents the non-violent event. In the period [0.6, 0.8], the variations of focal element A and focal element B are gentle. In this situation, r = 0.7 is the best choice. For this sample, the support level for violence is 0.76, whereas that for non-violence is 0.22, so the recognition result of this sample is violence, which is the true label.
Although this improvement solved the problem of veto power in the classic D–S theory, it also brought in much more computational cost. Moreover, the adjusting factor r needs to be fixed experimentally, which is not convenient in practical use. Therefore, the authors then tested their method, which improves the fusion rule as described in Section 3.3.3. The authors tested the fusion results of the video database combined with all the three audio databases, and Table 6 shows the recognition results of different fusion algorithms on different combined audio databases with five-fold cross validation.
In these tables, the authors compared three fusion algorithms, i.e., the Yager fusion algorithm, the improved fusion algorithm proposed in Section 3.3.2, and the improved fusion algorithm proposed in Section 3.3.3. Since the classic D–S fusion has the problem of veto power, the authors did not involve it in this comparison. As shown in Table 6, the improved fusion algorithm proposed in Section 3.3.3 on average achieved the best recognition performance. Note that, as mentioned above, the Finnish emotional private database was collected by role playing school bullying, so this database best represents bullying and non-bullying emotions, and the bullying emotion recognition algorithm performed best based on this database. Based on this emotional database and the video database, the proposed fusion algorithm showed the best performance, so the proposed campus violence detecting algorithm is able to detect possible violent events in practical usage.
5. Discussion and Conclusions
Campus violence is a serious social problem among teenagers all over the world. As artificial intelligence techniques and remote sensing techniques develop, there are now new methods to detect violent events automatically. This paper proposed a campus violence detecting method based on video sequences and speech emotion. The authors collected video image samples by role-playing campus violence and non-violence scenes with surveillance cameras. As for emotional speech samples, we involved three different databases. We first performed activity recognition and emotion recognition separately, and then fused the recognition results together. To overcome the problem of vote power, the authors proposed an improved fusion algorithm. The proposed campus violence detecting method can achieve an average recognition accuracy of 97.00% on the video database combined with the Finnish emotional database. Although the databases used are different, a simple comparison between the proposed method and the existing work is still possible. The proposed method exceeds most of the existing work in the aspect of recognition accuracy, and is similar to Reference [8]. Moreover, as the main contribution of this work, the improved fusion algorithm can improve the recognition accuracy by 10.79% compared with the existing fusion rule.
Activity recognition can not only be performed on original images, but also on extracted skeleton graphs [19]. In future work, the authors will perform skeleton-based activity recognition methods for campus violence detection, and make a comparison with body-based ones. Interestingly, in this manuscript, the authors use emotion recognition to assist activity recognition, but conversely, activity recognition can also be used to assist emotion recognition [20]. In future, the authors will also try this method to detect quarrelling.
Author Contributions
Conceptualization, L.Y. and E.A.; methodology, L.Y. and T.L.; software, T.L. and L.Y.; validation, T.L. and L.Y.; formal analysis, L.Y. and T.L.; investigation, L.Y. and T.L.; resources, all the authors; data curation, L.Y.; Writing—Original draft preparation, L.Y. and T.L.; Writing—Review and editing, L.Y., E.A., T.L., T.H., T.S. and H.F.; visualization, all the authors; supervision, T.S. and E.A.; project administration, L.Y. and E.A.; funding acquisition, L.Y. and H.F. All authors have read and agreed to the published version of the manuscript.
Funding
This research was funded by National Natural Science Foundation of China, grant number 41861134010; Key Laboratory of Information Transmission and Distribution Technology of Communication Network, grant number HHX20641X002; National Key R&D Program of China (No.2018YFC0807101); Basic scientific research project of Heilongjiang Province, grant number KJCXZD201704; and Finnish Cultural Foundation, North-Ostrobothnia Regional Fund 2017. The APC was funded by National Natural Science Foundation of China, grant number 41861134010, and National Key R&D Program of China, grant number 2018YFC0807101.
Institutional Review Board Statement
The study was conducted according to the guidelines of the Declaration of Helsinki, and approved by the Institutional Review Board of Harbin Institute of Technology.
Informed Consent Statement
Informed consent was obtained from all subjects involved in the study.
Data Availability Statement
The CASIA database can be found at https://download.csdn.net/download/heqiang525/10144629 (accessed on 12 September 2019).
Acknowledgments
The authors thank the people who have participated in the campus violence role-playing experiments.
Conflicts of Interest
The authors declare no conflict of interest. The funders participated in the design of the study, the collection, analyses and interpretation of data, the writing of the manuscript, and the decision to publish the results.
References
- Dang, L.M.; Min, K.; Wang, H.; Piran, J.; Lee, C.H.; Moon, H. Sensor-based and vision-based human activity recognition: A comprehensive survey. Pattern Recognit. 2020, 108, 107561. [Google Scholar] [CrossRef]
- Zhiqiang, G.; Dawei, L.; Kaizhu, H.; Yi, H. Context-aware human activity and smartphone position-mining with motion sensors. Remote Sens. 2019, 11, 2531. [Google Scholar] [CrossRef] [Green Version]
- Tian, W.; Yang, C.; Hongqiang, L.; Jing, T.; Hichem, S.; Fei, T. Online detection of action start via soft computing for smart city. IEEE Trans. Ind. Inform. 2021, 17, 524–533. [Google Scholar]
- Liu, X.; Jia, M.; Zhang, X.; Lu, W. A novel multichannel Internet of things based on dynamic spectrum sharing in 5G communication. IEEE Internet Things 2019, 6, 5962–5970. [Google Scholar] [CrossRef]
- Serrano, I.; Deniz, O.; Espinosa-Aranda, J.L.; Bueno, G. Fight recognition in video using Hough forests and 2D convolutional neural network. IEEE Trans. Image Process. 2018, 27, 4787–4797. [Google Scholar] [CrossRef] [PubMed]
- Serrano, I.; Deniz, O.; Bueno, G.; Garcia-Hernando, G.; Kim, T.-K. Spatio-temporal elastic cuboid trajectories for efficient fight recognition using Hough forests. Mach. Vis. Appl. 2018, 29, 207–217. [Google Scholar] [CrossRef]
- Chen, J.; Xu, Y.; Zhang, C.; Xu, Z.; Meng, X.; Wang, J. An improved two-stream 3D convolutional neural network for human action recognition. In Proceedings of the 2019 25th International Conference on Automation and Computing (ICAC), Lancaster, UK, 5–7 September 2019. [Google Scholar] [CrossRef]
- Sumon, S.A.; Goni, R.; Hashem, N.B.; Shahria, T.; Rahman, R.M. Violence detection by pretrained modules with different deep learning approaches. Vietnam J. Comput. Sci. 2020, 7, 22–23. [Google Scholar] [CrossRef]
- Eknarin, D.; Luepol, P.; Suwatchai, K. Video Representation Learning for CCTV-Based Violence Detection. In Proceedings of the 2018 3rd Technology Innovation Management and Engineering Science International Conference (TIMES-iCON), Bangkok, Thailand, 12–14 December 2018. [Google Scholar] [CrossRef]
- Accattoli, S.; Sernani, P.; Falcionelli, N.; Mekuria, D.N.; Dragoni, A.F. Violence detection in videos by combining 3D convolutional neural networks and support vector machines. Appl. Artif. Intell. 2020, 34, 202–203. [Google Scholar]
- Nawaz, R.; Cheah, K.H.; Nisar, H.; Yap, V.V. Comparison of different feature extraction methods for EEG-based emotion recognition. Biocybern. Biomed. Eng. 2020, 1, 101–102. [Google Scholar] [CrossRef]
- Sugan, N.; Srinivas, N.S.; Kumar, L.S.; Nath, M.K.; Kanhe, A. Speech emotion recognition using cepstral features extracted with novel triangular filter banks based on bark and ERB frequency scales. Digit. Signal Process. 2020, 1, 608–609. [Google Scholar]
- Han, T.; Zhang, J.; Zhang, Z.; Sun, G.; Ye, L.; Ferdinando, H.; Alasaarela, E.; Seppänen, T.; Yu, X.; Yang, S. Emotion recognition and school violence detection from children speech. Eurasip J. Wirel. Commun. Netw. 2018, 235. [Google Scholar] [CrossRef] [Green Version]
- Kushwah, A.; Kumar, S.; Hegde, R.M. Multi-sensor data fusion methods for indoor activity recognition using temporal evidence theory. Pervasive Mob. Comput. 2015, 21, 19–29. [Google Scholar] [CrossRef]
- Fahad, M.S.; Ashish, R.; Jainath, Y.; Akshay, D. A survey of speech emotion recognition in natural environment–science direct. Digit. Signal Process. 2020, 110, 102951. [Google Scholar] [CrossRef]
- Muljono, M.R.P.; Agus, H.; Catur, S. Speech emotion recognition of indonesian movie audio tracks based on MFCC and SVM. IC3I 2019, 22–25. [Google Scholar] [CrossRef]
- Si, L.; Wang, Z.; Jiang, G. Fusion recognition of shearer coal-rock cutting state based on improved RBF neural network and D-S evidence theory. IEEE Access 2020, 8, 101963–101977. [Google Scholar] [CrossRef]
- Lin, Z.; Tang, S.; Peng, G.; Zhang, Y.; Zhong, Z. An artificial neural network model with Yager composition theory for transformer state assessment. In Proceedings of the 2017 IEEE 2nd Advanced Information Technology, Electronic and Automation Control Conference (IAEAC), Chongqing, China, 25–26 March 2017; pp. 652–655. [Google Scholar] [CrossRef]
- Avola, D.; Cascio, M.; Cinque, L.; Foresti, G.L.; Massaroni, C.; Rodolà, E. 2d skeleton-based action recognition via two-branch stacked LSTM-RNNS. IEEE Trans. Multimed. 2020, 22, 2481–2496. [Google Scholar]
- Avola, D.; Cinque, L.; Fagioli, A.; Foresti, G.L.; Massaroni, C. Deep temporal analysis for non-acted body affect recognition. IEEE Trans. Affect. Comput. 2020, 1–12. [Google Scholar] [CrossRef]
Figure 1.
Two examples of the collected video frames: (a) a violent scene; (b) a non-violent scene.

Figure 2.
Structure of one tensor (3 color channels × 16 frames × 112 pixels × 112 pixels).

Figure 3.
C3D (Convolutional 3D) neural network structure.

Figure 4.
Neural network classification model.

Figure 5.
Speech emotion recognition procedure.

Figure 6.
Neural network for bullying emotion recognition.

Figure 7.
Focal element functions vary with the adjusting factor.


Table 1.
Physical violence recognition results on the video database (%).
| Database | Accuracy | Precision | Recall | F1-Score |
|---|---|---|---|---|
| Video database | 92.00 | 95.65 | 88.00 | 91.67 |
Table 2.
Emotion recognition results based on the three databases (%).
| Database | Accuracy | Precision | Recall | F1-Score |
|---|---|---|---|---|
| CASIA database | 91.67 | 94.12 | 88.89 | 91.43 |
| Finnish database | 95.00 | 95.00 | 95.00 | 95.00 |
| Chinese database | 88.33 | 89.66 | 86.67 | 88.14 |
Table 3.
D–S fusion result on a playing sample (probabilities).
| Result | Video | Audio | D–S Fusion |
|---|---|---|---|
| Violence | 0.98 | 0.10 | 0.84 |
| Non-violence | 0.02 | 0.90 | 0.16 |
Table 4.
D–S fusion result on a violent sample (probabilities).
| Result | Video | Audio | D–S Fusion |
|---|---|---|---|
| Violence | 0.98 | 0.01 | 0.33 |
| Non-violence | 0.02 | 0.99 | 0.67 |
Table 5.
Recognition result of the improved BPA functions.
| Result | Video | Audio |
|---|---|---|
| Violence | ||
| Non-violence |
Table 6.
Recognition results of different fusion algorithms based on different databases (%). (a) Video database combined with Chinese emotional private database; (b) video database combined with Finnish emotional private database; (c) video database combined with Institute of Automation of Chinese Academy of Sciences (CASIA) public database.
| (a) | ||||
|---|---|---|---|---|
| Algorithm | Accuracy | Precision | Recall | F1-Score |
| Yager | 86.21 | 91.30 | 91.30 | 91.30 |
| Section 3.3.2 | 95.38 | 97.30 | 94.74 | 96.00 |
| Section 3.3.3 | 94.00 | 97.83 | 90.00 | 93.75 |
| (b) | ||||
| Algorithm | Accuracy | Precision | Recall | F1-Score |
| Yager | 86.21 | 91.30 | 91.30 | 91.30 |
| Section 3.3.2 | 95.31 | 97.22 | 94.59 | 95.89 |
| Section 3.3.3 | 97.00 | 97.96 | 96.00 | 96.97 |
| (c) | ||||
| Algorithm | Accuracy | Precision | Recall | F1-Score |
| Yager | 80.00 | 90.91 | 80.00 | 85.11 |
| Section 3.3.2 | 84.75 | 95.45 | 72.41 | 82.35 |
| Section 3.3.3 | 92.00 | 97.73 | 86.00 | 91.49 |
Publisher’s Note: MDPI stays neutral with regard to jurisdictional claims in published maps and institutional affiliations. |
© 2021 by the authors. Licensee MDPI, Basel, Switzerland. This article is an open access article distributed under the terms and conditions of the Creative Commons Attribution (CC BY) license (http://creativecommons.org/licenses/by/4.0/).
Share and Cite
MDPI and ACS Style
Ye, L.; Liu, T.; Han, T.; Ferdinando, H.; Seppänen, T.; Alasaarela, E. Campus Violence Detection Based on Artificial Intelligent Interpretation of Surveillance Video Sequences. Remote Sens. 2021, 13, 628. https://doi.org/10.3390/rs13040628
AMA Style
Ye L, Liu T, Han T, Ferdinando H, Seppänen T, Alasaarela E. Campus Violence Detection Based on Artificial Intelligent Interpretation of Surveillance Video Sequences. Remote Sensing. 2021; 13(4):628. https://doi.org/10.3390/rs13040628
Chicago/Turabian StyleYe, Liang, Tong Liu, Tian Han, Hany Ferdinando, Tapio Seppänen, and Esko Alasaarela. 2021. "Campus Violence Detection Based on Artificial Intelligent Interpretation of Surveillance Video Sequences" Remote Sensing 13, no. 4: 628. https://doi.org/10.3390/rs13040628
Note that from the first issue of 2016, this journal uses article numbers instead of page numbers. See further details here.