
Hydroclimatic Extremes Evaluation Using GRACE/GRACE-FO and Multidecadal Climatic Variables over the Nile River Basin


1
Faculty of Geosciences and Environmental Engineering, Southwest Jiaotong University, Chengdu 611756, China
2
Geospatial Information Science (GIS) department, WGCFNR, Hawassa University, Hawassa PO Box 5, Ethiopia
3
State-Province Joint Engineering Laboratory of Spatial Information, Technology for High-Speed Railway Safety, Chengdu 610031, China
4
Department of Earth and Environment, Institute of Environment, Florida International University, Miami, FL 33199, USA
*
Author to whom correspondence should be addressed.
Remote Sens. 2021, 13(4), 651; https://doi.org/10.3390/rs13040651
Submission received: 31 December 2020
/
Revised: 8 February 2021
/
Accepted: 8 February 2021
/
Published: 11 February 2021
(This article belongs to the Special Issue Remote Sensing of Water Resources Monitoring, Parametrization and Modeling)
Abstract
:Hydroclimatic extremes such as droughts and floods triggered by human-induced climate change are causing severe damage in the Nile River Basin (NRB). These hydroclimatic extremes are not well studied in a holistic approach in NRB. In this study, the Gravity Recovery and Climate Experiment (GRACE) mission and its Follow on mission (GRACE-FO) derived indices and other standardized hydroclimatic indices are computed for developing monitoring and evaluation methods of flood and drought. We evaluated extreme hydroclimatic conditions by using GRACE/GRACE-FO derived indices such as water storage deficits Index (WSDI); and standardized hydroclimatic indices (i.e., Palmer Drought Severity Index (PDSI) and others). This study showed that during 1950–2019, eight major floods and ten droughts events were identified based on standardized-indices and GRACE/GRACE-FO-derived indices. Standardized-indices mostly underestimated the drought and flood severity level compared to GRACE/GRACE-FO derived indices. Among standardized indices PDSI show highest correlation (r2 = 0.72) with WSDI. GRACE-/GRACE-FO-derived indices can capture all major flood and drought events; hence, it may be an ideal substitute for data-scarce hydro-meteorological sites. Therefore, the proposed framework can serve as a useful tool for flood and drought monitoring and a better understanding of extreme hydroclimatic conditions in NRB and other similar climatic regions.
1. Introduction
The Nile is the world’s longest river with a drainage area of about 3.2 million km2, which is nearly 10% of the African continent’s landmass. It flows across 11 countries from South to North, which crosses highly diverse landscapes and climatic zones, and mostly, the region depends hugely on rain-fed agriculture for its livelihood. Consequently, the agricultural system [1,2], economic development [3,4], food security, and increasing population [5] makes the basin extremely vulnerable. Furthermore, NRB is highly generalized and seldom or relatively infrequent in scientific discussion, doubtless due to its large size, poor hydrological records (i.e., spatial and temporal coverage) supplemented with limited access owing to hydro-political [1] and development [5] interest among NRB countries. Thus, the basin demands a suitable method to determine its spatiotemporal patterns of floods and droughts.
A drought or flood is an event characterized by a land-water deficit or excess that significantly affects agriculture, ecosystems, and socioeconomic development [6,7]. The frequency and intensity of floods/droughts are increasing in many parts of the world owing to climate changes [8,9]. Traditional or remote sensing-based approaches can estimate these hydroclimatic extremes. Traditional approaches depend on field observations (i.e., precipitation and evapotranspiration) with high spatial resolution and long-term time-series data that are spatially sparse in NRB. Simultaneously, this approach has drawbacks. It needs substantial operational and computational costs. Furthermore, it is also limited to either groundwater zones (groundwater level) or near the surface (soil moisture probes) that are incomplete and inaccessible in remote areas. Remote sensing-based flood and drought evaluation techniques have proven to be ideal substitutes over traditional approaches.
Thus, recently remote sensing-based drought indices have been developed and most sensitive to a specific part of the hydrological cycle [10]. The Standardized Precipitation Index (SPI) estimated accumulated precipitation deficits over varying time scales [11]: shorter, medium, and longer time scales are sensitive to soil moisture variability, streamflow, and groundwater variations, respectively. Though, this sensitivity pattern differs by region and land cover, which might complicate the choice of SPI time scale in characterizing drought duration, onset, and intensity [12]. The Standardized Precipitation Evapotranspiration Index (SPEI) is the SPI extension by incorporating potential evapotranspiration (PET) in determining drought [13]. Furthermore, hydroclimatic extreme event indices such as Palmer Drought Severity Index (PDSI) [14], Self-Calibrating Palmer Drought Severity Index (scPDSI) [15], and Multivariate Standardized Drought Index (MSDI) [16] are widely used indices.
The Gravity Recovery and Climate Experiment (GRACE) satellite mission offer a unique opportunity to quantify flood and drought at regional and global scales. Since April 2002, GRACE has successfully monitored changes in the mass on the Earth’s surface, especially in Total Water Storage Anomalies (TWSA) research. The mission ended after 15 years in October 2017 and is replaced by the GRACE Follow-On (GRACE-FO) mission launched in May 2018 and continues the record by extending the monthly time series [17]. GRACE-FO uses a laser ranging interferometer (LRI) to enhance low satellite-to-satellite tracking measurement performance [18]. This enhancement is directly associated with the accuracy of the derived gravity field models [18,19] and may have better precision and data quality. GRACE and GRACE-FO products are named as GRACE/GRACE-FO solutions, covering the time span from April 2002 to the present. GRACE spherical harmonics (SH) products are also applicable to study terrestrial water storage (TWS) changes in basin-scale [20] or at a global gridded product of SH introduced at 1-degree grid-scale (i.e., ~100 km) [21] similar to mass concentrations (mascon). The difference between SH and mascon is that the mascon approach applies time or spatial constraints during processing to improve mass estimation [22,23]. Thus, the mascon products are an improved illustration of recent SH releases that can provide accurate gridded TWS information and can be directly employed without further post-processing like Gaussian filter [24].
Some studies integrated GRACE data with drought indices to quantify and understand drought conditions. For example, the water storage deficit index (WSDI) [25], Combined Climatological Deviation Index (CCDI) [26], and GRACE groundwater drought index (GGDI) [23] are commonly used indices. Most of these indices are incorporated with standardized drought indices [9,25,27]. Similarly, Liu et al. [28] provided an overview of water storage deficit (WSD) and recommended further investigation, including groundwater drought, to get insight into detailed changes in each component of the TWS needs. Groundwater drought is defined as below-normal groundwater storage [6], mainly determined by long-term rainfall deficits [29]. These studies show that both hydrogeological and climate conditions may influence the evolution of groundwater drought.
Several studies (e.g., [20,22,30]) have used GRACE to explore terrestrial water storage (TWS) changes in the NRB. TWS integrates surface water storage, soil moisture storage, groundwater storage, canopy water storage, and ice/snow water storage. Various researchers have studied the hydrology of the Nile River by using scattered and limited hydro-meteorological site data. These studies encompass various areas, including land-use dynamics [31], sediment dynamics [32,33], teleconnections and river flow [1,34,35,36], streamflow modeling [37], climate change impact [36,38,39,40,41], hydrodynamics of Lake Tana [42,43,44], water allocation and demand analysis [45,46,47,48], and groundwater flow modeling [48]. In these studies, data paucity issues preclude data-driven SPI, SPEI, PDSI, MSDI, etc., and GRACE-/GRACE-FO TWS-derived indices that monitor changes in vertically integrated water storage in all water-bearing layers.
Despite the efforts mentioned above, a comprehensive study of long-term flood and drought over the whole NRB is missing. To our knowledge, this is the first study as a framework that comprises multidecadal flood and drought event identifications over the NRB. It is based on multidecadal standardized hydroclimatic extreme event and GRACE/GRACE-FO derived indices. This frame comprises groundwater, meteorological, and agricultural drought conditions. Thus, this study’s nobility or scientific contribution is to use GRACE/GRACE-FO temporal (2002 to 2019) TWS data in line with the multidecadal climatic variables to produce enhanced flood and drought estimates in the NRB. This study has three specific objectives: (1) provide a framework about NRB flood and drought event characteristics based on GRACE/GRACE-FO derived and standardized indices; (2) assess NRB multidecadal hydroclimatic extreme event impacts during 1950–2019 and their categorization; and (3) evaluate the feasibility of GRACE/GRACE-FO products based on drought and flood capturing capacity over NRB.
2. Materials and Methods
2.1. Study Area
The NRB is the world’s longest river basin covering approximately 3,046,334 km2, and comprises 11 countries (see Figure 1). By the year 2030, the population is projected to rise to 700 million, and it raises concerns about sustainable/equitable management of the basin’s resources [49]. Based on the hydroclimatic condition, we divided the NRB into four critical areas of interest: (1) The Blue Nile Region (BNR), (2) Lake Victoria Region (LVR), (3) The Bahr-el-Ghazal Region (BER), and (4) Main Nile Region (MNR). All NRB sub-basins (regions) exhibit more considerable spatial coverage that enables us to detect changes in TWS GRACE Satellite data. In this study, the term region is used to represents sub-basins of NRB interchangeably.
Particularly, BNR mostly belongs to the Ethiopian Highlands, including both the Upper and Lower Blue Nile basin that contains Lake Tana (Figure 1) and contributes about 76% [4] of the total flow of NRB. LVR comprises Lake Albert, Kyoga, Victoria, George, and Semilik sub-basins that contribute 24% [4] flows of NRB and forms the White Nile headwaters. BER is found in Congo-Nile River boundary tributaries and a large area of Sudanese plain with a low slope and supplies the Sudd-wetlands (marshes) that are thought to be where a substantial amount of the White Nile’s water is lost due to evaporation [20]. MNR is mainly located in the Egyptian desert region and the northern part of Sudan consisting of Lake Nasser and High Aswan Dam and understood that intensive irrigation is used and water lost through evaporation [3].
The NRB’s ecosystem is under severe stress [5] shared by more than 400 million people who depend heavily on agriculture. Nearly half of the NRB countries are projected to live below the water scarcity level (i.e., 1000 m3/person/year, by 2030) [5]. Furthermore, groundwater shows depletion across four sub-regions [20], particularly MNR noted depletion at a rate of −13.45 km3/year (i.e., 3/2006–3/2008) [3]. This depletion may significantly impact people living within the basin, particularly during the drought period, and may increase the already high water stress level.
2.2. Datasets
2.2.1. GRACE/GRACE-FO Data
GRACE and GRACE-FO are twin-satellite missions. The mass change product from these two missions is temporal gravity field models. This study used GRACE/GRACE-FO products to estimate WSDI, CCDI, and GGDI. We evaluated both products based on their ability to reproduce the WSDI, CCDI, and GGDI indices. Both GRACE/GRACE-FO gridded products are acquired from the Center for Space Research (CSR) [50] at the University of Texas, German Research Center for Geoscience (GFZ) [51], and the Jet Propulsion Laboratory (JPL). We filled missed data (i.e., caused by satellite batteries and instrument failure) for all GRACE/GRACE-FO products using the cubic spline interpolation method. In this study, the missing gap between GRACE and GRACE-FO (i.e., July 2017 to May 2018) is not filled as presented in Section 3.3. This study used GFZ SH, JPL mascon, and CSR mascon GRACE/GRACE-FO data.
Each GRACE product is expected to represent the true value plus a certain amount of error. The arithmetic mean ensemble model was model was suggested by Sakumura et al. [52] owing to a much higher level of reliability than a stand-alone model. In this study, the ensemble model is produced by combining the arithmetic mean of three GRACE/GRACE-FO solutions and is used to calculate GRACE derived hydroclimatic extreme indices (see Section 2.3.3 and Section 2.3.4)
2.2.2. Rainfall and Temperature Data
Understanding precipitation is crucial for studying regional floods and droughts. We used Tropical Rainfall Measuring Mission (TRMM) 3B43 precipitation V7 data (1998–2016) to compare with GRACE derived indices. TRMM satellite precipitation data is available at https://trmm.gsfc.nasa.gov/ (accessed on 31 December 2020) from the NASA website. We used the TRMM-3B43 (see Table 1) Level 3 satellite-gauge (SG) combination data to evaluate the GRACE-derived TWSA and characterize drought in the NRB. Furthermore, long-term multidecadal rainfall and temperature data acquired from the University of East Anglia gridded Climatic Research Unit (CRU) Time-series (TS) are available at https://climatedataguide.ucar.edu/climate-data (accessed on 31 December 2020). In this study, CRU data are used to understand the multidecadal (i.e., 120 years) pattern of Rainfall and temperature (see Section 3.1), while TRMM is used to compute Standardized Soil Moisture Index (SSI), SPI, and CCDI. We applied the areal mean estimation techniques by averaging all grids within the basin owing to the equal spatial resolution of all grids in the study area for further analysis at the sub-basin (regions) and basin levels.
2.2.3. Soil Moisture Data
We used the soil moisture data from Global Land Data Assimilation System Version 2 and 2.1 (GLDAS-NOAH M2.0 and M2.1), Modern Era Retrospective-analysis for Research and Applications (MERRA-2), and ERA5-Land models, as presented in Table 1 in more detail about spatiotemporal resolution. Data from three different sources were merged using Triple Collocation Analysis (TCA) for reliable estimates of soil moisture [53] changes over the NRB, as shown in Section 2.3.1.
2.2.4. Drought Indices Data
This study used SPEI monthly gridded data at 0.5° spatial resolution retrieved from https://spei.csic.es/map/maps.html (accessed on 31 December 2020) for January 1950 to December 2019 to evaluate GRACE derived indices. Similarly, the self-calibrated monthly Palmer Drought Severity Index (sc-PDSI) had a spatial resolution of 0.5 × 0.5° and accessed from https://crudata.uea.ac.uk/cru/data/drought/ (accessed on 31 December 2020) from January 1950 to December 2018.
2.3. Methods
The methodological flow and data processing techniques used in this study are presented in (Figure 2). The GRACE derived WSDI, CCDI, and GGDI computations based on severity and respective standardized indices are described in Section 2.3.3, Section 2.3.4, Section 2.3.5 and Section 2.3.6. We also decomposed all seasonal data with Seasonal and Trend decomposition using Loess (STL; see Section 2.3.2).
2.3.1. Soil Moisture Changes
Soil moisture data from GLDAS [54], MERRA-2 [55], and ERA5-Land [56] models are merged using the Triple Collocation Analysis (TCA) over the NRB (see Figure 2). TCA reliably estimates soil moisture changes and offers an alternative method for estimating random error variances [57,58] in the absence of ground reference data. TCA analysis was conducted in four steps: (1) scaling each soil moisture data to the main reference set; (2) estimating the error variance via pair-wise multiplication; (3) determine the corresponding weights, and (4) merging datasets. TCA is applied here to merge soil moisture () estimated as presented in Equation (1), where ,, and are the relative weights of soil moisture , , and , respectively. TCA has limitations caused by soil moisture datasets seasonality [59]. To overcome this limitation, time series of mean-zero anomalies computed by first subtracting off long-term seasonal soil moisture climatology per the recommendation of Yilmaz et al. [59].
Detailed TCA description and technical approaches are shown in Nigatu et al. [20] and Yilmaz et al. [59]. Soil moisture data computed by the TCA method is used to estimate the Standardized Soil Moisture Index, as presented in Section 2.3.6.
2.3.2. Time Series Decomposition and Trend Analysis
This study decomposed the GRACE-TWSA monthly time series data into three components [60,61] by applying the seasonal trend decomposition using Loess (STL) that exhibited similar results with harmonic analysis [22]. We used the STLplus approach of LOESS (LOcal regrESSion) smoothing that is modified by Hafen [61] after [62] that is adaptable and robust to decompose time series. STLplus provides enhancements (i.e., handling missing values, higher-order loess smoothing with automated parameter choices, and frequency component smoothing)) over the STL method [61].
where the original signal () is represented as the sum of a long-term part (), a seasonal cycle (), and the remaining sub-seasonal residuals (). The long-term component () further could be divided into long-term linear trends and long-term nonlinear (inter-annual) variability. The residuals reflect both sub-seasonal signal and noise [63]; these high-frequency residuals are anticipated to be a combination of both the noise and a real signal that represents sub-seasonal water storage variability that is presented in the GRACE data. Details of the STL decomposition approach are presented in Lu et al. [64]. Time series decomposed data is used to compute GRACE/GRACE-FO indices, as presented in Section 2.3.3, Section 2.3.4 and Section 2.3.5.
2.3.3. GRACE/GRACE-FO Derived Water Storage Deficit (WSD)
WSD is the difference between the GRACE TWSA time series and the monthly mean of TWSA values adopted from Thomas et al. [25], as follows:
where is the GRACE-inferred TWSA time series for the jth month and respective year i; is the long-term mean (i.e., January 2003 to December 2019) of TWSA for the same jth month. The positive value represents surplus water storage, while a negative value implies deficits in land water storage compared to its monthly mean values. Thomas et al. [25] designated drought events as WSDs lasting for three or more consecutive months. We normalized this parameter using the zero mean normalization method into the WSDI to characterize better droughts based on WSD and to compare WSD with other drought indices, as follows:
where μ is the mean and σ is the standard deviation of the WSD time series. The WSDI time series represents the average seasonal deviation from the average conditions, and its magnitude indicates the drought intensity. Furthermore, Thomas et al. [25] introduced another method to assess drought severity, which the following formula can describe:
where Se is the event severity; t denotes drought number events (i.e., vary from 1 to n number of drought events in the study area); M is the average deficit since the onset of the deficit period, and D is the duration of a drought event. Se combines WSDs with event duration and indicates the TWS deficit (TWSD) of a definite drought. Simultaneously, the WSDI reveals the relative monthly deficits of water storage during the study period. TWSD is a relevant indicator only for a particular drought event confirmed by the WSDI, and the value of the previous month represents the severity of the drought event.
2.3.4. Combined Climatologic Deviation Index (CCDI)
Drought conditions of NRB was characterized using a combination of terrestrial and atmospheric water data to attain a comprehensive understanding of the hydrosphere. The drought conditions were defined by defined by Sinha et al. [26] based on the Z-score of the sum of TWSA outliers and the monthly Precipitation Anomaly (PA):
where is the precipitation anomaly (PA) in year i and month j; represents the amount of precipitation in year i (i = 2003, 2004, …, 2019) and month j (j = 1, 2, 3, …, 12), is the monthly average precipitation.
where is the PA residual in year i and month j, and is the average PA in month j.
where indicates the TWSA residual in year i and month j, is the TWSA in year i and month j, and is the monthly average TWSA anomaly in the month j.
where denotes the combined precipitation and TWSA deviations in year i and month j.
where indicates the Combined Climatologic Deviation Index (CCDI) in year i and month j, is the monthly average CD, and is the standard deviation of CD. CCDI values less than −0.28 for three consecutive months showed the occurrence of drought events; henceforth, we used Equation (11) to calculate droughty severity.
The indices were consistently classified to confirm a reliable definition and classification of drought levels (Table 2) regardless of different drought indices based on the United States Drought Monitor recommendations.
2.3.5. GRACE Groundwater Drought Index (GGDI)
We computed groundwater storage changes () by using terrestrial water storage anomalies () from GRACE/GRACE-FO products and soil moisture change () and surface water storage () change from GLDAS, as indicated in Equation (12) [3,23]. In NRB, ice/snow and canopy water storage contribution are assumed to be negligible [3,60] and not considered in groundwater storage computation.
To compute from and surface runoff is used as a proxy for [20,60] from GLDAS to isolate the GWS component from GRACE. Detail of soil moisture change estimation approach is presented in Section 2.3.1.
In this study, we adopted the GRACE groundwater drought index (GGDI) from Wang et al. [23] to investigate the characteristics of groundwater drought based on a monthly climatology () calculated as follows (Equation (13)) to capture seasonality in the groundwater records.
where i = 1, 2, 3,…, 12; represents the groundwater storage anomaly for month i; is the number of the month.
Then, computed monthly climatology () is subtracted from the basin mean groundwater storage anomaly to obtain a groundwater storage deviation (GSD based on Thomas et al. [65] recommendation, indicating groundwater storage’s net deviation. Lastly, the GSD normalized by removing the mean ( and dividing by the standard deviation (:
where is the groundwater drought index used to reflect the drought situation derived based on normalized net deviation in groundwater storage volumes.
2.3.6. Multivariate Standardized Drought Index (MSDI)
The precipitation and soil moisture are integrated to provide a composite agricultural and meteorological drought conditions computed based on MSDI [66]. The MSDI computed as , where is the standard function of normal distribution that uses joint probability of precipitation and soil moisture to compute either a parametric () [67] or an empirical () [16] method. Finally, MSDI (Equation (15)) is computed based on the accumulated precipitation (AP) and soil moisture (AS) from long-term records:
The n-ensemble member of predicted MSDI (i.e., , , ) obtained from the observed soil moisture and precipitation in historical records n-years and n-months [66]. Detailed procedures and explanations about both and are presented in Hao and AghaKouchak [16,67].
Similarly, the Standardized Soil Moisture Index (SSI) [67] highlights soil moisture’s nature that mainly leads to agricultural drought. The SSI is a drought index computed from a lognormal distribution function using the Standardized Drought Analysis Toolbox (SDAT). SDAT is a nonparametric framework that can be applied to different hydrological variables (i.e., soil moisture, precipitation, and relative humidity [68]. It designates droughts at diverse temporal scales that are SSI-3 (3-month SSI), SSI-6(6-month SSI), and SSI-12 (12-month SSI) in the same way as the SPI and SPEI.
2.3.7. Hydroclimatic Extreme Event Indices Severity Categorization
The standardized drought indices used in this study are SSI, SPI, SPEI, and and GRACE derived indices are WSDI, CCDI, and GGDI. These standardized indices are selected based on robustness to detect drought conditions in arid dominated regions such as NRB. The drought severity status evaluated using scales (see Table 2) based on previous studies WSDI [9], SPI [11], SPEI [13], (PDSI) [14] GGDI [23], CCDI [26], and SSI [67].
Four wetness and drought levels [6] indicate different drought magnitude categories ranging from mild to regions with extreme wetness or drought. The severity level marked “No” category designates those areas experiencing no wetness/ drought condition [69]. In this study, the wetness (W3-W4) category indicates flood conditions due to flood situations mostly preceded by high soil moisture content, peaking floodplains inundation [70].
3. Results
3.1. Hydroclimatic Extreme Analysis Based on Standardized Indices
The framework proposed in this study allows combining multiple data sets for joint (multivariate) evaluation of drought and flood based on multiple input variables for a more extended period. The SDAT technique adopts different drought-related parameters to calculate the MSDI. The MSDI nonparametric and parametric 12-month outputs of the SDAT that is derived from soil moisture and rainfall data. SDAT is a flexible tool used to estimate 3-, 6-, 12-, 24-, and 48-month runs. The MSDI combines information and provides composite information on SPI (meteorological drought) and SSI (agricultural drought).
The moving average [71,72] method is mainly used with time-series data to exclude the short-term fluctuations and focus on longer trends. We used a 5-year moving average window (Figure 3) that shows a steady rise up to 1940 and declined up to 1963 for both temperature and rainfall. After 1965, temperature shows a strictly increasing pattern while rainfall shows a slight decreasing pattern (i.e., rainfall show dips in 1983–1984, then increased slightly) with fluctuations due to inter-annual variability. Thus, strictly increasing temperature and slight decreasing rainfall pattern likely caused droughts as indicated in Section 3. Furthermore, it may worsen future droughts of NRB owing higher rate of evapotranspiration that will result from NRB warming associated with global warming.
In the NRB flood and drought history, numerous drought events were recorded, particularly after the 1980s (Figure 4). For illustration, the years 1984/1985, 2005/2006, 2010/2011, and 2014/2015 are extreme drought years in most parts of NRB. In 1985 drought affected the whole parts of NRB, except the northern part of BNR (i.e., autumn and summer) and the southwestern part of LVR (i.e., winter and autumn). The BNR areas receive rainfall during June–September, while LVR areas receive rainfall in March–May and September–December. Similarly, in 2005/2006, drought is affected the central parts of NRB, particularly during the spring and autumn seasons. The severe drought in 2010/2011 affected the NRB countries, including Kenya, Ethiopia, and some parts of Uganda, owing to the decline of the long rains in spring (i.e., March–May). Similarly, eight flood events ranging from moderate to extreme flood recorded in NRB. Notably, in 1964, 1978/1979, 1988, 1998/1999, 2006/2007, 2012/2013, 2015/2016, and 2019, the 1988’s flood was the most severe flood in NRB history (1950–2019). The impact of the respective year flood event on livelihoods is outlined in Section 3.6, and the spatial coverage with severity level is presented in Section 3.6 and Figure 4.
From 1983 to 2008, NRB noted a weak trend toward increasing soil moisture (Figure 5c). Since 2008, the soil moisture shows a strictly decreasing trend, while precipitation shows an increasing trend. The decreasing soil moisture trend highlights the potential for increasing evapotranspiration (ET) and thereby indirectly escalating the regional hydrologic cycle. The impact of soil moisture on climate warming may not be monotonic [73]. Relatively, it is likely that in some regions, soil moisture might first increase in response to cumulative precipitation but then decrease because ET may rise quicker than precipitation as temperature increases.
The SSI and MSD disagree with SPI drought conditions after 2011; SPI shows more wet conditions while others show more drought conditions. Accordingly, precipitation increases are assumed to have been more than compensated for increased losses due to increases in ET, as indicated in terms of SPEI (Figure 5a). This ET increase is due to an increasing temperature pattern (Figure 3) as expected to decrease soil moisture.
Figure 5 shows the SPI, MSDIp, MSDIe, and SPEI time series over NRB and sub-basins. All indices show agreement from1950 to 1998, and then after that, they differ in both magnitude and pattern direction until the study period ends. The SPI shows a decreasing droughts pattern due to the increased precipitation, while the MSDIp, MSDIe, and SPEI were increasing due to the temperature effect. This discrepancy highlights that the SPI shows a decrease in drought severity. In contrast, the SPEI increases droughts severity attributed to a strict and higher increasing temperature pattern than fluctuating precipitation (Figure 3).
3.2. Evaluation of TWS Deficits and Surplus
In drought and wetness characterization, the terrestrial water storage deficit and the surplus are crucial due to groundwater, surface water, and soil moisture water storage of GRACE TWS integration. GRACE/GRACE-FO captured hydroclimatic extreme events accurately (Figure 6a) and similarly except for severity level minor variations among the different GRACE/GRACE-FO derived indices from 2003 to 2019. The WSDI time series based on GRACE show a similar fluctuations pattern between 2004 and 2012. The variation increases contrarily after 2013; it may distort the severity level of drought and flood events. For example, as shown in Figure 6a,b, the drought events reported in Section 3.5 (2014–2015, 2017–2018) are not represented by GRACE/GRACE-FO. The NRB experienced two prolonged and severe drought events during periods 2003–2006 and 2009–2010. The NRB water storage was lost at a rate of −1.56 and −1.32 cm/yr from 2003 to 2006 and 2008 to 2010, respectively. Generally, standardized indices mostly underestimated the drought and flood severity level compared to GRACE/GRACE-FO derived solutions.
Substantial water storage deficits (Figure 6a) occurred in 2003, 2005–2006, 2009–2010, 2011–2012 at high deficits values of −1.2, −2.8, −2.3, and −2.1 cm in the form of the equivalent water height, respectively. As indicated in Figure 6c, the turning point from deficit to surplus (i.e., WSD) was approximately in 2011/2012, which can be observed clearly representing a continuous deficit in water storage changes. A falling pattern denotes a permanent WSD, whereas a rising trend represents a water storage surplus (WSS). The rising pattern in WSD was observed in 2012, following a prolonged decline. The declining pattern continued until 2011, and the rising pattern was observed in a long period from 2012 to 2019 that characterized by increasing wetness.
Based on the drought and wetness event definition, Thomas et al. [25] distinguished four droughts based on WSD during the 2003–2019 period in the NRB (see Section 3.6). The periods from 01/2004 to 05/2007 and 11/2008 to 06/2011 were the two most extensive drought periods in the region, with durations of 29 and 31 months, respectively, except the three months (March, May, and September) with no drought in 2005. The most significant deficits recorded in May 2005 and February 2006 labeled as the most severe drought events.
Commonly, a larger water deficit shows a greater intensity of a drought event, while a more massive water surplus shows flood events. More negative WSD before 2012/2013 and more positive WSD after 2012/2013 (Figure 6c) possibly indicate a reduction after 2012 in the droughts frequency, intensity, and duration except for the 2014 and 2016/17 (Figure 6c,d) drought event. The cumulative WSDs exhibited more clearly that the turning point at which the water storage changed from deficit to surplus occurred in 2003 or 2019. The gradients of close-fitting lines were approximately zero in these two years (Figure 6c). In 2006/2007, the TWS deficit was restored from the previous deficit then after two years in 01/2009–06/2011 (24 months) and 11/2011–05/2012 (6 months), drought caused these decline and afterward there no substantial drought event except 2014 and 2016/17 moderate drought events (Figure 6c,d).
The WSD (Table 2) identified individual drought events observed on the cumulative WSD profile displaying a marked reduction during drought events. Even though 2012 to 2019 showed an overall advance in the cumulative WSD, this period similarly encompassed flood and drought events leveled (event numbers 2–4 and 9–11). Generally, most extreme event epochs reported in this study (Table 2: WSDI and GGDI) corresponded with the results described by the drought records from respective NRB countries’ government-issued bulletins of flood and drought data (see Section 3.6). Therefore, quantitative WSD and GGDI are more useful for characterizing flood and drought events. In contrast, CCD is not suitable for the NRB case due to overestimation (Table 2) and low correlation (Table 3). Furthermore, CCDI shows extreme event occurrence time mismatch with other indices (Figure 6a,b) and historical records (see Section 3.6) of extreme events that may be associated with a time lag effect of precipitation incorporated during estimation.
3.3. Evaluation of Groundwater Drought and Surplus
Hydroclimatic extreme event evaluation using GRACE/GRACE-FO and GLDAS data is ultra-efficient compared to traditional drought and flood monitoring indices. Figure 6d illustrates the temporal pattern of GGDI characteristics in the NRB. The GGDI showed a downward pattern with different change characteristics in NRB and each subzone, demonstrating that the GGDI-identified drought was increasing in the NRB during 2003–2019. GGDI time series demonstrates that droughts have become more frequent in recent five years, with the most severe drought episode during June/2017 and August/2018. Over the entire NRB, the extreme drought (i.e., the lowest GGDI) stretched –2.89 during the 9/2016–05/2017 drought event. Extreme groundwater drought occurred in November 2017 with a minimum GGDI value of –2.9. In the meantime, in the later and previous periods of this drought event, the average GGDI reached –0.82 to 0.31, then after GGDI became more positive in 2019.
As shown in Figure 6d, the most significant increasing pattern of drought in each region occurred in NRB. During 01/2003–05/2003, the lowest GGDI values in BNR, LVR, BER, and MNR were –1.39, –2.98, –1.03, and –0.97, respectively. Then, GGDI abruptly becomes more positive in 09/2007, causing flood in flood plains of NRB. During the long span drought period 2004/02 to 2007/03, LVR shows more extreme groundwater depletion than other sub-regions. In the rest of the drought period, BER and BNR show lower GGDI values than other sub-regions. This groundwater depletion (2004–2006) can be about half attributed to a drought in the Lake Victoria Basin and about half to an enhanced outflow [74,75], underlining the sensitivity of the LVR to human-induced activity (i.e., controlled by dam operations). Similarly, over BER, drought frequency and intensity are increasing that might be associated with Sudd-wetland (i.e., a place where White Nile’s waters are lost). The wetland area is diminishing [76] due to groundwater depletion.
The most severe drought in BNR, LVR, BER, and MNR occurred in February 2003, February 2006, and August 2018, with GGDI values ranging from –2.98 to –1.09. Thus, these results indicate that GGDI is efficient in identifying drought events as it reflects direct evidence of a deficit in groundwater storage. NRB is sensitive to climate variability and human-induced drought event [77]. However, in LVR, surface water storage is abundant; it is sensitive to the drought associated with climate change and human-induced effect. Furthermore, human water consumption intensifies hydrological drought, groundwater, and surface-water interactions [74,78].
3.4. GRACE Derived Drought Indices Feasibility for NRB Drought Identification
We evaluated GRACE-derived CCDI, GGDI, and WSDI feasibility by comparing with other standardized hydroclimatic extreme event indicator indices (Table 3; Figure 6). The correlation coefficient (R2) between the GRACEs derived GGDI, WSDI, and CCDI with the other indices presented in Table 3 at a significant probability level (p ≤ 0.05). The processes used to calculate each hydroclimatic extreme event (i.e., drought and flood) index affect their relationships [26]. For example, the close associations of SPEI and SPI with the amount of evapotranspiration and precipitation can clarify the high spatio-temporal fluxes of these indices along with the close relationship between the SPI and CCDI (and the nonexistence of a clear association with the SPEI). The strong correlation between GGDI and SSI and weak correlation between the SSI and CCDI indicates that the higher dependence of groundwater on soil moisture showing consistency with arid regions’ hydrological processes. Similarly, the SPEI and GGDI show a high correlation highlighting the important effect of precipitation and evapotranspiration on soil moisture and groundwater extreme events.
Similarly, Figure 5 and Figure 6a illustrated the comparison between WSDI and commonly used indices (PDSI, SPI, SPEI, SSI, and MSDI) over the NRB from 2003 to 2019 (Table 4). The characteristics detected for the WSDI and its response to the hydroclimatic indices agreed well. It showed a higher correlation with PDSI, SPI, and SSI and MSPI than SPEI, with similar peaks and troughs. Nevertheless, among indices, specific differences are observed owing to differences in formulation methodologies and variables. For instance, as noted in Figure 6a,b and Table 4, the GRACE/GRACE-FO based indices (i.e., WSDI, CCDI) are higher than standardized drought indices during the 12/2019 wet event and 12/2005 drought event. Generally, in agreement with them in other years that possibly associated with human-induced effect [74,79] as explained in Section 3.3. In 2005/2006, 2007, and 2010/2011, all of the standardized drought and wetness indices exhibited enormous troughs when the WSDs were the most substantial, which might be associated with the anthropogenic effect. Some studies [80,81] show that 2010–2011 drought events in NRB countries are likely due to anthropogenic influences. These human-induced droughts could emerge due to urbanization, deforestation, reservoir construction [82], water withdrawals for domestic use, irrigation, manufacturing, and mining [83].
Table 3 presented the correlations among the hydroclimatic extreme event indices that indicate a significant (p-value < 0.05) correlation among GRACE derived and standardized indices. The correlation between PDSI and WSDI (r = 0.71) is higher than other standardized indices, which is possibly due to a series of water balance parameters included in PDSI computations. Furthermore, a strong correlation was exhibited between PDSI and the other drought indices (Table 3), showing PDSI is a comprehensive drought index. PDSI comprises water supply and demands deduced from meteorological and hydrological parameters [84].
The lower correlation between SPEI and WSDI (0.51) than that between SPI and WSDI (0.67) highlights that precipitation is more responsible for land WSD than the change between evapotranspiration and precipitation in the NRB during 2003–2018. As indicated in Figure 5a, after 2000/01, the SPEI drought shows an extraordinary increase in intensity and frequency due to increasing temperature over NRB; meanwhile, the only difference between SPEI and SPI is evapotranspiration [13]. The SPI is primarily a meteorological drought index [11] based on long-term climatic records and fitted to a probability distribution interpreted at various time scales in both short-term and long-term applications. For example, soil moisture conditions react to precipitation anomalies on a moderately short scale, and that is why SPI shows a high correlation (0.81–0.97) with SSI, MSDIe, and MSDIp.
The correlation coefficients of SSI and MSDI with WSDI (0.66 and 0.69) are higher than SSI and MSDI with the SPEI index, which evinces that flood and droughts events are more dependent on land moisture characteristics because of the NRB’s large arid area. Owing to different principles and computation algorithms [9,13,23] of various drought indices, differences in behavior among the indices are expected.
3.5. Analysis Hydroclimatic Extreme Event Severity Levels
The overall drought and flood severity level of NRB from 01/2003 to 12/2019(i.e., within the 204 months) presented in Figure 6 and Table 4. The higher GGDIs, CCDIs, and WSDIs with longer durations represent the more severe event. Among the nine drought events detected across the NRB during the study period, the drought events 01/2004–06/2005 and 1/2009–06/2011 were the most widespread deficit periods noticeably, lasting 18 and 24 months with the highest total hydrological severities. Moreover, several other slight droughts are temporary episodes of dryness during the study period, namely the drought events 1/2012–06/2011 and 09/2016–01/2017, characterized by more than 4-month prolonged deficits only slight to moderate severities.
Commonly, drought and flood intensity is characterized by using drought indices divided into different drought severity levels, as displayed in Table 4, based on the criteria defined in Table 2. In some flood and drought years (event # 2, 5, 7, 9, and 11), different drought indices estimated different drought levels for the same drought events. Specifically, flood and drought severity levels in events #4 and #6 are classed as severe (W4 and D3) according to WSDI, whereas PDSI, SPEI, and other indices are estimated as mild drought and flood. The drought severity levels of the two drought events for the rest of the indices (i.e., MSDI, SSI, and SPI) were also different. SPI shows no drought condition in event #10, while the rest of the indices are classified as mild to moderate (D1–D2) drought.
Similarly, in the event, #11 and11, SPI shows no drought while the rest indices show mild to extreme (D1–D4) drought conditions. Overall, nevertheless, it is clear that the flood and drought severity levels of the eleven events identified by these indices conveyed apparent inconsistencies. The inconsistencies and differences detected among indices are possibly attributed to the principal differences in time scales employed, the type of the method, and data used in the computation of the various indices.
The spatio-temporal variations of drought-affected areas (Figure 4, Figure 5 and Figure 6) characterize the regions suffering from droughts of different severities and drought development processes. For example, in the 1984–1985 drought years, the severe drought conditions were recorded in all seasons across the NRB, except no drought conditions in the southwestern part of LVR (i.e., in winter) and northeast part of NBR during autumn. The four severity levels (Figure 4) are denoted by different degrees: red for drought and green for wetness.
3.6. Hydroclimatic Extremes Impact on Livelihood
In NRB countries, the hydroclimatic extreme event affected people’s lives (Table 5), mainly due to frequent drought and flood events [85,86]. In Sudan and Ethiopia (Figure 4), during 1985–1986, severe drought caused around 450,000 people death [87,88]. Around 14 million people were affected by famine during 2002–2003 (i.e., in Ethiopia only), and over 13 million people were affected in NRB countries during the 2008–2010 droughts years. The most extreme drought event (2010–2011) led to severe food emergencies and starvation, heartrending around 12 million people over NRB upstream countries [66], and then 2016–2017 is categorized in a moderate drought year. Additionally, flooding instantaneously tailed the drought (2007, 2013, 2017, and 2019) the abrupt conjunction of these events impaired the losses (Figure 6).
In NRB, extreme flood events recorded (Table 5 and Figure 5) in 1978/9, 1988, 1998, 2007, 2008, 2012/13, 2015/16, and 2019 [87]. The BER (South Sudan and Sudan), MNR (Egypt), BNR (western part of Ethiopia), LVR (equatorial lakes) regions are prone to floods due to highly variable river flows and extensive river floodplains area. It causes overwhelming effects on the property (i.e., infrastructure destruction) and lives (i.e., killing, poverty, and food insecurity). For example, the annual average damage from flooding is over US$25 million [89] in the riparian of the BNR and the MNR. The floods spreading in BNR (western part of Ethiopia) and BER (Sudan) displaced 242,000 people and resulted in 700 deaths in 2006/2007. During the high rainfall period, the river flows from BNR cause devastation in the floodplains of Sudan and Ethiopia that comes from BNR that is a contributor of 85% of the total NRB.
4. Discussion
Climate studies [90] showed an increase in temperature by more than 1 °C and 1.5 °C in NRB countries that leads to 1.5 °C and 2 °C warming levels, respectively. Likewise, according to Touma et al. [91], due to the more significant influence of temperature changes, the changes in drought characteristics using the SPEI index are substantial than the SPI changes. Osima et al. [90] also specified that NRB countries faster warming than the global mean, which further reinforces the role of temperature in the study area. Thus, a strict increase of SPEI droughts severity is the global warming context that has enhanced NRB and drought severity in the sub-basins.
GRACE/GRACE-FO TWS derived indices are more powerful than standardized indices to detect drought events attributed to natural and human-induced drought events. This strength is due to the GRACE/GRACE-FO capacity to integrate surface to deep aquifer water storage change vertically. Similarly, studies presented by Wang et al. [23] in Northern China plain and Thomas et al. [65] in northern California central valley reported declining groundwater storages due to droughts exacerbation, and GGDI is capable of capturing these phenomena. GRACE/GRACE-FO data convey spatially distributed information about flood and drought-related parameters promptly and efficiently as a unique source of information in ungauged basins, where reliable historical records of precipitation and discharge are missing.
Outstandingly, GRACE satellites are exceptional in their ability to monitor changes in TWS that encompasses the land surface to the deepest aquifers that vertically integrate [22] water storage changes. TWSA comprises groundwater storage, soil moisture storage, and surface water storage [92]; therefore, GRACE TWS gives an alternative method to monitor drought from an integrated approach [28]. Thus, the GRACE satellite can detect the loss or gain of deep soil water as well as groundwater [93]; it effectively characterizes surface to underground water surplus and deficit with practical understanding into integrated hydroclimatic extreme event indices.
These standardized drought indices are generally dependent on hydrologic fluxes and meteorological variables that only consider a limited centimeter on the top surface. Simultaneously, subsurface WSDs changes might also play a critical role in the hydroclimatic extreme formation. These conditions apply mainly to extreme-severity and long-term (flood and drought) events. On the contrary, GRACE/GRACE-FO based indices can quantify the actual amount of water deficit or surplus from the storage [22] because it assimilates the effects of various subsurface and surface hydrologic processes. Therefore, particular region actual hydrological conditions and the associated hydroclimatic extreme events are better explained by GRACE/GRACE-FO derived indices.
Furthermore, ground-based point measurements acquired from hydro-meteorological stations may not accurately describe the regions of interest’s spatiotemporal characteristics, particularly large-extent areas like NRB. WSDI is integrated land water storage variations observed from space, less complicated in terms of numerical and statistical computations than the standardized drought indices. Generally, GRACE/GRACE-FO derived hydroclimatic extreme indices have a substantial application potential, specifically for large-scale and scarce hydro-meteorological recording regions.
GRACE/GRACE-FO derived indices are associated with certain limitations owing to the entire dependence on GRACE-observed TWSA that imbue the WSDI infers. For instance, GRACE/GRACE-FO by itself cannot decouple different hydrologic store contributions [94] from monthly estimates of TWSA. Moreover, WSDI is more effective over large spatial scales inheriting the GRACE/GRACE-FO accuracy challenge [21]. The new GRACE-FO and GRACE mascon solutions’ spatial resolution is higher than that of the previous solution. Besides, as Thomas et al. [25] reported, time series of at least 30 years in length is preferable while GRACE-TWSA has 18 years of monthly TWSA, making the GRACE/GRACE-FO derived indices hydroclimatic extreme evaluation and estimation challenging. However, to overcome spatiotemporal resolution, we recommend reconstructing more than 30 years of TWSA from in situ/remote sensing data and downscaling the GRACE/GRACE-FO data by integrating with high-resolution remote sensing data. As the GRACE-FO observations updated by increasing the new observations, GRACE-FO derived indices method can be updated continuously.
GRACE/GRACE-FO TWSA data are typically less useful for some mild droughts and flood events caused by a precipitation deficit/surplus; subsequently, the surface water storage ruins within normal conditions. Even though GRACE/GRACE-FO resolution is improved, solo GRACE-FO data is still not sufficiently accurate to characterize hydroclimatic events in smaller basins (i.e.,≤ 200,000 km2) owing to the GRACE footprint limit of nearly 200,000 km2 [95]. Thus, we recommend station-derived observation supplementary methods with GRACE/GRACE-FO to characterize small-extent for less extreme hydroclimatic events.
5. Conclusions
This study proposed a framework that comprises hydroclimatic extreme indices using GRACE/GRACE-FO time series and standardized indices over NRB during 1950–2019. This framework incorporates groundwater, agricultural, and meteorological droughts and flood severity based on respective indices. Our results indicate that the GRACE/GRACE-FO derived indices can adequately capture the drought and flood events that agree reasonably well with PDSI, SPI, SPEI, SSI, MSDIp, MSDIe, and, though differences occur owing to inherent differences among indices.
The results of this study showed that the NRB drought and flood event severity and frequency increased after 1988. From 1950 to 2019, eight floods and ten droughts were identified based on the standardized indices (1950–2019) and GRACE/GRACE-FO derived (i.e., 2003–2019), mostly in agreement with those reported by different institutions. Out of these, four were severe flood events (1988, 2007, 2016, and 2019), and five severe drought events (1984, 2005/6, 2009/10, 2011/12, 2014/15). Some of the flood and drought events (e.g., event # 2, 5, 10, and 11) are categorized in different severity levels by different drought indices; they may be endorsed to differences in the data, category standards, time scales, and the computation technique of indices. The correlation between PDSI and WSDI (r2 = 0.72) is higher than other standardized indices, which is undoubtedly due to a series of water balance parameters included in PDSI computations. Furthermore, a strong correlation exhibits between WSD and PDSI, showing PDSI as a comprehensive drought index (i.e., deduced from meteorological and hydrological variables).
GRACE/GRACE-FO captured hydroclimatic extreme events accurately except for severity level variations among the solutions; the time series of WSDI show a similar fluctuations pattern between 2004 and 2012. Contrarily, the variation increases after 2013, likely misrepresent drought and flood events severity level. Overall, the GRACE/GRACE-FO based indices captured all major flood and drought events and agreed with standardized indices; hence, it may be an ideal substitute for scarce hydro-meteorological sites. Standardized indices rely on vast site observations awkward to implement. The proposed framework can serve as a useful tool for integrated flood and drought situation monitoring and better understand extreme hydroclimatic conditions in NRB and other similar climatic regions.
Author Contributions
Conceptualization, Z.M.N.; methodology, Z.M.N.; software, Z.M.N.; validation, A.M.M.; investigation, Z.M.N.; writing—original draft preparation, Z.M.N.; writing—review and editing, D.F., W.Y., A.M.M.; visualization, Z.M.N. and A.M.M.; supervision, D.F., W.Y.; project administration, W.Y.; funding acquisition, D.F., W.Y. All authors have read and agreed to the published version of the manuscript.
Funding
We express gratitude to the National Natural Science Foundation of China (grant number 41974013 and 41574018) for financial support.
Acknowledgments
The GRACE/GRACE-FO data used in this study are freely accessible from the Science Data Systems Centers’ websites. The GRACE data, as well as supporting documentation accessed from http://podaac.jpl.nasa.gov/grace (accessed on 31 December 2020), http://isdc.gfz-potsdam.de/grace (accessed on 31 December 2020), and http://www2.csr.utexas.edu/grace (accessed on 31 December 2020). TRMM data accessed from https://disc.gsfc.nasa.gov/data (accessed on 31 December 2020). Similarly, PDSI retrieved freely from https://crudata.uea.ac.uk/cru/data/drought/ (accessed on 31 December 2020) and SPEI from https://spei.csic.es/map/maps.html (accessed on 31 December 2020). The data used in this study are freely available from the abovementioned respective websites.
Conflicts of Interest
The authors declare no conflict of interest. The funders had no role in the design of the study; in the collection, analyses, or interpretation of data; in the writing of the manuscript, or in the decision to publish the results.
References
- Abtew, W.; Melesse, A.M. Climate Teleconnections, and Water Management. In Nile River Basin: Ecohydrological Challenges, Climate Change, and Hydropolitics; Melesse, A.M., Abtew, W., Setegn, S.G., Eds.; Springer International Publishing: Cham, Switzerland, 2014; pp. 685–705. ISBN 978-3-319-02720-3. [Google Scholar]
- Multsch, S.; Elshamy, M.E.; Batarseh, S.; Seid, A.H.; Frede, H.-G.; Breuer, L. Improving Irrigation Efficiency will be Insufficient to Meet Future Water Demand in the Nile Basin. J. Hydrol. Reg. Stud. 2017, 12, 315–330. [Google Scholar] [CrossRef]
- Ahmed, M.; Abdelmohsen, K. Quantifying Modern Recharge and Depletion Rates of the Nubian Aquifer in Egypt. Surv. Geophys. 2018, 39, 729–751. [Google Scholar] [CrossRef]
- Hasan, E.; Tarhule, A.; Kirstetter, P.-E.; Clark, R.; Hong, Y. Runoff Sensitivity to Climate Change in the Nile River Basin. J. Hydrol. 2018, 561, 312–321. [Google Scholar] [CrossRef]
- Siam, M.S.; Eltahir, E.A.B. Climate Change Enhances Interannual Variability of the Nile River Flow. Nat. Clim. Chang. 2017, 7, 350–354. [Google Scholar] [CrossRef]
- Mishra, A.K.; Singh, V.P. A Review of Drought Concepts. J. Hydrol. 2010, 391, 202–216. [Google Scholar] [CrossRef]
- Du, L.; Tian, Q.; Yu, T.; Meng, Q.; Jancso, T.; Udvardy, P.; Huang, Y. A Comprehensive Drought Monitoring Method Integrating MODIS and TRMM Data. Int. J. Appl. Earth Obs. Geoinf. 2013, 23, 245–253. [Google Scholar] [CrossRef]
- Sillmann, J.; Kharin, V.V.; Zwiers, F.W.; Zhang, X.; Bronaugh, D. Climate Extremes Indices in the CMIP5 Multimodel Ensemble: Part 2. Future Climate Projections. J. Geophys. Res. Atmos. 2013, 118, 2473–2493. [Google Scholar] [CrossRef]
- Sinha, D.; Syed, T.H.; Famiglietti, J.S.; Reager, J.T.; Thomas, R.C. Characterizing Drought in India Using GRACE Observations of Terrestrial Water Storage Deficit. J. Hydrometeorol. 2017, 18, 381–396. [Google Scholar] [CrossRef]
- Zhao, M.; Velicogna, I.; Kimball, J.S. A Global Gridded Dataset of GRACE Drought Severity Index for 2002–14: Comparison with PDSI and SPEI and a Case Study of the Australia Millennium Drought. J. Hydrometeorol. 2017, 18, 2117–2129. [Google Scholar] [CrossRef] [Green Version]
- McKee, T.B.; Doesken, N.J.; Kleist, J. The Relationship of Drought Frequency and Duration to Time Scales. In Proceedings of the Eighth Conference on Applied Climatology, American Meteorological Society, Anaheim, CA, USA, 17–22 January 1993; pp. 179–184. [Google Scholar]
- Wang, H.; Rogers, J.C.; Munroe, D.K. Commonly Used Drought Indices as Indicators of Soil Moisture in China. J. Hydrometeorol. 2015, 16, 1397–1408. [Google Scholar] [CrossRef]
- Vicente-Serrano, S.M.; Beguería, S.; López-Moreno, J.I. A Multiscalar Drought Index Sensitive to Global Warming: The Standardized Precipitation Evapotranspiration Index. J. Clim. 2010, 23, 1696–1718. [Google Scholar] [CrossRef] [Green Version]
- Palmer, W.C. Meteorological Droughts; 30 US Department of Commerce, Weather Bureau: Washington, DC, USA, 1965.
- Wells, N.; Goddard, S.; Hayes, M.J. A Self-Calibrating Palmer Drought Severity Index. J. Clim. 2004, 17, 2335–2351. [Google Scholar] [CrossRef]
- Hao, Z.; Aghakouchak, A. A Nonparametric Multivariate Multi-Index Drought Monitoring Framework. J. Hydrometeorol. 2014, 15, 89–101. [Google Scholar] [CrossRef]
- Landerer, F.W.; Flechtner, F.M.; Save, H.; Webb, F.H.; Bandikova, T.; Bertiger, W.I.; Bettadpur, S.V.; Byun, S.H.; Dahle, C.; Dobslaw, H.; et al. Extending the Global Mass Change Data Record: GRACE Follow-On Instrument and Science Data Performance. Geophys. Res. Lett. 2020, 47, e2020GL088306. [Google Scholar] [CrossRef]
- Kornfeld, R.P.; Arnold, B.W.; Gross, M.A.; Dahya, N.T.; Klipstein, W.M.; Gath, P.F.; Bettadpur, S. GRACE-FO: The Gravity Recovery and Climate Experiment Follow-On mission. J. Spacecr. Rocket. 2019, 56, 931–951. [Google Scholar] [CrossRef]
- Flechtner, F.; Neumayer, K.-H.; Dahle, C.; Dobslaw, H.; Fagiolini, E.; Raimondo, J.-C.; Güntner, A. What Can Be Expected from the GRACE-FO Laser Ranging Interferometer for Earth Science Applications? Surv. Geophys. 2016, 37, 453–470. [Google Scholar] [CrossRef] [Green Version]
- Nigatu, Z.M.; Fan, D.; You, W. GRACE Products and Land Surface Models for Estimating the Changes in Key Water Storage Components in the Nile River Basin. Adv. Space Res. 2021. [Google Scholar] [CrossRef]
- Landerer, F.W.; Swenson, S.C. Accuracy of Scaled GRACE Terrestrial Water Storage Estimates. Water Resour. Res. 2012, 48. [Google Scholar] [CrossRef]
- Scanlon, B.R.; Zhang, Z.; Save, H.; Wiese, D.N.; Landerer, F.W.; Long, D.; Longuevergne, L.; Chen, J. Global Evaluation of New GRACE Mascon Products for Hydrologic Applications. Water Resour. Res. 2016, 52, 9412–9429. [Google Scholar] [CrossRef]
- Wang, F.; Wang, Z.; Yang, H.; Di, D.; Zhao, Y.; Liang, Q. Utilizing GRACE-Based Groundwater Drought Index for Drought Characterization and Teleconnection Factors Analysis in the North China Plain. J. Hydrol. 2020, 585, 124849. [Google Scholar] [CrossRef]
- Save, H.; Bettadpur, S.; Tapley, B.D. High-Resolution CSR GRACE RL05 Mascons. J. Geophys. Res. Solid Earth 2016, 121, 7547–7569. [Google Scholar] [CrossRef]
- Thomas, A.C.; Reager, J.T.; Famiglietti, J.S.; Rodell, M. A GRACE-Based Water Storage Deficit Approach for Hydrological Drought Characterization. Geophys. Res. Lett. 2014, 41, 1537–1545. [Google Scholar] [CrossRef] [Green Version]
- Sinha, D.; Syed, T.H.; Reager, J.T. Utilizing Combined Deviations of Precipitation and GRACE-Based Terrestrial Water Storage as a Metric for Drought Characterization: A Case Study over Major Indian River Basins. J. Hydrol. 2019, 572, 294–307. [Google Scholar] [CrossRef]
- Sun, Z.; Zhu, X.; Pan, Y.; Zhang, J.; Liu, X. Drought Evaluation Using the GRACE Terrestrial Water Storage Deficit over the Yangtze River Basin, China. Sci. Total Environ. 2018, 634, 727–738. [Google Scholar] [CrossRef] [PubMed]
- Liu, X.; Feng, X.; Ciais, P.; Fu, B.; Hu, B.; Sun, Z. GRACE Satellite-Based Drought Index Indicating Increased Impact of Drought over Major Basins in China during 2002–2017. Agric. For. Meteorol. 2020, 291, 108057. [Google Scholar] [CrossRef]
- Li, B.; Rodell, M. Evaluation of a Model-Based Groundwater Drought Indicator in the Conterminous U.S. J. Hydrol. 2015, 526, 78–88. [Google Scholar] [CrossRef] [Green Version]
- Shamsudduha, M.; Taylor, R.G.; Jones, D.; Longuevergne, L.; Owor, M.; Tindimugaya, C. Recent Changes in Terrestrial Water Storage in the Upper Nile Basin: An Evaluation of Commonly Used Gridded GRACE Products. Hydrol. Earth Syst. Sci. 2017, 21, 4533–4549. [Google Scholar] [CrossRef] [Green Version]
- Melesse, A.M.; Loukas, A.G.; Senay, G.; Yitayew, M. Climate Change, Land-Cover Dynamics and Ecohydrology of the Nile River Basin. Hydrol. Process. 2009, 23, 3651–3652. [Google Scholar] [CrossRef]
- Setegn, S.G.; Srinivasan, R.; Dargahi, B.; Melesse, A.M. Spatial Delineation of Soil Erosion Vulnerability in the Lake Tana Basin, Ethiopia. Hydrol. Process. 2009, 23, 3738–3750. [Google Scholar] [CrossRef]
- Setegn, S.G.; Dargahi, B.; Srinivasan, R.; Melesse, A.M. Modeling of Sediment Yield From Anjeni-Gauged Watershed, Ethiopia Using SWAT Model1. JAWRA J. Am. Water Resour. Assoc. 2010, 46, 514–526. [Google Scholar] [CrossRef]
- Abtew, W.; Melesse, A.M.; Dessalegne, T. El Niño Southern Oscillation Link to the Blue Nile River Basin Hydrology. Hydrol. Process. 2009, 23, 3653–3660. [Google Scholar] [CrossRef]
- Melesse, A.; Abtew, W.; Dessalegne, T.; Wang, X. Low and High Flow Analyses and Wavelet Application for Characterization of the Blue Nile River System. Hydrol. Process. 2010, 24, 241–252. [Google Scholar] [CrossRef]
- Moges, S.A.; Taye, M.T. Regional Flood Frequency Curves for Remote Rural Areas of the Nile River Basin: The Case of Baro-Akobo Drainage Basin, Ethiopia. In Extreme Hydrology and Climate Variability: Monitoring, Modelling, Adaptation, and Mitigation; Melesse, A.M., Abtew, W., Senay, G.B., Eds.; Elsevier: Amsterdam, The Netherlands, 2019; pp. 385–393. ISBN 978-0-12-815998-9. [Google Scholar]
- Dessu, S.B.; Melesse, A.M. Modelling the Rainfall-Runoff Process of the Mara River Basin Using the Soil and Water Assessment Tool. Hydrol. Process. 2012, 26, 4038–4049. [Google Scholar] [CrossRef]
- Nigatu, Z.; Rientjes, T.; Haile, A. Hydrological Impact Assessment of Climate Change on Lake Tana’s Water Balance, Ethiopia. Am. J. Clim. Chang. 2016, 5, 27–37. [Google Scholar] [CrossRef] [Green Version]
- Melesse, A.M.; Abtew, W.; Setegn, S.G.; Dessalegne, T. Hydrological Variability and Climate of the Upper Blue Nile River Basin. In Nile River Basin: Hydrology, Climate, and Water Use; Melesse, A.M., Ed.; Springer: Dordrecht, The Netherlands, 2011; pp. 3–37. ISBN 978-94-007-0689-7. [Google Scholar]
- Mamo, S.; Berhanu, B.; Melesse, A.M. Historical Flood Events and Hydrological Extremes in Ethiopia. In Extreme Hydrology and Climate Variability: Monitoring, Modelling, Adaptation, and Mitigation; Melesse, A.M., Abtew, W., Senay, G., Eds.; Elsevier: Amsterdam, The Netherlands, 2019; pp. 379–384. ISBN 978-0-12-815998-9. [Google Scholar]
- Dessu, S.B.; Melesse, A.M. Impact and Uncertainties of Climate Change on the Hydrology of the Mara River Basin, Kenya/Tanzania. Hydrol. Process. 2013, 27, 2973–2986. [Google Scholar] [CrossRef]
- Chebud, Y.; Melesse, A. Stage Level, Volume and Time-Frequency Information Content of Lake Tana Using Stochastic and Wavelet Analysis Methods. Hydrol. Process. 2013, 27, 1475–1483. [Google Scholar] [CrossRef]
- Setegn, S.G.; Srinivasan, R.; Melesse, A.M.; Dargahi, B. SWAT Model Application and Prediction Uncertainty Analysis in the Lake Tana Basin, Ethiopia. Hydrol. Process. 2010, 24, 357–367. [Google Scholar] [CrossRef]
- Chebud, Y.A.; Melesse, A.M. Modelling Lake Stage and Water Balance of Lake Tana, Ethiopia. Hydrol. Process. 2009, 23, 3534–3544. [Google Scholar] [CrossRef]
- Yitayew, M.; Melesse, A.M. Critical Water Resources Issues in the Nile River Basin. In Nile River Basin: Hydrology, Climate, and Water Use; Melesse, A.M., Ed.; Springer: Dordrecht, The Netherlands, 2011; pp. 401–416. ISBN 978-94-007-0689-7. [Google Scholar]
- Abtew, W.; Melesse, A.M. Transboundary Rivers and the Nile. In Nile River Basin: Ecohydrological Challenges, Climate Change, and Hydropolitics; Melesse, A.M., Abtew, W., Setegn, S.G., Eds.; Springer International Publishing: Cham, Switzerland, 2014; pp. 565–579. ISBN 978-3-319-02720-3. [Google Scholar]
- Dessu, S.B.; Melesse, A.M.; Bhat, M.G.; McClain, M.E. Assessment of Water Resources Availability and Demand in the Mara River Basin. Catena 2014, 115, 104–114. [Google Scholar] [CrossRef]
- Chebud, Y.A.; Melesse, A.M. Numerical Modeling of the Groundwater Flow System of the Gumera Sub-Basin in Lake Tana Basin, Ethiopia. Hydrol. Process. 2009, 23, 3694–3704. [Google Scholar] [CrossRef]
- Abtew, W.; Melesse, A.M. The Nile River Basin. In Nile River Basin: Ecohydrological Challenges, Climate Change, and Hydropolitics; Melesse, A.M., Abtew, W., Setegn, S.G., Eds.; Springer International Publishing: Cham, Switzerland, 2014; pp. 7–21. ISBN 978-3-319-02720-3. [Google Scholar]
- Save, H. CSR GRACE and GRACE-FO RL06 Mascon Solutions v02. Available online: http://www2.csr.utexas.edu/grace/RL06_mascons.html (accessed on 20 September 2020).
- Boergens, E.; Dobslaw, H.; Dill, R.; Thomas, M.; Dahle, C.; Murböck, M.; Flechtner, F. Modelling Spatial Covariances for Terrestrial Water Storage Variations Verified with Synthetic GRACE-FO Data. GEM Int. J. Geomath. 2020, 11, 24. [Google Scholar] [CrossRef]
- Sakumura, C.; Bettadpur, S.; Bruinsma, S. Ensemble Prediction and Intercomparison Analysis of GRACE Time-Variable Gravity Field Models. Geophys. Res. Lett. 2014, 41, 1389–1397. [Google Scholar] [CrossRef]
- Tamaddun, K.A.; Kalra, A.; Kumar, S.; Ahmad, S. CMIP5 Models’ Ability to Capture Observed Trends under the Influence of Shifts and Persistence: An In-Depth Study on the Colorado River Basin. J. Appl. Meteorol. Climatol. 2019, 58, 1677–1688. [Google Scholar] [CrossRef]
- Spennemann, P.C.; Rivera, J.A.; Saulo, A.C.; Penalba, O.C. A Comparison of GLDAS Soil Moisture Anomalies against Standardized Precipitation Index and Multisatellite Estimations over South America. J. Hydrometeorol. 2015, 16, 158–171. [Google Scholar] [CrossRef]
- Li, M.; Wu, P.; Ma, Z. A Comprehensive Evaluation of Soil Moisture and Soil Temperature from Third-Generation Atmospheric and Land Reanalysis Data Sets. Int. J. Climatol. 2020, 40, 5744–5766. [Google Scholar] [CrossRef]
- Muñoz Sabater, J. ERA5-Land Monthly Averaged Data from 1981 to Present. Available online: https://confluence.ecmwf.int/display/CKB/ERA5-Land (accessed on 1 September 2020).
- Stoffelen, A. Toward the True Near-Surface Wind Speed: Error Modeling and Calibration Using Triple Collocation. J. Geophys. Res. Ocean. 1998, 103, 7755–7766. [Google Scholar] [CrossRef]
- Gruber, A.; Dorigo, W.A.; Crow, W.; Wagner, W. Triple Collocation-Based Merging of Satellite Soil Moisture Retrievals. IEEE Trans. Geosci. Remote Sens. 2017, 55, 6780–6792. [Google Scholar] [CrossRef]
- Yilmaz, M.T.; Crow, W.T.; Ryu, D. Impact of Model Relative Accuracy in Framework of Rescaling Observations in Hydrological Data Assimilation Studies. J. Hydrometeorol. 2016, 17, 2245–2257. [Google Scholar] [CrossRef]
- Bonsor, H.; Shamsudduha, M.; Marchant, B.; MacDonald, A.; Taylor, R. Seasonal and Decadal Groundwater Changes in African Sedimentary Aquifers Estimated Using GRACE Products and LSMs. Remote Sens. 2018, 10, 904. [Google Scholar] [CrossRef] [Green Version]
- Hafen, R. stlplus: Enhanced Seasonal Decomposition of Time Series by Loess. 2016. Available online: https://rdrr.io/cran/stlplus/ (accessed on 15 September 2019).
- Cleveland, R.B.; Cleveland, W.S.; McRae, J.E.; Terpenning, I. STL: A Seasonal-Trend Decomposition. J. Off. Stat. 1990, 6, 3–73. [Google Scholar]
- Humphrey, V.; Gudmundsson, L.; Seneviratne, S.I. Assessing Global Water Storage Variability from GRACE: Trends, Seasonal Cycle, Subseasonal Anomalies and Extremes. Surv. Geophys. 2016, 37, 357–395. [Google Scholar] [CrossRef] [PubMed] [Green Version]
- Lu, H.; Raupach, M.R.; McVicar, T.R.; Barrett, D.J. Decomposition of Vegetation Cover into Woody and Herbaceous Components Using AVHRR NDVI Time Series. Remote Sens. Environ. 2003, 86, 1–18. [Google Scholar] [CrossRef]
- Thomas, B.F.; Famiglietti, J.S.; Landerer, F.W.; Wiese, D.N.; Molotch, N.P.; Argus, D.F. GRACE Groundwater Drought Index: Evaluation of California Central Valley Groundwater Drought. Remote Sens. Environ. 2017, 198, 384–392. [Google Scholar] [CrossRef]
- AghaKouchak, A. A Multivariate Approach for Persistence-Based Drought Prediction: Application to the 2010–2011 East Africa Drought. J. Hydrol. 2015, 526, 127–135. [Google Scholar] [CrossRef]
- Hao, Z.; AghaKouchak, A. Multivariate Standardized Drought Index: A Parametric Multi-Index Model. Adv. Water Resour. 2013, 57, 12–18. [Google Scholar] [CrossRef] [Green Version]
- Farahmand, A.; AghaKouchak, A. A Generalized Framework for Deriving Nonparametric Standardized Drought Indicators. Adv. Water Resour. 2015, 76, 140–145. [Google Scholar] [CrossRef]
- Svoboda, M.; LeComte, D.; Hayes, M.; Heim, R.; Gleason, K.; Angel, J.; Rippey, B.; Tinker, R.; Palecki, M.; Stooksbury, D.; et al. The Drought Monitor. Bull. Am. Meteorol. Soc. 2002, 83, 1181–1190. [Google Scholar] [CrossRef] [Green Version]
- Mika, J.; Horváth, S.; Makra, L.; Dunkel, Z. The Palmer Drought Severity Index (PDSI) as an Indicator of Soil Moisture. Phys. Chem. Earth, Parts A/B/C 2005, 30, 223–230. [Google Scholar] [CrossRef]
- Joshi, M.K.; Pandey, A.C. Trend and Spectral Analysis of Rainfall over India during 1901–2000. J. Geophys. Res. Atmos. 2011, 116, D06104. [Google Scholar] [CrossRef]
- Mohorji, A.M.; Şen, Z.; Almazroui, M. Trend Analyses Revision, and Global Monthly Temperature Innovative Multi-Duration Analysis. Earth Syst. Environ. 2017, 1, 9. [Google Scholar] [CrossRef] [Green Version]
- Sheffield, J.; Wood, E.F. Global Trends and Variability in Soil Moisture and Drought Characteristics, 1950–2000, from Observation-Driven Simulations of the Terrestrial Hydrologic Cycle. J. Clim. 2008, 21, 432–458. [Google Scholar] [CrossRef] [Green Version]
- Vanderkelen, I.; van Lipzig, N.P.M.; Thiery, W. Modelling the Water Balance of Lake Victoria (East Africa)—Part 1: Observational Analysis. Hydrol. Earth Syst. Sci. 2018, 22, 5509–5525. [Google Scholar] [CrossRef] [Green Version]
- Awange, J.L.; Sharifi, M.A.; Ogonda, G.; Wickert, J.; Grafarend, E.W.; Omulo, M.A. The Falling Lake Victoria Water Level: GRACE, TRIMM, and CHAMP Satellite Analysis of the Lake Basin. Water Resour. Manag. 2008, 22, 775–796. [Google Scholar] [CrossRef]
- Richey, A.S.; Thomas, B.F.; Lo, M.-H.; Reager, J.T.; Famiglietti, J.S.; Voss, K.; Swenson, S.; Rodell, M. Quantifying Renewable Groundwater Stress with GRACE. Water Resour. Res. 2015, 51, 5217–5238. [Google Scholar] [CrossRef] [PubMed]
- Wada, Y.; van Beek, L.P.H.; Wanders, N.; Bierkens, M.F.P. Human Water Consumption Intensifies Hydrological Drought Worldwide. Environ. Res. Lett. 2013, 8, 34036. [Google Scholar] [CrossRef] [Green Version]
- Owor, M.; Taylor, R.; Mukwaya, C.; Tindimugaya, C. Groundwater/Surface-Water Interactions on Deeply Weathered Surfaces of Low Relief: Evidence from Lakes Victoria and Kyoga, Uganda. Hydrogeol. J. 2011, 19, 1403–1420. [Google Scholar] [CrossRef]
- Awange, J.L.; Forootan, E.; Kuhn, M.; Kusche, J.; Heck, B. Water Storage Changes and Climate Variability within the Nile Basin between 2002 and 2011. Adv. Water Resour. 2014, 73, 1–15. [Google Scholar] [CrossRef] [Green Version]
- Lott, F.C.; Christidis, N.; Stott, P.A. Can the 2011 East African Drought Be Attributed to Human-Induced Climate Change? Geophys. Res. Lett. 2013, 40, 1177–1181. [Google Scholar] [CrossRef]
- Rowell, D.P.; Booth, B.B.B.; Nicholson, S.E.; Good, P. Reconciling Past and Future Rainfall Trends over East Africa. J. Clim. 2015, 28, 9768–9788. [Google Scholar] [CrossRef]
- Van Loon, A.F.; Stahl, K.; Di Baldassarre, G.; Clark, J.; Rangecroft, S.; Wanders, N.; Gleeson, T.; Van Dijk, A.I.J.M.; Tallaksen, L.M.; Hannaford, J.; et al. Drought in a Human-Modified World: Reframing Drought Definitions, Understanding, and Analysis Approaches. Hydrol. Earth Syst. Sci. 2016, 20, 3631–3650. [Google Scholar] [CrossRef] [Green Version]
- Van Loon, A.F. Hydrological Drought Explained. WIREs Water 2015, 2, 359–392. [Google Scholar] [CrossRef]
- van der Schrier, G.; Barichivich, J.; Briffa, K.R.; Jones, P.D. A ScPDSI-Based Global Data Set of Dry and Wet Spells for 1901–2009. J. Geophys. Res. Atmos. 2013, 118, 4025–4048. [Google Scholar] [CrossRef]
- FAO. The State of Food Security and Nutrition in the World. Building Resilience for Peace and Food Security; FAO: Rome, Italy, 2017. Available online: http://www.fao.org/publications/sofi/2020/en/ (accessed on 10 September 2020).
- Nicholson, S.E. Climate and Climatic Variability of Rainfall over Eastern Africa. Rev. Geophys. 2017, 55, 590–635. [Google Scholar] [CrossRef] [Green Version]
- EM-DAT. The Emergency Events Database; EM-DAT: Brussels, Belgium, 2020; Available online: https://emdat.be (accessed on 10 September 2020).
- Viste, E.; Korecha, D.; Sorteberg, A. Recent Drought and Precipitation Tendencies in Ethiopia. Theor. Appl. Climatol. 2013, 112, 535–551. [Google Scholar] [CrossRef] [Green Version]
- NBI. Reducing Flood Devastation in the Nile Basin; Nile Basin Initiative: Entebbe, Uganda, 2019.
- Osima, S.; Indasi, V.S.; Zaroug, M.; Endris, H.S.; Gudoshava, M.; Misiani, H.O.; Nimusiima, A.; Anyah, R.O.; Otieno, G.; Ogwang, B.A.; et al. Projected Climate over the Greater Horn of Africa under 1.5 °C and 2 °C Global Warming. Environ. Res. Lett. 2018, 13, 065004. [Google Scholar] [CrossRef]
- Touma, D.; Ashfaq, M.; Nayak, M.A.; Kao, S.-C.; Diffenbaugh, N.S. A Multi-Model and Multi-Index Evaluation of Drought Characteristics in the 21st Century. J. Hydrol. 2015, 526, 196–207. [Google Scholar] [CrossRef] [Green Version]
- Longuevergne, L.; Wilson, C.R.; Scanlon, B.R.; Crétaux, J.F. GRACE Water Storage Estimates for the Middle East and Other Regions with Significant Reservoir and Lake Storage. Hydrol. Earth Syst. Sci. 2013, 17, 4817–4830. [Google Scholar] [CrossRef] [Green Version]
- Wang, P.; Pozdniakov, S.P. A Statistical Approach to Estimating Evapotranspiration from Diurnal Groundwater Level Fluctuations. Water Resour. Res. 2014, 50, 2276–2292. [Google Scholar] [CrossRef]
- Emerton, R.E.; Stephens, E.M.; Pappenberger, F.; Pagano, T.C.; Weerts, A.H.; Wood, A.W.; Salamon, P.; Brown, J.D.; Hjerdt, N.; Donnelly, C.; et al. Continental, and Global Scale Flood Forecasting Systems. WIREs Water 2016, 3, 391–418. [Google Scholar] [CrossRef] [Green Version]
- Scanlon, B.R.; Longuevergne, L.; Long, D. Ground Referencing GRACE Satellite Estimates of Groundwater Storage Changes in the California Central Valley, USA. Water Resour. Res. 2012, 48, 1–9. [Google Scholar] [CrossRef] [Green Version]
Figure 1.
Nile River Basin (NRB) countries, elevation variations, lakes, and rivers.

Figure 2.
General methodology of hydroclimatic extreme event evaluation in the NRB.

Figure 3.
Multidecadal Temperature (Temp) and Rainfall (RF) of NRB; the broken line represents monthly Temp and RF while the solid lines denote a 5-year moving average (Temp and RF).
Figure 3.
Multidecadal Temperature (Temp) and Rainfall (RF) of NRB; the broken line represents monthly Temp and RF while the solid lines denote a 5-year moving average (Temp and RF).

Figure 4.
NRB major drought periods in 1985/1996, 2005/2006, 2010/2011, and 2014/2015 during the four seasons of the respective year and flood years based on Palmer Drought Severity Index (PDSI). The blue color represents water bodies; the grey one is a desert area, and grey lines denote NRB countries. The four severity levels are denoted by different degrees: red for drought and green for wetness.

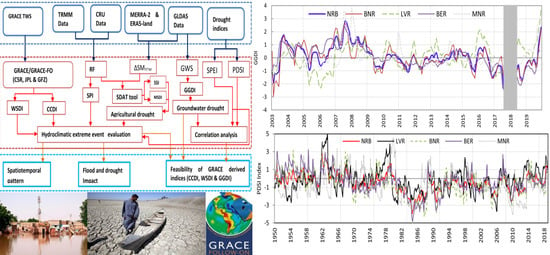
Figure 5.
Wetness and drought indices over NRB basin and its sub-basins:12-month Standardized Precipitation Evapotranspiration Index (SPEI) (a) and monthly PDSI (b), and 12-month (1983–2019) Standardized Precipitation Index (SPI), Standardized Soil Moisture Index (SSI), MSDIp, MSDIe (c).
Figure 5.
Wetness and drought indices over NRB basin and its sub-basins:12-month Standardized Precipitation Evapotranspiration Index (SPEI) (a) and monthly PDSI (b), and 12-month (1983–2019) Standardized Precipitation Index (SPI), Standardized Soil Moisture Index (SSI), MSDIp, MSDIe (c).

Figure 6.
Time series of GRACE derived indices (a) water storage deficit (WSD), (b) Combined Climate drought index, (c) cumulative WSD for the NRB, and (d) Groundwater drought index (GGDI) from 2003 to 2019. “CSR, JPL, and GFZ” represents GRACE/GRACE-FO products, while “Ens” represents the arithmetic mean of the three GRACE/GRACE-FO products. The gray shaded period shows missing data between the GRACE and GRACE-FO mission (i.e., July 2017 to May 2018).


Table 1.
Summary of the dataset employed in this study.
| Categories | Data/Model | Time | Spatial Resolutions | Data Sources (Accessed on 31 December 2020) |
|---|---|---|---|---|
| GRACE/GRACE-FO TWS | CSR (RL06) | 2003–2019 | 0.5° × 0.5° | http://www2.csr.utexas.edu/grace |
| JPL (RL06) | 2003–2019 | 0.5° × 0.5° | http://podaac.jpl.nasa.gov/grace | |
| GFZ (RL06) | 2003–2019 | 1° × 1° | http://isdc.gfz-potsdam.de/grace | |
| Soil moisture | GLDAS-NOAH (M2.0 and 2.1) MERRA-2 ERA5-Land | 1950–2019 1980–2019 1981–2019 | 1° × 1° 0.5° × 0.625° 0.1° × 0.1° | https://disc.gsfc.nasa.gov/datasets?keywords=GLDAS https://disc.gsfc.nasa.gov/datasets?keywords=MERRA-2 https://cds.climate.copernicus.eu/#!/search?ERA5-land |
| Rainfall | TRMM | 2003–2014 | 0.25° × 0.25° | https://pmm.nasa.gov/dataaccess/trmm |
| CRU TS4.00 | 1901–2019 | 0.5° × 0.5° | https://climatedataguide.ucar.edu/climate-data/prec | |
| Temperature | CRU TS4.00 | 1901–2019 | 0.5° × 0.5° | https://climatedataguide.ucar.edu/climate-data/temp |
| Drought data | SPEI | 1950–2019 | 0.5° × 0.5° | https://spei.csic.es/map/maps.html |
| scPDSI | 1901–2018 | 0.5° × 0.5° | https://crudata.uea.ac.uk/cru/data/drought/ |
Table 2.
Grouping scales of hydroclimatic extreme event severity using selected indices.
| Severity Level | Drought Severity Category | SSI/SPI/SPEI | PDSI | WSDI | CCDI | GGDI |
|---|---|---|---|---|---|---|
| W4 | Extreme wet | (∞, 2.5] | (∞, 4] | (∞, 2.0] | (∞, 1.45] | (∞, 2] |
| W3 | Severe wet | [2.5, 2] | [3.99, 3] | [1.5, 2.0] | [1.44, 0.94] | [2, 1.5] |
| W2 | Moderate wet | [2, 1.5] | [2.99, 2] | [1.0, 1.5] | [0.93, 0.46] | [1.5, 1] |
| W1 | Mild wet | [1.5, 1] | [1.99, 1] | [0.5, 1.0] | [0.45, 0.28] | [1, 0.5] |
| No | Normal | [1, −1] | [1, −1] | [1.0, −1.0] | [0.28, −0.44] | [0.5, −0.5] |
| D1 | Mild drought | [−1, −0.5] | [−1.99,−1] | [−1, 0] | [−0.45,−0.28] | [−1, −0.5] |
| D2 | Moderate drought | [−1, −1.5] | [−2.99,−2] | [−2, −1] | [−0.93, −0.46] | [−1.5, −1] |
| D3 | Severe drought | [−1.5, −2] | [−3.99,−3] | [−3, −2] | [−1.44, −0.94] | [−2, −1.5] |
| D4 | Extreme drought | [−2, −∞) | (−∞,−4] | [−3, −∞) | [−1.45, −∞) | [−2, −∞) |
Table 3.
Correlation coefficient among indices (2003–2018).
| NRB | CCDI | GGDI | WSDI | SPI | SSI | MSDIe | MSDIp | SPEI | PDSI |
|---|---|---|---|---|---|---|---|---|---|
| CCDI | 1 | ||||||||
| GGDI | − | 1 | |||||||
| WSDI | 0.53 | 0.56 | 1 | ||||||
| SPI | 0.50 | 0.70 | 0.67 | 1 | |||||
| SSI | − | 0.74 | 0.66 | 0.81 | 1 | ||||
| MSDIe | − | 0.73 | 0.69 | 0.92 | 0.97 | 1 | |||
| MSDIp | − | 0.73 | 0.69 | 0.94 | 0.96 | 0.99 | 1 | ||
| SPEI | 0.50 | 0.72 | 0.51 | 0.91 | 0.72 | 0.82 | 0.83 | 1 | |
| PDSI | 0.51 | 0.54 | 0.71 | 0.84 | 0.74 | 0.81 | 0.84 | 0.67 | 1 |
“−” denotes the 95% non-significant level between the CCDI and GGDI, SSI, MSDIe, and MSDIp.
Table 4.
Flood and Drought severity category based on extreme event indices.
| Event # | Time Period/Category | CCDI | WSDI | GGDI | SPEI | SSI | SPI | MSDI (e and p) | PDSI | Range |
|---|---|---|---|---|---|---|---|---|---|---|
| 1 | 11/2006–02/2007 | +1.76 (W4) | +1.20 (W2) | +2.79 (W4) | +0.91 (W1) | +2.25 (W3) | +2.25 (W3) | +2.25 (W3) | +1.90 (W1) | W2/W4 |
| 2 | 09/2012–01/2013 | +1.72 (W4) | +1.27 (W2) | +0.15 (No) | +0.35 (No) | +0.27 (No) | +1.30 (W1) | +0.27 (No) | +0.85 (No) | No/W4 |
| 3 | 11/2015–06/2015 | +1.72 (W4) | +0.71 (W1) | +0.82 (W1) | +0.96 (W1) | +0.45 (No) | +0.82 (W1) | +0.49 (No) | +1.86 (W1) | No/W4 |
| 4 | 09/2019–12/2019 | +1.92 (W4) | +2.79 (W4) | +0.94 (W1) | +1.68 (W2) | −2.15 (D4) | +2.15 (W4) | −2.12 (D4) | +2.65 (W2) | W2/W4 |
| 5 | 01/2003–05/2003 | −0.85 (D2) | −1.17 (D1) | −1.92 (D3) | −1.16 (D2) | −0.22 (No) | −0.51 (D1) | −0.95 (D1) | −1.75 (D1) | No/D3 |
| 6 | 02/2004–03/2007 | −2.54 (D4) | −2.89 (D3) | −0.94 (D1) | −1.25 (D2) | −0.51 (D1) | −0.85 (D1) | −1.45 (D2) | −1.15 (D1) | D1/D4 |
| 7 | 07/2009–12/2009 | −0.89 (D2) | −0.63 (D2) | −0.82 (D1) | −1.61 (D3) | −1.12 (D2) | −1.32 (D2) | −2.12 (D4) | −2.52 (D2) | D1/D4 |
| 8 | 04/2010–09/2011 | −1.76 (D4) | −1.61 (D2) | −1.08 (D2) | −1.67 (D3) | −1.10 (D2) | −1.02 (D2) | −1.53 (D3) | −2.56 (D2) | D2/D4 |
| 9 | 12/2014–11/2015 | −1.13 (D3) | −1.43 (D2) | −1.05 (D2) | −1.23 (D2) | −2.25 (D4) | −0.75 (D1) | −2.25 (D4) | −3.25 (D3) | D1/D4 |
| 10 | 09/2016–01/2017 | −2.08 (D4) | −1.55 (D2) | −1.52 (D3) | −0.95 (D1) | −1.51 (D3) | −0.49 (No) | −1.75 (D3) | −2.35 (D2) | No/D4 |
| 11 | 11/2018–03/2019 | −0.68 (D2) | −0.53 (D1) | −1.69 (D3) | −1.07 (D2) | −2.15 (D4) | −0.28 (No) | −2.24 (D4) | −2.85 (D2) | No/D4 |
“Event #” denotes event number, and “Range” is based on Table 2.
Table 5.
Summary of standardized indices (1950–2019) and GRACE/GRACE-FO (2003–2019) identified hydroclimatic extreme events and impacts (verified with EMD-DAT database).
Table 5.
Summary of standardized indices (1950–2019) and GRACE/GRACE-FO (2003–2019) identified hydroclimatic extreme events and impacts (verified with EMD-DAT database).
| S.N | Time Period | NRB-Affected Countries | Duration (No of Months) | Deficit/Surplus Peak (PDSI * and WSDI ** in Cm) and Date | Severity Level | # Affected People |
|---|---|---|---|---|---|---|
| Flood | ||||||
| 1 | 1962 | KEN | 18 | +4.1 (09/1964) | Extreme | 15,000 |
| 2 | 1978/1979 | SDN, EGY, ETH | 11 | +3.6 (12/1978) | Severe | 167,000 |
| 3 | 1988 | SDN, RWA, ETH | 12 | +2.2 (06/1988) | Moderate | 2,568,918 |
| 4 | 1998/1999 | SDN, KEN, ETH | 6 | +2.4 (10/1999) | Moderate | 1,421,041 |
| 5 | 2007 | SDN, ETH, KEN, RWA | 6 | +2.2 (04/2007) | Severe | 857,872 |
| 6 | 2012/2013 | SSD, SDN, ETH, KEN, RWA | 11 | +1.1 (06/2012) | Moderate | 1,832,398 |
| 7 | 2015/2016 | SSD, SDN, ETH, KEN, RWA | 5 | +1.7 (08/2015) | Severe | 974,814 |
| 8 | 2019 | SSD, SDN, ETH, KEN, RWA | 3 | +2.2 (01/2019) | Severe | 1,726,595 |
| Drought | ||||||
| 9 | 1983–1984 | TZA, RWA, ETH, KEN, SDN | 8 | −4.3 (05/1984) | Extreme | 19,070,000 |
| 10 | 1987/1988 | TZA, UGA, ETH, RWA, SDN | 11 | −3.8 (04/1987) | Severe | 11,160,000 |
| 11 | 1997/1999 | TZA, UGA, ETH, RWA, KEN | 28 | −2.9 (09/1998) | Moderate | 23,000,000 |
| 12 | 12/2002–5/2003 | TZA, UGA, ETH, RWA | 6 | −1.2 (04/2005) | Slight | 12,600,000 |
| 13 | 01/2004–06/2005 | SSD, KEN, ETH, UGA | 18 | −2.8 (02/2006) | Severe | 12,954,000 |
| 14 | 01/2007–05/2007 | Widespread | 5 | −0.6 (02/2010) | Moderate | No data |
| 15 | 1/2009–06/2011 | SSD, KEN, ETH, UGA | 24 | −1.6 (02/2011) | Moderate | 20,274,679 |
| 16 | 11/2011–05/2012 | SDN, KEN, ETH, TZA | 6 | −1.4 (04/2012) | Moderate | 8,950,000 |
| 17 | 2014–2015 | SDN, KEN, ETH | 7 | −1.4 (10/2015) | Moderate | 12,600,000 |
| 18 | 2/2018–5/2018 | Widespread | 4 | −1.1 (04/2018) | Slight | No data |
“PDSI *” indicates deficit/surplus values during 1950–2002, while “WSDI **” for 2003–2019. (NRB affected countries: KEN = Kenya, SSD = South Sudan, SDN = Sudan, ETH = Ethiopia, RWA = Rwanda, EGY = Egypt, UGA = Uganda, TZA = United Republic of Tanzania).
Publisher’s Note: MDPI stays neutral with regard to jurisdictional claims in published maps and institutional affiliations. |
© 2021 by the authors. Licensee MDPI, Basel, Switzerland. This article is an open access article distributed under the terms and conditions of the Creative Commons Attribution (CC BY) license (http://creativecommons.org/licenses/by/4.0/).
Share and Cite
MDPI and ACS Style
Nigatu, Z.M.; Fan, D.; You, W.; Melesse, A.M. Hydroclimatic Extremes Evaluation Using GRACE/GRACE-FO and Multidecadal Climatic Variables over the Nile River Basin. Remote Sens. 2021, 13, 651. https://doi.org/10.3390/rs13040651
AMA Style
Nigatu ZM, Fan D, You W, Melesse AM. Hydroclimatic Extremes Evaluation Using GRACE/GRACE-FO and Multidecadal Climatic Variables over the Nile River Basin. Remote Sensing. 2021; 13(4):651. https://doi.org/10.3390/rs13040651
Chicago/Turabian StyleNigatu, Zemede M., Dongming Fan, Wei You, and Assefa M. Melesse. 2021. "Hydroclimatic Extremes Evaluation Using GRACE/GRACE-FO and Multidecadal Climatic Variables over the Nile River Basin" Remote Sensing 13, no. 4: 651. https://doi.org/10.3390/rs13040651
Note that from the first issue of 2016, this journal uses article numbers instead of page numbers. See further details here.